Embed Size (px)
Citation preview
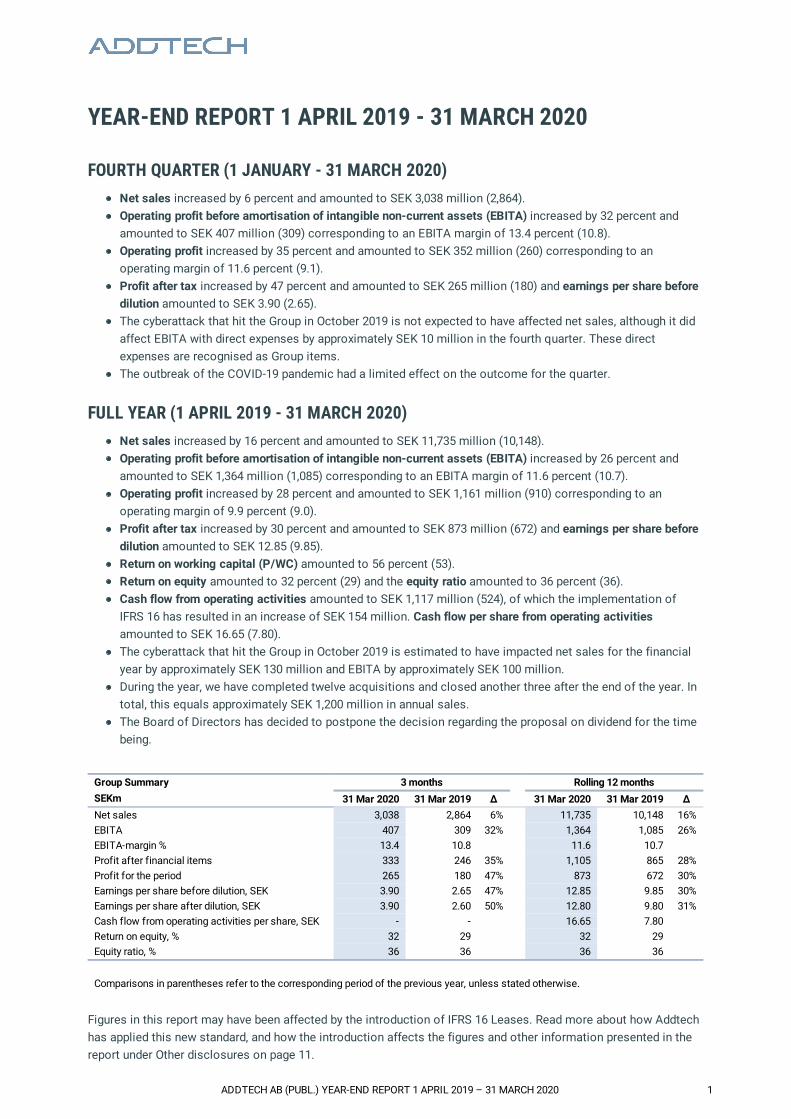
YEAR-END REPORT 1 APRIL 2019 - 31 MARCH 2020
FOURTH QUARTER (1 JANUARY - 31 MARCH 2020)Net sales increased by 6 percent and amounted to SEK 3,038 million (2,864).Operating profit before amortisation of intangible non-current assets (EBITA) increased by 32 percent andamounted to SEK 407 million (309) corresponding to an EBITA margin of 13.4 percent (10.8).Operating profit increased by 35 percent and amounted to SEK 352 million (260) corresponding to anoperating margin of 11.6 percent (9.1).Profit after tax increased by 47 percent and amounted to SEK 265 million (180) and earnings per share beforedilution amounted to SEK 3.90 (2.65).The cyberattack that hit the Group in October 2019 is not expected to have affected net sales, although it didaffect EBITA with direct expenses by approximately SEK 10 million in the fourth quarter. These directexpenses are recognised as Group items.The outbreak of the COVID-19 pandemic had a limited effect on the outcome for the quarter.
FULL YEAR (1 APRIL 2019 - 31 MARCH 2020)Net sales increased by 16 percent and amounted to SEK 11,735 million (10,148).Operating profit before amortisation of intangible non-current assets (EBITA) increased by 26 percent andamounted to SEK 1,364 million (1,085) corresponding to an EBITA margin of 11.6 percent (10.7).Operating profit increased by 28 percent and amounted to SEK 1,161 million (910) corresponding to anoperating margin of 9.9 percent (9.0).Profit after tax increased by 30 percent and amounted to SEK 873 million (672) and earnings per share beforedilution amounted to SEK 12.85 (9.85).Return on working capital (P/WC) amounted to 56 percent (53).Return on equity amounted to 32 percent (29) and the equity ratio amounted to 36 percent (36).Cash flow from operating activities amounted to SEK 1,117 million (524), of which the implementation ofIFRS 16 has resulted in an increase of SEK 154 million. Cash flow per share from operating activitiesamounted to SEK 16.65 (7.80).The cyberattack that hit the Group in October 2019 is estimated to have impacted net sales for the financialyear by approximately SEK 130 million and EBITA by approximately SEK 100 million.During the year, we have completed twelve acquisitions and closed another three after the end of the year. Intotal, this equals approximately SEK 1,200 million in annual sales.The Board of Directors has decided to postpone the decision regarding the proposal on dividend for the timebeing.
Group Summary 3 months Rolling 12 monthsSEKm 31 Mar 2020 31 Mar 2019 ∆ 31 Mar 2020 31 Mar 2019 ∆Net sales 3,038 2,864 6% 11,735 10,148 16%EBITA 407 309 32% 1,364 1,085 26%EBITA-margin % 13.4 10.8 11.6 10.7 Profit after financial items 333 246 35% 1,105 865 28%Profit for the period 265 180 47% 873 672 30%Earnings per share before dilution, SEK 3.90 2.65 47% 12.85 9.85 30%Earnings per share after dilution, SEK 3.90 2.60 50% 12.80 9.80 31%Cash flow from operating activities per share, SEK - - 16.65 7.80 Return on equity, % 32 29 32 29 Equity ratio, % 36 36 36 36 Comparisons in parentheses refer to the corresponding period of the previous year, unless stated otherwise.
Figures in this report may have been affected by the introduction of IFRS 16 Leases. Read more about how Addtechhas applied this new standard, and how the introduction affects the figures and other information presented in thereport under Other disclosures on page 11.
ADDTECH AB (PUBL.) YEAR-END REPORT 1 APRIL 2019 – 31 MARCH 2020 1
CEO´S COMMENTSWe conclude the 2019/2020 financial year as highly successful. Despite the cautious mood of the market, anextensive cyberattack in the third quarter and the end of the financial year being pervaded in many ways by theoutbreak of the COVID-19 pandemic, we delivered strong profitable growth, both organically and throughacquisitions of several new companies in different technical niches.
FOURTH QUARTER – A STRONG FINALE IN TROUBLED TIMESThe outbreak of the COVID-19 pandemic had a limited effect on the outcome for the quarter. Sales increased by6 percent, of which organic sales decreased by almost 1 percent, compared with the very strong organic growth ofthe preceding financial year. We achieved a 32-percent growth in profit and the EBITA margin improved to13.4 percent (10.8). All business areas contributed to the growth in profit. Non-recurring effects and revaluations ofcontingent purchase considerations had a positive impact on earnings totalling approximately SEK 50 million.Thanks to the amazing efforts of our employees and the strong support of our customers, the financial effects ofthe cyberattack were not as extensive as previously feared. We experienced no negative impact on sales and directexpenses amounted to about only SEK 10 million in the fourth quarter.
FULL-YEAR – CHALLENGING BUT PROVING THE STRENGTH OF OUR BUSINESS MODELGiven the year’s challenges, we can be particularly satisfied with exceeding our own ambitious targets for the year. Icannot express adequately how immensely impressed I am by all of our employees. Again my warmest gratitudefor your invaluable efforts during the year!
Sales increased by 16 percent, distributed evenly between organic and acquired growth. We continued to deliverprofitable growth, where margin improvements in organic sales contributing in particular to an increase in totaloperating profit by 28 percent and a record-high EBITA margin of 11.6 percent (10.7). All business areas contributedto growth in sales and earnings, with Industrial Process at the fore.
Our cash flow strengthened significantly, mainly due to improved margins and effects from changes in workingcapital. Cash flow from operating activities amounted to SEK 1,117 million (524). We also secured an extension ofour credit framework by a net SEK 1,300 million to a total of SEK 3,800 million in the fourth quarter. We have norepayments planned for the upcoming 12-month period.
In most geographical markets, underlying demand was generally favourable throughout the financial year. In theNordic region, we had the strongest growth in Finland and Norway, while growth was stable in Sweden andDenmark. Outside the Nordic region, the market situation varied. Our units in central Europe developed positivelyoverall, while political and economic uncertainties in the UK resulted in a weak trend in our operations there.
In terms of customer segments, demand for production components and solutions for special vehicles and theengineering sector levelled off, while demand in electronics, medical technology and wind power increased.Demand for aftermarket products for the forestry and process industries remained, on the whole, stable, whilesales to the manufacturing industry declined. Sales were strong for products in the areas of emissionsmeasurement and purification, scrubber solutions in particular, which accounted for slightly more than half of theTransport segment. Demand for scrubber solutions decreased gradually over the year, mainly due to the decreasingprice difference between various fuels. Sales of electricity-related products to building & installation customerswas stable, while demand for infrastructure products increased.
The cyberattack put our business model and our employees to the test. Once again, our decentralised model andentrepreneur-driven culture, showed tremendous strength, with their amazing capacity for initiative and strong localcustomer connections. Combined with an increased spread, both geographically and across different marketsegments, this helps us handeling with the varying challenges we face. Right now, the foremost challengeconfronting us is the ongoing COVID-19 pandemic. Towards the end of the financial year, all units have againdemonstrated their capacity for adaptation by preparing plans of action to be ready to act if and when required.
ADDTECH AB (PUBL.) YEAR-END REPORT 1 APRIL 2019 – 31 MARCH 2020 2
ACQUISITIONS – CENTRAL ELEMENT OF GROWTH STRATEGYAcquisitions of successful, market-leading companies in various technical niches represent a key part of ourgrowth strategy. During the financial year, a total of 12 companies were acquired, four of which were closed in thefourth quarter, while three more were acquired after the end of the financial year. In total, these acquisitionscontribute to annual sales of approximately SEK 1,200 million, and adding some 260 new employees to the Group. Itis worth noting that several of these acquisitions have a clear connection to sustainability, including our largestacquisition to date, the Valutec Group, which is a world-leading manufacturer of timber kilns to the forest industry,and Caligo Industria OY, which delivers proprietary flue gas purification and heat recovery systems. Despite theuncertainty around the world, we are keeping our acquisition process active, although we have temporarily slowedthe pace. In the longer term, we are continuing to see good acquisition opportunities in several geographicmarkets.
OUTLOOK – CONTINUED OPPORTUNITIES DESPITE AN UNCERTAIN WORLDAt the end of March, several units experienced reduced demand due to the COVID-19 pandemic, particularly inspecial vehicles and parts of the engineering sector. Other units experienced increased demand instead, driven bycustomers with medical technology products for which demand increased due to the pandemic, and customerssecuring their inventories in preparation for anticipated shortages of components. This trend continued in April. Oursales declined for comparable units by about 5 percent month-on-month and demand for comparable units declinedby about 15 percent. Parts of the decrease are also explained by lower activity in scrubber installations. Despite allof the prevailing uncertainty, we are receiving deliveries from suppliers worldwide, we are continuing to deliverproducts and solutions to our customers, and we have a good order backlog.
Future development depends on many factors beyond our control, such as the spread of infection and politicaldecisions. At this time, our main focus is on the health of our employees, on keeping our expenses in line withdemand and on safeguarding our earnings and, not least, our cash flow. The Board of Directors also feels that itbears a significant responsibility in securing the Group’s liquidity and cash flow and has therefore chosen, for thetime being, to postpone the decision regarding the proposal on dividend due to the current uncertainty. The unitsnoticing a slowdown have already put measures in place to protect their margins, liquidity and cash flow. We areproceeding on the basis of different conceivable future scenarios and are well prepared to respond effectivelybased on how the situation develops.
In times of crisis, companies with stable business models and strong financial positions are able to benefit fromnew opportunities that arise. For this reason, it is important that we continue to focus on our long-term goals, evenduring such times as the present. We have a favourable underlying momentum in the Group, with good positions instructurally driven areas of development, such as energy conversion and electrification. Over the year, we alsoclarified our long-term Sustainability Vision 2030, which supports the Paris Agreement and the UN 2030 SustainableDevelopment Agenda, reflecting our ambitious approach to halving our carbon dioxide emissions and increasingthe proportion of women in the Group.
Finally, I would like to point out that Addtech has, over the years, successfullydealt with many difficult and uncertain situations through its strong corporateculture and ability to rapidly adapt. Accordingly, I am firmly convinced that we willalso navigate through this societal crisis, continuing our long-term, sustainableand profitable growth.
Niklas StenbergPresident and CEO
ADDTECH AB (PUBL.) YEAR-END REPORT 1 APRIL 2019 – 31 MARCH 2020 3
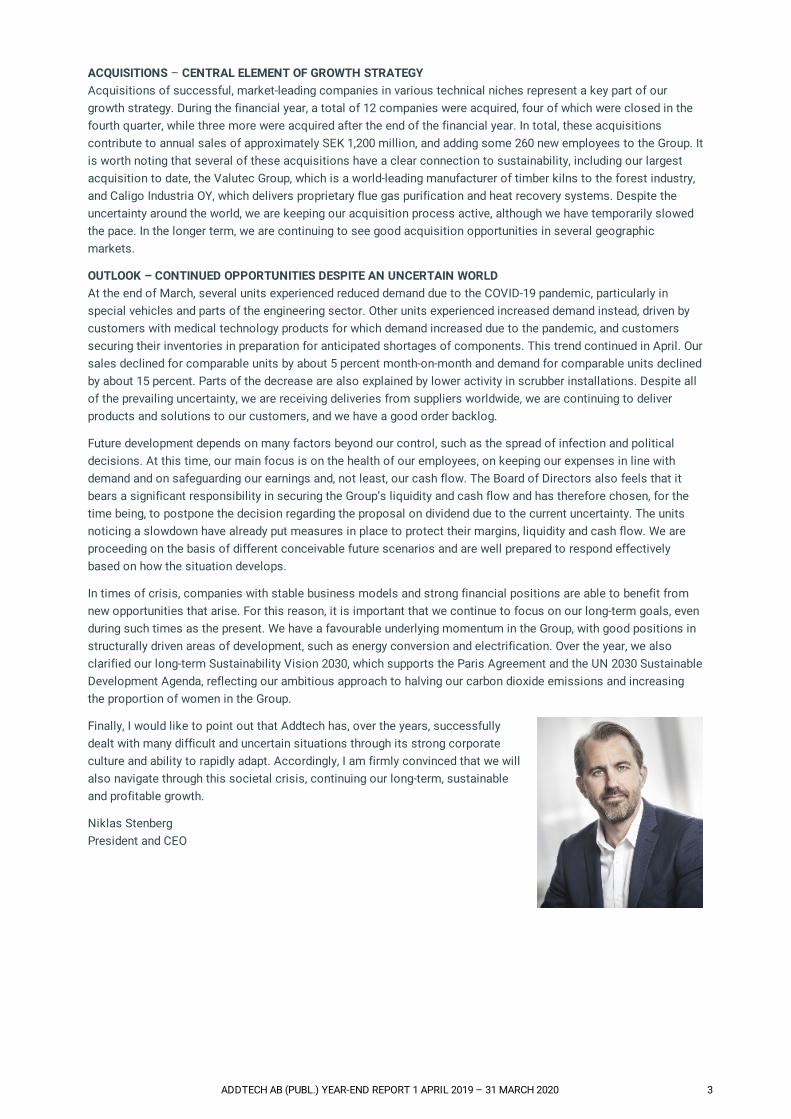
GROUP DEVELOPMENTSales developmentNet sales in the Addtech Group increased in the fourth quarter by to SEK 3,038 million (2,864). The organic growthamounted to -1 percent and acquired growth amounted to 7 percent. Exchange rate changes affect net salesmarginally positively, corresponding to SEK 8 million.
Net sales in the Addtech Group increased during the financial year by 16 percent to SEK 11,735 million (10,148). The organic growth amounted to 8 percent, acquired growth amounted to 8 percent and disposal affected by-1 percent. Exchange rate changes had a positive effect of 1 percent on net sales, corresponding to SEK 107 million.
Profit developmentOperating profit increased during the quarter by 35 percent to SEK 352 million (260) and the operating marginamounted to 11.6 percent (9.1). Net financial items amounted to SEK -19 million (-14). Profit after financialitems increased by 35 percent to SEK 333 million (246).
Profit after tax increased by 47 percent to SEK 265 million (180) corresponding to earnings per share before dilutionof SEK 3.90 (2.65).
EBITA for the financial year amounted to SEK 1,364 million (1,085), representing an increase of 26 percent. Theintroduction of IFRS 16 had a positive impact on EBITA of SEK 5 million. Operating profit increased during thefinancial year by 28 percent to SEK 1,161 million (910) and the operating margin amounted to 9.9 percent (9.0). Net financial items were SEK -56 million (-45) and profit after financial items increased by 28 percent to SEK 1,105 million (865). The introduction of IFRS 16 affected net financial items negatively by SEK 8 million.
Profit after tax for the financial year increased by 30 percent to SEK 873 million (672) and the effective taxrate amounted to 21 percent (22). The effect of IFRS 16 on profit after tax amounted to SEK -3 million. Earnings pershare before dilution for the financial year amounted to SEK 12.85 (9.85).
Net Sales and EBITA margin, rolling 12 months
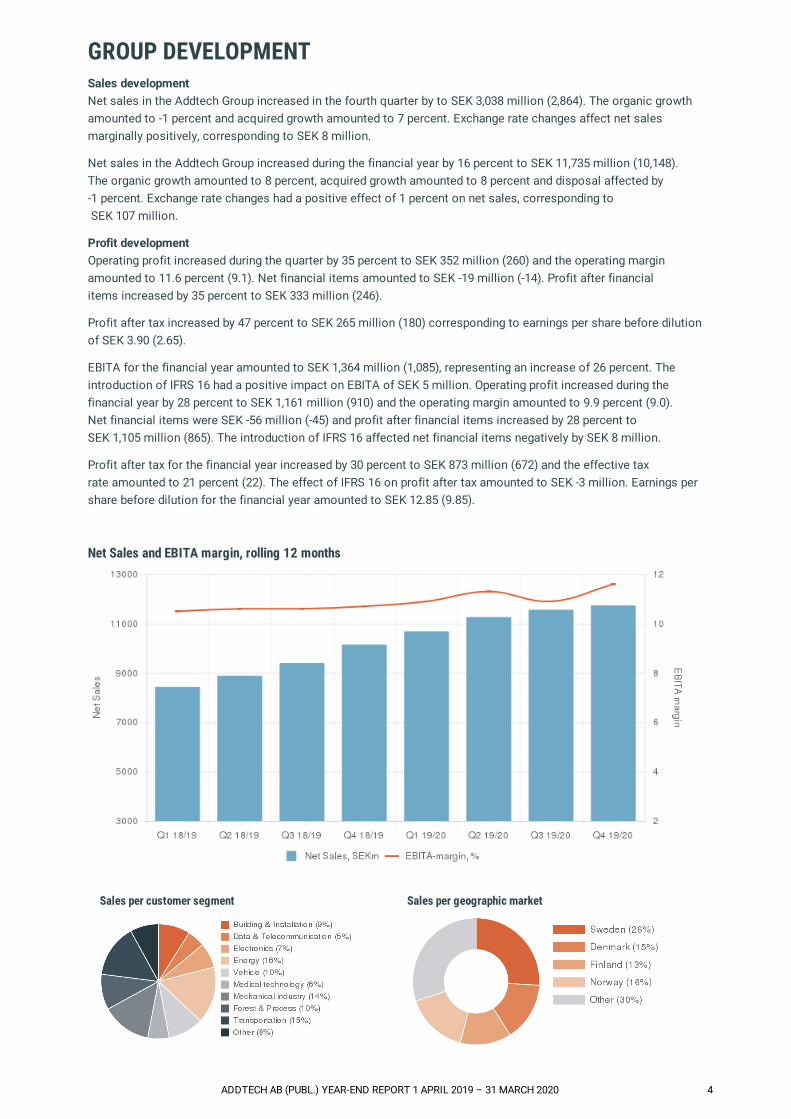
Sales per customer segment Sales per geographic market
ADDTECH AB (PUBL.) YEAR-END REPORT 1 APRIL 2019 – 31 MARCH 2020 4
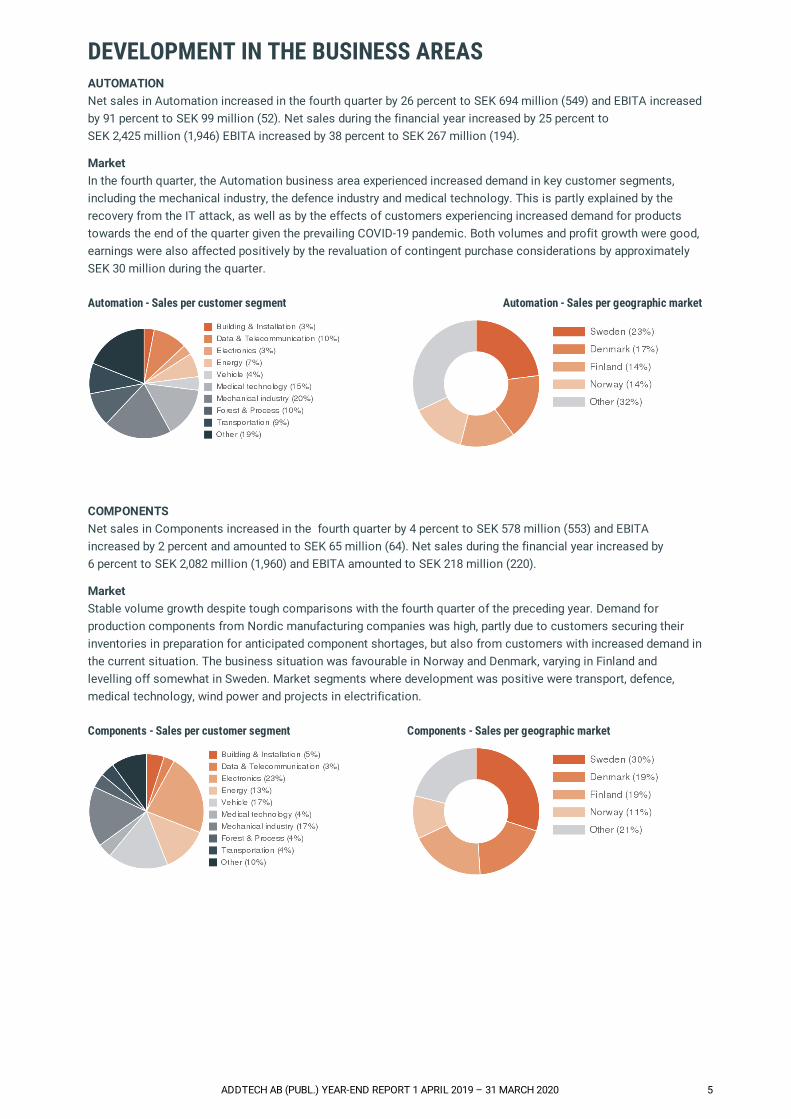
DEVELOPMENT IN THE BUSINESS AREASAUTOMATIONNet sales in Automation increased in the fourth quarter by 26 percent to SEK 694 million (549) and EBITA increasedby 91 percent to SEK 99 million (52). Net sales during the financial year increased by 25 percent toSEK 2,425 million (1,946) EBITA increased by 38 percent to SEK 267 million (194).
MarketIn the fourth quarter, the Automation business area experienced increased demand in key customer segments,including the mechanical industry, the defence industry and medical technology. This is partly explained by therecovery from the IT attack, as well as by the effects of customers experiencing increased demand for productstowards the end of the quarter given the prevailing COVID-19 pandemic. Both volumes and profit growth were good,earnings were also affected positively by the revaluation of contingent purchase considerations by approximately SEK 30 million during the quarter.
COMPONENTSNet sales in Components increased in the fourth quarter by 4 percent to SEK 578 million (553) and EBITAincreased by 2 percent and amounted to SEK 65 million (64). Net sales during the financial year increased by6 percent to SEK 2,082 million (1,960) and EBITA amounted to SEK 218 million (220).
MarketStable volume growth despite tough comparisons with the fourth quarter of the preceding year. Demand forproduction components from Nordic manufacturing companies was high, partly due to customers securing theirinventories in preparation for anticipated component shortages, but also from customers with increased demand inthe current situation. The business situation was favourable in Norway and Denmark, varying in Finland andlevelling off somewhat in Sweden. Market segments where development was positive were transport, defence,medical technology, wind power and projects in electrification.
Automation - Sales per customer segment Automation - Sales per geographic market
Components - Sales per customer segment Components - Sales per geographic market
ADDTECH AB (PUBL.) YEAR-END REPORT 1 APRIL 2019 – 31 MARCH 2020 5
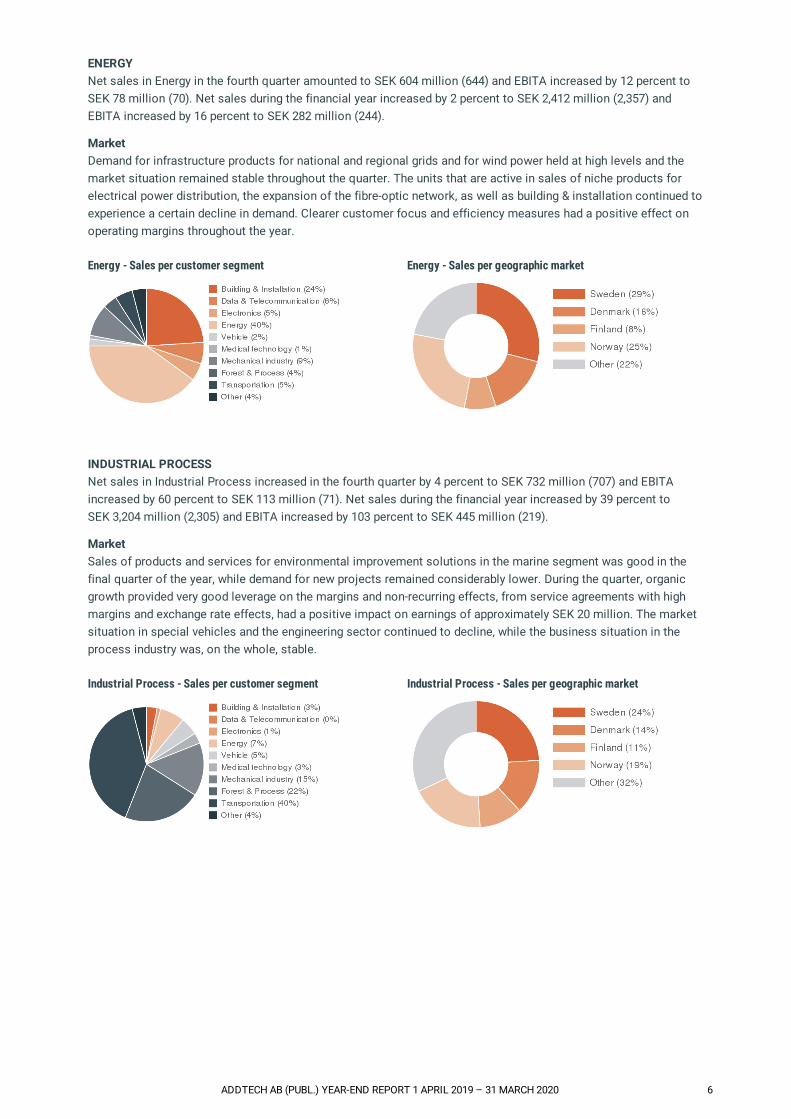
ENERGYNet sales in Energy in the fourth quarter amounted to SEK 604 million (644) and EBITA increased by 12 percent toSEK 78 million (70). Net sales during the financial year increased by 2 percent to SEK 2,412 million (2,357) andEBITA increased by 16 percent to SEK 282 million (244).
MarketDemand for infrastructure products for national and regional grids and for wind power held at high levels and themarket situation remained stable throughout the quarter. The units that are active in sales of niche products forelectrical power distribution, the expansion of the fibre-optic network, as well as building & installation continued toexperience a certain decline in demand. Clearer customer focus and efficiency measures had a positive effect onoperating margins throughout the year.
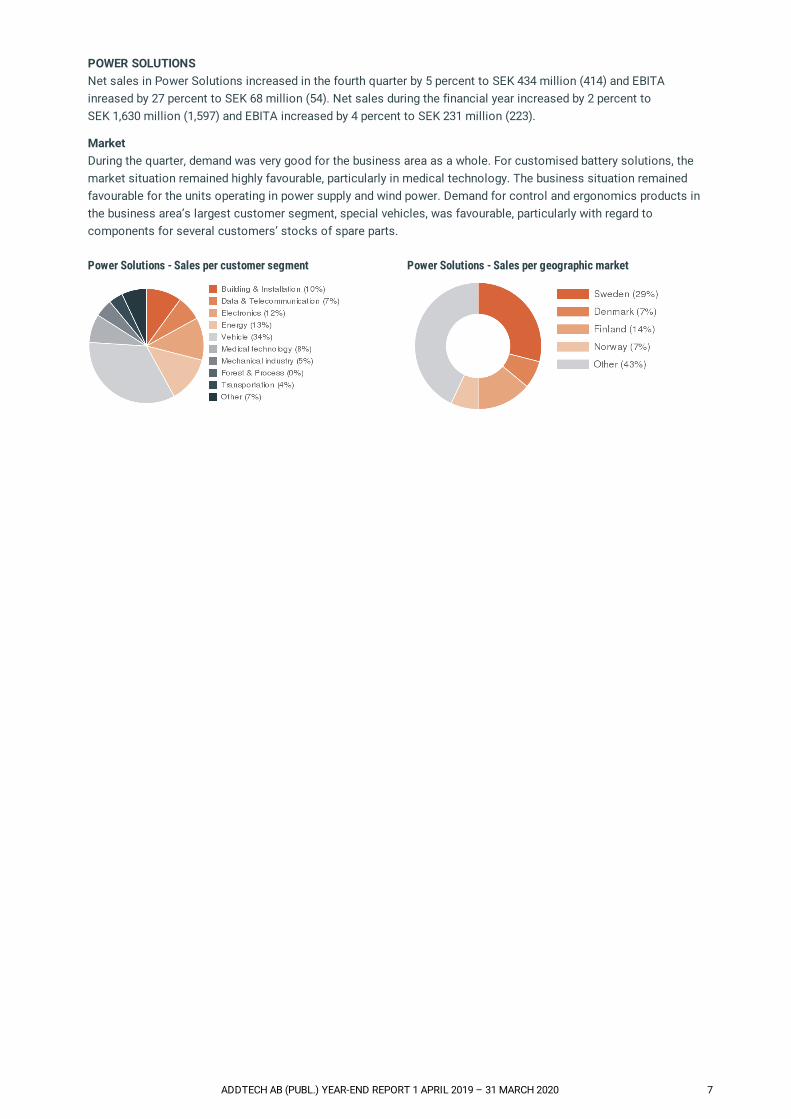
INDUSTRIAL PROCESSNet sales in Industrial Process increased in the fourth quarter by 4 percent to SEK 732 million (707) and EBITAincreased by 60 percent to SEK 113 million (71). Net sales during the financial year increased by 39 percent to SEK 3,204 million (2,305) and EBITA increased by 103 percent to SEK 445 million (219).
MarketSales of products and services for environmental improvement solutions in the marine segment was good in thefinal quarter of the year, while demand for new projects remained considerably lower. During the quarter, organicgrowth provided very good leverage on the margins and non-recurring effects, from service agreements with highmargins and exchange rate effects, had a positive impact on earnings of approximately SEK 20 million. The marketsituation in special vehicles and the engineering sector continued to decline, while the business situation in theprocess industry was, on the whole, stable.
Energy - Sales per customer segment Energy - Sales per geographic market
Industrial Process - Sales per customer segment Industrial Process - Sales per geographic market
ADDTECH AB (PUBL.) YEAR-END REPORT 1 APRIL 2019 – 31 MARCH 2020 6
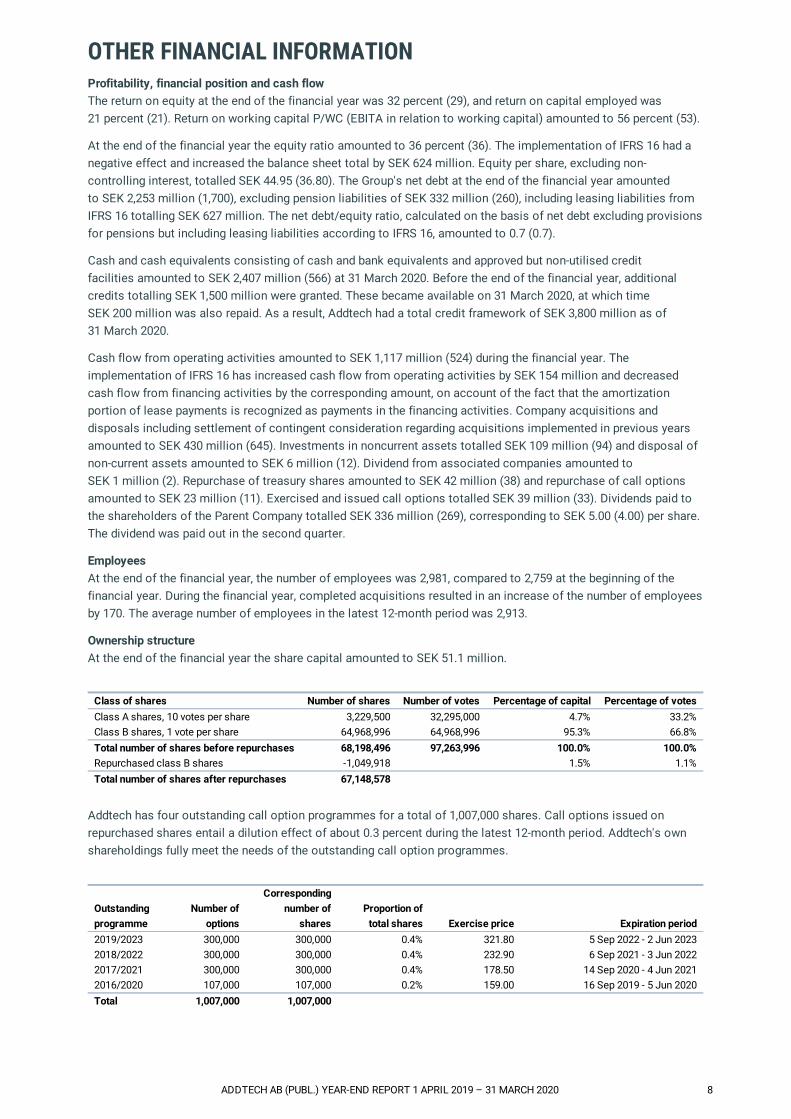
POWER SOLUTIONSNet sales in Power Solutions increased in the fourth quarter by 5 percent to SEK 434 million (414) and EBITAinreased by 27 percent to SEK 68 million (54). Net sales during the financial year increased by 2 percent to SEK 1,630 million (1,597) and EBITA increased by 4 percent to SEK 231 million (223).
MarketDuring the quarter, demand was very good for the business area as a whole. For customised battery solutions, themarket situation remained highly favourable, particularly in medical technology. The business situation remainedfavourable for the units operating in power supply and wind power. Demand for control and ergonomics products inthe business area’s largest customer segment, special vehicles, was favourable, particularly with regard tocomponents for several customers’ stocks of spare parts.
Power Solutions - Sales per customer segment Power Solutions - Sales per geographic market
ADDTECH AB (PUBL.) YEAR-END REPORT 1 APRIL 2019 – 31 MARCH 2020 7
OTHER FINANCIAL INFORMATIONProfitability, financial position and cash flowThe return on equity at the end of the financial year was 32 percent (29), and return on capital employed was21 percent (21). Return on working capital P/WC (EBITA in relation to working capital) amounted to 56 percent (53).
At the end of the financial year the equity ratio amounted to 36 percent (36). The implementation of IFRS 16 had anegative effect and increased the balance sheet total by SEK 624 million. Equity per share, excluding non-controlling interest, totalled SEK 44.95 (36.80). The Group's net debt at the end of the financial year amountedto SEK 2,253 million (1,700), excluding pension liabilities of SEK 332 million (260), including leasing liabilities fromIFRS 16 totalling SEK 627 million. The net debt/equity ratio, calculated on the basis of net debt excluding provisionsfor pensions but including leasing liabilities according to IFRS 16, amounted to 0.7 (0.7).
Cash and cash equivalents consisting of cash and bank equivalents and approved but non-utilised creditfacilities amounted to SEK 2,407 million (566) at 31 March 2020. Before the end of the financial year, additionalcredits totalling SEK 1,500 million were granted. These became available on 31 March 2020, at which time SEK 200 million was also repaid. As a result, Addtech had a total credit framework of SEK 3,800 million as of 31 March 2020.
Cash flow from operating activities amounted to SEK 1,117 million (524) during the financial year. Theimplementation of IFRS 16 has increased cash flow from operating activities by SEK 154 million and decreasedcash flow from financing activities by the corresponding amount, on account of the fact that the amortizationportion of lease payments is recognized as payments in the financing activities. Company acquisitions anddisposals including settlement of contingent consideration regarding acquisitions implemented in previous yearsamounted to SEK 430 million (645). Investments in noncurrent assets totalled SEK 109 million (94) and disposal ofnon-current assets amounted to SEK 6 million (12). Dividend from associated companies amounted to SEK 1 million (2). Repurchase of treasury shares amounted to SEK 42 million (38) and repurchase of call optionsamounted to SEK 23 million (11). Exercised and issued call options totalled SEK 39 million (33). Dividends paid tothe shareholders of the Parent Company totalled SEK 336 million (269), corresponding to SEK 5.00 (4.00) per share.The dividend was paid out in the second quarter.
EmployeesAt the end of the financial year, the number of employees was 2,981, compared to 2,759 at the beginning of thefinancial year. During the financial year, completed acquisitions resulted in an increase of the number of employeesby 170. The average number of employees in the latest 12-month period was 2,913.
Ownership structureAt the end of the financial year the share capital amounted to SEK 51.1 million.
Class of shares Number of shares Number of votes Percentage of capital Percentage of votesClass A shares, 10 votes per share 3,229,500 32,295,000 4.7% 33.2%Class B shares, 1 vote per share 64,968,996 64,968,996 95.3% 66.8%Total number of shares before repurchases 68,198,496 97,263,996 100.0% 100.0%Repurchased class B shares -1,049,918 1.5% 1.1%Total number of shares after repurchases 67,148,578
Addtech has four outstanding call option programmes for a total of 1,007,000 shares. Call options issued onrepurchased shares entail a dilution effect of about 0.3 percent during the latest 12-month period. Addtech's ownshareholdings fully meet the needs of the outstanding call option programmes.
Outstandingprogramme
Number ofoptions
Correspondingnumber of
sharesProportion of
total shares Exercise price Expiration period2019/2023 300,000 300,000 0.4% 321.80 5 Sep 2022 - 2 Jun 20232018/2022 300,000 300,000 0.4% 232.90 6 Sep 2021 - 3 Jun 20222017/2021 300,000 300,000 0.4% 178.50 14 Sep 2020 - 4 Jun 20212016/2020 107,000 107,000 0.2% 159.00 16 Sep 2019 - 5 Jun 2020Total 1,007,000 1,007,000
ADDTECH AB (PUBL.) YEAR-END REPORT 1 APRIL 2019 – 31 MARCH 2020 8
Acquisitions and disposalsDuring the period, 1 April to 31 December 2019 the following acquisitions were completed; Omni Ray AG, Thiim A/Sand Promector Oy to become part of the Automation business area, Thurne Teknik AB, AB N.O. Rönne and BKCProducts Ltd. to become part of the Industrial Process business area, Best Seating Systems Walter Tausch GmbHto become part of the Power Solutions business area and Profelec Oy to become part of the Energy business area.
On 3 February Wireco-NB Oy, Finland, was acquired to become part of the Energy business area. Wireco is asupplier of special cables and cable accessories for industrial and mining applications, mainly in Finland. Thecompany has sales of about EUR 2.2 million and 6 employees.
On 27 February Caligo Industria Oy, Finland, was acquired to become part of the Industrial Process business area.Caligo develops and supplies flue gas cleaning and heat recovery systems mainly to combined heat andpowerplants and the wood processing industry in the Nordics and in France. The company has sales of about EUR 6.3 million and 9 employees.
On 2 March DMC Digital Motor Control GmbH, Germany, and Q-tronic B.V, Netherlands, was acquired to becomepart of the Power Solutions business area. DMC designs and produces electrical motor controllers for batterydriven applications including electrical vehicles. Q-tronic provide electrical component solutions and subsystemsfor electrical vehicles in mainly Benelux countries. Together DMC and Q-tronic has sales of about EUR 7 million and20 employees.
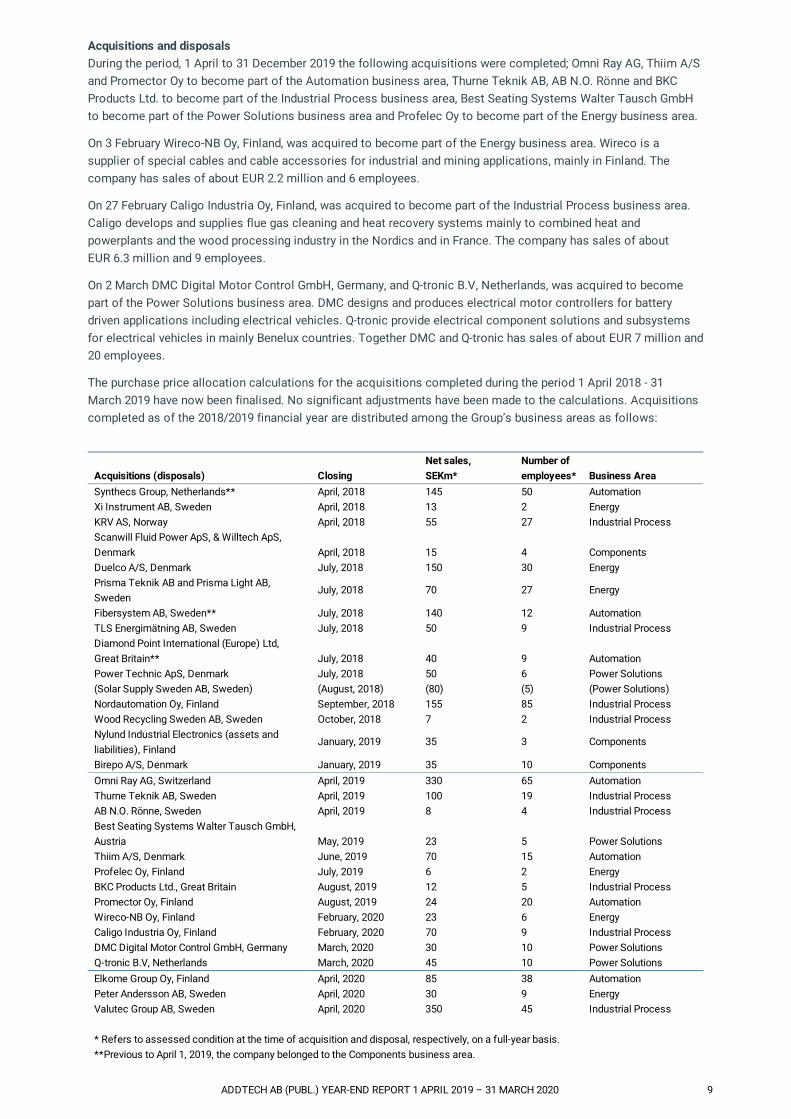
The purchase price allocation calculations for the acquisitions completed during the period 1 April 2018 - 31March 2019 have now been finalised. No significant adjustments have been made to the calculations. Acquisitionscompleted as of the 2018/2019 financial year are distributed among the Group’s business areas as follows:
Acquisitions (disposals) ClosingNet sales, SEKm*
Number ofemployees* Business Area
Synthecs Group, Netherlands** April, 2018 145 50 AutomationXi Instrument AB, Sweden April, 2018 13 2 EnergyKRV AS, Norway April, 2018 55 27 Industrial ProcessScanwill Fluid Power ApS, & Willtech ApS,Denmark April, 2018 15 4 ComponentsDuelco A/S, Denmark July, 2018 150 30 EnergyPrisma Teknik AB and Prisma Light AB,Sweden
July, 2018 70 27 Energy
Fibersystem AB, Sweden** July, 2018 140 12 AutomationTLS Energimätning AB, Sweden July, 2018 50 9 Industrial ProcessDiamond Point International (Europe) Ltd,Great Britain** July, 2018 40 9 AutomationPower Technic ApS, Denmark July, 2018 50 6 Power Solutions(Solar Supply Sweden AB, Sweden) (August, 2018) (80) (5) (Power Solutions)Nordautomation Oy, Finland September, 2018 155 85 Industrial ProcessWood Recycling Sweden AB, Sweden October, 2018 7 2 Industrial ProcessNylund Industrial Electronics (assets andliabilities), Finland
January, 2019 35 3 Components
Birepo A/S, Denmark January, 2019 35 10 ComponentsOmni Ray AG, Switzerland April, 2019 330 65 AutomationThurne Teknik AB, Sweden April, 2019 100 19 Industrial ProcessAB N.O. Rönne, Sweden April, 2019 8 4 Industrial ProcessBest Seating Systems Walter Tausch GmbH,Austria May, 2019 23 5 Power SolutionsThiim A/S, Denmark June, 2019 70 15 AutomationProfelec Oy, Finland July, 2019 6 2 EnergyBKC Products Ltd., Great Britain August, 2019 12 5 Industrial ProcessPromector Oy, Finland August, 2019 24 20 AutomationWireco-NB Oy, Finland February, 2020 23 6 EnergyCaligo Industria Oy, Finland February, 2020 70 9 Industrial ProcessDMC Digital Motor Control GmbH, Germany March, 2020 30 10 Power SolutionsQ-tronic B.V, Netherlands March, 2020 45 10 Power SolutionsElkome Group Oy, Finland April, 2020 85 38 AutomationPeter Andersson AB, Sweden April, 2020 30 9 EnergyValutec Group AB, Sweden April, 2020 350 45 Industrial Process
* Refers to assessed condition at the time of acquisition and disposal, respectively, on a full-year basis.**Previous to April 1, 2019, the company belonged to the Components business area.
ADDTECH AB (PUBL.) YEAR-END REPORT 1 APRIL 2019 – 31 MARCH 2020 9
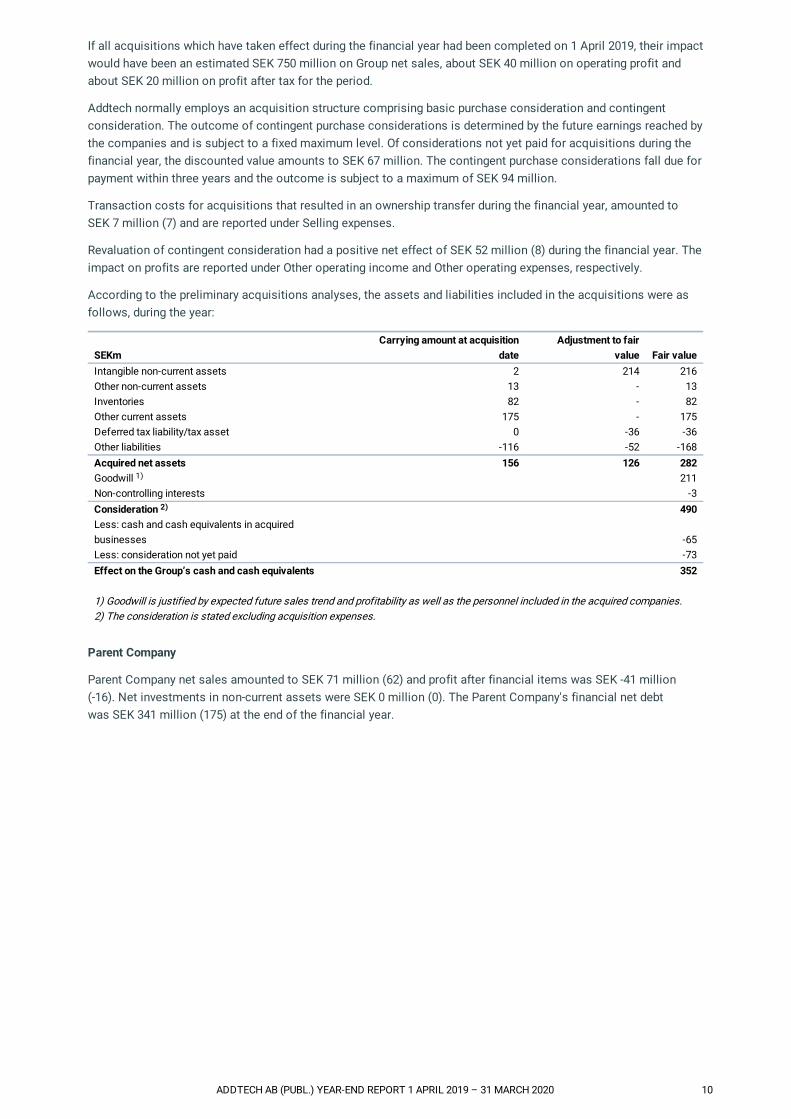
If all acquisitions which have taken effect during the financial year had been completed on 1 April 2019, their impactwould have been an estimated SEK 750 million on Group net sales, about SEK 40 million on operating profit andabout SEK 20 million on profit after tax for the period.
Addtech normally employs an acquisition structure comprising basic purchase consideration and contingentconsideration. The outcome of contingent purchase considerations is determined by the future earnings reached bythe companies and is subject to a fixed maximum level. Of considerations not yet paid for acquisitions during thefinancial year, the discounted value amounts to SEK 67 million. The contingent purchase considerations fall due forpayment within three years and the outcome is subject to a maximum of SEK 94 million.
Transaction costs for acquisitions that resulted in an ownership transfer during the financial year, amounted to SEK 7 million (7) and are reported under Selling expenses.
Revaluation of contingent consideration had a positive net effect of SEK 52 million (8) during the financial year. Theimpact on profits are reported under Other operating income and Other operating expenses, respectively.
According to the preliminary acquisitions analyses, the assets and liabilities included in the acquisitions were asfollows, during the year:
SEKmCarrying amount at acquisition
dateAdjustment to fair
value Fair valueIntangible non-current assets 2 214 216Other non-current assets 13 - 13Inventories 82 - 82Other current assets 175 - 175Deferred tax liability/tax asset 0 -36 -36Other liabilities -116 -52 -168Acquired net assets 156 126 282Goodwill 211Non-controlling interests -3Consideration 490Less: cash and cash equivalents in acquiredbusinesses -65Less: consideration not yet paid -73Effect on the Group’s cash and cash equivalents 352 1) Goodwill is justified by expected future sales trend and profitability as well as the personnel included in the acquired companies.2) The consideration is stated excluding acquisition expenses.
Parent Company
Parent Company net sales amounted to SEK 71 million (62) and profit after financial items was SEK -41 million (-16). Net investments in non-current assets were SEK 0 million (0). The Parent Company's financial net debtwas SEK 341 million (175) at the end of the financial year.
1)
2)
ADDTECH AB (PUBL.) YEAR-END REPORT 1 APRIL 2019 – 31 MARCH 2020 10
OTHER DISCLOSURESAccounting policiesThis interim report was prepared in accordance with IFRS and IAS 34 Interim Financial Reporting. Disclosures underIAS 34.16A are made not only in the financial statements, with associated notes, but also in other parts of theinterim report. The interim report for the parent company was prepared in accordance with the Swedish AnnualAccounts Act and the Swedish Securities Market Act, which complies with recommendation RFR 2 Accounting forLegal Entities, issued by the Swedish Financial Reporting Board. The same accounting policies and basis forcalculations as in the latest annual report have been applied in this interim report, with the exception of theamended accounting policies described below.
As of 1 January 2019, IFRS 16 Leases has replaced standard IAS 17 Leases and related interpretations IFRIC 4, SIC 15 and SIC 27. IFRS 16 requires most leases to be reported in the balance sheet.
Addtech applied the simplified transition method, entailing comparative data for previous periods not beingpresented. The lease liability consists of the discounted remaining leasing fees as of 1 April 2019. For all contracts,the right-of-use asset corresponds to an amount equivalent to the lease liability adjusted for prepaid or accruedlease payments recognised in the balance sheet on the initial date of application. Accordingly, the transition toIFRS 16 entailed no effect on equity.
Addtech’s leases consist mainly of leased premises but also vehicles and other leases (of, for example, productionequipment and office equipment). The transition to IFRS 16 entailed an increase in the Group’s total assets throughthe addition of right-of-use assets and lease liabilities. The lease fees previously reported as operating expenseswas replaced by depreciation expenses on the rights-of-use which are reported in operating profit and interest onthe lease liability, which is reported as a financial expense. The lease fee is divided between amortisation on thelease liability and interest payments.
Addtech has chosen to apply the relief rule regarding leases of less than 12 months and for contracts where theunderlying asset has a low value. Accordingly, these will not be included in the amounts reported in the balancesheet, although they will still be reported as operating expenses in the income statement. In assessing contractduration where there are opportunities for extension or termination, both business strategy and contract-specificconditions are considered in determining whether the Group is reasonably secure in applying them.
On the transition to IFRS 16, all remaining lease fees were calculated applying the margin loan rate. The transitioneffect on the balance sheet as of 1 April 2019 entailed right-of-use assets of SEK 550 million arising on the assetside. On the liability side, lease liabilities totalling SEK 550 million arose, of which non-current liabilities amountedto SEK 408 million and current liabilities to SEK 142 million.
During the period IFRS 16 has entailed increased depreciation expenses on property, plant and equipmentamounting to SEK 157 million and increased interest amounting to SEK 8 million. The lease fees were previouslyreported as operating expenses.
The effect of IFRS 16 is included in the Group’s income statement, statement of comprehensive income and keyfinancial indicators per share. In the Group’s balance sheet, cash flow statement and in the key financial indicatorsfigures are presented including and excluding IFRS 16 to illustrate the effect of the transition. The comparativefinancial information has not been restated.
Alternative performance measuresThe Company presents certain financial measures in the interim report that are not defined according to IFRS. TheCompany believes that these measures provide valuable supplemental information to investors and the Company'smanagement as they allow for evaluation of trends and the Company's performance. Since all companies do notcalculate financial measures in the same way, they are not always comparable to measures used by othercompanies. These financial measures should therefore not be considered to be a replacement for measurementsas defined under IFRS. For definitions and reconciliation tables of the performance measures that Addtech uses,please see page 22-25.
ADDTECH AB (PUBL.) YEAR-END REPORT 1 APRIL 2019 – 31 MARCH 2020 11
Risks and factors of uncertaintyAddtech's profit and financial position, as well as its strategic position, are affected by a number of internal factorsunder Addtech's control and by a number of external factors over which Addtech has limited influence. The mostimportant risk factors for Addtech are the state of the economy, combined with structural change and thecompetitive situation.
Addtech has four operating subsidiaries within the UK as well as a few other subsidiaries doing business with theUK. The effects of Brexit are to this date unknown, but all affected subsidiaries are closely monitoring thedevelopments. Addtech Group’s total exposure to possible negative effects from Brexit are not consideredmaterial.
The risk of being exposed to various types of IT incidents, that is, the risk that critical data or one or more of the ITsystems used is somehow rendered unusable or locked, fails or is destroyed, has greatly increased in recent times.During the year, Addtech was subject to a cyberattack that brought to light the importance of having a detailed ITstrategy with a relevant level of security. Following the cyberattack in October, a survey has been conducted of theGroup's operational IT risks and a new IT strategy is being implemented.
To date, the impact of the COVID-19 pandemic on Addtech has been limited. Overall, fourth quarter demand was inline with expectations. We are monitoring the recommendations issued by the appropriate authorities and aretaking relevant health precautions to protect our personnel and to mitigate the contagion in society. The pandemicis affecting the entire global market and will also have an impact on Addtech over the next financial year.Challenges are appearing in the supply chain and uncertainties prevail regarding some of our customers’ prospectsof keeping their operations running at full capacity. Although the extent to which Addtech will be affected cannotcurrently be determined, we are nonetheless preparing and implementing measures to meet a presumed drop insales over the upcoming quarters. To be able to act quickly in the event of a slowdown, all companies in the Grouphave prepared action plans and cost-saving programmes ready to be executed to protect earnings, liquidity andcash flow.
Beside this, risks and uncertainty factors are the same as in previous periods, please see section Risks anduncertainties (page 38-40) in the annual report for 2018/2019 for further details. The Parent Company is indirectlyaffected by the above risks and uncertainty factors due to its role in the organisation.
Transactions with related partiesNo transactions between Addtech and related parties that have significantly affected the Group's position andearnings have taken place during the period.
Seasonal effectsAddtech's sales of high-tech products and solutions in the manufacturing industry and infrastructure are not subjectto major seasonal variations. The number of production days and customers' demand and willingness to invest canvary over the quarters.
Annual General Report 2019/2020The annual report for 2019/2020 will be published on Addtech’s website www.addtech.com in July 2020. A printed version will be distributed to the shareholders who request this.
Annual General Meeting 2020The Annual General Meeting (AGM) of Addtech AB will take place at 2:00 p.m on Friday 28 August 2020 at IVA atthe address Grev Turegatan 16 in Stockholm. A notice of the AGM will be published in July 2020 and will also beavailable on www.addtech.com.
The Board of Directors has decided to postpone the decision regarding the proposal on dividend for the timebeing due to the current uncertainty regarding the effects of the COVID-19 pandemic on the Group’s liquidity andcash flow.
ADDTECH AB (PUBL.) YEAR-END REPORT 1 APRIL 2019 – 31 MARCH 2020 12
Significant events after the end of the financial yearOn 1 April, Elkome Group Oy, Finland, was acquired to become part of the Automation business area. Elkomedevelops, integrates and delivers solutions for applications in industrial IoT primarily for industrial production,smart cities and infrastructure. The offering includes customized computer systems, test systems, info kiosks,software, sensors and industrial communication. The company has sales of about EUR 8 million and 38employees.
On 2 April Peter Andersson AB, Sweden, was acquired to become part of the Energy business area. AnderssonSystem supplies both trading products and own products within electrical accessories for office and kitchenenvironments, to the Swedish and Norwegian markets.The products are sold through retailers of office furniture,office interiors, AV equipment, computer accessories and kitchen furnishings. The company has sales of aboutSEK 30 million and 9 employees.
On 8 April Valutec Group AB, Sweden, was acquired to become part of the Industrial Process businessarea. Valutec is one of the world’s leading manufacturers of timber kilns to the forest industry. The company hassales of about SEK 350 million and 45 employees
Preliminary purchase price allocations have not yet been completed.
Stockholm May 13, 2020
Niklas StenbergCEO and President
FURTHER INFORMATION
PublicationThis information is information that Addtech AB (publ) is obliged to make public pursuant to the EU Market AbuseRegulation and the Securities Markets Act. The information was submitted for publication, through the agency ofthe contact persons set out below, at 8.15 a.m CET on 13 May 2020.
Future informationJuly 2020 Annual Report 2019/20202020-07-14 Interim report 1 April - 30 June 20202020-08-28 Annual General Meeting 2020 will be held at IVA, Grev Turegatan 16, Stockholm at 2.00 p.m2020-10-23 Interim report 1 April - 30 September 20202021-02-04 Interim report 1 April - 31 December 2020
For further information, please contact:Niklas Stenberg, President and CEO, +46 8 470 49 00 Malin Enarson, CFO, +46 705 979 473
ADDTECH AB (PUBL.) YEAR-END REPORT 1 APRIL 2019 – 31 MARCH 2020 13
REVIEW REPORTINTRODUCTIONWe have reviewed the summary interim financial information (year-end report) of Addtech AB (publ.), corp.ID556302-9726, as of 31 March 2020 and the twelve-month period then ended. The Board of Directors and theManaging Director are responsible for the preparation and presentation of this interim report in accordancewith IAS 34 and the Annual Accounts Act. Our responsibility is to express a conclusion on this interim report basedon our review.
SCOPE OF REVIEWWe conducted our review in accordance with International Standard on Review Engagements ISRE 2410 Review ofInterim Financial Information Performed by the Independent Auditor of the Entity. A review of interim financialinformation consists of making inquiries, primarily of persons responsible for financial and accounting matters,and applying analytical and other review procedures. A review is substantially less in scope than an audit conductedin accordance with International Standards on Auditing and other generally accepted auditing practices andconsequently does not enable us to obtain assurance that we would become aware of all significant matters thatmight be identified in an audit. Accordingly, we do not express an audit opinion.
CONCLUSIONBased on our review, nothing has come to our attention that causes us to believe that the interim report is notprepared, in all material respects, for the Group in accordance with IAS 34 and the Annual Accounts Act, and for theParent Company in accordance with the Annual Accounts Act.
Stockholm, 13 May 2020
KPMG AB KPMG AB
Joakim Thilstedt Jonas Eriksson Authorised Public Accountant Authorised Public AccountantAuditor in Charge
ADDTECH AB (PUBL.) YEAR-END REPORT 1 APRIL 2019 – 31 MARCH 2020 14
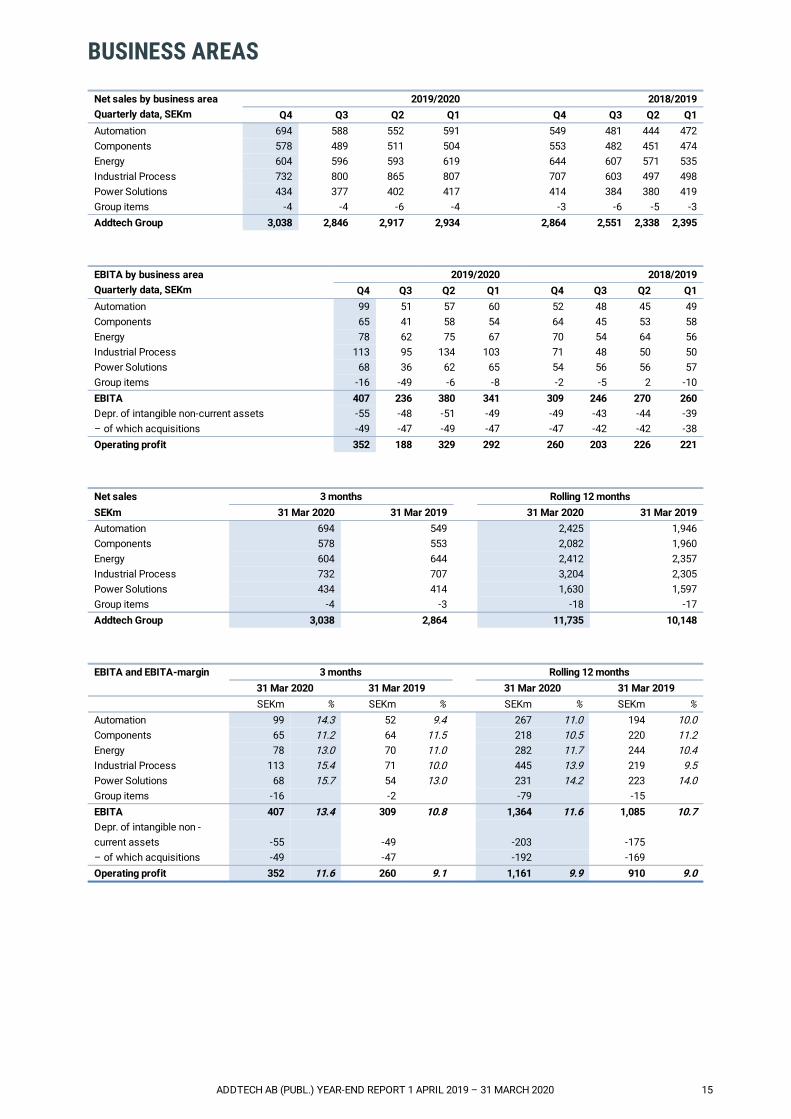
BUSINESS AREAS Net sales by business area 2019/2020 2018/2019Quarterly data, SEKm Q4 Q3 Q2 Q1 Q4 Q3 Q2 Q1Automation 694 588 552 591 549 481 444 472Components 578 489 511 504 553 482 451 474Energy 604 596 593 619 644 607 571 535Industrial Process 732 800 865 807 707 603 497 498Power Solutions 434 377 402 417 414 384 380 419Group items -4 -4 -6 -4 -3 -6 -5 -3Addtech Group 3,038 2,846 2,917 2,934 2,864 2,551 2,338 2,395
EBITA by business area 2019/2020 2018/2019Quarterly data, SEKm Q4 Q3 Q2 Q1 Q4 Q3 Q2 Q1Automation 99 51 57 60 52 48 45 49Components 65 41 58 54 64 45 53 58Energy 78 62 75 67 70 54 64 56Industrial Process 113 95 134 103 71 48 50 50Power Solutions 68 36 62 65 54 56 56 57Group items -16 -49 -6 -8 -2 -5 2 -10EBITA 407 236 380 341 309 246 270 260Depr. of intangible non-current assets -55 -48 -51 -49 -49 -43 -44 -39– of which acquisitions -49 -47 -49 -47 -47 -42 -42 -38Operating profit 352 188 329 292 260 203 226 221
Net sales 3 months Rolling 12 monthsSEKm 31 Mar 2020 31 Mar 2019 31 Mar 2020 31 Mar 2019Automation 694 549 2,425 1,946Components 578 553 2,082 1,960Energy 604 644 2,412 2,357Industrial Process 732 707 3,204 2,305Power Solutions 434 414 1,630 1,597Group items -4 -3 -18 -17Addtech Group 3,038 2,864 11,735 10,148
EBITA and EBITA-margin 3 months Rolling 12 months 31 Mar 2020 31 Mar 2019 31 Mar 2020 31 Mar 2019 SEKm % SEKm % SEKm % SEKm %Automation 99 14.3 52 9.4 267 11.0 194 10.0Components 65 11.2 64 11.5 218 10.5 220 11.2Energy 78 13.0 70 11.0 282 11.7 244 10.4Industrial Process 113 15.4 71 10.0 445 13.9 219 9.5Power Solutions 68 15.7 54 13.0 231 14.2 223 14.0Group items -16 -2 -79 -15 EBITA 407 13.4 309 10.8 1,364 11.6 1,085 10.7Depr. of intangible non -current assets -55 -49
-203 -175
– of which acquisitions -49 -47 -192 -169 Operating profit 352 11.6 260 9.1 1,161 9.9 910 9.0
ADDTECH AB (PUBL.) YEAR-END REPORT 1 APRIL 2019 – 31 MARCH 2020 15
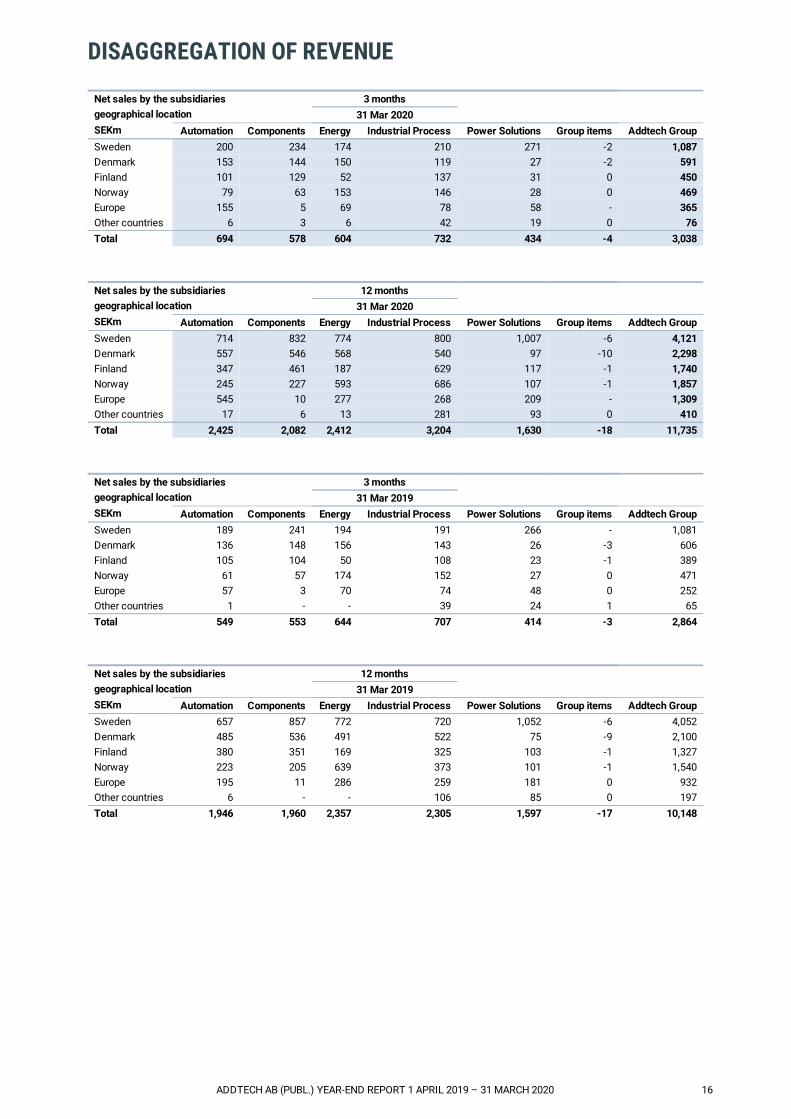
DISAGGREGATION OF REVENUE Net sales by the subsidiariesgeographical location
3 months 31 Mar 2020
SEKm Automation Components Energy Industrial Process Power Solutions Group items Addtech GroupSweden 200 234 174 210 271 -2 1,087Denmark 153 144 150 119 27 -2 591Finland 101 129 52 137 31 0 450Norway 79 63 153 146 28 0 469Europe 155 5 69 78 58 - 365Other countries 6 3 6 42 19 0 76Total 694 578 604 732 434 -4 3,038
Net sales by the subsidiariesgeographical location
12 months 31 Mar 2020
SEKm Automation Components Energy Industrial Process Power Solutions Group items Addtech GroupSweden 714 832 774 800 1,007 -6 4,121Denmark 557 546 568 540 97 -10 2,298Finland 347 461 187 629 117 -1 1,740Norway 245 227 593 686 107 -1 1,857Europe 545 10 277 268 209 - 1,309Other countries 17 6 13 281 93 0 410Total 2,425 2,082 2,412 3,204 1,630 -18 11,735
Net sales by the subsidiariesgeographical location
3 months 31 Mar 2019
SEKm Automation Components Energy Industrial Process Power Solutions Group items Addtech GroupSweden 189 241 194 191 266 - 1,081Denmark 136 148 156 143 26 -3 606Finland 105 104 50 108 23 -1 389Norway 61 57 174 152 27 0 471Europe 57 3 70 74 48 0 252Other countries 1 - - 39 24 1 65Total 549 553 644 707 414 -3 2,864
Net sales by the subsidiariesgeographical location
12 months 31 Mar 2019
SEKm Automation Components Energy Industrial Process Power Solutions Group items Addtech GroupSweden 657 857 772 720 1,052 -6 4,052Denmark 485 536 491 522 75 -9 2,100Finland 380 351 169 325 103 -1 1,327Norway 223 205 639 373 101 -1 1,540Europe 195 11 286 259 181 0 932Other countries 6 - - 106 85 0 197Total 1,946 1,960 2,357 2,305 1,597 -17 10,148
ADDTECH AB (PUBL.) YEAR-END REPORT 1 APRIL 2019 – 31 MARCH 2020 16
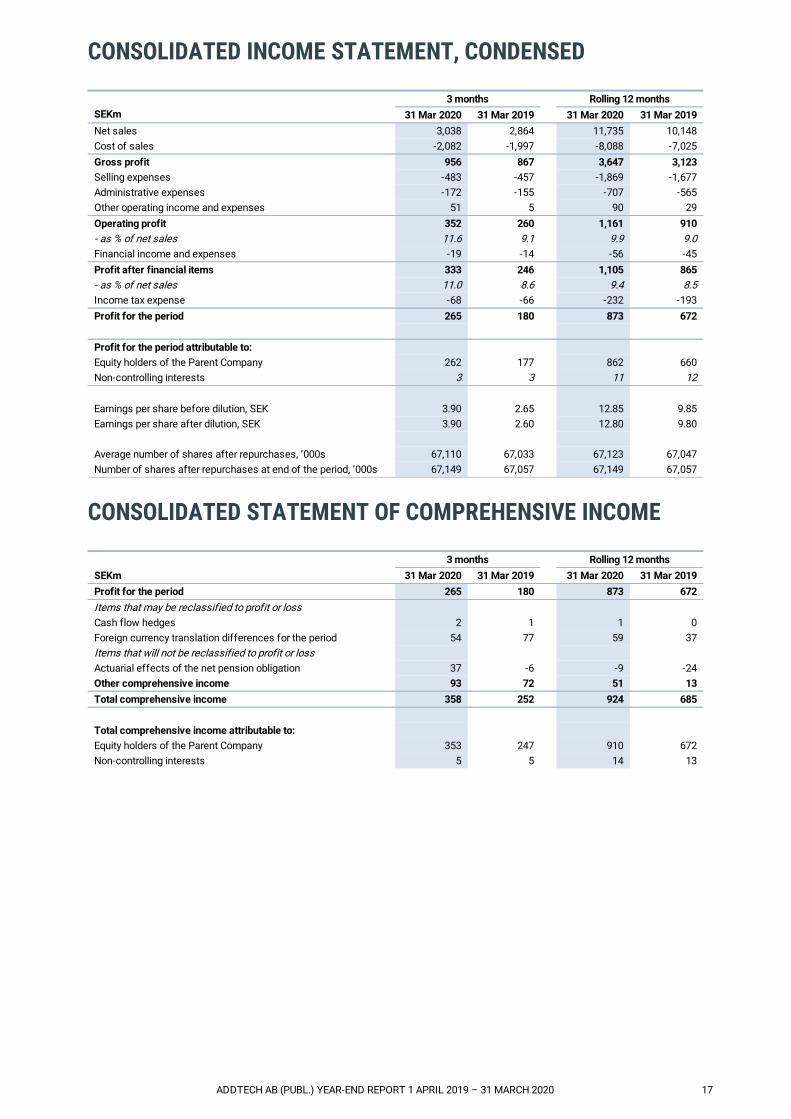
CONSOLIDATED INCOME STATEMENT, CONDENSED 3 months Rolling 12 monthsSEKm 31 Mar 2020 31 Mar 2019 31 Mar 2020 31 Mar 2019Net sales 3,038 2,864 11,735 10,148Cost of sales -2,082 -1,997 -8,088 -7,025Gross profit 956 867 3,647 3,123Selling expenses -483 -457 -1,869 -1,677Administrative expenses -172 -155 -707 -565Other operating income and expenses 51 5 90 29Operating profit 352 260 1,161 910- as % of net sales 11.6 9.1 9.9 9.0Financial income and expenses -19 -14 -56 -45Profit after financial items 333 246 1,105 865- as % of net sales 11.0 8.6 9.4 8.5Income tax expense -68 -66 -232 -193Profit for the period 265 180 873 672 Profit for the period attributable to: Equity holders of the Parent Company 262 177 862 660Non-controlling interests 3 3 11 12 Earnings per share before dilution, SEK 3.90 2.65 12.85 9.85Earnings per share after dilution, SEK 3.90 2.60 12.80 9.80 Average number of shares after repurchases, ’000s 67,110 67,033 67,123 67,047Number of shares after repurchases at end of the period, ’000s 67,149 67,057 67,149 67,057
CONSOLIDATED STATEMENT OF COMPREHENSIVE INCOME 3 months Rolling 12 monthsSEKm 31 Mar 2020 31 Mar 2019 31 Mar 2020 31 Mar 2019Profit for the period 265 180 873 672Items that may be reclassified to profit or loss Cash flow hedges 2 1 1 0Foreign currency translation differences for the period 54 77 59 37Items that will not be reclassified to profit or loss Actuarial effects of the net pension obligation 37 -6 -9 -24Other comprehensive income 93 72 51 13Total comprehensive income 358 252 924 685 Total comprehensive income attributable to: Equity holders of the Parent Company 353 247 910 672Non-controlling interests 5 5 14 13
ADDTECH AB (PUBL.) YEAR-END REPORT 1 APRIL 2019 – 31 MARCH 2020 17
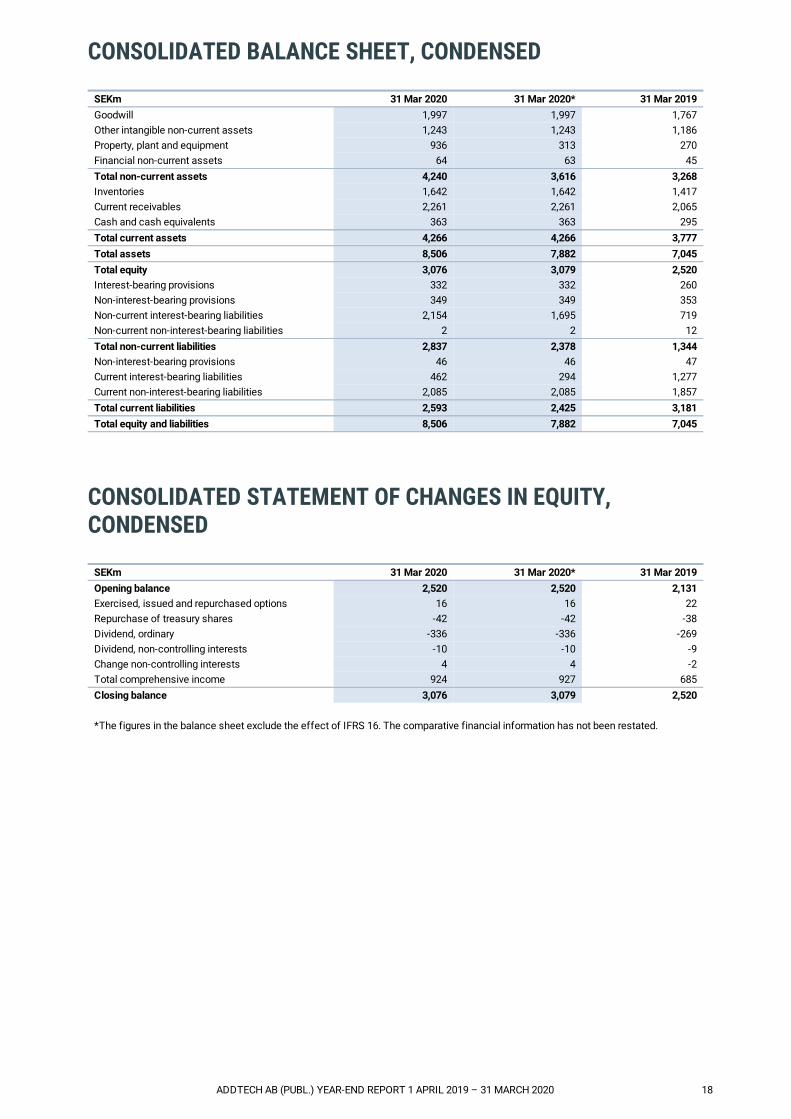
CONSOLIDATED BALANCE SHEET, CONDENSED SEKm 31 Mar 2020 31 Mar 2020* 31 Mar 2019Goodwill 1,997 1,997 1,767Other intangible non-current assets 1,243 1,243 1,186Property, plant and equipment 936 313 270Financial non-current assets 64 63 45Total non-current assets 4,240 3,616 3,268Inventories 1,642 1,642 1,417Current receivables 2,261 2,261 2,065Cash and cash equivalents 363 363 295Total current assets 4,266 4,266 3,777Total assets 8,506 7,882 7,045Total equity 3,076 3,079 2,520Interest-bearing provisions 332 332 260Non-interest-bearing provisions 349 349 353Non-current interest-bearing liabilities 2,154 1,695 719Non-current non-interest-bearing liabilities 2 2 12Total non-current liabilities 2,837 2,378 1,344Non-interest-bearing provisions 46 46 47Current interest-bearing liabilities 462 294 1,277Current non-interest-bearing liabilities 2,085 2,085 1,857Total current liabilities 2,593 2,425 3,181Total equity and liabilities 8,506 7,882 7,045
CONSOLIDATED STATEMENT OF CHANGES IN EQUITY,CONDENSED
SEKm 31 Mar 2020 31 Mar 2020* 31 Mar 2019Opening balance 2,520 2,520 2,131Exercised, issued and repurchased options 16 16 22Repurchase of treasury shares -42 -42 -38Dividend, ordinary -336 -336 -269Dividend, non-controlling interests -10 -10 -9Change non-controlling interests 4 4 -2Total comprehensive income 924 927 685Closing balance 3,076 3,079 2,520
*The figures in the balance sheet exclude the effect of IFRS 16. The comparative financial information has not been restated.
ADDTECH AB (PUBL.) YEAR-END REPORT 1 APRIL 2019 – 31 MARCH 2020 18
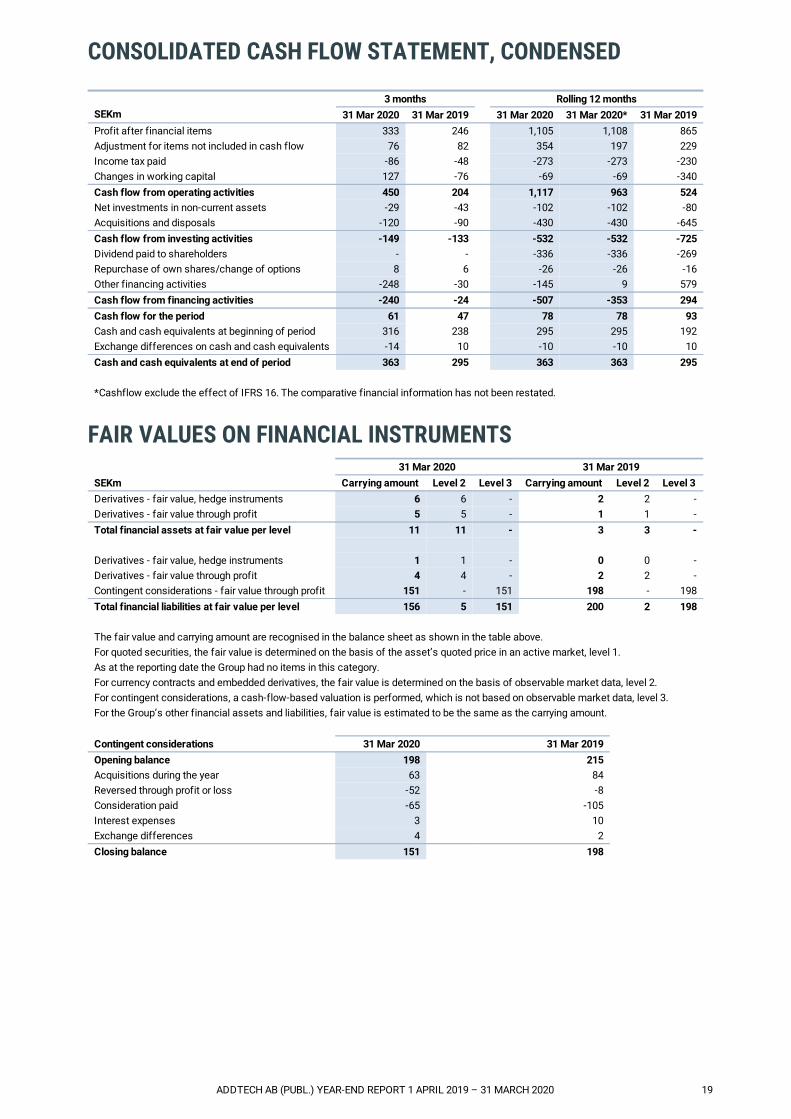
CONSOLIDATED CASH FLOW STATEMENT, CONDENSED 3 months Rolling 12 monthsSEKm 31 Mar 2020 31 Mar 2019 31 Mar 2020 31 Mar 2020* 31 Mar 2019Profit after financial items 333 246 1,105 1,108 865Adjustment for items not included in cash flow 76 82 354 197 229Income tax paid -86 -48 -273 -273 -230Changes in working capital 127 -76 -69 -69 -340Cash flow from operating activities 450 204 1,117 963 524Net investments in non-current assets -29 -43 -102 -102 -80Acquisitions and disposals -120 -90 -430 -430 -645Cash flow from investing activities -149 -133 -532 -532 -725Dividend paid to shareholders - - -336 -336 -269Repurchase of own shares/change of options 8 6 -26 -26 -16Other financing activities -248 -30 -145 9 579Cash flow from financing activities -240 -24 -507 -353 294Cash flow for the period 61 47 78 78 93Cash and cash equivalents at beginning of period 316 238 295 295 192Exchange differences on cash and cash equivalents -14 10 -10 -10 10Cash and cash equivalents at end of period 363 295 363 363 295
*Cashflow exclude the effect of IFRS 16. The comparative financial information has not been restated.
FAIR VALUES ON FINANCIAL INSTRUMENTS 31 Mar 2020 31 Mar 2019SEKm Carrying amount Level 2 Level 3 Carrying amount Level 2 Level 3Derivatives - fair value, hedge instruments 6 6 - 2 2 -Derivatives - fair value through profit 5 5 - 1 1 -Total financial assets at fair value per level 11 11 - 3 3 - Derivatives - fair value, hedge instruments 1 1 - 0 0 -Derivatives - fair value through profit 4 4 - 2 2 -Contingent considerations - fair value through profit 151 - 151 198 - 198Total financial liabilities at fair value per level 156 5 151 200 2 198 The fair value and carrying amount are recognised in the balance sheet as shown in the table above. For quoted securities, the fair value is determined on the basis of the asset’s quoted price in an active market, level 1. As at the reporting date the Group had no items in this category. For currency contracts and embedded derivatives, the fair value is determined on the basis of observable market data, level 2. For contingent considerations, a cash-flow-based valuation is performed, which is not based on observable market data, level 3. For the Group’s other financial assets and liabilities, fair value is estimated to be the same as the carrying amount. Contingent considerations 31 Mar 2020 31 Mar 2019 Opening balance 198 215 Acquisitions during the year 63 84 Reversed through profit or loss -52 -8 Consideration paid -65 -105 Interest expenses 3 10 Exchange differences 4 2 Closing balance 151 198
ADDTECH AB (PUBL.) YEAR-END REPORT 1 APRIL 2019 – 31 MARCH 2020 19
KEY FINANCIAL INDICATORS 12 months ending
31 Mar
202031 Mar2020*
31 Mar2019
31 Mar2018
31 Mar2017
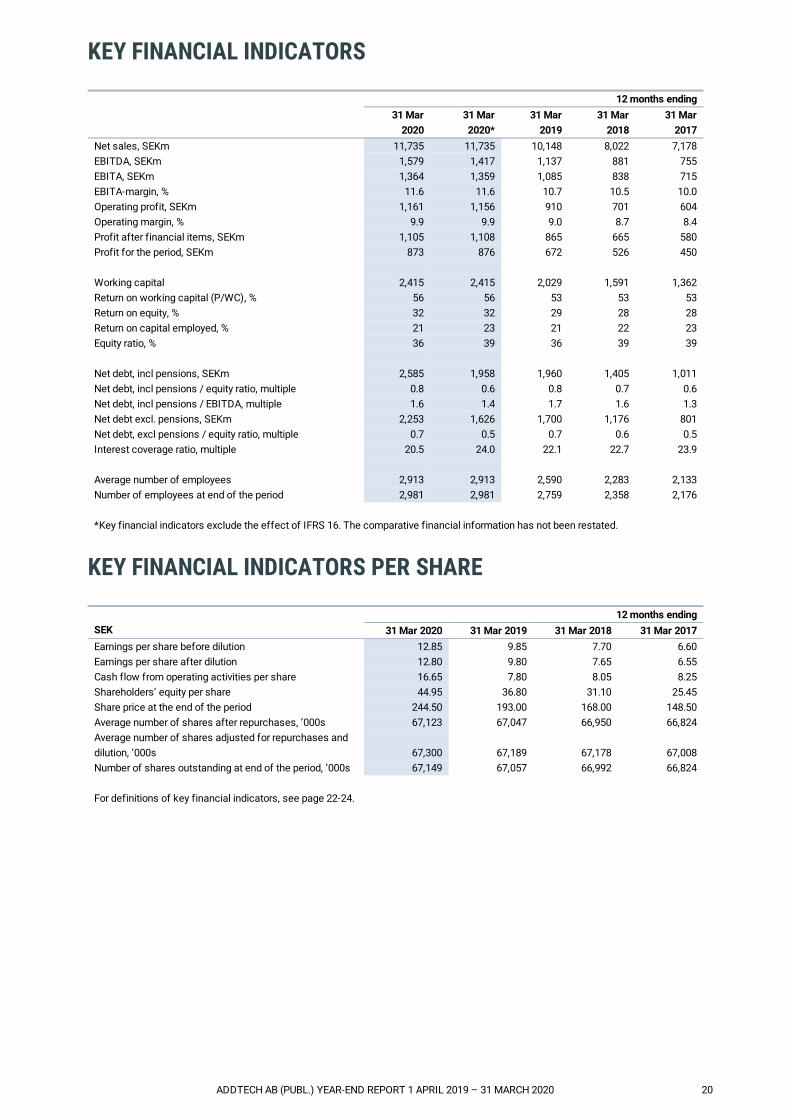
Net sales, SEKm 11,735 11,735 10,148 8,022 7,178EBITDA, SEKm 1,579 1,417 1,137 881 755EBITA, SEKm 1,364 1,359 1,085 838 715EBITA-margin, % 11.6 11.6 10.7 10.5 10.0Operating profit, SEKm 1,161 1,156 910 701 604Operating margin, % 9.9 9.9 9.0 8.7 8.4Profit after financial items, SEKm 1,105 1,108 865 665 580Profit for the period, SEKm 873 876 672 526 450 Working capital 2,415 2,415 2,029 1,591 1,362Return on working capital (P/WC), % 56 56 53 53 53Return on equity, % 32 32 29 28 28Return on capital employed, % 21 23 21 22 23Equity ratio, % 36 39 36 39 39 Net debt, incl pensions, SEKm 2,585 1,958 1,960 1,405 1,011Net debt, incl pensions / equity ratio, multiple 0.8 0.6 0.8 0.7 0.6Net debt, incl pensions / EBITDA, multiple 1.6 1.4 1.7 1.6 1.3Net debt excl. pensions, SEKm 2,253 1,626 1,700 1,176 801Net debt, excl pensions / equity ratio, multiple 0.7 0.5 0.7 0.6 0.5Interest coverage ratio, multiple 20.5 24.0 22.1 22.7 23.9 Average number of employees 2,913 2,913 2,590 2,283 2,133Number of employees at end of the period 2,981 2,981 2,759 2,358 2,176 *Key financial indicators exclude the effect of IFRS 16. The comparative financial information has not been restated.
KEY FINANCIAL INDICATORS PER SHARE 12 months endingSEK 31 Mar 2020 31 Mar 2019 31 Mar 2018 31 Mar 2017Earnings per share before dilution 12.85 9.85 7.70 6.60Earnings per share after dilution 12.80 9.80 7.65 6.55Cash flow from operating activities per share 16.65 7.80 8.05 8.25Shareholders’ equity per share 44.95 36.80 31.10 25.45Share price at the end of the period 244.50 193.00 168.00 148.50Average number of shares after repurchases, ’000s 67,123 67,047 66,950 66,824Average number of shares adjusted for repurchases anddilution, ’000s 67,300 67,189 67,178 67,008Number of shares outstanding at end of the period, ’000s 67,149 67,057 66,992 66,824 For definitions of key financial indicators, see page 22-24.
ADDTECH AB (PUBL.) YEAR-END REPORT 1 APRIL 2019 – 31 MARCH 2020 20
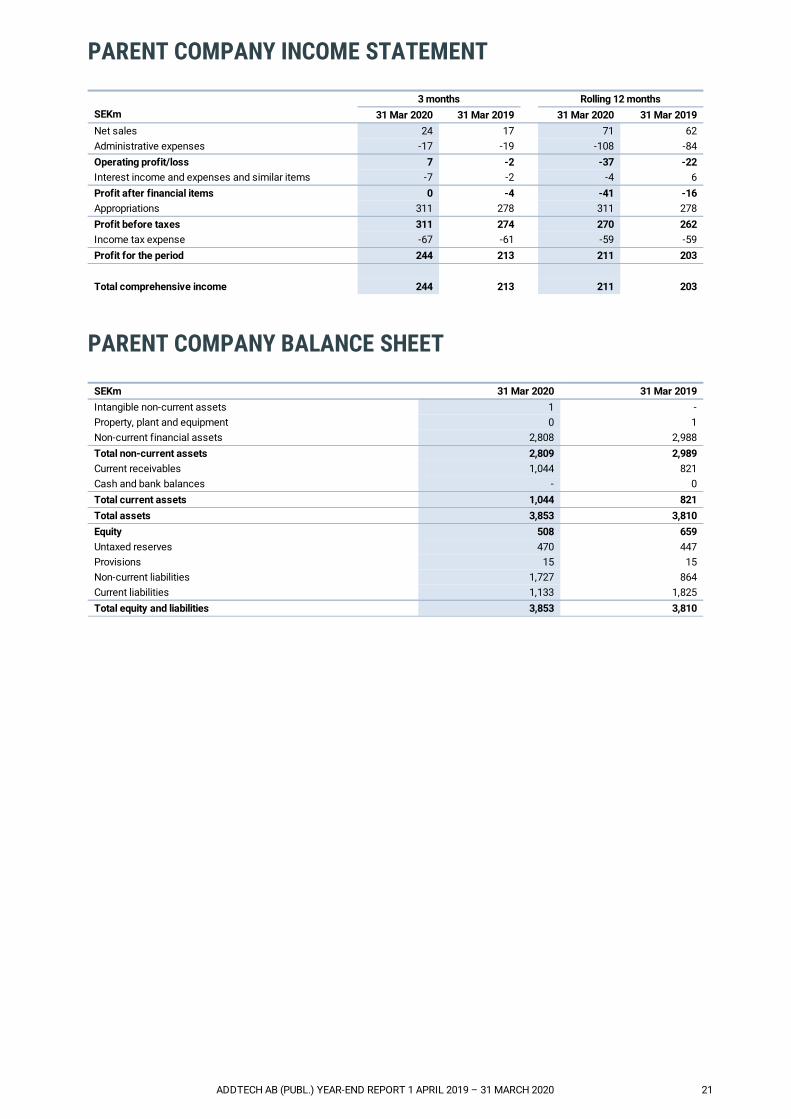
PARENT COMPANY INCOME STATEMENT 3 months Rolling 12 monthsSEKm 31 Mar 2020 31 Mar 2019 31 Mar 2020 31 Mar 2019Net sales 24 17 71 62Administrative expenses -17 -19 -108 -84Operating profit/loss 7 -2 -37 -22Interest income and expenses and similar items -7 -2 -4 6Profit after financial items 0 -4 -41 -16Appropriations 311 278 311 278Profit before taxes 311 274 270 262Income tax expense -67 -61 -59 -59Profit for the period 244 213 211 203 Total comprehensive income 244 213 211 203
PARENT COMPANY BALANCE SHEET SEKm 31 Mar 2020 31 Mar 2019Intangible non-current assets 1 -Property, plant and equipment 0 1Non-current financial assets 2,808 2,988Total non-current assets 2,809 2,989Current receivables 1,044 821Cash and bank balances - 0Total current assets 1,044 821Total assets 3,853 3,810Equity 508 659Untaxed reserves 470 447Provisions 15 15Non-current liabilities 1,727 864Current liabilities 1,133 1,825Total equity and liabilities 3,853 3,810
ADDTECH AB (PUBL.) YEAR-END REPORT 1 APRIL 2019 – 31 MARCH 2020 21
DEFINITIONS
Return on equity²Earnings after tax divided by equity. The components are calculated as the average of the last 12 months.Return on equity measures the return generated on owners’ invested capital.
Return on working capital (P/WC)¹EBITA divided by working capital.P/WC is used to analyse profitability and is a measure that encourages high EBITA and low working capitalrequirements, see the reconciliation table on page 25.
Return on capital employed¹Profit before tax plus financial expenses as a percentage of capital employed. The components are calculated asthe average of the last 12 months.Return on capital employed shows the Group’s profitability in relation to externally financed capital and equity, seethe reconciliation table on page 25.
EBITA¹Operating profit before amortisation of intangible assets.EBITA is used to analyse the profitability generated by operating activities, see reconciliation table on page 25.
EBITA-margin¹EBITA as a percentage of net sales.EBITA margin is used to the show the degree of profitability in operating activities.
EBITDA¹Operating profit before depreciation and amortisation.EBITDA is used to analyse the profitability generated by operating activities, see reconciliation table on page 25.
Equity per share¹Equity divided by number of shares outstanding at the reporting period's end.This measures how much equity is attributable to each share and is published to make it easier for investors toconduct analyses and make decisions.
Financial net debt¹The net of interest-bearing debt and provisions minus cash and cash equivalents.Net debt is used to monitor changes in debt, analyse the Group indebtedness and its ability to repay its debts usingliquid funds generated from the Group’s operating activities if all debt fell due for repayment today and anynecessary refinancing.
Financial net debt/EBITDA¹Net financial debt divided by EBTIDA.Net financial debt compared with EBITDA provides a performance measure for net debt in relation to cash-generating earnings in the business, i.e. it gives an indication of the business’ ability to repay its debts. Thismeasure is generally used by financial institutions to measure creditworthiness.
Financial items¹Finance income minus finance costs.Used to describe changes in the Group’s financial activities.
Acquired growth¹Changes in net sales attributable to business acquisitions compared with the same period last year.Acquired growth is used as a component to describe the change in consolidated net sales in which acquiredgrowth is distinguished from organic growth, divestments and exchange rate effects, see reconciliation table onpage 25.
ADDTECH AB (PUBL.) YEAR-END REPORT 1 APRIL 2019 – 31 MARCH 2020 22
Cash flow from operating activities per share¹Cash flow from operating activities, divided by the average number of outstanding shares after repurchase.This measure is used so investors can easily analyse the size of the surplus generated per share from operatingactivities.
Net investments in non-current assets¹Investments in non-current assets minus sales of non-current assets.This measure is used to analyse the Group’s investments in renewing and developing property, plant andequipment.
Net debt excluding pensions¹The net of interest-bearing debt and provisions excluding pensions minus cash and cash equivalents.A measure used to analyse financial risk, see reconciliation table on page 25.
Net debt excluding pensions/ equity ratio¹ ²Net debt excluding pensions divided by shareholders' equity.A measure used to analyse financial risk, see reconciliation table on page 25.
Organic growth¹Changes in net sales excluding currency effects, acquisitions and divestments compared with the same period lastyear.Organic growth is used to analyse underlying sales growth driven a change in volumes, product range and price forsimilar products between different periods, see reconciliation table on page 25.
Profit after financial items¹Profit/loss for the period before tax.Used to analyse the business’ profitability including financial activities.
Earnings per share (EPS)Shareholders’ share of profit for the period after tax, divided by the weighted average number of shares during theperiod. Performance measures under IFRS.
Earnings per share (EPS), dilutedShareholders’ share of profit for the period after tax, divided by the weighted average number of shares during theperiod, adjusted for the additional number of shares in the event of outstanding options being used.
Interest coverage ratio¹Earnings after net financial items plus interest expense and bank charges divided by interest expense and bankcharges.This performance indicator measures the Group’s capacity through its business operations and finance income togenerate a sufficiently large surplus to cover its finance costs, see reconciliation table on page 25.
Working capital¹Working capital (WC) is measured through an annual average defined as inventories plus accounts receivable lessaccounts payable.Working capital is used to analyse how much working capital is tied up in the business, see reconciliation table onpage 25.
Operating margin¹Operating profit as a percentage of net sales.This measure is used to specify the percentage of sales that is left to cover interest and tax, and to provide a profit,after the company’s costs have been paid.
Operating profit¹Operating income minus operating expenses.Used to describe the Group’s earnings before interest and tax.
ADDTECH AB (PUBL.) YEAR-END REPORT 1 APRIL 2019 – 31 MARCH 2020 23
Debt/equity ratio¹ ²Financial net liabilities divided by equity.A measure used to analyse financial risk.
Equity ratio¹ ²Equity as a percentage of total assets.The equity/assets ratio is used to analyse financial risk and show the percentage of assets that are funded withequity.
Capital employed¹Total assets minus non-interest-bearing liabilities and provisions.Capital employed shows the size of the company’s assets that have been lent to the company’s owners or thathave been lent out by lenders, see reconciliation table on page 25.
Outstanding sharesTotal number of shares less treasury shares repurchased by the Company.
¹The performance measure is an alternative performance measure according to ESMA’s guidelines.²Minority interest is included in equity when the performance measures are calculated.
ADDTECH AB (PUBL.) YEAR-END REPORT 1 APRIL 2019 – 31 MARCH 2020 24
RECONCILIATION TABLES ALTERNATIVE PERFORMANCEMEASURES
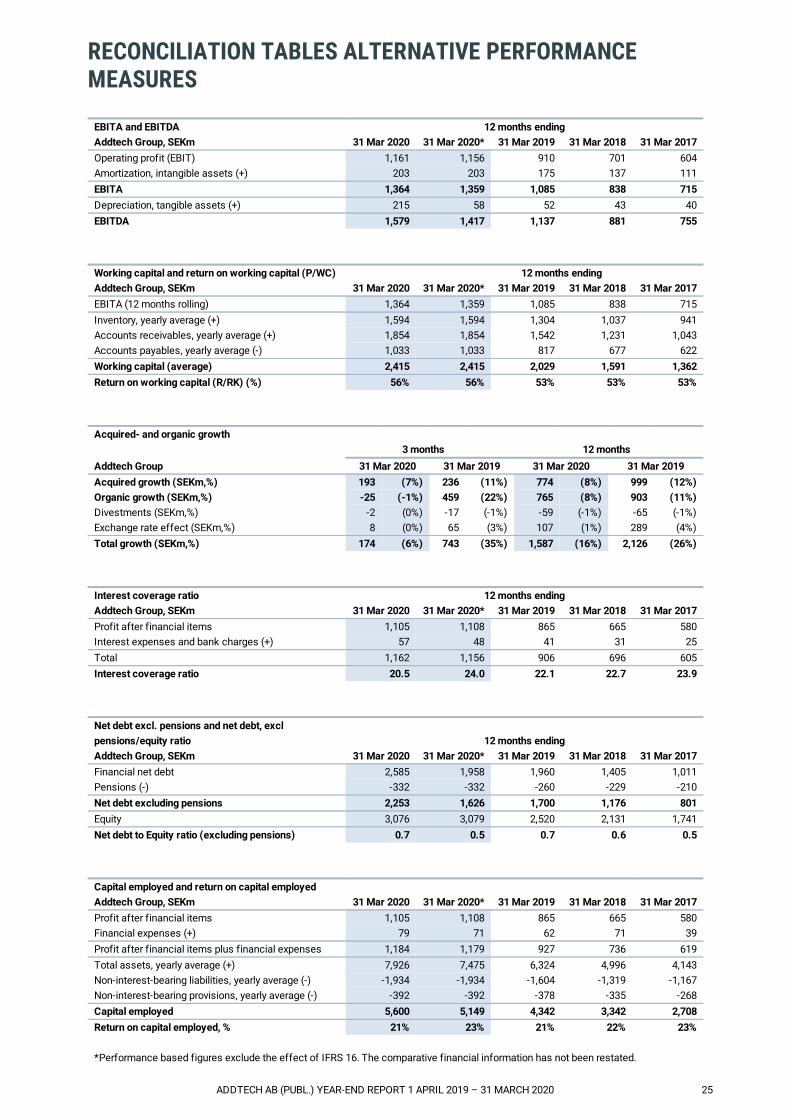
EBITA and EBITDA 12 months endingAddtech Group, SEKm 31 Mar 2020 31 Mar 2020* 31 Mar 2019 31 Mar 2018 31 Mar 2017Operating profit (EBIT) 1,161 1,156 910 701 604Amortization, intangible assets (+) 203 203 175 137 111EBITA 1,364 1,359 1,085 838 715Depreciation, tangible assets (+) 215 58 52 43 40EBITDA 1,579 1,417 1,137 881 755
Working capital and return on working capital (P/WC) 12 months ending Addtech Group, SEKm 31 Mar 2020 31 Mar 2020* 31 Mar 2019 31 Mar 2018 31 Mar 2017EBITA (12 months rolling) 1,364 1,359 1,085 838 715Inventory, yearly average (+) 1,594 1,594 1,304 1,037 941Accounts receivables, yearly average (+) 1,854 1,854 1,542 1,231 1,043Accounts payables, yearly average (-) 1,033 1,033 817 677 622Working capital (average) 2,415 2,415 2,029 1,591 1,362Return on working capital (R/RK) (%) 56% 56% 53% 53% 53%
Acquired- and organic growth 3 months 12 months Addtech Group 31 Mar 2020 31 Mar 2019 31 Mar 2020 31 Mar 2019Acquired growth (SEKm,%) 193 (7%) 236 (11%) 774 (8%) 999 (12%)Organic growth (SEKm,%) -25 (-1%) 459 (22%) 765 (8%) 903 (11%)Divestments (SEKm,%) -2 (0%) -17 (-1%) -59 (-1%) -65 (-1%)Exchange rate effect (SEKm,%) 8 (0%) 65 (3%) 107 (1%) 289 (4%)Total growth (SEKm,%) 174 (6%) 743 (35%) 1,587 (16%) 2,126 (26%)
Interest coverage ratio 12 months endingAddtech Group, SEKm 31 Mar 2020 31 Mar 2020* 31 Mar 2019 31 Mar 2018 31 Mar 2017Profit after financial items 1,105 1,108 865 665 580Interest expenses and bank charges (+) 57 48 41 31 25Total 1,162 1,156 906 696 605Interest coverage ratio 20.5 24.0 22.1 22.7 23.9
Net debt excl. pensions and net debt, exclpensions/equity ratio 12 months endingAddtech Group, SEKm 31 Mar 2020 31 Mar 2020* 31 Mar 2019 31 Mar 2018 31 Mar 2017Financial net debt 2,585 1,958 1,960 1,405 1,011Pensions (-) -332 -332 -260 -229 -210Net debt excluding pensions 2,253 1,626 1,700 1,176 801Equity 3,076 3,079 2,520 2,131 1,741Net debt to Equity ratio (excluding pensions) 0.7 0.5 0.7 0.6 0.5
Capital employed and return on capital employed Addtech Group, SEKm 31 Mar 2020 31 Mar 2020* 31 Mar 2019 31 Mar 2018 31 Mar 2017Profit after financial items 1,105 1,108 865 665 580Financial expenses (+) 79 71 62 71 39Profit after financial items plus financial expenses 1,184 1,179 927 736 619Total assets, yearly average (+) 7,926 7,475 6,324 4,996 4,143Non-interest-bearing liabilities, yearly average (-) -1,934 -1,934 -1,604 -1,319 -1,167Non-interest-bearing provisions, yearly average (-) -392 -392 -378 -335 -268Capital employed 5,600 5,149 4,342 3,342 2,708Return on capital employed, % 21% 23% 21% 22% 23%
*Performance based figures exclude the effect of IFRS 16. The comparative financial information has not been restated.
ADDTECH AB (PUBL.) YEAR-END REPORT 1 APRIL 2019 – 31 MARCH 2020 25
This is AddtechAddtech is a Swedish, listed technology trading group that combines the flexibility and speed of a small companywith the resources of a large company. We acquire, own and develop independent subsidiaries that sell varioushigh-tech products and solutions to customers, primarily within industry and infrastructure. With in-depth expertisein a number of different niches, our subsidiaries generate added technical, financial and sustainable value forcustomers and suppliers alike, thus helping increase the efficiency and competitiveness of all involved. Wecurrently own some 130 companies in 20 countries, and have a long history of sustainable, profitable growth.
Our vision
We are to be a leader in value-adding technology trading, perceived as the most skilled and long-term partner of ourcustomers, suppliers and employees.
Business concept in brief
Addtech offers high-tech products and solutions for companies in the manufacturing and infrastructure sectors.Addtech contributes added technical and financial value by being a skilled and professional partner for customersand manufacturers.
We build shareholder value through:
ADDTECH AB (PUBL.) Org.nr: 556302-9726, Box 5112, 102 43 Stockholm, Visiting address: Birger Jarlsgatan 43 Tel:+46 8 470 49 00, [email protected]
our 130 subsidiaries and their capacity to generate earnings growth○
corporate governance that ensures the companies achieve even better results and development○
acquisitions that bring in new employees, customers and suppliers○
ADDTECH AB (PUBL.) YEAR-END REPORT 1 APRIL 2019 – 31 MARCH 2020 26