Embed Size (px)
Citation preview
43
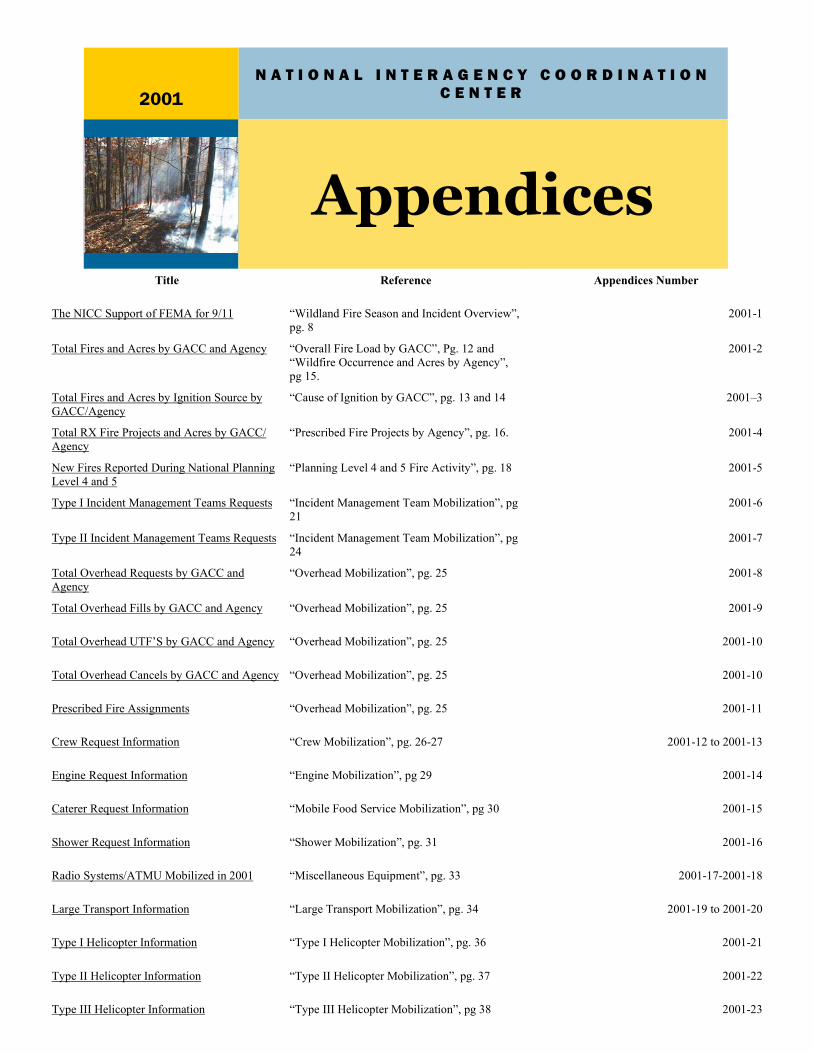
N A T I O N A L I N T E R A G E N C Y C O O R D I N A T I O N C E N T E R
2001
Appendices Title Reference Appendices Number
The NICC Support of FEMA for 9/11 “Wildland Fire Season and Incident Overview”, pg. 8
2001-1
Total Fires and Acres by GACC and Agency “Overall Fire Load by GACC”, Pg. 12 and “Wildfire Occurrence and Acres by Agency”, pg 15.
2001-2
Total Fires and Acres by Ignition Source by GACC/Agency
“Cause of Ignition by GACC”, pg. 13 and 14 2001–3
Total RX Fire Projects and Acres by GACC/Agency
“Prescribed Fire Projects by Agency”, pg. 16. 2001-4
New Fires Reported During National Planning Level 4 and 5
“Planning Level 4 and 5 Fire Activity”, pg. 18 2001-5
Type I Incident Management Teams Requests “Incident Management Team Mobilization”, pg 21
2001-6
Type II Incident Management Teams Requests “Incident Management Team Mobilization”, pg 24
2001-7
Total Overhead Requests by GACC and Agency
“Overhead Mobilization”, pg. 25 2001-8
Total Overhead Fills by GACC and Agency “Overhead Mobilization”, pg. 25 2001-9
Total Overhead UTF’S by GACC and Agency “Overhead Mobilization”, pg. 25 2001-10
Total Overhead Cancels by GACC and Agency “Overhead Mobilization”, pg. 25 2001-10
Prescribed Fire Assignments “Overhead Mobilization”, pg. 25 2001-11
Crew Request Information “Crew Mobilization”, pg. 26-27 2001-12 to 2001-13
Engine Request Information “Engine Mobilization”, pg 29 2001-14
Caterer Request Information “Mobile Food Service Mobilization”, pg 30 2001-15
Shower Request Information “Shower Mobilization”, pg. 31 2001-16
Radio Systems/ATMU Mobilized in 2001 “Miscellaneous Equipment”, pg. 33 2001-17-2001-18
Large Transport Information “Large Transport Mobilization”, pg. 34 2001-19 to 2001-20
Type I Helicopter Information “Type I Helicopter Mobilization”, pg. 36 2001-21
Type II Helicopter Information “Type II Helicopter Mobilization”, pg. 37 2001-22
Type III Helicopter Information “Type III Helicopter Mobilization”, pg 38 2001-23

44
The NICC Support of FEMA For 9/11
Appendix 2001-1
This is a compiled summary of resources, equipment, and supplies dispatched to New York City and Wash-ington, D.C. (Pentagon) following the September 11, 2001 disasters.
1. Incident Management Team deployed to Washington (Pentagon): • Steve Gage’s Type 1 Team: 38 total personnel (mobilized 9/11)
2. Incident Management Teams deployed to New York City:
• Van Bateman’s Type 1 Team: 45 total personnel (mobilized 9/11) • Joe Stutler’s Type 1 Team: 50 total personnel (mobilized 9/13) • Mike Lohrey’s Type 1 Team: 11 total personnel (mobilized 9/23) • Joseph Stam’s Type 1 Team: 35 total personnel (mobilized 10/3)
3. Primary functions of each team:
Steve Gage’s Team was primarily involved in supporting search and rescue operations at the Penta-gon. The Team worked in conjunction with FEMA and search and rescue teams from around the country. It also provided coordination and logistical support directly to the Pentagon. The Team was released on September 26. Van Bateman’s Team was responsible for setting up and operating the mobilization, receiving and distribution center at the Jacob Javits Convention Center in Manhattan. Two trainee Type 1 Inter-agency Hotshot Crews (Midewin and Augusta) supported the Center’s operations. The Team also supported the Disaster Medical Assistance Team in urban search and rescue operations, and the New York City Fire Department’s incident command post. A geographical information system (GIS) team produced detailed maps for the search and rescue efforts. The Team was released on Oc-tober 14. Joe Stutler’s Team was based in Edison, New Jersey, and coordinated the movement of supplies, equipment, and personnel in support of the Disaster Field Office. The Team was split into three task forces, Warehouse, Operation Barge, and the Sheraton Hotel Incident Command Post. The task forces provided water transportation for equipment and personnel between Newark, NJ, and Man-hattan Island, fiscal and incident information guidance, and operated a 24-hour receiving and distri-bution center. The Team also provided vehicles and drivers to the New York City grief-counseling program. The Team was released on September 26. Mike Lohrey’s Team provided technical and management support to New York City emergency re-lief caches. The Team managed warehouses at Pier 36, and four distribution centers in New York City. The Team was released on October 20. Joseph Stam’s Team transitioned with Bateman’s team on October 13, and assumed that Team’s re-sponsibilities. The Team coordinated demobilization operations at the Jacob Javits Convention Cen-ter. The Team also provided incident planning support to the New York Fire Department and four-teen other cooperating agencies. The Team was released on November 8.
45
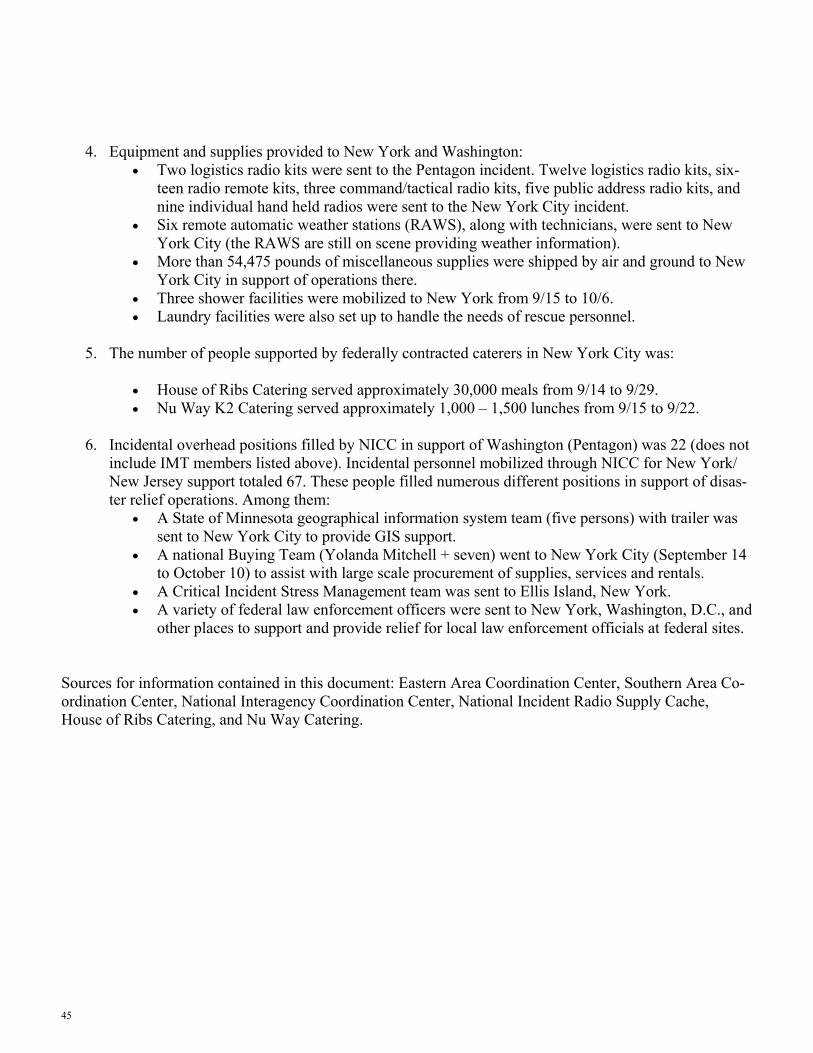
4. Equipment and supplies provided to New York and Washington:
• Two logistics radio kits were sent to the Pentagon incident. Twelve logistics radio kits, six-teen radio remote kits, three command/tactical radio kits, five public address radio kits, and nine individual hand held radios were sent to the New York City incident.
• Six remote automatic weather stations (RAWS), along with technicians, were sent to New York City (the RAWS are still on scene providing weather information).
• More than 54,475 pounds of miscellaneous supplies were shipped by air and ground to New York City in support of operations there.
• Three shower facilities were mobilized to New York from 9/15 to 10/6. • Laundry facilities were also set up to handle the needs of rescue personnel.
5. The number of people supported by federally contracted caterers in New York City was:
• House of Ribs Catering served approximately 30,000 meals from 9/14 to 9/29. • Nu Way K2 Catering served approximately 1,000 – 1,500 lunches from 9/15 to 9/22.
6. Incidental overhead positions filled by NICC in support of Washington (Pentagon) was 22 (does not
include IMT members listed above). Incidental personnel mobilized through NICC for New York/New Jersey support totaled 67. These people filled numerous different positions in support of disas-ter relief operations. Among them:
• A State of Minnesota geographical information system team (five persons) with trailer was sent to New York City to provide GIS support.
• A national Buying Team (Yolanda Mitchell + seven) went to New York City (September 14 to October 10) to assist with large scale procurement of supplies, services and rentals.
• A Critical Incident Stress Management team was sent to Ellis Island, New York. • A variety of federal law enforcement officers were sent to New York, Washington, D.C., and
other places to support and provide relief for local law enforcement officials at federal sites. Sources for information contained in this document: Eastern Area Coordination Center, Southern Area Co-ordination Center, National Interagency Coordination Center, National Incident Radio Supply Cache, House of Ribs Catering, and Nu Way Catering.
46
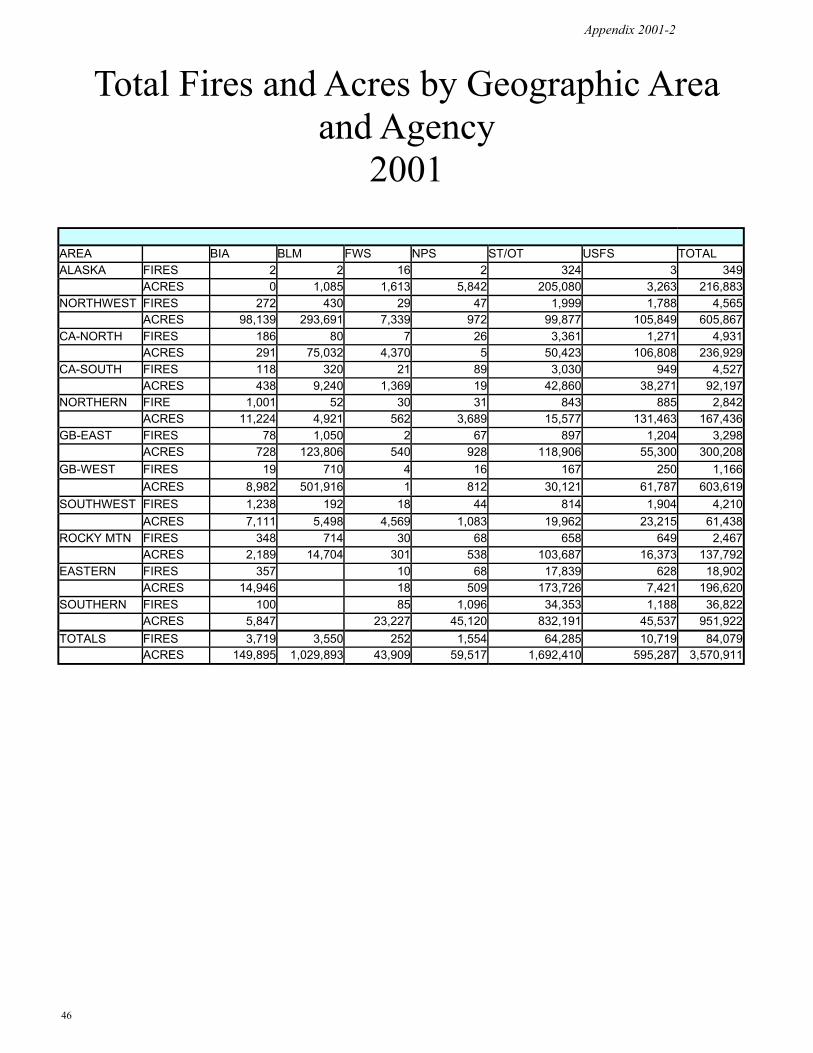
AREA BIA BLM FWS NPS ST/OT USFS TOTAL ALASKA FIRES 2 2 16 2 324 3 349
ACRES 0 1,085 1,613 5,842 205,080 3,263 216,883 NORTHWEST FIRES 272 430 29 47 1,999 1,788 4,565
ACRES 98,139 293,691 7,339 972 99,877 105,849 605,867 CA-NORTH FIRES 186 80 7 26 3,361 1,271 4,931
ACRES 291 75,032 4,370 5 50,423 106,808 236,929 CA-SOUTH FIRES 118 320 21 89 3,030 949 4,527
ACRES 438 9,240 1,369 19 42,860 38,271 92,197 NORTHERN FIRE 1,001 52 30 31 843 885 2,842
ACRES 11,224 4,921 562 3,689 15,577 131,463 167,436 GB-EAST FIRES 78 1,050 2 67 897 1,204 3,298
ACRES 728 123,806 540 928 118,906 55,300 300,208 GB-WEST FIRES 19 710 4 16 167 250 1,166
ACRES 8,982 501,916 1 812 30,121 61,787 603,619 SOUTHWEST FIRES 1,238 192 18 44 814 1,904 4,210
ACRES 7,111 5,498 4,569 1,083 19,962 23,215 61,438 ROCKY MTN FIRES 348 714 30 68 658 649 2,467
ACRES 2,189 14,704 301 538 103,687 16,373 137,792 EASTERN FIRES 357 10 68 17,839 628 18,902
ACRES 14,946 18 509 173,726 7,421 196,620 SOUTHERN FIRES 100 85 1,096 34,353 1,188 36,822
ACRES 5,847 23,227 45,120 832,191 45,537 951,922 TOTALS FIRES 3,719 3,550 252 1,554 64,285 10,719 84,079
ACRES 149,895 1,029,893 43,909 59,517 1,692,410 595,287 3,570,911
Total Fires and Acres by Geographic Area and Agency
2001
Appendix 2001-2

47
No. of Human Caused Fires Human Acres No. of Lightning Fires Lightning Acres GACC
320 206844 29 10039 AK 18743 196226 159 394 EA 1060 114996 2238 185212 EB
0 0 0 0 FC 4099 101240 832 135689 NO 1801 29981 1041 137455 NR 2160 98677 2405 507190 NW 770 75483 1697 62309 RM
34605 761605 2298 190667 SA 4135 85744 392 6453 SO 2096 20229 2114 41209 SW 277 57636 889 545983 WB
70066 1748661 14094 1822600 Totals
No. of Human Caused Fires Human Acres No. of Lightning Fires Lightning Acres Agency
2998 48684 721 101211 BIA 892 88464 2658 941429 BLM
3030 42860 0 0 CDF 310 118203 363 61324 CNTY
40 124527 6 3035 DDQ 181 16933 71 26976 FWS
0 0 0 0 IA 214 44814 1340 14703 NPS 105 225 10 74 OTHR
0 0 0 0 PRI 57448 1020141 3049 322306 ST 4848 243810 5876 351542 USFS
70066 1748661 14094 1822600 Total
Total Fires and Acres by Ignition Source and Geographic Area/Agency
2001
Appendix 2001-3
48
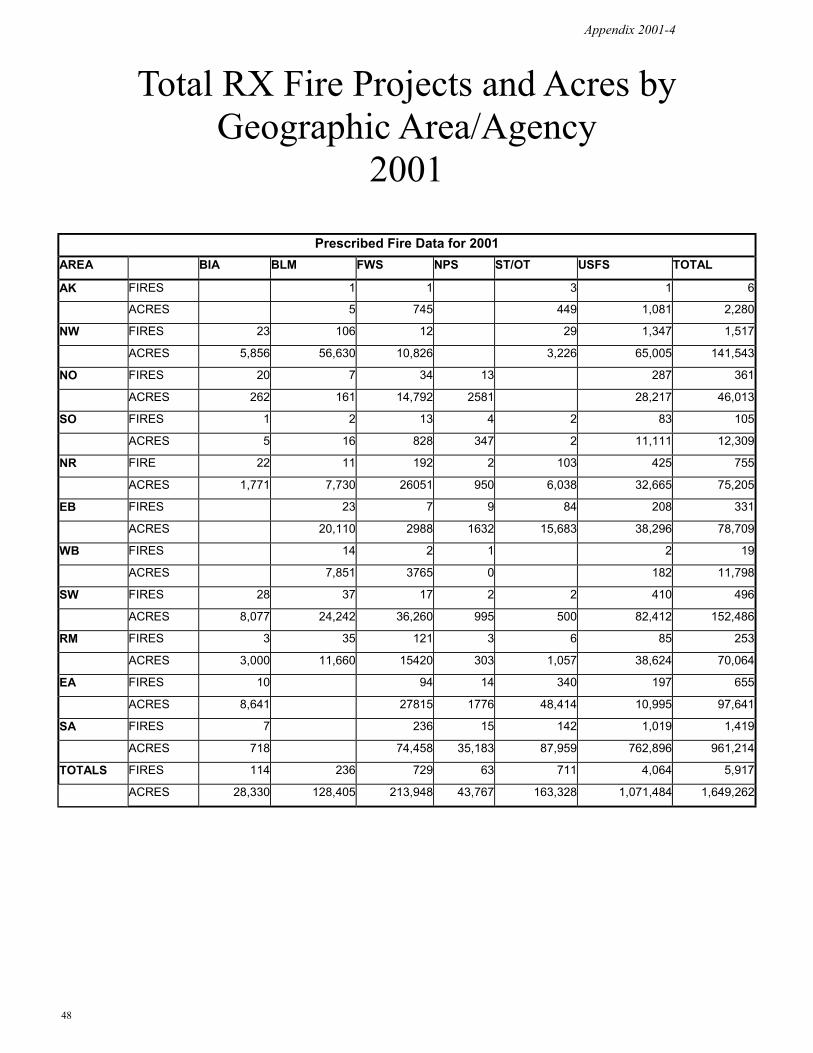
Total RX Fire Projects and Acres by Geographic Area/Agency
2001
Appendix 2001-4
AREA BIA BLM FWS NPS ST/OT USFS TOTAL
AK FIRES 1 1 3 1 6
ACRES 5 745 449 1,081 2,280
NW FIRES 23 106 12 29 1,347 1,517
ACRES 5,856 56,630 10,826 3,226 65,005 141,543
NO FIRES 20 7 34 13 287 361
ACRES 262 161 14,792 2581 28,217 46,013
SO FIRES 1 2 13 4 2 83 105
ACRES 5 16 828 347 2 11,111 12,309
NR FIRE 22 11 192 2 103 425 755
ACRES 1,771 7,730 26051 950 6,038 32,665 75,205
EB FIRES 23 7 9 84 208 331
ACRES 20,110 2988 1632 15,683 38,296 78,709
WB FIRES 14 2 1 2 19
ACRES 7,851 3765 0 182 11,798
SW FIRES 28 37 17 2 2 410 496
ACRES 8,077 24,242 36,260 995 500 82,412 152,486
RM FIRES 3 35 121 3 6 85 253
ACRES 3,000 11,660 15420 303 1,057 38,624 70,064
EA FIRES 10 94 14 340 197 655
ACRES 8,641 27815 1776 48,414 10,995 97,641
SA FIRES 7 236 15 142 1,019 1,419
ACRES 718 74,458 35,183 87,959 762,896 961,214
TOTALS FIRES 114 236 729 63 711 4,064 5,917
ACRES 28,330 128,405 213,948 43,767 163,328 1,071,484 1,649,262
Prescribed Fire Data for 2001
49
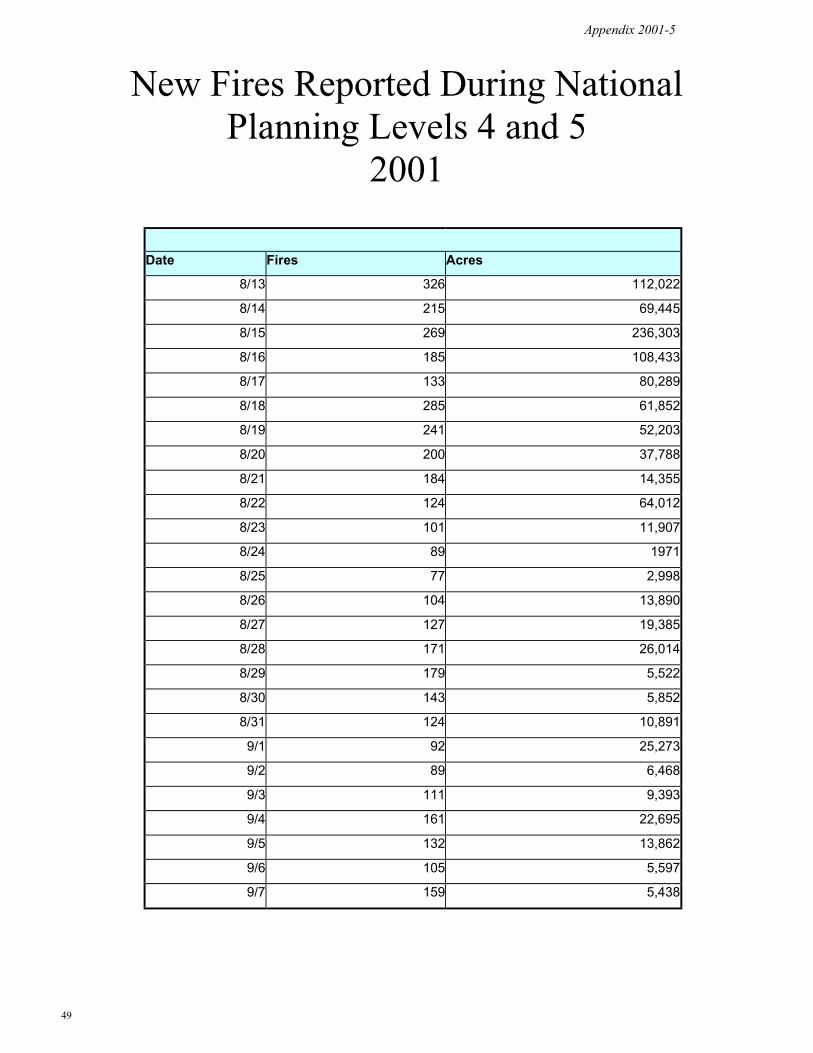
New Fires Reported During National Planning Levels 4 and 5
2001
Date Fires Acres
8/13 326 112,022
8/14 215 69,445
8/15 269 236,303
8/16 185 108,433
8/17 133 80,289
8/18 285 61,852
8/19 241 52,203
8/20 200 37,788
8/21 184 14,355
8/22 124 64,012
8/23 101 11,907
8/24 89 1971
8/25 77 2,998
8/26 104 13,890
8/27 127 19,385
8/28 171 26,014
8/29 179 5,522
8/30 143 5,852
8/31 124 10,891
9/1 92 25,273
9/2 89 6,468
9/3 111 9,393
9/4 161 22,695
9/5 132 13,862
9/6 105 5,597
9/7 159 5,438
Appendix 2001-5
50
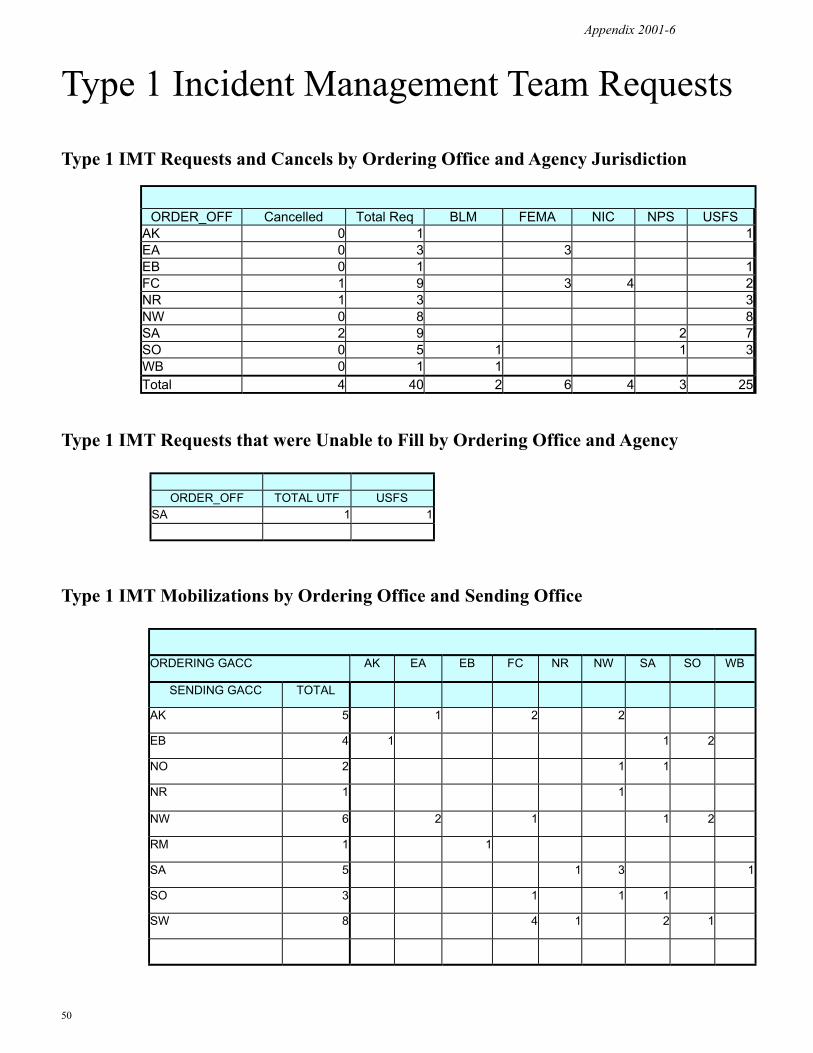
Type 1 Incident Management Team Requests
Type 1 IMT Requests and Cancels by Ordering Office and Agency Jurisdiction
ORDER_OFF Cancelled Total Req BLM FEMA NIC NPS USFS
AK 0 1 1 EA 0 3 3 EB 0 1 1 FC 1 9 3 4 2 NR 1 3 3 NW 0 8 8 SA 2 9 2 7 SO 0 5 1 1 3 WB 0 1 1 Total 4 40 2 6 4 3 25
ORDERING GACC AK EA EB FC NR NW SA SO WB
SENDING GACC TOTAL
AK 5 1 2 2
EB 4 1 1 2
NO 2 1 1
NR 1 1
NW 6 2 1 1 2
RM 1 1
SA 5 1 3 1
SO 3 1 1 1
SW 8 4 1 2 1
Type 1 IMT Mobilizations by Ordering Office and Sending Office
ORDER_OFF TOTAL UTF USFS
SA 1 1
Type 1 IMT Requests that were Unable to Fill by Ordering Office and Agency
Appendix 2001-6

51
Type 2 Incident Management Team Requests
Type 2 IMT Requests and Cancels by Ordering Office and Agency Jurisdiction
Type 2 IMT Mobilizations by Ordering Office and Sending Office
ORDERING GACC AK EA EB NR NW RM SA SO SW WB
SENDING GACC TOTAL
3 1 1 1
EA 2 1 1
EB 3 1 1 1
NR 7 1 2 2 1 1
NW 4 2 1 1
RM 2 2
SA 3 1 1 1
SO 6 1 3 1 1
SW 6 4 2
WB 1 1
ORDERING OFFICE CANCELLED TOTAL BLM FWS NPS ST USFS
AK 1 4 3 1
EA 1 2 2 EB 0 7 1 6
NR 0 7 7
NW 0 6 6
RM 0 2 1 1
SA 0 2 2 SO 0 1 1 SW 1 4 2 2
WB 1 2 2 Total Requests 3 2 6 3 23
Appendix 2001-7
52
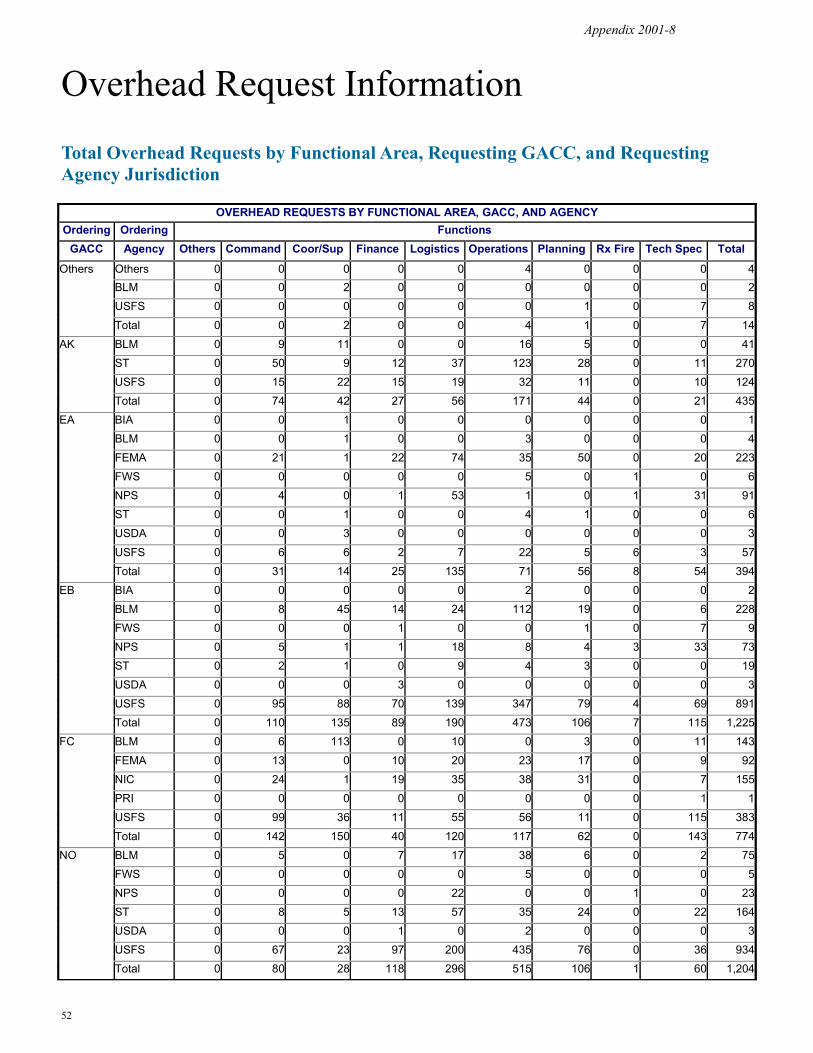
Overhead Request Information
Appendix 2001-8
OVERHEAD REQUESTS BY FUNCTIONAL AREA, GACC, AND AGENCY Ordering Ordering
GACC Agency Others Command Coor/Sup Finance Logistics Operations Planning Rx Fire Tech Spec Total Others Others 0 0 0 0 0 4 0 0 0 4
BLM 0 0 2 0 0 0 0 0 0 2
USFS 0 0 0 0 0 0 1 0 7 8
Total 0 0 2 0 0 4 1 0 7 14 AK BLM 0 9 11 0 0 16 5 0 0 41
ST 0 50 9 12 37 123 28 0 11 270
USFS 0 15 22 15 19 32 11 0 10 124
Total 0 74 42 27 56 171 44 0 21 435 EA BIA 0 0 1 0 0 0 0 0 0 1
BLM 0 0 1 0 0 3 0 0 0 4
FEMA 0 21 1 22 74 35 50 0 20 223
FWS 0 0 0 0 0 5 0 1 0 6
NPS 0 4 0 1 53 1 0 1 31 91
ST 0 0 1 0 0 4 1 0 0 6
USDA 0 0 3 0 0 0 0 0 0 3
USFS 0 6 6 2 7 22 5 6 3 57
Total 0 31 14 25 135 71 56 8 54 394 EB BIA 0 0 0 0 0 2 0 0 0 2
BLM 0 8 45 14 24 112 19 0 6 228
FWS 0 0 0 1 0 0 1 0 7 9
NPS 0 5 1 1 18 8 4 3 33 73
ST 0 2 1 0 9 4 3 0 0 19
USDA 0 0 0 3 0 0 0 0 0 3
USFS 0 95 88 70 139 347 79 4 69 891
Total 0 110 135 89 190 473 106 7 115 1,225 FC BLM 0 6 113 0 10 0 3 0 11 143
FEMA 0 13 0 10 20 23 17 0 9 92
NIC 0 24 1 19 35 38 31 0 7 155
PRI 0 0 0 0 0 0 0 0 1 1
USFS 0 99 36 11 55 56 11 0 115 383
Total 0 142 150 40 120 117 62 0 143 774 NO BLM 0 5 0 7 17 38 6 0 2 75
FWS 0 0 0 0 0 5 0 0 0 5
NPS 0 0 0 0 22 0 0 1 0 23
ST 0 8 5 13 57 35 24 0 22 164
USDA 0 0 0 1 0 2 0 0 0 3
USFS 0 67 23 97 200 435 76 0 36 934
Total 0 80 28 118 296 515 106 1 60 1,204
Functions
Total Overhead Requests by Functional Area, Requesting GACC, and Requesting Agency Jurisdiction
53
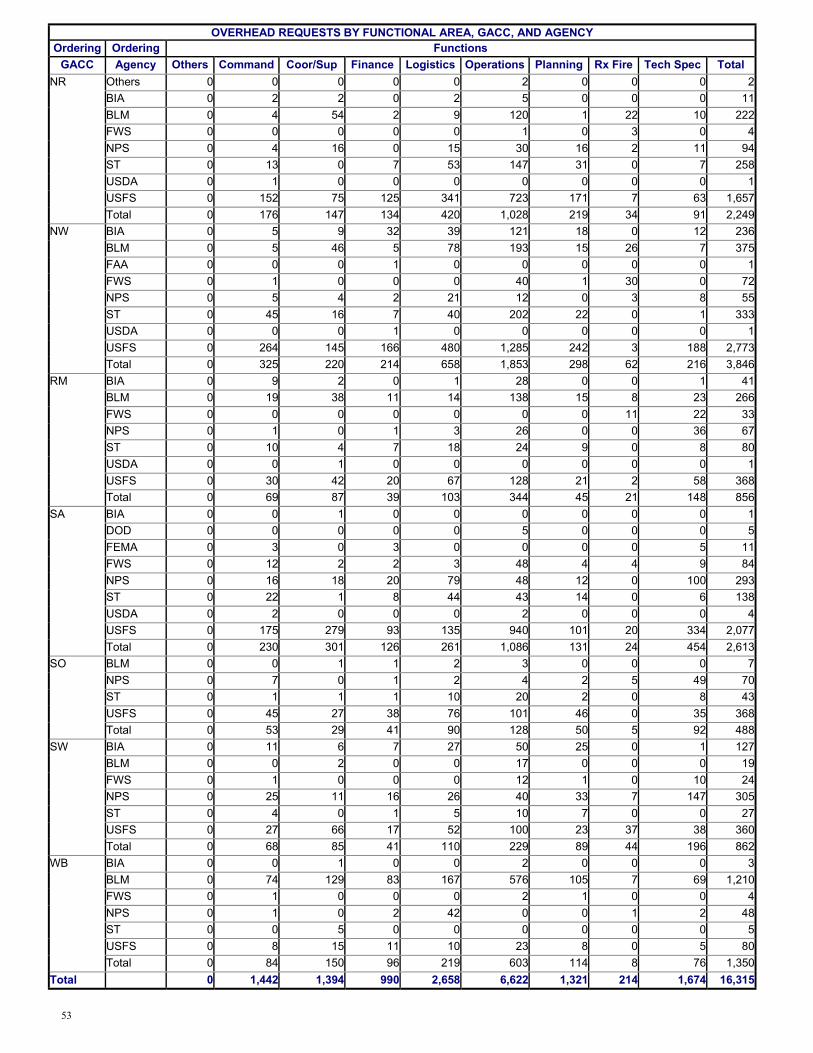
OVERHEAD REQUESTS BY FUNCTIONAL AREA, GACC, AND AGENCY Ordering Ordering Functions
GACC Agency Others Command Coor/Sup Finance Logistics Operations Planning Rx Fire Tech Spec Total NR Others 0 0 0 0 0 2 0 0 0 2
BIA 0 2 2 0 2 5 0 0 0 11 BLM 0 4 54 2 9 120 1 22 10 222 FWS 0 0 0 0 0 1 0 3 0 4 NPS 0 4 16 0 15 30 16 2 11 94 ST 0 13 0 7 53 147 31 0 7 258 USDA 0 1 0 0 0 0 0 0 0 1 USFS 0 152 75 125 341 723 171 7 63 1,657 Total 0 176 147 134 420 1,028 219 34 91 2,249
NW BIA 0 5 9 32 39 121 18 0 12 236 BLM 0 5 46 5 78 193 15 26 7 375 FAA 0 0 0 1 0 0 0 0 0 1 FWS 0 1 0 0 0 40 1 30 0 72 NPS 0 5 4 2 21 12 0 3 8 55 ST 0 45 16 7 40 202 22 0 1 333 USDA 0 0 0 1 0 0 0 0 0 1 USFS 0 264 145 166 480 1,285 242 3 188 2,773 Total 0 325 220 214 658 1,853 298 62 216 3,846
RM BIA 0 9 2 0 1 28 0 0 1 41 BLM 0 19 38 11 14 138 15 8 23 266 FWS 0 0 0 0 0 0 0 11 22 33 NPS 0 1 0 1 3 26 0 0 36 67 ST 0 10 4 7 18 24 9 0 8 80 USDA 0 0 1 0 0 0 0 0 0 1 USFS 0 30 42 20 67 128 21 2 58 368 Total 0 69 87 39 103 344 45 21 148 856
SA BIA 0 0 1 0 0 0 0 0 0 1 DOD 0 0 0 0 0 5 0 0 0 5 FEMA 0 3 0 3 0 0 0 0 5 11 FWS 0 12 2 2 3 48 4 4 9 84 NPS 0 16 18 20 79 48 12 0 100 293 ST 0 22 1 8 44 43 14 0 6 138 USDA 0 2 0 0 0 2 0 0 0 4 USFS 0 175 279 93 135 940 101 20 334 2,077 Total 0 230 301 126 261 1,086 131 24 454 2,613
SO BLM 0 0 1 1 2 3 0 0 0 7 NPS 0 7 0 1 2 4 2 5 49 70 ST 0 1 1 1 10 20 2 0 8 43 USFS 0 45 27 38 76 101 46 0 35 368 Total 0 53 29 41 90 128 50 5 92 488
SW BIA 0 11 6 7 27 50 25 0 1 127 BLM 0 0 2 0 0 17 0 0 0 19 FWS 0 1 0 0 0 12 1 0 10 24 NPS 0 25 11 16 26 40 33 7 147 305 ST 0 4 0 1 5 10 7 0 0 27 USFS 0 27 66 17 52 100 23 37 38 360 Total 0 68 85 41 110 229 89 44 196 862
WB BIA 0 0 1 0 0 2 0 0 0 3 BLM 0 74 129 83 167 576 105 7 69 1,210 FWS 0 1 0 0 0 2 1 0 0 4 NPS 0 1 0 2 42 0 0 1 2 48 ST 0 0 5 0 0 0 0 0 0 5 USFS 0 8 15 11 10 23 8 0 5 80 Total 0 84 150 96 219 603 114 8 76 1,350
Total 0 1,442 1,394 990 2,658 6,622 1,321 214 1,674 16,315
54
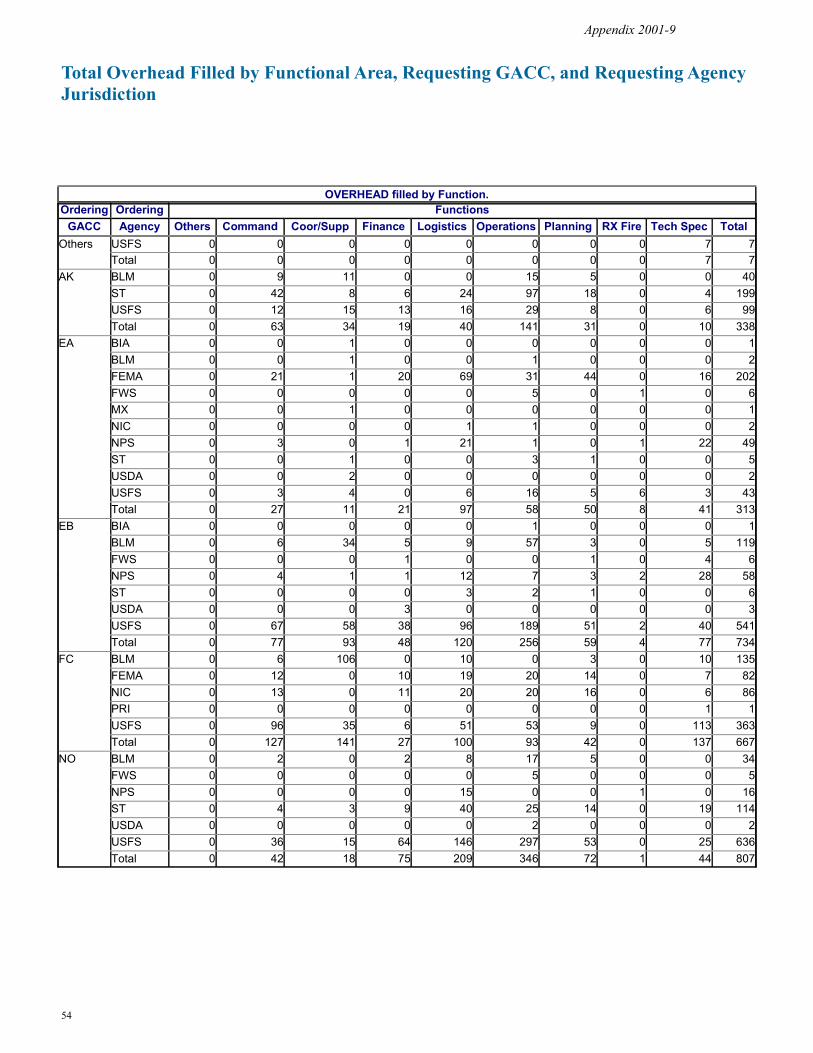
Total Overhead Filled by Functional Area, Requesting GACC, and Requesting Agency Jurisdiction
Appendix 2001-9
OVERHEAD filled by Function. Ordering Ordering
GACC Agency Others Command Coor/Supp Finance Logistics Operations Planning RX Fire Tech Spec Total Others USFS 0 0 0 0 0 0 0 0 7 7
Total 0 0 0 0 0 0 0 0 7 7 AK BLM 0 9 11 0 0 15 5 0 0 40
ST 0 42 8 6 24 97 18 0 4 199 USFS 0 12 15 13 16 29 8 0 6 99 Total 0 63 34 19 40 141 31 0 10 338
EA BIA 0 0 1 0 0 0 0 0 0 1 BLM 0 0 1 0 0 1 0 0 0 2 FEMA 0 21 1 20 69 31 44 0 16 202 FWS 0 0 0 0 0 5 0 1 0 6 MX 0 0 1 0 0 0 0 0 0 1 NIC 0 0 0 0 1 1 0 0 0 2 NPS 0 3 0 1 21 1 0 1 22 49 ST 0 0 1 0 0 3 1 0 0 5 USDA 0 0 2 0 0 0 0 0 0 2 USFS 0 3 4 0 6 16 5 6 3 43 Total 0 27 11 21 97 58 50 8 41 313
EB BIA 0 0 0 0 0 1 0 0 0 1 BLM 0 6 34 5 9 57 3 0 5 119 FWS 0 0 0 1 0 0 1 0 4 6 NPS 0 4 1 1 12 7 3 2 28 58 ST 0 0 0 0 3 2 1 0 0 6 USDA 0 0 0 3 0 0 0 0 0 3 USFS 0 67 58 38 96 189 51 2 40 541 Total 0 77 93 48 120 256 59 4 77 734
FC BLM 0 6 106 0 10 0 3 0 10 135 FEMA 0 12 0 10 19 20 14 0 7 82 NIC 0 13 0 11 20 20 16 0 6 86 PRI 0 0 0 0 0 0 0 0 1 1 USFS 0 96 35 6 51 53 9 0 113 363 Total 0 127 141 27 100 93 42 0 137 667
NO BLM 0 2 0 2 8 17 5 0 0 34 FWS 0 0 0 0 0 5 0 0 0 5 NPS 0 0 0 0 15 0 0 1 0 16 ST 0 4 3 9 40 25 14 0 19 114 USDA 0 0 0 0 0 2 0 0 0 2 USFS 0 36 15 64 146 297 53 0 25 636 Total 0 42 18 75 209 346 72 1 44 807
Functions
55
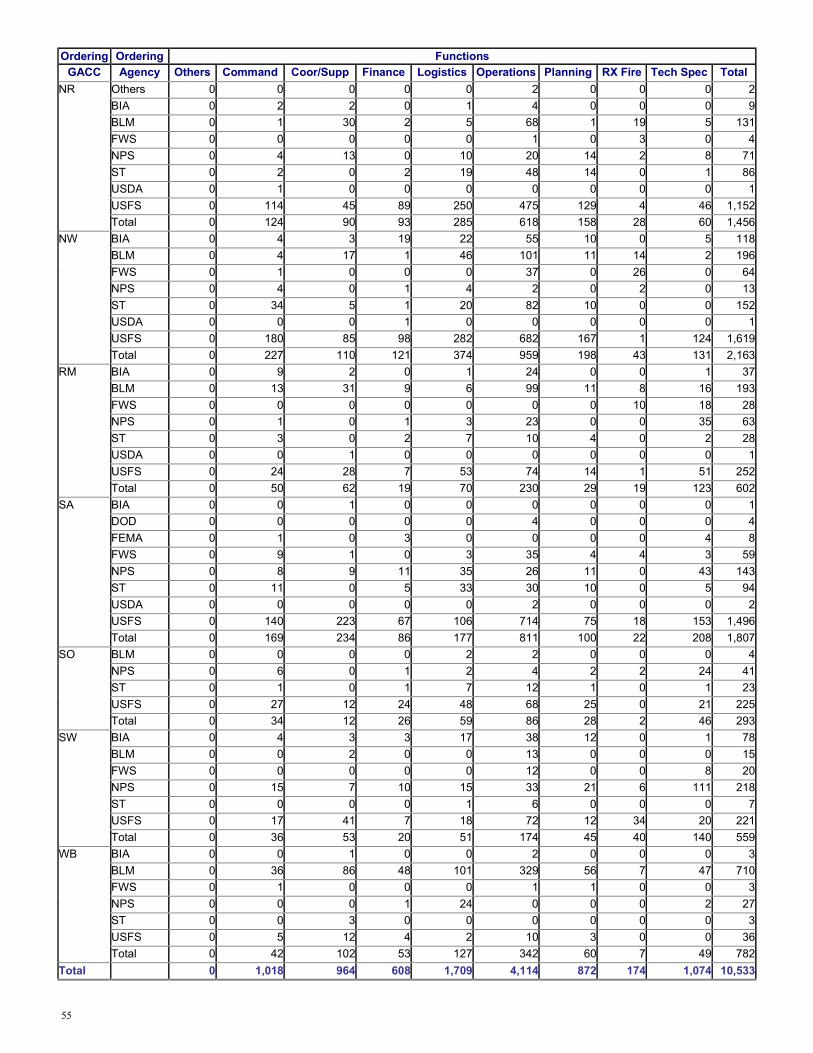
Ordering Ordering GACC Agency Others Command Coor/Supp Finance Logistics Operations Planning RX Fire Tech Spec Total
NR Others 0 0 0 0 0 2 0 0 0 2 BIA 0 2 2 0 1 4 0 0 0 9 BLM 0 1 30 2 5 68 1 19 5 131 FWS 0 0 0 0 0 1 0 3 0 4 NPS 0 4 13 0 10 20 14 2 8 71 ST 0 2 0 2 19 48 14 0 1 86 USDA 0 1 0 0 0 0 0 0 0 1 USFS 0 114 45 89 250 475 129 4 46 1,152 Total 0 124 90 93 285 618 158 28 60 1,456
NW BIA 0 4 3 19 22 55 10 0 5 118 BLM 0 4 17 1 46 101 11 14 2 196 FWS 0 1 0 0 0 37 0 26 0 64 NPS 0 4 0 1 4 2 0 2 0 13 ST 0 34 5 1 20 82 10 0 0 152 USDA 0 0 0 1 0 0 0 0 0 1 USFS 0 180 85 98 282 682 167 1 124 1,619 Total 0 227 110 121 374 959 198 43 131 2,163
RM BIA 0 9 2 0 1 24 0 0 1 37 BLM 0 13 31 9 6 99 11 8 16 193 FWS 0 0 0 0 0 0 0 10 18 28 NPS 0 1 0 1 3 23 0 0 35 63 ST 0 3 0 2 7 10 4 0 2 28 USDA 0 0 1 0 0 0 0 0 0 1 USFS 0 24 28 7 53 74 14 1 51 252 Total 0 50 62 19 70 230 29 19 123 602
SA BIA 0 0 1 0 0 0 0 0 0 1 DOD 0 0 0 0 0 4 0 0 0 4 FEMA 0 1 0 3 0 0 0 0 4 8 FWS 0 9 1 0 3 35 4 4 3 59 NPS 0 8 9 11 35 26 11 0 43 143 ST 0 11 0 5 33 30 10 0 5 94 USDA 0 0 0 0 0 2 0 0 0 2 USFS 0 140 223 67 106 714 75 18 153 1,496 Total 0 169 234 86 177 811 100 22 208 1,807
SO BLM 0 0 0 0 2 2 0 0 0 4 NPS 0 6 0 1 2 4 2 2 24 41 ST 0 1 0 1 7 12 1 0 1 23 USFS 0 27 12 24 48 68 25 0 21 225 Total 0 34 12 26 59 86 28 2 46 293
SW BIA 0 4 3 3 17 38 12 0 1 78 BLM 0 0 2 0 0 13 0 0 0 15 FWS 0 0 0 0 0 12 0 0 8 20 NPS 0 15 7 10 15 33 21 6 111 218 ST 0 0 0 0 1 6 0 0 0 7 USFS 0 17 41 7 18 72 12 34 20 221 Total 0 36 53 20 51 174 45 40 140 559
WB BIA 0 0 1 0 0 2 0 0 0 3 BLM 0 36 86 48 101 329 56 7 47 710 FWS 0 1 0 0 0 1 1 0 0 3 NPS 0 0 0 1 24 0 0 0 2 27 ST 0 0 3 0 0 0 0 0 0 3 USFS 0 5 12 4 2 10 3 0 0 36 Total 0 42 102 53 127 342 60 7 49 782
Total 0 1,018 964 608 1,709 4,114 872 174 1,074 10,533
Functions
56
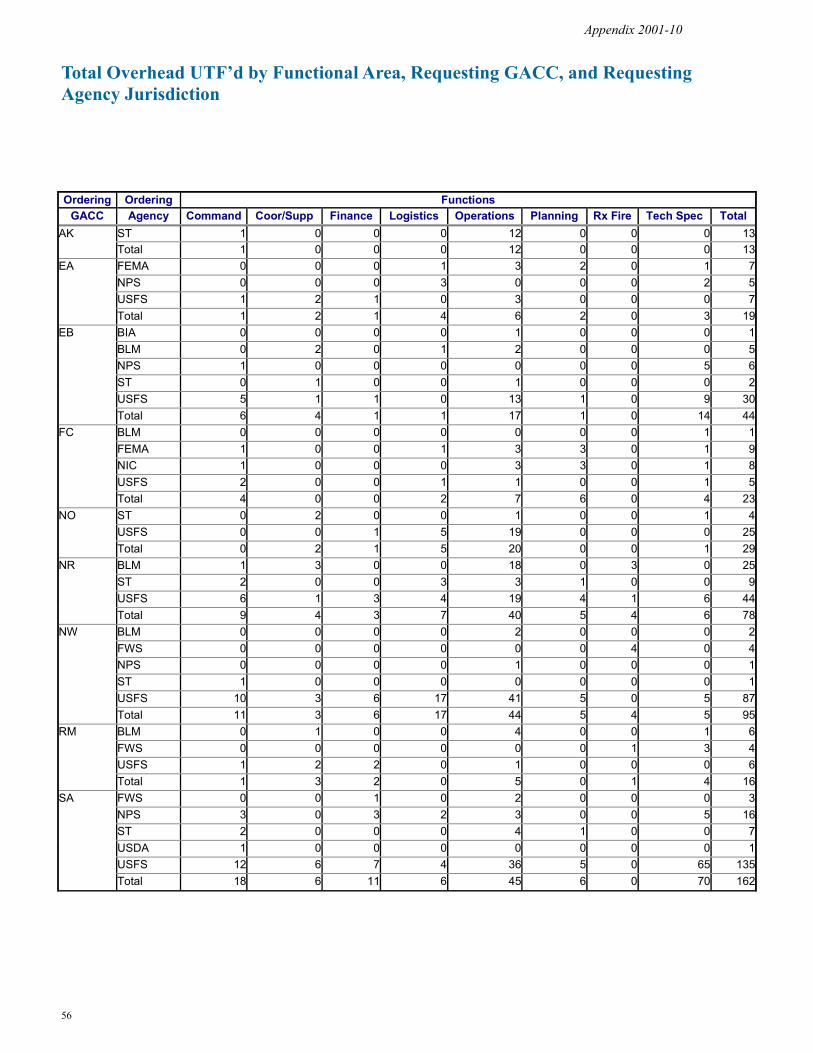
Total Overhead UTF’d by Functional Area, Requesting GACC, and Requesting Agency Jurisdiction
Ordering Ordering Functions GACC Agency Command Coor/Supp Finance Logistics Operations Planning Rx Fire Tech Spec Total
AK ST 1 0 0 0 12 0 0 0 13 Total 1 0 0 0 12 0 0 0 13
EA FEMA 0 0 0 1 3 2 0 1 7 NPS 0 0 0 3 0 0 0 2 5 USFS 1 2 1 0 3 0 0 0 7 Total 1 2 1 4 6 2 0 3 19
EB BIA 0 0 0 0 1 0 0 0 1 BLM 0 2 0 1 2 0 0 0 5 NPS 1 0 0 0 0 0 0 5 6 ST 0 1 0 0 1 0 0 0 2 USFS 5 1 1 0 13 1 0 9 30 Total 6 4 1 1 17 1 0 14 44
FC BLM 0 0 0 0 0 0 0 1 1 FEMA 1 0 0 1 3 3 0 1 9 NIC 1 0 0 0 3 3 0 1 8 USFS 2 0 0 1 1 0 0 1 5 Total 4 0 0 2 7 6 0 4 23
NO ST 0 2 0 0 1 0 0 1 4 USFS 0 0 1 5 19 0 0 0 25 Total 0 2 1 5 20 0 0 1 29
NR BLM 1 3 0 0 18 0 3 0 25 ST 2 0 0 3 3 1 0 0 9 USFS 6 1 3 4 19 4 1 6 44 Total 9 4 3 7 40 5 4 6 78
NW BLM 0 0 0 0 2 0 0 0 2 FWS 0 0 0 0 0 0 4 0 4 NPS 0 0 0 0 1 0 0 0 1 ST 1 0 0 0 0 0 0 0 1 USFS 10 3 6 17 41 5 0 5 87 Total 11 3 6 17 44 5 4 5 95
RM BLM 0 1 0 0 4 0 0 1 6 FWS 0 0 0 0 0 0 1 3 4 USFS 1 2 2 0 1 0 0 0 6 Total 1 3 2 0 5 0 1 4 16
SA FWS 0 0 1 0 2 0 0 0 3 NPS 3 0 3 2 3 0 0 5 16 ST 2 0 0 0 4 1 0 0 7 USDA 1 0 0 0 0 0 0 0 1 USFS 12 6 7 4 36 5 0 65 135 Total 18 6 11 6 45 6 0 70 162
Appendix 2001-10

57
Ordering Ordering Functions GACC Agency Command Coor/Supp Finance Logistics Operations Planning Rx Fire Tech Spec Total
SO BLM 0 1 0 0 0 0 0 0 1 NPS 0 0 0 0 0 0 1 0 1 USFS 0 2 5 1 0 0 0 0 8 Total 0 3 5 1 0 0 1 0 10
SW BIA 0 0 0 0 2 0 0 0 2 FWS 1 0 0 0 0 1 0 1 3 NPS 2 0 1 0 1 0 0 13 17 USFS 0 3 0 0 0 0 0 4 7 Total 3 3 1 0 3 1 0 18 29
WB BLM 1 4 2 1 37 3 0 2 50 NPS 0 0 0 11 0 0 0 0 11 USFS 0 0 0 0 1 0 0 1 2 Total 1 4 2 12 38 3 0 3 63
Total 55 34 33 55 237 29 10 128 581
Total Overhead Cancelled by Functional Area, Requesting GACC, and Requesting Agency Jurisdiction
Ordering Ordering Functions GACC Agency Others Command Coor/Supp Finance Logistics Operations Planning Rx Fire Tech Spec Total
Others Others 0 0 0 0 0 4 0 0 0 4 BLM 0 0 2 0 0 0 0 0 0 2 USFS 0 0 0 0 0 0 1 0 0 1 Total 0 0 2 0 0 4 1 0 0 7
AK BLM 0 0 0 0 0 1 0 0 0 1 ST 0 7 1 6 13 14 10 0 7 58 USFS 0 3 7 2 3 3 3 0 4 25 Total 0 10 8 8 16 18 13 0 11 84
EA BLM 0 0 0 0 0 2 0 0 0 2 FEMA 0 0 0 2 4 1 4 0 3 14 NPS 0 1 0 0 29 0 0 0 7 37 ST 0 0 0 0 0 1 0 0 0 1 USDA 0 0 1 0 0 0 0 0 0 1 USFS 0 2 0 1 1 3 0 0 0 7 Total 0 3 1 3 34 7 4 0 10 62
EB BLM 0 2 9 9 14 53 16 0 1 104 FWS 0 0 0 0 0 0 0 0 3 3 NPS 0 0 0 0 6 1 1 1 0 9 ST 0 2 0 0 6 1 2 0 0 11 USFS 0 23 29 31 43 145 27 2 20 320 Total 0 27 38 40 69 200 46 3 24 447
FC BLM 0 0 7 0 0 0 0 0 0 7 FEMA 0 0 0 0 0 0 0 0 1 1 NIC 0 10 1 8 15 15 12 0 0 61 USFS 0 1 1 5 3 2 2 0 1 15 Total 0 11 9 13 18 17 14 0 2 84

58
Ordering Ordering Functions GACC Agency Others Command Coor/Supp Finance Logistics Operations Planning Rx Fire Tech Spec Total
NO BLM 0 3 0 5 9 21 1 0 2 41 NPS 0 0 0 0 7 0 0 0 0 7 ST 0 4 0 4 17 9 10 0 2 46 USDA 0 0 0 1 0 0 0 0 0 1 USFS 0 31 8 32 49 119 23 0 11 273 Total 0 38 8 42 82 149 34 0 15 368
NR BIA 0 0 0 0 1 1 0 0 0 2 BLM 0 2 21 0 4 34 0 0 5 66 NPS 0 0 3 0 5 10 2 0 3 23 ST 0 9 0 5 31 96 16 0 6 163 USFS 0 32 29 33 87 229 38 2 11 461 Total 0 43 53 38 128 370 56 2 25 715
NW BIA 0 1 6 13 17 66 8 0 7 118 BLM 0 1 29 4 32 90 4 12 5 177 FAA 0 0 0 1 0 0 0 0 0 1 FWS 0 0 0 0 0 3 1 0 0 4 NPS 0 1 4 1 17 9 0 1 8 41 ST 0 10 11 6 20 120 12 0 1 180 USFS 0 74 57 62 181 562 70 2 59 1,067 Total 0 87 107 87 267 850 95 15 80 1,588
RM BIA 0 0 0 0 0 4 0 0 0 4 BLM 0 6 6 2 8 35 4 0 6 67 FWS 0 0 0 0 0 0 0 0 1 1 NPS 0 0 0 0 0 3 0 0 1 4 ST 0 7 4 5 11 14 5 0 6 52 USFS 0 5 12 11 14 53 7 1 7 110 Total 0 18 22 18 33 109 16 1 21 238
SA DOD 0 0 0 0 0 1 0 0 0 1 FEMA 0 2 0 0 0 0 0 0 1 3 FWS 0 3 1 1 0 11 0 0 6 22 NPS 0 5 9 6 42 19 1 0 52 134 ST 0 9 1 3 11 9 3 0 1 37 USDA 0 1 0 0 0 0 0 0 0 1 USFS 0 23 50 19 25 190 21 2 116 446 Total 0 43 61 29 78 230 25 2 176 644
SO BLM 0 0 0 1 0 1 0 0 0 2 NPS 0 1 0 0 0 0 0 2 25 28 ST 0 0 1 0 3 8 1 0 7 20 USFS 0 18 13 9 27 33 21 0 14 135 Total 0 19 14 10 30 42 22 2 46 185
SW BIA 0 7 3 4 10 10 13 0 0 47 BLM 0 0 0 0 0 4 0 0 0 4 FWS 0 0 0 0 0 0 0 0 1 1 NPS 0 8 4 5 11 6 12 1 23 70 ST 0 4 0 1 4 4 7 0 0 20 USFS 0 10 22 10 34 28 11 3 14 132 Total 0 29 29 20 59 52 43 4 38 274
WB BLM 0 37 39 33 65 210 46 0 20 450 FWS 0 0 0 0 0 1 0 0 0 1 NPS 0 1 0 1 7 0 0 1 0 10 ST 0 0 2 0 0 0 0 0 0 2 USFS 0 3 3 7 8 12 5 0 4 42 Total 0 41 44 41 80 223 51 1 24 505
Total 0 369 396 349 894 2,271 420 30 472 5,201
59
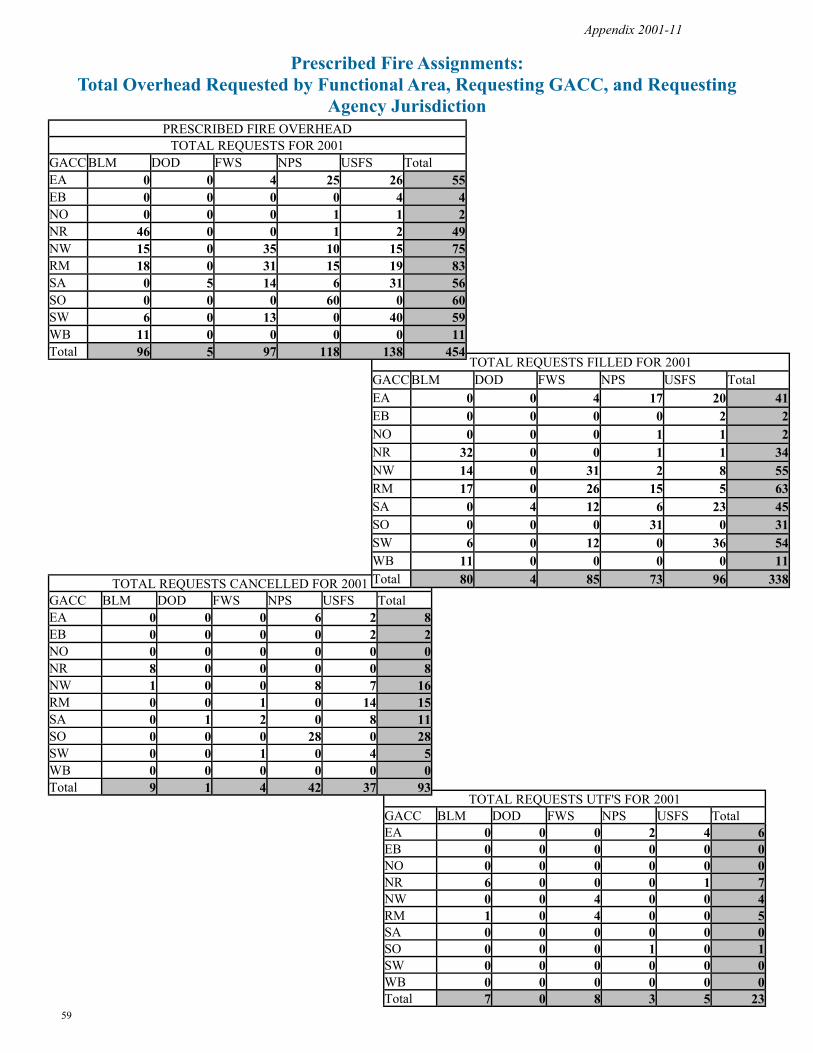
Prescribed Fire Assignments: Total Overhead Requested by Functional Area, Requesting GACC, and Requesting
Agency Jurisdiction
GACC BLM DOD FWS NPS USFS Total EA 0 0 0 2 4 6 EB 0 0 0 0 0 0 NO 0 0 0 0 0 0 NR 6 0 0 0 1 7 NW 0 0 4 0 0 4 RM 1 0 4 0 0 5 SA 0 0 0 0 0 0 SO 0 0 0 1 0 1 SW 0 0 0 0 0 0 WB 0 0 0 0 0 0 Total 7 0 8 3 5 23
TOTAL REQUESTS UTF'S FOR 2001
GACC BLM DOD FWS NPS USFS Total EA 0 0 0 6 2 8 EB 0 0 0 0 2 2 NO 0 0 0 0 0 0 NR 8 0 0 0 0 8 NW 1 0 0 8 7 16 RM 0 0 1 0 14 15 SA 0 1 2 0 8 11 SO 0 0 0 28 0 28 SW 0 0 1 0 4 5 WB 0 0 0 0 0 0 Total 9 1 4 42 37 93
TOTAL REQUESTS CANCELLED FOR 2001
GACC BLM DOD FWS NPS USFS Total EA 0 0 4 17 20 41 EB 0 0 0 0 2 2 NO 0 0 0 1 1 2 NR 32 0 0 1 1 34 NW 14 0 31 2 8 55 RM 17 0 26 15 5 63 SA 0 4 12 6 23 45 SO 0 0 0 31 0 31 SW 6 0 12 0 36 54 WB 11 0 0 0 0 11 Total 80 4 85 73 96 338
TOTAL REQUESTS FILLED FOR 2001
PRESCRIBED FIRE OVERHEAD
GACC BLM DOD FWS NPS USFS Total EA 0 0 4 25 26 55 EB 0 0 0 0 4 4 NO 0 0 0 1 1 2 NR 46 0 0 1 2 49 NW 15 0 35 10 15 75 RM 18 0 31 15 19 83 SA 0 5 14 6 31 56 SO 0 0 0 60 0 60 SW 6 0 13 0 40 59 WB 11 0 0 0 0 11 Total 96 5 97 118 138 454
TOTAL REQUESTS FOR 2001
Appendix 2001-11
60
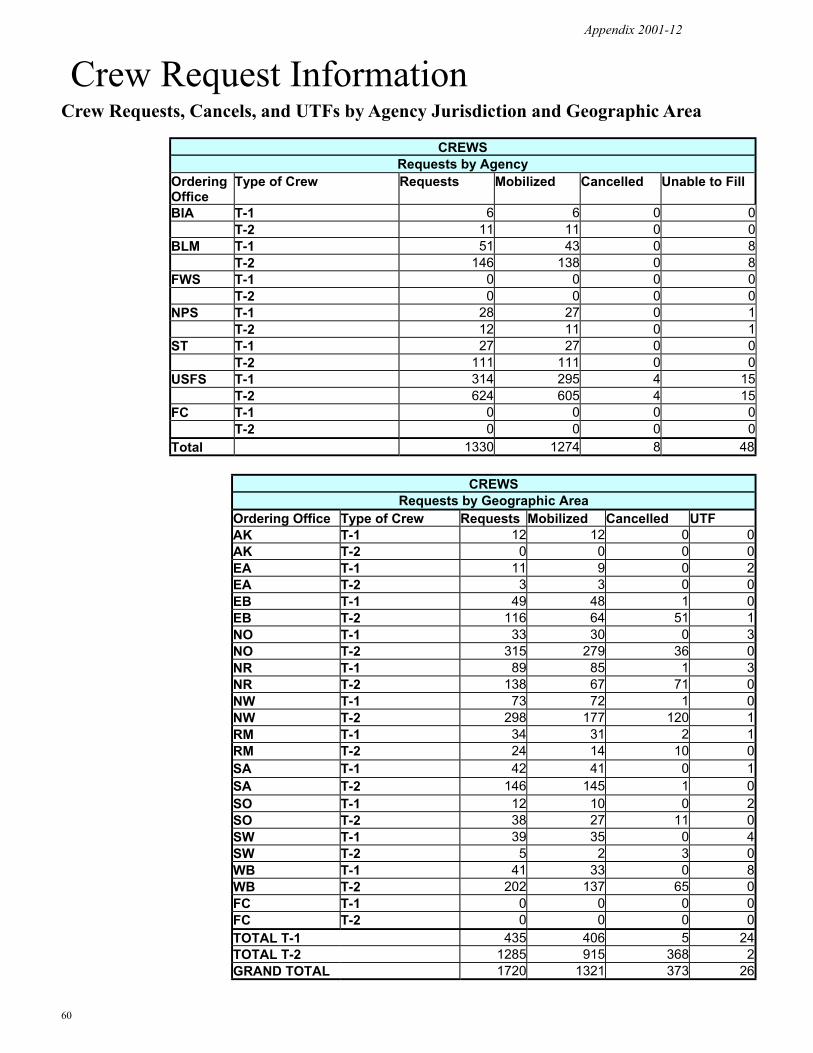
Crew Request Information Crew Requests, Cancels, and UTFs by Agency Jurisdiction and Geographic Area
Appendix 2001-12
Requests by Agency Ordering Office
Type of Crew Requests Mobilized Cancelled Unable to Fill
BIA T-1 6 6 0 0 T-2 11 11 0 0
BLM T-1 51 43 0 8 T-2 146 138 0 8
FWS T-1 0 0 0 0 T-2 0 0 0 0
NPS T-1 28 27 0 1 T-2 12 11 0 1
ST T-1 27 27 0 0 T-2 111 111 0 0
USFS T-1 314 295 4 15 T-2 624 605 4 15
FC T-1 0 0 0 0 T-2 0 0 0 0
Total 1330 1274 8 48
CREWS
Requests by Geographic Area Ordering Office Type of Crew Requests Mobilized Cancelled UTF AK T-1 12 12 0 0 AK T-2 0 0 0 0 EA T-1 11 9 0 2 EA T-2 3 3 0 0 EB T-1 49 48 1 0 EB T-2 116 64 51 1 NO T-1 33 30 0 3 NO T-2 315 279 36 0 NR T-1 89 85 1 3 NR T-2 138 67 71 0 NW T-1 73 72 1 0 NW T-2 298 177 120 1 RM T-1 34 31 2 1 RM T-2 24 14 10 0 SA T-1 42 41 0 1 SA T-2 146 145 1 0 SO T-1 12 10 0 2 SO T-2 38 27 11 0 SW T-1 39 35 0 4 SW T-2 5 2 3 0 WB T-1 41 33 0 8 WB T-2 202 137 65 0 FC T-1 0 0 0 0 FC T-2 0 0 0 0 TOTAL T-1 435 406 5 24 TOTAL T-2 1285 915 368 2 GRAND TOTAL 1720 1321 373 26
CREWS
61
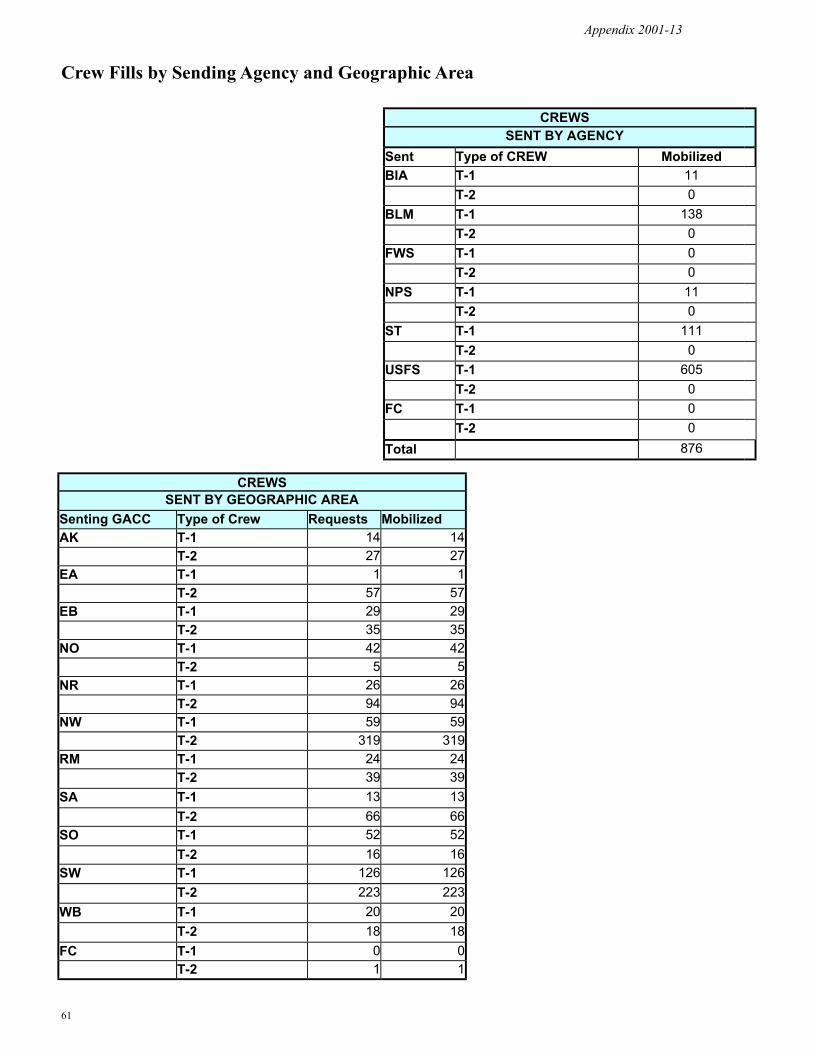
Crew Fills by Sending Agency and Geographic Area
Appendix 2001-13
CREWS
Sent Type of CREW Mobilized BIA T-1 11
T-2 0 BLM T-1 138
T-2 0 FWS T-1 0
T-2 0 NPS T-1 11
T-2 0 ST T-1 111
T-2 0 USFS T-1 605
T-2 0 FC T-1 0
T-2 0 Total 876
SENT BY AGENCY
CREWS
Senting GACC Type of Crew Requests Mobilized AK T-1 14 14
T-2 27 27 EA T-1 1 1
T-2 57 57 EB T-1 29 29
T-2 35 35 NO T-1 42 42
T-2 5 5 NR T-1 26 26
T-2 94 94 NW T-1 59 59
T-2 319 319 RM T-1 24 24
T-2 39 39 SA T-1 13 13
T-2 66 66 SO T-1 52 52
T-2 16 16 SW T-1 126 126
T-2 223 223 WB T-1 20 20
T-2 18 18 FC T-1 0 0
T-2 1 1
SENT BY GEOGRAPHIC AREA
62
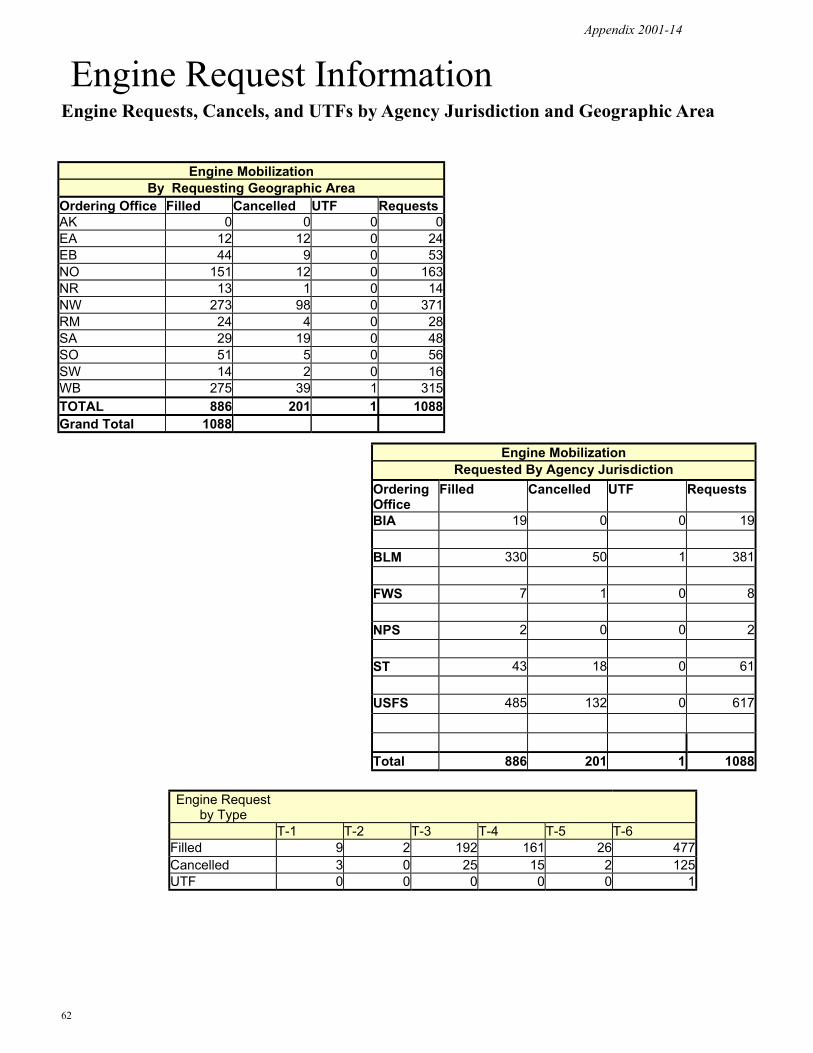
Engine Request Information Engine Requests, Cancels, and UTFs by Agency Jurisdiction and Geographic Area
Engine Request by Type
T-1 T-2 T-3 T-4 T-5 T-6 Filled 9 2 192 161 26 477 Cancelled 3 0 25 15 2 125 UTF 0 0 0 0 0 1
Appendix 2001-14
Engine Mobilization
Ordering Office Filled Cancelled UTF Requests AK 0 0 0 0 EA 12 12 0 24 EB 44 9 0 53 NO 151 12 0 163 NR 13 1 0 14 NW 273 98 0 371 RM 24 4 0 28 SA 29 19 0 48 SO 51 5 0 56 SW 14 2 0 16 WB 275 39 1 315 TOTAL 886 201 1 1088 Grand Total 1088
By Requesting Geographic Area
Engine Mobilization
Ordering Office
Filled Cancelled UTF Requests
BIA 19 0 0 19
BLM 330 50 1 381
FWS 7 1 0 8
NPS 2 0 0 2
ST 43 18 0 61
USFS 485 132 0 617
Total 886 201 1 1088
Requested By Agency Jurisdiction
63
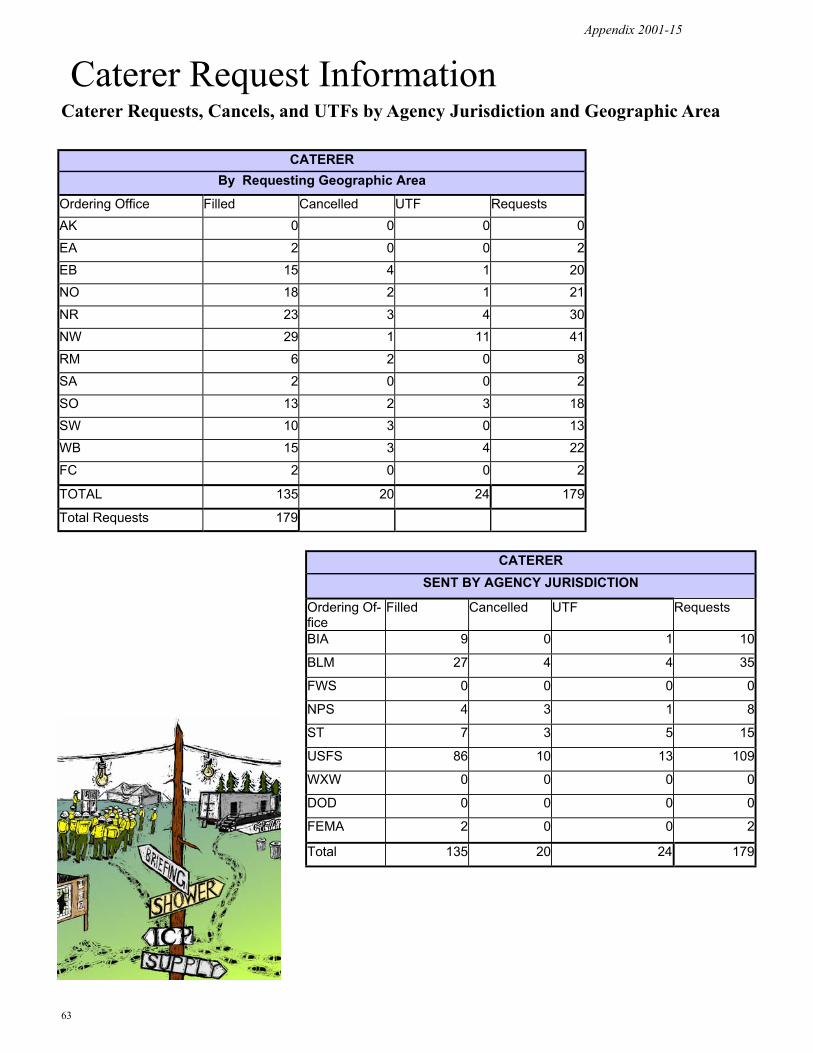
Caterer Request Information Caterer Requests, Cancels, and UTFs by Agency Jurisdiction and Geographic Area
Appendix 2001-15
CATERER
Ordering Office Filled Cancelled UTF Requests AK 0 0 0 0 EA 2 0 0 2 EB 15 4 1 20 NO 18 2 1 21 NR 23 3 4 30 NW 29 1 11 41 RM 6 2 0 8 SA 2 0 0 2 SO 13 2 3 18 SW 10 3 0 13 WB 15 3 4 22 FC 2 0 0 2
TOTAL 135 20 24 179
Total Requests 179
By Requesting Geographic Area
CATERER
Ordering Of-fice
Filled Cancelled UTF Requests
BIA 9 0 1 10
BLM 27 4 4 35
FWS 0 0 0 0
NPS 4 3 1 8
ST 7 3 5 15
USFS 86 10 13 109
WXW 0 0 0 0
DOD 0 0 0 0
FEMA 2 0 0 2
Total 135 20 24 179
SENT BY AGENCY JURISDICTION

64
Shower Request Information Shower Requests, Cancels, and UTFs by Agency Jurisdiction and Geographic Area
Appendix 2001-16
SHOWER
Ordering Filled Cancelled UTF Requests
AK 0 0 0 0 EA 3 1 0 4 EB 15 1 0 16 NO 27 1 1 29 NR 29 0 3 32 NW 39 7 1 47 RM 4 0 0 4 SA 0 0 0 0 SO 15 2 2 19 SW 13 2 0 15 WB 17 0 0 17 FC 3 0 0 3
TOTAL 165 14 7 186
Total Reqs 186
By Requesting Geographic Area
SHOWER
Ordering Filled Cancelled UTF Requests
BIA 12 1 0 13
0
BLM 25 2 1 28
0
FWS 0 0 0 0
0
NPS 7 0 0 7
0
ST 14 3 2 19
USFS 104 7 4 115
WXW 0 0 0 0
DOD 0 0 0 0
FEMA 3 1 0 4
Total 165 14 7 186
SENT BY AGENCY JURISDICTION

65
Radio Systems/ATMU Mobilized in 2001 Appendix 2001-17
GACC Type BIA BLM CN DDQ FEMA FWS NPS ST USFS WXW Total
AK 4312 0 9 0 0 0 0 0 1 1 0 11
4381 0 7 0 0 0 0 0 3 1 0 11
4390 0 7 0 0 0 0 0 2 1 0 10
Total 0 23 0 0 0 0 0 6 3 0 32
EA 4312 0 0 0 0 3 0 0 0 5 0 8
4381 0 0 0 0 3 2 0 0 4 0 9
4390 0 0 0 0 0 0 0 0 4 0 4
Total 0 0 0 0 6 2 0 0 13 0 21
EB 1836 0 0 0 0 0 0 0 0 6 0 6
4312 0 1 0 0 0 0 0 0 17 0 18
4381 0 0 0 0 0 0 1 1 17 0 19
4390 0 4 0 0 0 0 0 3 16 0 23
Total 0 5 0 0 0 0 1 4 56 0 66
FC 1836 0 0 0 0 0 0 0 0 0 2 2
4312 0 0 0 0 0 0 0 0 13 0 13
4381 0 0 0 0 0 0 0 0 24 0 24
4390 0 0 0 0 0 0 0 0 2 0 2
Total 0 0 0 0 0 0 0 0 39 2 41
NO 1836 0 0 0 0 0 0 0 0 2 0 2
4312 0 2 0 0 0 0 0 1 22 0 25
4381 0 0 0 0 0 0 0 4 26 0 30
4390 0 0 0 0 0 0 0 1 19 0 20
Total 0 2 0 0 0 0 0 6 69 0 77
NR 1836 0 0 0 0 0 0 0 1 4 0 5
4312 2 0 0 0 0 0 4 3 19 0 28
4381 2 0 0 0 0 0 3 7 36 0 48
4390 2 2 0 0 0 0 1 5 24 0 34
Total 6 2 0 0 0 0 8 16 83 0 115
NW 1836 0 3 0 0 0 0 0 1 7 0 11
4312 8 2 0 0 0 0 0 5 35 0 50
4381 15 5 0 0 0 0 0 14 42 0 76
4390 3 4 0 0 0 0 1 6 43 0 57
Total 26 14 0 0 0 0 1 26 127 0 194

66
Radio Systems/ATMU Mobilized in 2001
GACC Type BIA BLM CN DDQ FEMA FWS NPS ST USFS WXW Total
RM 1836 0 0 0 0 0 0 0 0 1 0 1
4312 0 2 0 0 0 0 0 2 9 0 13
4381 0 2 0 0 0 0 1 6 5 0 14
4390 0 2 1 0 0 0 1 2 9 0 15
Total 0 6 1 0 0 0 2 10 24 0 43
SA 1836 0 0 0 0 0 0 0 1 7 0 8
4312 0 0 0 0 0 9 4 3 10 0 26
4381 1 0 0 1 0 6 10 6 8 0 32
4390 0 0 0 0 0 0 0 2 15 0 17
Total 1 0 0 1 0 15 14 12 40 0 83
SO 4312 0 2 0 0 0 0 0 1 1 0 4
4381 0 16 0 0 0 0 0 4 16 0 36
4390 0 0 0 0 0 0 0 1 11 0 12
Total 0 18 0 0 0 0 0 6 28 0 52
SW 1836 1 0 0 0 0 0 1 1 7 0 10
4312 4 0 0 0 0 4 5 0 10 0 23
4381 2 0 0 0 0 5 3 0 9 0 19
4390 4 0 0 0 0 0 4 2 19 0 29
Total 11 0 0 0 0 9 13 3 45 0 81
WB 1836 0 4 0 0 0 0 0 0 0 0 4
4312 0 11 0 0 0 0 1 0 3 0 15
4381 0 9 0 0 0 0 2 0 0 0 11
4390 0 23 0 0 0 0 0 0 1 0 24
Total 0 47 0 0 0 0 3 0 4 0 54
Grand Total 44 117 1 1 6 26 42 89 531 2 859
Appendix 2001-18
67
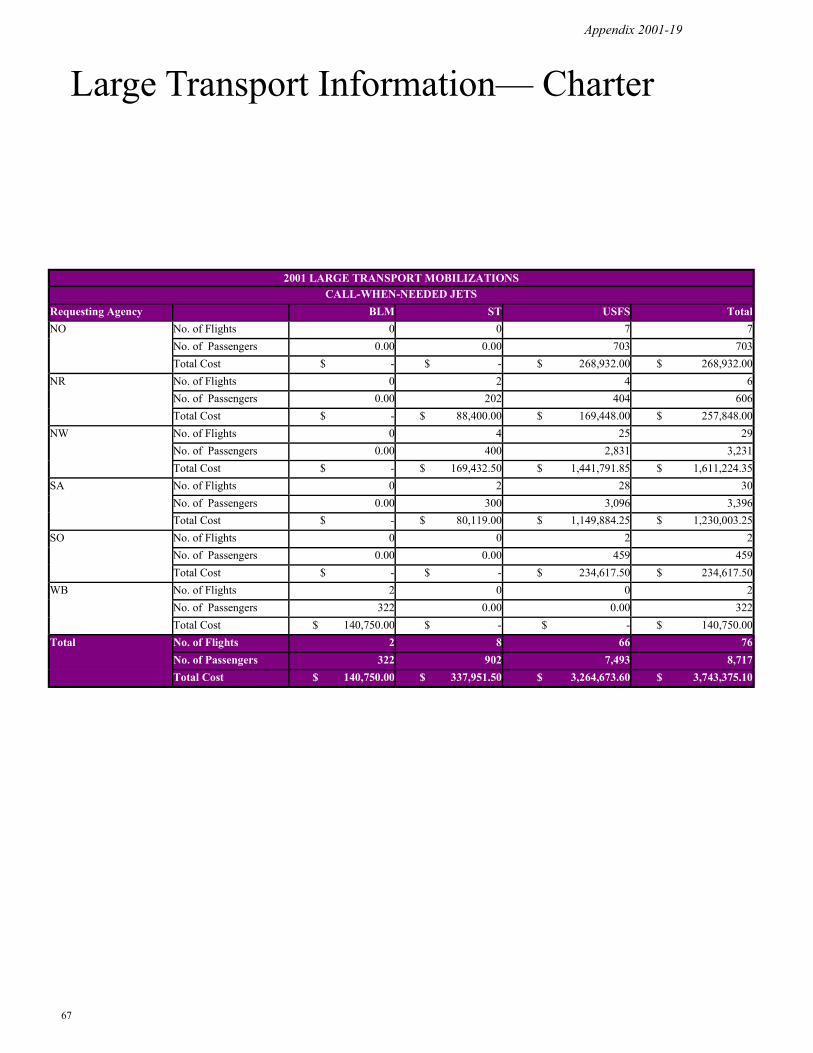
Large Transport Information— Charter
2001 LARGE TRANSPORT MOBILIZATIONS
Requesting Agency BLM ST USFS Total NO No. of Flights 0 0 7 7
No. of Passengers 0.00 0.00 703 703 Total Cost $ - $ - $ 268,932.00 $ 268,932.00
NR No. of Flights 0 2 4 6 No. of Passengers 0.00 202 404 606
Total Cost $ - $ 88,400.00 $ 169,448.00 $ 257,848.00 NW No. of Flights 0 4 25 29
No. of Passengers 0.00 400 2,831 3,231
Total Cost $ - $ 169,432.50 $ 1,441,791.85 $ 1,611,224.35 SA No. of Flights 0 2 28 30
No. of Passengers 0.00 300 3,096 3,396 Total Cost $ - $ 80,119.00 $ 1,149,884.25 $ 1,230,003.25
SO No. of Flights 0 0 2 2
No. of Passengers 0.00 0.00 459 459
Total Cost $ - $ - $ 234,617.50 $ 234,617.50 WB No. of Flights 2 0 0 2
No. of Passengers 322 0.00 0.00 322 Total Cost $ 140,750.00 $ - $ - $ 140,750.00
Total No. of Flights 2 8 66 76 No. of Passengers 322 902 7,493 8,717 Total Cost $ 140,750.00 $ 337,951.50 $ 3,264,673.60 $ 3,743,375.10
CALL-WHEN-NEEDED JETS
Appendix 2001-19
68
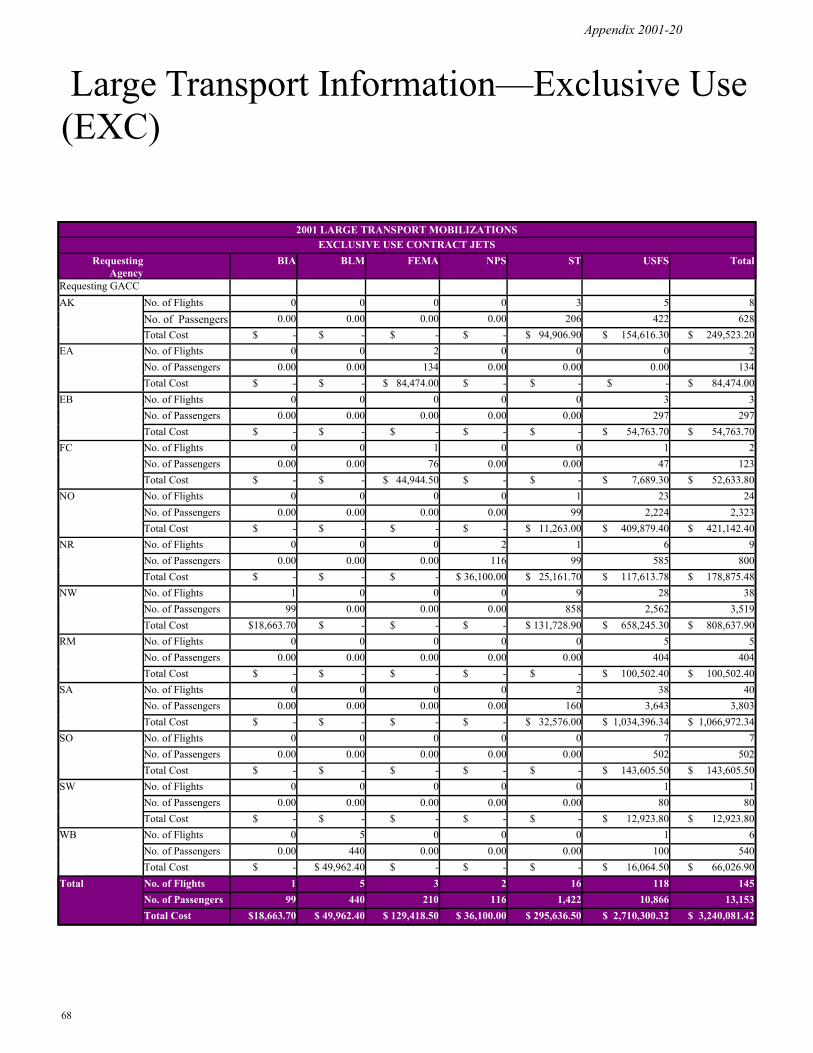
Large Transport Information—Exclusive Use (EXC)
Appendix 2001-20
2001 LARGE TRANSPORT MOBILIZATIONS
Requesting Agency
BIA BLM FEMA NPS ST USFS Total
Requesting GACC AK No. of Flights 0 0 0 0 3 5 8
No. of Passengers 0.00 0.00 0.00 0.00 206 422 628
Total Cost $ - $ - $ - $ - $ 94,906.90 $ 154,616.30 $ 249,523.20 EA No. of Flights 0 0 2 0 0 0 2
No. of Passengers 0.00 0.00 134 0.00 0.00 0.00 134
Total Cost $ - $ - $ 84,474.00 $ - $ - $ - $ 84,474.00 EB No. of Flights 0 0 0 0 0 3 3
No. of Passengers 0.00 0.00 0.00 0.00 0.00 297 297
Total Cost $ - $ - $ - $ - $ - $ 54,763.70 $ 54,763.70 FC No. of Flights 0 0 1 0 0 1 2
No. of Passengers 0.00 0.00 76 0.00 0.00 47 123
Total Cost $ - $ - $ 44,944.50 $ - $ - $ 7,689.30 $ 52,633.80 NO No. of Flights 0 0 0 0 1 23 24
No. of Passengers 0.00 0.00 0.00 0.00 99 2,224 2,323
Total Cost $ - $ - $ - $ - $ 11,263.00 $ 409,879.40 $ 421,142.40 NR No. of Flights 0 0 0 2 1 6 9
No. of Passengers 0.00 0.00 0.00 116 99 585 800
Total Cost $ - $ - $ - $ 36,100.00 $ 25,161.70 $ 117,613.78 $ 178,875.48 NW No. of Flights 1 0 0 0 9 28 38
No. of Passengers 99 0.00 0.00 0.00 858 2,562 3,519
Total Cost $18,663.70 $ - $ - $ - $ 131,728.90 $ 658,245.30 $ 808,637.90 RM No. of Flights 0 0 0 0 0 5 5
No. of Passengers 0.00 0.00 0.00 0.00 0.00 404 404
Total Cost $ - $ - $ - $ - $ - $ 100,502.40 $ 100,502.40 SA No. of Flights 0 0 0 0 2 38 40
No. of Passengers 0.00 0.00 0.00 0.00 160 3,643 3,803
Total Cost $ - $ - $ - $ - $ 32,576.00 $ 1,034,396.34 $ 1,066,972.34 SO No. of Flights 0 0 0 0 0 7 7
No. of Passengers 0.00 0.00 0.00 0.00 0.00 502 502
Total Cost $ - $ - $ - $ - $ - $ 143,605.50 $ 143,605.50 SW No. of Flights 0 0 0 0 0 1 1
No. of Passengers 0.00 0.00 0.00 0.00 0.00 80 80
Total Cost $ - $ - $ - $ - $ - $ 12,923.80 $ 12,923.80 WB No. of Flights 0 5 0 0 0 1 6
No. of Passengers 0.00 440 0.00 0.00 0.00 100 540
Total Cost $ - $ 49,962.40 $ - $ - $ - $ 16,064.50 $ 66,026.90 Total No. of Flights 1 5 3 2 16 118 145
No. of Passengers 99 440 210 116 1,422 10,866 13,153
Total Cost $18,663.70 $ 49,962.40 $ 129,418.50 $ 36,100.00 $ 295,636.50 $ 2,710,300.32 $ 3,240,081.42
EXCLUSIVE USE CONTRACT JETS

69
Appendix 2001-21
Type 1 Helicopter Information CWN1L
ORDER_OFF Requests UTF Cancelled
EA 1 0 1
EB 41 0 8
FC 4 0 0
NO 54 1 5
NR 40 0 6
NW 62 0 8
RM 15 0 1
SA 22 0 2
SO 14 0 2
SW 6 0 1
WB 22 0 4
EXC1
ORDER_OFF Requests UTF Cancelled
EA 0 0 0
EB 0 0 0
FC 0 0 0
NO 0 0 0
NR 0 0 0
NW 1 0 0
RM 0 0 0
SA 0 0 0
SO 0 0 0
SW 0 0 0
WB 0 0 0
70
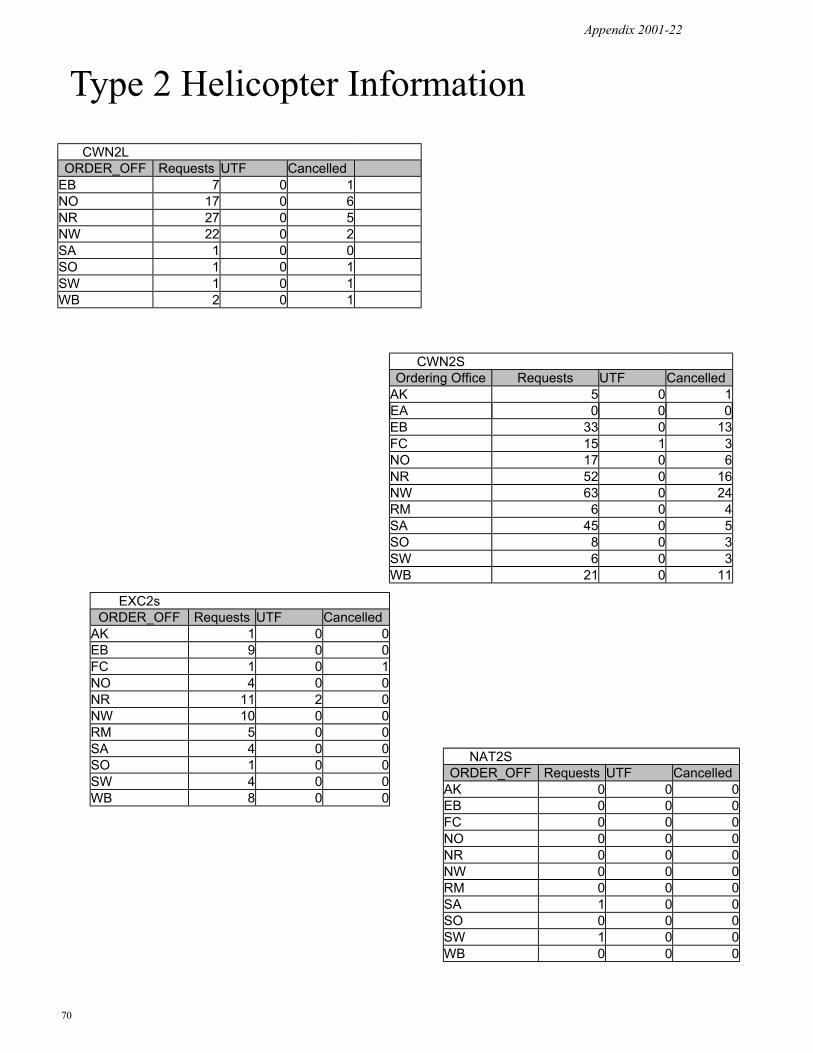
Appendix 2001-22
Type 2 Helicopter Information CWN2L
ORDER_OFF Requests UTF Cancelled EB 7 0 1 NO 17 0 6 NR 27 0 5 NW 22 0 2 SA 1 0 0 SO 1 0 1 SW 1 0 1 WB 2 0 1
CWN2S Ordering Office Requests UTF Cancelled
AK 5 0 1 EA 0 0 0 EB 33 0 13 FC 15 1 3 NO 17 0 6 NR 52 0 16 NW 63 0 24 RM 6 0 4 SA 45 0 5 SO 8 0 3 SW 6 0 3 WB 21 0 11
EXC2s ORDER_OFF Requests UTF Cancelled
AK 1 0 0 EB 9 0 0 FC 1 0 1 NO 4 0 0 NR 11 2 0 NW 10 0 0 RM 5 0 0 SA 4 0 0 SO 1 0 0 SW 4 0 0 WB 8 0 0
NAT2S ORDER_OFF Requests UTF Cancelled
AK 0 0 0 EB 0 0 0 FC 0 0 0 NO 0 0 0 NR 0 0 0 NW 0 0 0 RM 0 0 0 SA 1 0 0 SO 0 0 0 SW 1 0 0 WB 0 0 0
71
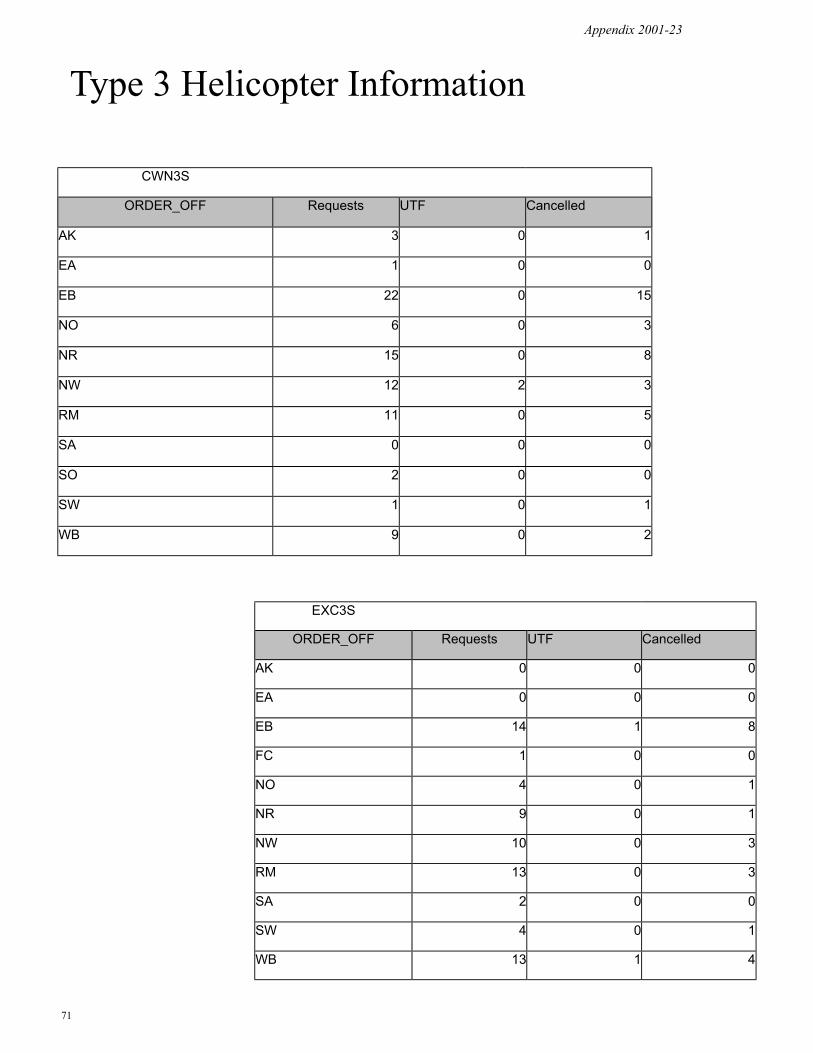
Appendix 2001-23
Type 3 Helicopter Information
CWN3S
ORDER_OFF Requests UTF Cancelled
AK 3 0 1
EA 1 0 0
EB 22 0 15
NO 6 0 3
NR 15 0 8
NW 12 2 3
RM 11 0 5
SA 0 0 0
SO 2 0 0
SW 1 0 1
WB 9 0 2
EXC3S
ORDER_OFF Requests UTF Cancelled
AK 0 0 0
EA 0 0 0
EB 14 1 8
FC 1 0 0
NO 4 0 1
NR 9 0 1
NW 10 0 3
RM 13 0 3
SA 2 0 0
SW 4 0 1
WB 13 1 4

72


![Pine Street 6th grade Year End Slides 2001-02.ppt [read-only]](https://img.pdfslide.net/doc/110x75/587ca27e1a28ab356c8b5195/pine-street-6th-grade-year-end-slides-2001-02ppt-read-only.jpg)