Embed Size (px)
Citation preview
1Collector AB (publ) 556560-0797, P.O. Box 119 14, 404 39 Gothenburg, Sweden | Telephone +46 10 161 00 00 | Email [email protected] | www.collector.se
Year-end report 2015FULL YEAR 2015 (COMPARED WITH FULL YEAR 2014)
• Total income increased by 30 %, amounting to SEK 1,187 m (916) • Profit after tax (EAT) increased by 52 %, amounting to SEK 286 m (188)• Return on equity (RoE) was 21 % (23)• Earnings per share increased to SEK 3.16 (2.35)• Payment solutions, Property finance and Personal loans experienced the strongest growth• Strong growth with increased quality in the credit portfolio, SEK 8,697 m (5,649) +54 % • Positive development in credit losses, 1.3 % (1.4)• The Collector share (“COLL”) was listed on the Nasdaq Stockholm Mid Cap list in June 2015• Collector received its banking licence in May 2015• The Board of Directors proposes that no dividend is paid for the financial year 2015,
which is in line with the adopted dividend policy
TOTAL INCOMEFull year 2015
1,187 +30 %SEK m
PROFIT AFTER TAXFull year 2015
286 +52 %SEK m
THE FOURTH QUARTER OF 2015 (COMPARED WITH THE FOURTH QUARTER OF 2014)
SIGNIFICANT EVENTS AFTER THE END OF THE PERIOD
• Total income increased by 20 %, amounting to SEK 330 m (275). Adjusted because of refined method of period allocation the growth in the fourth quarter would be approximately 27 %
• Profit after tax (EAT) increased by 52 %, amounting to SEK 91 m (60)• Earnings per share increased to SEK 0.98 (0.70) • A factoring agreement was concluded with Valora International AG. A credit of SEK 800 m,
corresponding to an invoice volume of approximately SEK 5,000 m
• A fully subscribed issue of SEK 500 m within the certificate programme• Property finance was established in Finland
“Collector enters 2016 at high speed on all levels.”Stefan Alexandersson, CEO
RETURN ON EQUITY (RoE)31 December 2015
21 %TOTAL CAPITAL RATIO31 December 2015
17 %

2Collector AB (publ) 556560-0797, P.O. Box 119 14, 404 39 Gothenburg, Sweden | Telephone +46 10 161 00 00 | Email [email protected] | www.collector.se
Key ratios
SEK m Q4 2015 Q4 2014 % Full year 2015
Full year 2014 %
Total income 330 275 20 % 1,187 916 30 %
Profit before tax (EBT) 120 79 52 % 371 244 52 %
Profit after tax (EAT) 91 60 52 % 286 188 52 %
Earnings per share, SEK1) 0.98 0.70 39 % 3.16 2.35 35 %
Average number of shares2) 93,355,502 85,493,150 89,887,451 79,831,081
Capital base3) 1,541 906 70 % 1,541 906 70 %
Equity 1,649 995 66 % 1,649 995 66 %
Total capital ratio, %4) 17 15 17 15
Return on equity (RoE), %5) 21 23 21 23
Equity per share, SEK6) 17.7 13.4 32 % 17.7 13.4 32 %
Equity-to-assets ratio, %7) 16 15 16 15
Credit losses, %8) 1.3 1.4 1.3 1.4
C/I ratio, %9) 0.50 0.54 0.54 0.58
Average number of full-time employees10) 276 238 16 % 264 229 15 %
Investments in intangible fixed assets 16 10 50 % 50 33 52 %
1) The period’s profit after tax attributable to the period’s average number of outstanding ordinary shares, before and after dilution. The period’s profit has been adjusted for dividends attributable to preference shares.2) The period’s average number of ordinary shares before and after dilution. The number of shares has been adjusted retroactively according to a resolution by the Annual General Meeting to split shares.3) See Note 5 on page 18. 4) Capital base divided by total capital requirement. Refers to the financial group of companies. See Note 5 on page 17. 5) Profit after tax in relation to average equity. Rolling, 12 months. 6) Equity divided by the number of outstanding shares at the end of the period. The number of shares has been adjusted retroactively according to a resolution by the Annual General Meeting to split shares. 7) Equity divided by total capital at the end of the period. 8) Credit losses in relation to lending and other accounts receivable. Rolling, 12 months.9) Total expenses before credit losses, according to the Annual Accounts Act for Credit Institutions. See Note 1. Including employees on fixed-term contracts, but not on parental leave or leave of absence.
THIS IS COLLECTOR
Collector is an innovative, digital, niche bank that offers financing solutions to private and corporate customers. Since 2005, Collector has had annual organic revenue growth of just 30 % and profit growth (EAT) of 55 %. Operations are comprised of the Retail and Corporate segments. Within the Retail segment, the Company is engaged in lending to private individuals, invoice and payments by instalments to e-commerce and retail companies, credit card services and deposits. The Corporate segment includes factoring and company credits directed mainly at small and medium-sized enterprises, property finance, debt collection on behalf of clients and the acquisition of portfolios of overdue receivables. The company has offices in Gothenburg (the head office), Stockholm, Malmö, Helsinki and Oslo. The Group is comprised of the parent company, Collector AB (publ); the wholly-owned subsidiary, Collector Bank AB, in which the main operations are conducted; and Colligent Inkasso AB and Collector Norge AS, which are active in commissioned services and debt collection. Collector is listed on the Nasdaq Stockholm Mid Cap list.
10)
3Collector AB (publ) 556560-0797, P.O. Box 119 14, 404 39 Gothenburg, Sweden | Telephone +46 10 161 00 00 | Email [email protected] | www.collector.se
A comment from our CEO
Stefan AlexanderssonCEO
An eventful and successful 20152015 was one of the most eventful years in the history of Collector. We launched several new products and services within both the Corporate and the Retail segments, we were granted a banking licence and we carried out a successful initial public offering. We also concluded our largest transaction ever within the Corporate segment and attracted a record-breaking number of new customers within the Retail segment, with 1 million new customers.
Financially too, 2015 was a successful year. With revenue growth of 30 %, we increased the market shares for all our products. The 52 % increase in profit after tax also is also a testament to the high scala-bility of Collector’s business model. Furthermore, we are pleased to note an increasing quality in our credit portfolio; the credit loss ratio dropped to 1.3 %, which is an all-time low in the history of Collector.
Fourth quarter 2015The fourth quarter led to a great year-end. The quarter was the strongest in the history of Collector, and both income and profit before tax were our highest ever. Perhaps the most satisfying aspect of the quarter was the increased quality of the credit portfolio, with credit losses dropping from 1.5 % to 1.3 %. The trend towards higher credit quality is notable in both our segments, also in earlier indicators than the reported credit loss ratio. It indicates that the credit losses have every opportunity to continue improving.
On the business side, the deal with Valora International AG stands out – chiefly because of its size, with an estimated credit portfolio of SEK 800 m, but also because of Collector’s increasing ability to engage in additional international business with very limited risk.
Annual revenue growth of 30 % for 16 yearsI am often asked how Collector has succeeded in growing organically for 16 years, with 30 % in revenues and over 50 % in profit after tax every year. Will this strong growth trend really continue? The explanation has varied somewhat over the years, but if I have to pick the most important factors, and those that are relevant right now, I would like to emphasize certain internal factors, of which these two are key:
A very strong and effective corporate culture. We have succeeded in combining commitment, entrepreneurship and ethics that allow our employees to challenge and innovate, with a culture signified by structure and order, with high quality decisions and processes. This com-bination, which is not always obvious, works incredibly well at Collector.
A modern and strong technology platform. At the end of 2011, we took the decision to start developing our own technology platform. Today, our platform is built on the very latest technology, and we develop this with a distinctly agile development method. In addition to an adaptable, secure and – most importantly – stable platform,
which is in constant operation even during upgrades and major implementations. Modern technology and our agile development method have also meant that we are able to attract highly skilled IT experts. Collector’s IT investments are entirely forward facing.
The combination of a strong corporate culture and a modern IT environment allows us to realize Collector’s vision of becoming the leading digital niche-bank in the Nordic region. Collector is evolving from a bank with a technology department into a technology company with a banking licence.
While Collector continues to be strongly characterized by digitization, the human relationship with our customers remains important. It is therefore particularly satisfying that we again broke the record in our annual customer satisfaction survey (NKI), and that we have hardly ever lost a corporate customer to a competitor.
Expectations for 2016 and the years aheadThe world around us keeps changing with increasing speed, and I believe that the years ahead may involve dramatic changes for financial players. The way private individuals and corporate clients consume financial services continues to evolve rapidly, and I welcome this development.
Collector starts 2016 at a high entry speed on all levels. Historically, Collector has experienced high organic turnover and profit growth, in combination with declining credit losses. The ambition for 2016 and the years ahead is to retain the same growth levels, with continued de-clining credit losses. Consequently, I believe 2016 will be characterized by much of what we have seen lately – innovation, growth and a scalable business that continues to generate great profit growth.
The future looks very bright for Collector. With an incredibly strong organization and a world in constant change, which suits Collector, I am more confident than ever that Collector's growth journey has merely begun.

4Collector AB (publ) 556560-0797, P.O. Box 119 14, 404 39 Gothenburg, Sweden | Telephone +46 10 161 00 00 | Email [email protected] | www.collector.se
The Group’s income and profit Full year 20152015 was an eventful year in the history of Collector: a banking licence, an initial public offering, the largest factoring transaction ever and a record-breaking number of new customers.
Collector continued its strong growth throughout the full year of 2015. Total income increased by 30 % compared to the corresponding period in the previous year, amounting to SEK 1,187 m (916). The growth primarily stems from expanding volumes within Payment solutions for e-commerce and retail chains, Property finance and Personal loans. Factoring had weaker growth during the year. No in-come from the previously announced factoring transaction with Valora International AG has affected 2015; it will not have an effect until 2016. Qliro, a customer within the Payment solutions for e-commerce product area, made a positive contribution to growth. As previously communicated, the volumes from Qliro have diminished in 2015.
Profit before tax (EBT) increased by 52 %, amounting to SEK 371 m (244). The improved profit is the result of a combination of higher in-come, reduced operating expenses and a lower cost of funding. Profit after tax (EAT) increased by 52 % to SEK 286 m (188), corresponding to a return on equity (RoE) of 21 % (23). Earnings per share increased by 35 % to SEK 3.16 (2.35). The new issue in connection with the listing increased the number of shares, thus diluting dividends and earnings per share in 2015 compared with previous years.
Fourth quarter 2015The fourth quarter was Collector’s strongest ever in absolute figures. Total income was SEK 330 m (275), corresponding to growth of 20%. The lower revenue growth was primarily affected by lower factoring volumes. A refined method of period allocation of income also had negative impact on recognized growth. Adjusted for this, growth in the fourth quarter of 2015 would be approximately 27 %.
The seasonal variations affecting Collector tend to be minor, but the fourth quarter is usually the strongest, as more real estate credit trans-actions are closed at year-end and as debt collection and purchased portfolios have stronger cash flows. Profit before tax (EBT) increased by 52 %, amounting to SEK 120 m (79). Profit after tax (EAT) for the period grew by 52 % to SEK 91 m (60). Earnings per share increased by 39 % to SEK 0.98 (0.70) in the fourth quarter.
ExpensesCollector has a highly scalable business model. The cost/income ratio (C/I) improved to 0.54 in 2015 (0.58) In the fourth quarter, the C/I ratio was improved to 0.50 compared with 0.54 in the previous year. Additional cost efficiencies are expected in 2016.
The Group’s development
Credit portfolioOver the year, the total credit portfolio increased by as much as SEK 3.1 billion, corresponding to 54 %, mostly distributed over the Property finance and Personal loans product areas, which experienced the highest growth. Payment solutions for e-commerce also experienced good growth. The relatively short duration in the credit portfolio means that its share of the total credit portfolio is low compared to sales. On a positive note, the quality of the total credit portfolio will improve, as Collector is moving towards segments with financially stronger customers. The relationship between healthy receivables compared to doubtful receivables continues to improve.
Credit losses Credit losses were reduced over the year, amounted to 1.3 % (1.4 %). The reason for this reduction in credit losses is the improved quality of the personal loan portfolio combined with the strong portfolio growth. However, credit losses within Payment solutions for e-commerce have increased due to higher rate of reservations in Denmark and countries outside the Nordic region. The higher rate of reservations in these countries is offset by higher margins.
LiquidityCollector’s excess liquidity is invested in Swedish municipal bonds and deposited in accounts in Nordic banks. The Group’s financial investments totalled SEK 149 m (0) and cash and cash equivalents amounted to SEK 825 m (637) at the end of the period.
FundingCollector funds its operations mostly through deposits from the general public. Deposits from the general public amounted to SEK 7,855 m (5,209) at the end of the period. Unutilized bank credits of SEK 700 m have been agreed in the fourth quarter of 2015, Collector’s Board of Directors adopted a SEK 3,000 m certificate programme. Collector issued SEK 500 m within this programme in January 2016.
Capital and total capital ratioCollector has received permission from the Swedish Financial Super-visory Authority to include profit for the year in the capital base. A review has been performed of the profit for the year. This year’s profit has therefore been taken into consideration in the capital base. The capital base for the financial group of companies totalled SEK 1,541 m (906) and the capital requirement was SEK 728 m (487) at the end of the period. Total capital ratio amounted to 17 % (15). Due to heavy growth in the credit portfolio (+54 %), the total capital ratio is lower than in the third quarter. If this credit growth continues, Collector will need to strengthen the capital base in 2016 to maintain the target of a total capital ratio of at least 15 %.
5Collector AB (publ) 556560-0797, P.O. Box 119 14, 404 39 Gothenburg, Sweden | Telephone +46 10 161 00 00 | Email [email protected] | www.collector.se
Segment performance
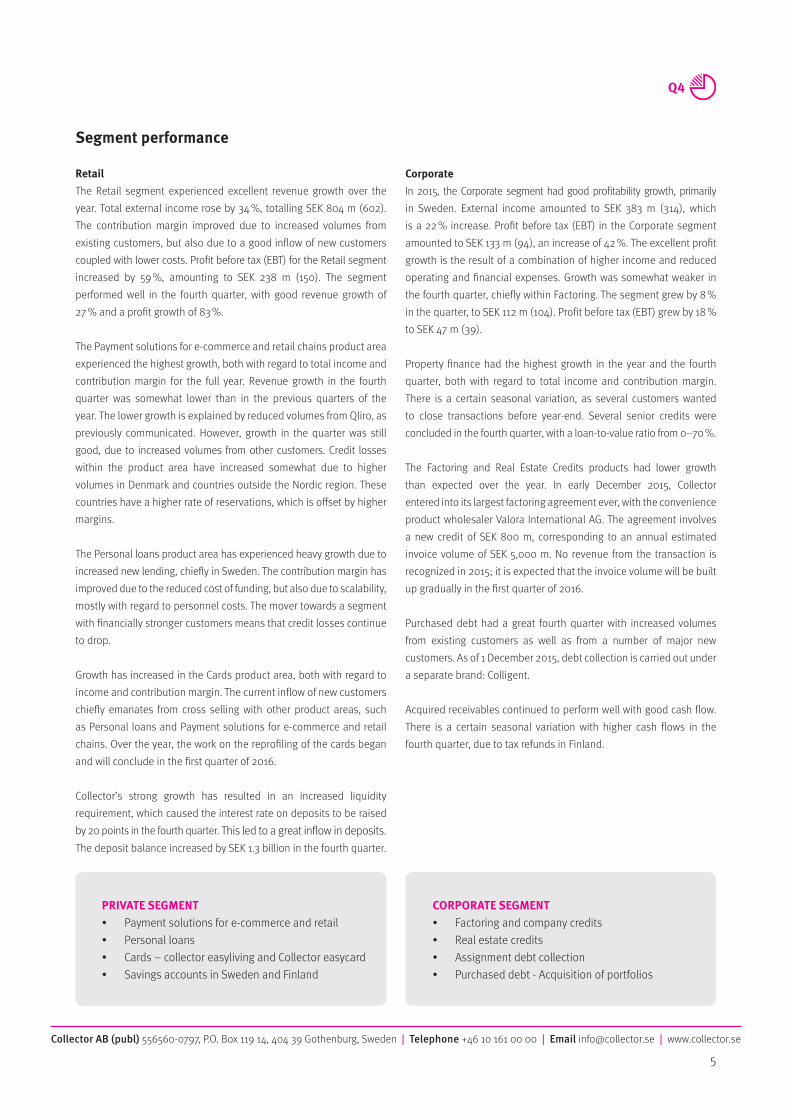
CORPORATE SEGMENT • Factoring and company credits• Real estate credits• Assignment debt collection• Purchased debt - Acquisition of portfolios
PRIVATE SEGMENT • Payment solutions for e-commerce and retail• Personal loans• Cards – collector easyliving and Collector easycard• Savings accounts in Sweden and Finland
CorporateIn 2015, the Corporate segment had good profitability growth, primarily in Sweden. External income amounted to SEK 383 m (314), which is a 22 % increase. Profit before tax (EBT) in the Corporate segment amounted to SEK 133 m (94), an increase of 42 %. The excellent profit growth is the result of a combination of higher income and reduced operating and financial expenses. Growth was somewhat weaker in the fourth quarter, chiefly within Factoring. The segment grew by 8 % in the quarter, to SEK 112 m (104). Profit before tax (EBT) grew by 18 % to SEK 47 m (39).
Property finance had the highest growth in the year and the fourth quarter, both with regard to total income and contribution margin. There is a certain seasonal variation, as several customers wanted to close transactions before year-end. Several senior credits were concluded in the fourth quarter, with a loan-to-value ratio from 0–70 %.
The Factoring and Real Estate Credits products had lower growth than expected over the year. In early December 2015, Collector entered into its largest factoring agreement ever, with the convenience product wholesaler Valora International AG. The agreement involves a new credit of SEK 800 m, corresponding to an annual estimated invoice volume of SEK 5,000 m. No revenue from the transaction is recognized in 2015; it is expected that the invoice volume will be built up gradually in the first quarter of 2016.
Purchased debt had a great fourth quarter with increased volumes from existing customers as well as from a number of major new customers. As of 1 December 2015, debt collection is carried out under a separate brand: Colligent.
Acquired receivables continued to perform well with good cash flow. There is a certain seasonal variation with higher cash flows in the fourth quarter, due to tax refunds in Finland.
RetailThe Retail segment experienced excellent revenue growth over the year. Total external income rose by 34 %, totalling SEK 804 m (602). The contribution margin improved due to increased volumes from existing customers, but also due to a good inflow of new customers coupled with lower costs. Profit before tax (EBT) for the Retail segment increased by 59 %, amounting to SEK 238 m (150). The segment performed well in the fourth quarter, with good revenue growth of 27 % and a profit growth of 83 %.
The Payment solutions for e-commerce and retail chains product area experienced the highest growth, both with regard to total income and contribution margin for the full year. Revenue growth in the fourth quarter was somewhat lower than in the previous quarters of the year. The lower growth is explained by reduced volumes from Qliro, as previously communicated. However, growth in the quarter was still good, due to increased volumes from other customers. Credit losses within the product area have increased somewhat due to higher volumes in Denmark and countries outside the Nordic region. These countries have a higher rate of reservations, which is offset by higher margins.
The Personal loans product area has experienced heavy growth due to increased new lending, chiefly in Sweden. The contribution margin has improved due to the reduced cost of funding, but also due to scalability, mostly with regard to personnel costs. The mover towards a segment with financially stronger customers means that credit losses continue to drop.
Growth has increased in the Cards product area, both with regard to income and contribution margin. The current inflow of new customers chiefly emanates from cross selling with other product areas, such as Personal loans and Payment solutions for e-commerce and retail chains. Over the year, the work on the reprofiling of the cards began and will conclude in the first quarter of 2016.
Collector’s strong growth has resulted in an increased liquidity requirement, which caused the interest rate on deposits to be raised by 20 points in the fourth quarter. This led to a great inflow in deposits. The deposit balance increased by SEK 1.3 billion in the fourth quarter.

6Collector AB (publ) 556560-0797, P.O. Box 119 14, 404 39 Gothenburg, Sweden | Telephone +46 10 161 00 00 | Email [email protected] | www.collector.se
SEK 11 m (9) for the fourth quarter, and pertains to intra-Group administrative services. Profit before tax for the period January– December amounted to SEK 42 m (1) and SEK 48 m (7) for the fourth quarter. Profit after tax for the period January–December amounted to SEK 32 m (0) and SEK 38 m (6) for the fourth quarter. The Parent Company’s cash and cash equivalents totalled SEK 17 m (2), and equity totalled SEK 711 m (306), as at 31 December 2015.
The Collector shareThe Collector share (“COLL”) was listed on the Nasdaq Stockholm Mid Cap list on 10 June 2015. At the end of the period, the final price paid for the Collector share was SEK 127, corresponding to the listing price of SEK 55 on 10 June. Collector’s market value on 31 December was approximately SEK 12 billion, and the number of shareholders was approximately 4,000.
Share capitalAs at 31 December 2015, the share capital amounted to SEK 9,335,550 divided into 93,355,502 ordinary shares. The Company has one (1) class of shares. Each share confers on the holder the right to one vote at the general meeting.
DividendsAccording to the adopted dividend policy, Collector will focus on medium-term growth, which means that dividends may be low or not occur at all in the medium term. The Board of Directors proposes that no dividend is paid for the financial year 2015.
Relationships with related partiesCollector provides debt collection services to Balder. Collector also provides property finance to Oscar Properties. These transactions are carried out on market terms. Deposits are also made by related parties and in accordance with applicable market terms for Collector’s deposit accounts.
Significant events after the end of the periodIn January 2016, a SEK 500 m certificate programme was issued. Property finance was launched in Finland in January, as the Finnish property market is considered to be experiencing excellent growth with an attractive risk profile.
2016 Annual General MeetingThe Annual General Meeting will be held on Thursday 28 April at 3 pm at the West Sweden Chamber of Commerce, Parkgatan 49, Gothenburg, Sweden. The notice of the Annual General Meeting will be published no earlier than six and no later than four weeks prior to the Annual General Meeting It is expected that the 2015 Annual Report will be available at collector.se as of 6 April.
Presentation to investors, analysts and mediaA live webcast/telephone conference will be held on 11 February at 12.00 noon (CET) at Operaterassen in Stockholm, where Stefan Alexandersson, CEO, and Pia-Lena Olofsson, CFO, will present the report. The presen-tation will be given in English and webcast live at www.collector.se. To participate in the telephone conference, please call +46 8 566 426 63.
Significant risks and uncertainty factorsIn its operations, Collector is exposed to a variety of financial risks: market risk (currency risk, price risk, fair value interest risk, cash flow interest risk), credit risk and liquidity risk. The Group’s comprehensive risk management policy is focused on the unpredictability of the financial markets and strives to minimize potential adverse effects on the Group’s financial performance.
The Group uses derivative instruments to counteract certain risk exposures. Risk management is handled by Group management in accordance with policies adopted by the Board of Directors. The Board of Directors adopts written policies for comprehensive risk manage-ment, as well as for specific areas such as currency risk, interest rate risk, credit risk and the use of derivatives and similar financial instruments.
The Group’s risk structure and its risk, liquidity and asset manage-ment are described in detail in the prospectus “Invitation to acquire shares in Collector AB (publ)” on pages 5–7 and 65–70, which is available at www.collector.se. After that, there have been no significant changes except as reported in this interim report.
Financial group of companiesThe Parent Company, Collector AB, is part of a financial group of companies (consolidated situation) that includes the subsidiaries Collector Bank AB, PayPort GmbH and Collector Norge AS. All com-panies are fully consolidated. Collector Finland Oy was merged into Collector Bank AB on 1 April 2015. The branch in Finland is called Collector Bank AB, Suomen sivuliike. The entire financial group of companies is under the supervision of the Swedish Financial Super-visory Authority, and it is subject to the Swedish Financial Supervisory Authority’s regulations regarding capital adequacy and large exposures. Colligent Inkasso AB is a wholly owned subsidiary of Collector AB (publ), but is not included in the financial group of companies.
EmployeesThe average number of full-time employees amounted to 264 (FTE) in the period January–December 2015. In the fourth quarter, the average number of full-time employees amounted to 276 (FTE). The number of full-time employees includes employees on fixed-term contracts, but not on parental leave or a leave of absence.
Parent CompanyThe Parent Company is a holding company. Operating income for the period of January–December amounted to SEK 53 m (39) and
Other
ShareholdersFastighets AB BalderStrategiQ CapitalErnström FinansSwedbank Robur Fonder Skandinaviska Enskilda BankenHelichrysum Gruppen (Lena Apler)Muirfield Invest AktiebolagAndra AP-fondenOther shareholdersTotal
%44.1 %12.7 %
9.5 %6.5 % 3.8 %3.7 %3.2 %3.0 %
13.5 %100 %
OWNERSHIP STRUCTURE 31 December 2015
7Collector AB (publ) 556560-0797, P.O. Box 119 14, 404 39 Gothenburg, Sweden | Telephone +46 10 161 00 00 | Email [email protected] | www.collector.se
The Board of Directors and the CEO affirm that this interim report provides an accurate overview of the operations, financial position and performance of the Group and the Parent Company, and describes the significant risks and uncertainties faced by the Parent Company and the companies in the Group.
This interim report has not been reviewed by the company’s auditors.
Gothenburg, 10 February 2016
The Board of Directors.
Lena Apler, Chairman
Erik Selin, Vice Chairman
Johannes Nyberg
Charles Kinell
Christoffer Lundström
Helena Levander
Vilhelm Schottenius
Stefan Alexandersson, CEO
Contact For further information, please contact:
CEO Stefan Alexandersson | Phone: +46 706-07 38 87 | Email: [email protected]
CFO Pia-Lena Olofsson | Phone: +46 708-58 04 53 | Email: [email protected]
IR Clara Bolinder-Lundberg | Phone: +46 707-19 84 43 | Email: [email protected]
Readers are reminded that the original financial report, signed by the Board of Directors, is in Swedish. This is a translation of the Swedish financial report. The information in this report is such that Collector is required to disclose in accordance with the Swedish Securities Market Act and/or the Swedish Financial Instruments Trading Act. The information was submitted for publication at 8.15 am (CET) on 11 February 2016.
Future reporting dates
6 April 2016 Annual Report 2015
28 April 2016 Interim report January–March
Annual General Meeting
20 July 2016 Interim report January–June
27 October 2016 Interim report January–September

Collector AB (publ) 556560-0797, P.O. Box 119 14, 404 39 Gothenburg, Sweden | Telephone +46 10 161 00 00 | Email [email protected] | www.collector.se
8
Amounts in SEK million Note Q4 2015 Q4 2014 Full year 2015Full year
2014
Total income 2 330 275 1,187 916
330 275 1,187 916
Operating expenses
Personnel costs –49 –44 –173 –160
Depreciation of property, plant and equipment and amortization of intangible fixed assets –8 –7 –28 –22
Other profit/loss – net –1 0 –1 0
Other costs 4 –134 –121 –536 –396
Operating expenses –192 –172 –738 –578
Operating profit/loss 138 103 449 338
Profit/loss from financial items
Profit/loss from sales of subsidiaries – –1 – –1
Financial income 0 2 0 6
Financial expenses –18 –25 –78 –99
Profit/loss after financial items 120 79 371 244
Income tax –29 –19 –85 –56
Profit/loss for the year 91 60 286 188
Attributable to:
The Parent Company’s shareholders 91 60 286 188
Holdings without controlling influence – – – –91 60 286 188
Earnings per share for profit attributable to the Parent Company’sshareholders during the period (expressed in SEK per share)
– Before dilution 0.98 0.70 3.16 2.35
– After dilution 0.98 0.70 3.16 2.35
Q4 2015 Q4 2014 Full year 2015Full year
2014
Profit/loss for the year 91 60 286 188Other comprehensive income – – – –
Items that later can be reversed in the income statement:
Exchange rate differences –1 –2 –4 0
Total comprehensive income for the period 90 58 282 188
Attributable to:
– The Parent Company’s shareholders 90 58 282 188
– Holdings without controlling influence – – – –
90 58 282 188
STATEMENT OF COMPREHENSIVE INCOME
Group
INCOME STATEMENT
Group

Collector AB (publ) 556560-0797, P.O. Box 119 14, 404 39 Gothenburg, Sweden | Telephone +46 10 161 00 00 | Email [email protected] | www.collector.se
9
Amounts in SEK millionFull year
2015Full year
2014
ASSETS
Non-current assets
Property, plant and equipmentEquipment 8 7
8 7
Intangible assetsCapitalized expenditure for development work 87 63
Goodwill 71 72
158 135
Financial assets
Financial investments 149 –Deferred tax assets – 2Lending and other receivables 4,633 3,060
4,782 3,062
Total non-current assets 4,948 3,204
Current assets
Lending and other receivables 4,064 2,589
Derivative instruments 45 –
Other receivables 175 131
Cash and cash equivalents 825 637
Total current assets 5,109 3,357
TOTAL ASSETS 10,057 6,561
EQUITY AND LIABILITIES
EquityShare capital (93,355,502 shares) 9 7
Reserves –7 –3
Other contributed capital 801 401
Retained earnings, incl. profit for the year 846 590
Total equity 1,649 995
Long-term liabilitiesFunding 245 510
Deferred tax liabilities 66 53
311 563
Current liabilitiesAccounts payable 34 20
Accrued expenses and prepaid income 258 135
Current tax liabilities 36 11
Other current liabilities 159 139
Funding 7,610 4,699
Derivative instruments – 1
8,097 5,003
TOTAL EQUITY AND LIABILITIES 10,057 6,561
BALANCE SHEET
Group

Collector AB (publ) 556560-0797, P.O. Box 119 14, 404 39 Gothenburg, Sweden | Telephone +46 10 161 00 00 | Email [email protected] | www.collector.se
10
Attributable to the Parent Company’s shareholders
Amounts in SEK million Share capital
Other contributed
capital ReservesRetained earnings Total
Holdings without
controlling influence Total equity
Opening balance as at 1 January 2014 6 200 –3 432 635 – 635Comprehensive incomeProfit/loss for the year 188 188 188
Other comprehensive incomeExchange rate differences 0 0 0Other comprehensive income – – –Total comprehensive income – – 0 188 188 – 188
Transactions with shareholdersNew issue of preference shares 0 2 2 2
New issue of ordinary shares 1 199 200 200Dividend on preference shares 0 0 0Ordinary dividend –30 –30 –30Total transactions with shareholders 1 201 – –30 172 – 172
Closing balance as at 31 December 2014 7 401 –3 590 995 – 995
Opening balance as at 1 January 2015 7 401 –3 590 995 – 995Comprehensive incomeProfit/loss for the year 286 286 286
Other comprehensive incomeExchange rate differences –4 –4 –4Other comprehensive income – – –Total comprehensive income – – –4 286 282 – 282
Transactions with shareholdersNew issue of ordinary shares 0 400 400 400Bonus issue of ordinary shares 2 –2 0 0Dividend on preference shares –2 –2 –2Costs related to the new issue (net) –26 –26 –26Total transactions with shareholders 2 400 – –30 372 – 372
Closing balance as at 31 December 2015 9 801 –7 846 1,649 – 1,649
SUMMARY OF CHANGES IN EQUITY
Group
Collector AB (publ) 556560-0797, P.O. Box 119 14, 404 39 Gothenburg, Sweden | Telephone +46 10 161 00 00 | Email [email protected] | www.collector.se
11
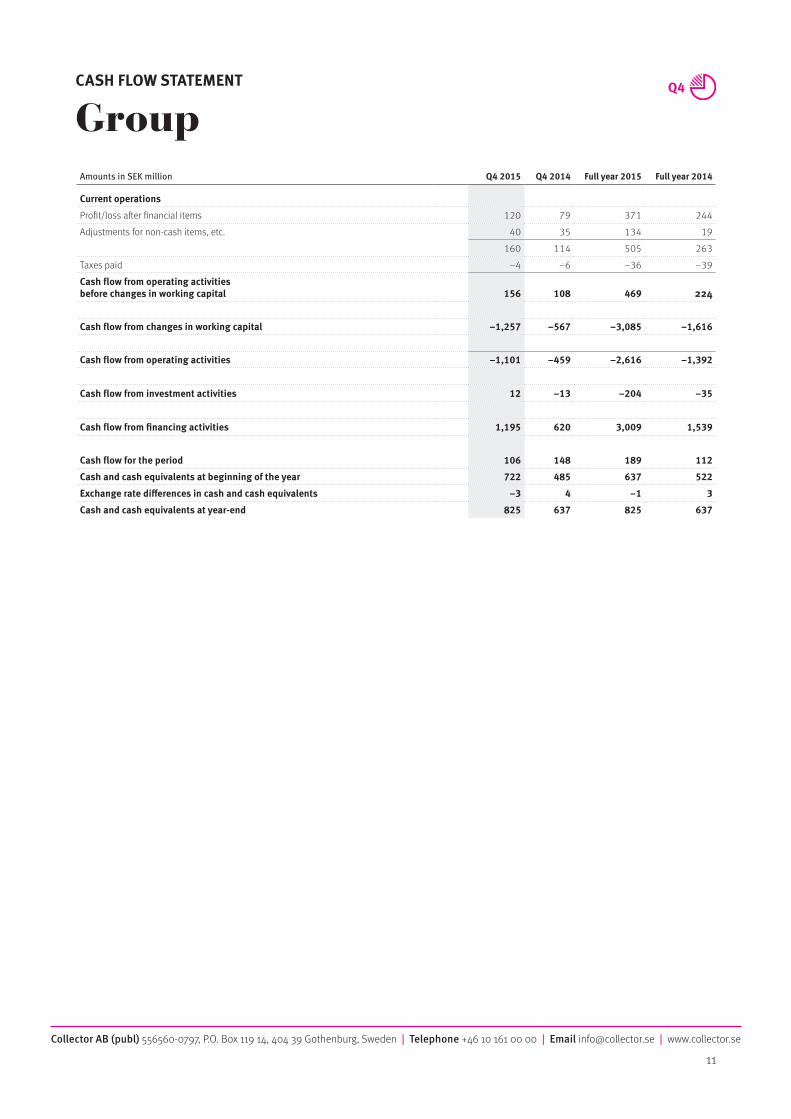
Amounts in SEK million Q4 2015 Q4 2014 Full year 2015 Full year 2014
Current operations
Profit/loss after financial items 120 79 371 244Adjustments for non-cash items, etc. 40 35 134 19
160 114 505 263Taxes paid –4 –6 –36 –39Cash flow from operating activities before changes in working capital 156 108 469 224
Cash flow from changes in working capital –1,257 –567 –3,085 –1,616
Cash flow from operating activities –1,101 –459 –2,616 –1,392
Cash flow from investment activities 12 –13 –204 –35
Cash flow from financing activities 1,195 620 3,009 1,539
Cash flow for the period 106 148 189 112
Cash and cash equivalents at beginning of the year 722 485 637 522
Exchange rate differences in cash and cash equivalents –3 4 –1 3
Cash and cash equivalents at year-end 825 637 825 637
CASH FLOW STATEMENT
Group

Collector AB (publ) 556560-0797, P.O. Box 119 14, 404 39 Gothenburg, Sweden | Telephone +46 10 161 00 00 | Email [email protected] | www.collector.se
Income Statement, Parent CompanyAmounts in SEK million Q4 2015 Q4 2014
Full year 2015
Full year 2014
Operating income 11 9 53 39
Operating expensesOther external costs –10 –6 –49 –34Depreciation of property, plant and equipment and amortization of intangible fixed assets –3 –3 –12 –10Operating profit/loss –2 0 –8 –5
Profit/loss from financial itemsProfit/loss from holdings in Group companies – –1 – –1Interest income and similar items 0 0 0 0
Interest expenses and similar profit/loss items 0 0 0 0Profit/loss after financial items –2 –1 –8 –6
AppropriationsAppropriations, other 50 7 50 7Profit before tax 48 7 42 1
Income tax –10 –1 –10 –1Profit/loss for the year 38 6 32 0
Parent CompanyINCOME STATEMENT
12
Collector AB (publ) 556560-0797, P.O. Box 119 14, 404 39 Gothenburg, Sweden | Telephone +46 10 161 00 00 | Email [email protected] | www.collector.se
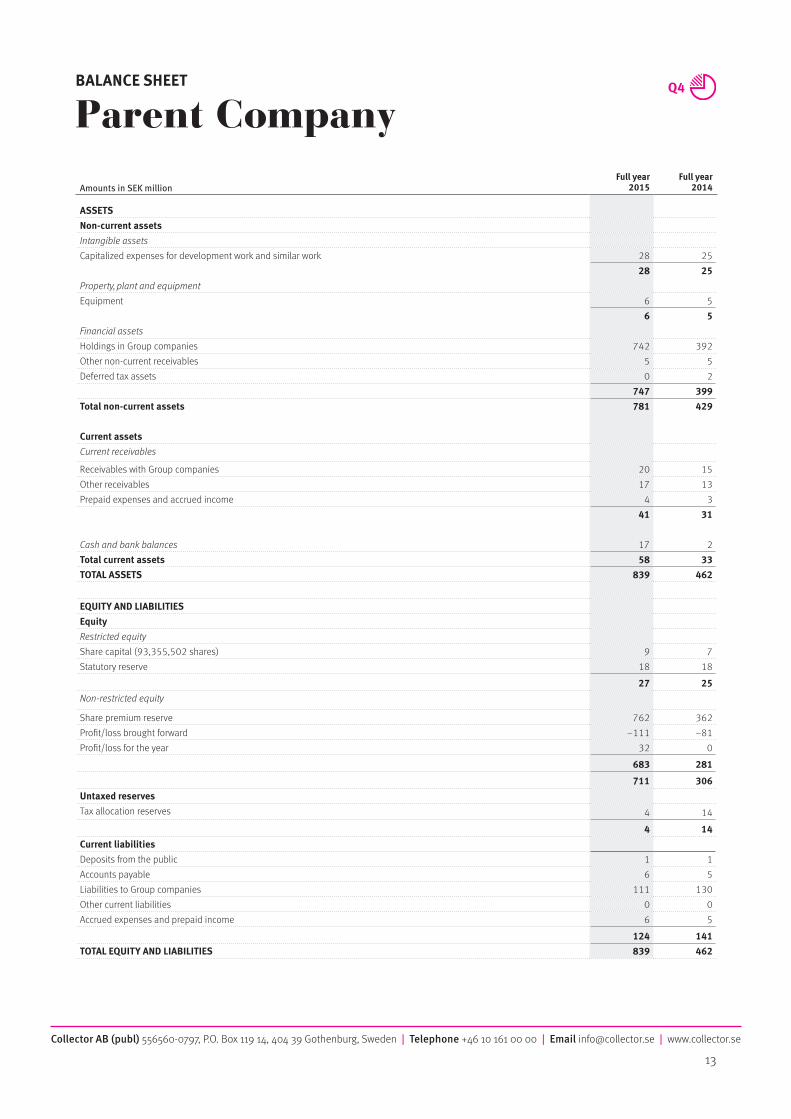
Amounts in SEK millionFull year
2015Full year
2014
ASSETSNon-current assetsIntangible assetsCapitalized expenses for development work and similar work 28 25
28 25Property, plant and equipmentEquipment 6 5
6 5Financial assetsHoldings in Group companies 742 392 Other non-current receivables 5 5Deferred tax assets 0 2
747 399Total non-current assets 781 429
Current assetsCurrent receivables
Receivables with Group companies 20 15Other receivables 17 13Prepaid expenses and accrued income 4 3
41 31
Cash and bank balances 17 2Total current assets 58 33TOTAL ASSETS 839 462
EQUITY AND LIABILITIESEquityRestricted equityShare capital (93,355,502 shares) 9 7Statutory reserve 18 18
27 25Non-restricted equity
Share premium reserve 762 362Profit/loss brought forward –111 –81Profit/loss for the year 32 0
683 281
711 306Untaxed reservesTax allocation reserves 4 14
4 14Current liabilitiesDeposits from the public 1 1Accounts payable 6 5Liabilities to Group companies 111 130Other current liabilities 0 0Accrued expenses and prepaid income 6 5
124 141TOTAL EQUITY AND LIABILITIES 839 462
Parent CompanyBALANCE SHEET
13

Collector AB (publ) 556560-0797, P.O. Box 119 14, 404 39 Gothenburg, Sweden | Telephone +46 10 161 00 00 | Email [email protected] | www.collector.se
14
Accounting principles and notes to the financial statementsGeneral accounting principles
The interim report is prepared in accordance with IFRS/IAS 34, and the Swedish Financial Supervisory Authority’s Regulations and General Guidelines on Annual Accounts for Credit Institutions and Securities Companies (FFFS 2008:25, Chapter 7, Sections 2–3, and Chapter 8), the Annual Accounts Act for Credit Institutions and Securities Companies (Chapter 7, Sections 7–8) and the Swedish Financial Reporting Board’s recommendation RFR 1 Supplementary Accounting Rules for Groups have been taken into consideration.
No new or revised IFRS or interpretations by IFRIC have had any effect on the Group’s financial position, profit or disclosures. The accounting principles and bases for assessments in the interim report are consistent with those applied in the 2014 Annual Report.
For the Parent Company, the Swedish Annual Accounts Act and Swedish Financial Reporting Board’s recommendation RFR 2 Accounting for Legal Entities have been applied.
Income Statement according to the Annual Accounts Act for Credit Institutions
Note 1
Amounts in SEK million Q4 2015 Q4 2014Full year
2015Full year
2014
Operating income
Interest income 411 163 963 571Interest expenses –18 –25 –78 –99Commission income –52 * 32 19 102Commission expenses –27 –25 –103 –74Other operating income –29 * 81 205 248Total operating income 285 226 1006 748
Operating expenses
General administration costs –77 –58 –272 –227Depreciation of property, plant and equipment and amortization of intangible fixed assets –7 –6 –28 –22Other operating expenses –58 –57 –243 –186Total expenses before credit losses –142 –121 –543 –435
Profit before credit losses 143 105 463 313
Credit losses, net –22 –25 –92 –69Operating profit/loss 121 80 371 244
Tax on profit for the year –30 –20 –85 –56Profit/loss for the year 91 60 286 188
C/I ratio 0.50 0.54 0.54 0.58
* Reclassifications were made during the quarter.
Collector AB (publ) 556560-0797, P.O. Box 119 14, 404 39 Gothenburg, Sweden | Telephone +46 10 161 00 00 | Email [email protected] | www.collector.se
15
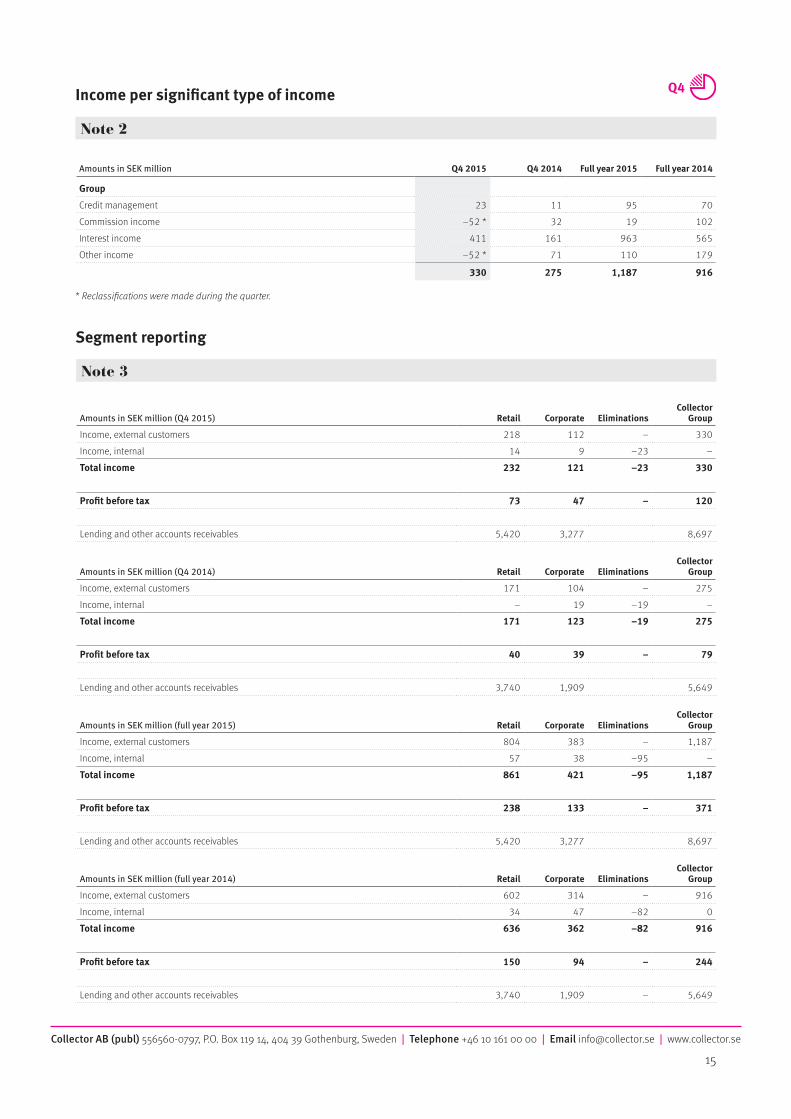
Income per significant type of income
Note 2
Amounts in SEK million Q4 2015 Q4 2014 Full year 2015 Full year 2014
Group
Credit management 23 11 95 70Commission income –52 * 32 19 102Interest income 411 161 963 565Other income –52 * 71 110 179
330 275 1,187 916
* Reclassifications were made during the quarter.
Segment reporting
Note 3
Amounts in SEK million (Q4 2015) Retail Corporate EliminationsCollector
Group
Income, external customers 218 112 – 330Income, internal 14 9 –23 –Total income 232 121 –23 330
Profit before tax 73 47 – 120
Lending and other accounts receivables 5,420 3,277 8,697
Amounts in SEK million (Q4 2014) Retail Corporate EliminationsCollector
Group
Income, external customers 171 104 – 275Income, internal – 19 –19 –Total income 171 123 –19 275
Profit before tax 40 39 – 79
Lending and other accounts receivables 3,740 1,909 5,649
Amounts in SEK million (full year 2015) Retail Corporate EliminationsCollector
Group
Income, external customers 804 383 – 1,187Income, internal 57 38 –95 –Total income 861 421 –95 1,187
Profit before tax 238 133 – 371
Lending and other accounts receivables 5,420 3,277 8,697
Amounts in SEK million (full year 2014) Retail Corporate EliminationsCollector
Group
Income, external customers 602 314 – 916Income, internal 34 47 –82 0Total income 636 362 –82 916
Profit before tax 150 94 – 244
Lending and other accounts receivables 3,740 1,909 – 5,649
Collector AB (publ) 556560-0797, P.O. Box 119 14, 404 39 Gothenburg, Sweden | Telephone +46 10 161 00 00 | Email [email protected] | www.collector.se
16
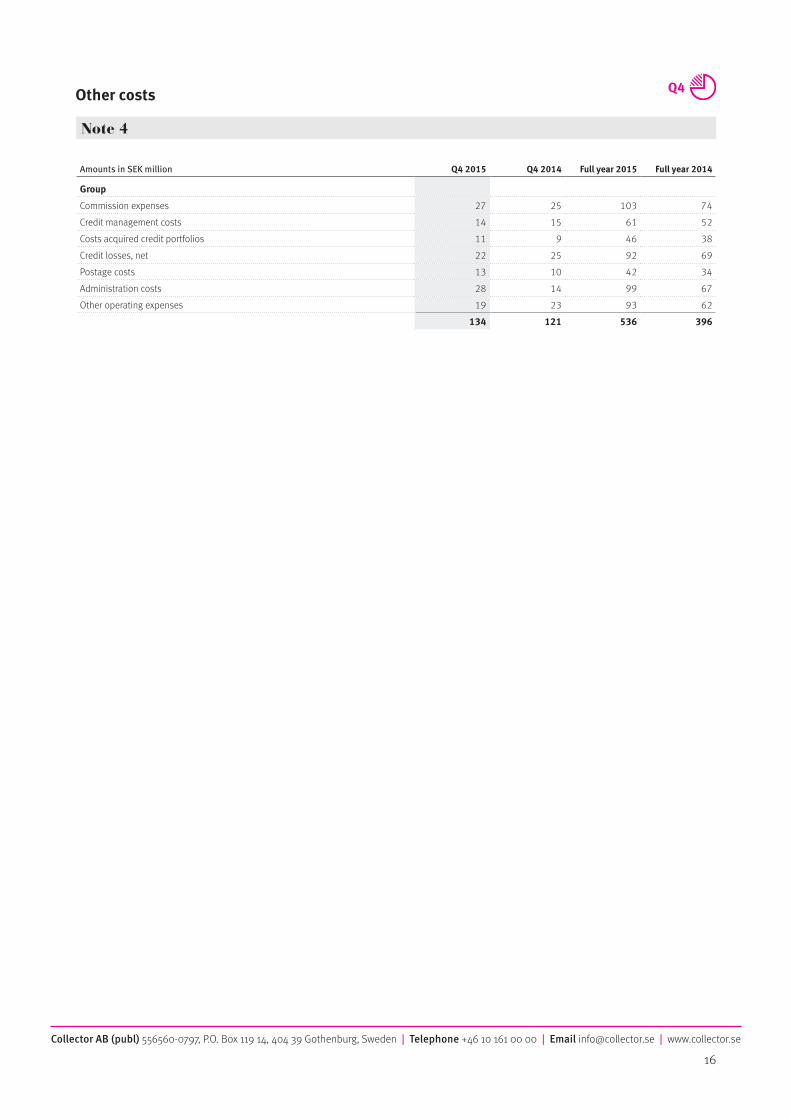
Other costs
Note 4
Amounts in SEK million Q4 2015 Q4 2014 Full year 2015 Full year 2014
Group
Commission expenses 27 25 103 74 Credit management costs 14 15 61 52Costs acquired credit portfolios 11 9 46 38Credit losses, net 22 25 92 69Postage costs 13 10 42 34Administration costs 28 14 99 67Other operating expenses 19 23 93 62
134 121 536 396
Collector AB (publ) 556560-0797, P.O. Box 119 14, 404 39 Gothenburg, Sweden | Telephone +46 10 161 00 00 | Email [email protected] | www.collector.se
17
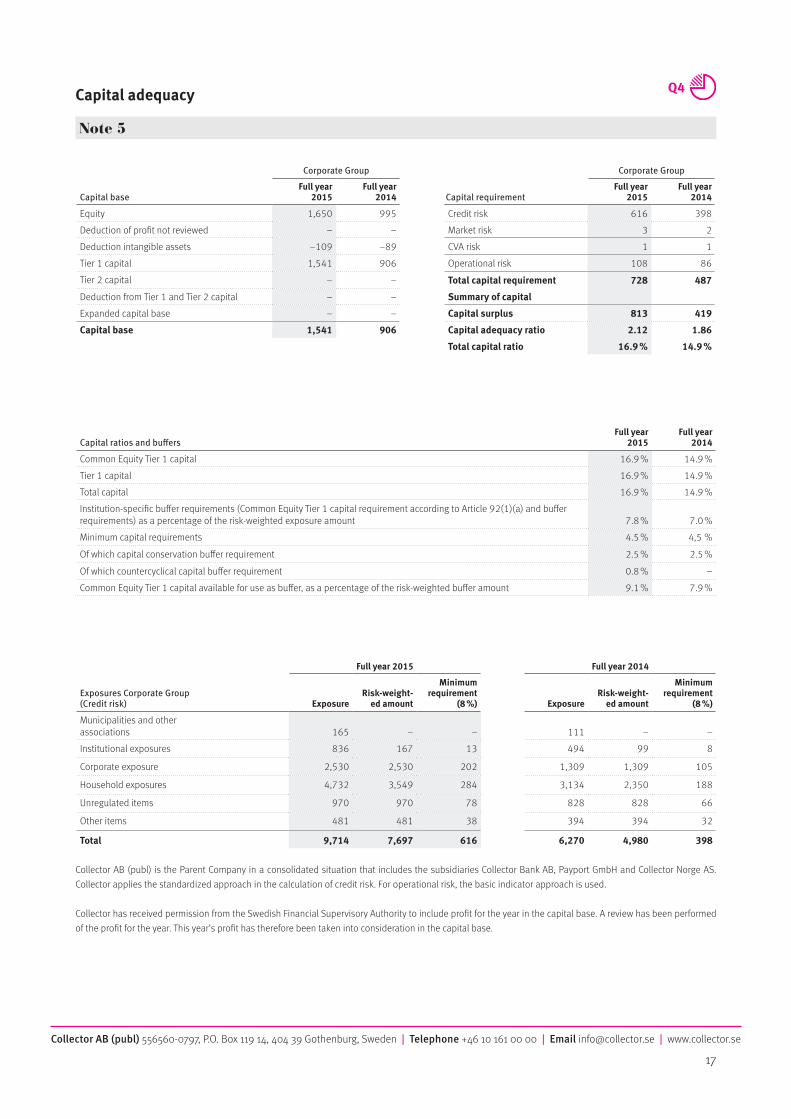
Capital adequacy
Corporate Group
Capital requirementFull year
2015Full year
2014
Credit risk 616 398Market risk 3 2CVA risk 1 1Operational risk 108 86
Total capital requirement 728 487
Summary of capital
Capital surplus 813 419
Capital adequacy ratio 2.12 1.86
Total capital ratio 16.9 % 14.9 %
Full year 2015 Full year 2014
Exposures Corporate Group (Credit risk) Exposure
Risk-weight-ed amount
Minimum requirement
(8 %) ExposureRisk-weight-
ed amount
Minimum requirement
(8 %)
Municipalities and other associations 165 – – 111 – –Institutional exposures 836 167 13 494 99 8
Corporate exposure 2,530 2,530 202 1,309 1,309 105
Household exposures 4,732 3,549 284 3,134 2,350 188
Unregulated items 970 970 78 828 828 66
Other items 481 481 38 394 394 32
Total 9,714 7,697 616 6,270 4,980 398
Collector AB (publ) is the Parent Company in a consolidated situation that includes the subsidiaries Collector Bank AB, Payport GmbH and Collector Norge AS. Collector applies the standardized approach in the calculation of credit risk. For operational risk, the basic indicator approach is used.
Collector has received permission from the Swedish Financial Supervisory Authority to include profit for the year in the capital base. A review has been performed of the profit for the year. This year’s profit has therefore been taken into consideration in the capital base.
Corporate Group
Capital baseFull year
2015Full year
2014
Equity 1,650 995Deduction of profit not reviewed – –Deduction intangible assets –109 –89Tier 1 capital 1,541 906Tier 2 capital – –
Deduction from Tier 1 and Tier 2 capital – –Expanded capital base – –Capital base 1,541 906
Note 5
Capital ratios and buffersFull year
2015Full year
2014
Common Equity Tier 1 capital 16.9 % 14.9 %Tier 1 capital 16.9 % 14.9 %Total capital 16.9 % 14.9 %Institution-specific buffer requirements (Common Equity Tier 1 capital requirement according to Article 92(1)(a) and buffer requirements) as a percentage of the risk-weighted exposure amount
7.8 %
7.0 %
Minimum capital requirements 4.5 % 4,5 %
Of which capital conservation buffer requirement 2.5 % 2.5 %
Of which countercyclical capital buffer requirement 0.8 % –Common Equity Tier 1 capital available for use as buffer, as a percentage of the risk-weighted buffer amount 9.1 % 7.9 %
Collector AB (publ) 556560-0797, P.O. Box 119 14, 404 39 Gothenburg, Sweden | Telephone +46 10 161 00 00 | Email [email protected] | www.collector.se
18
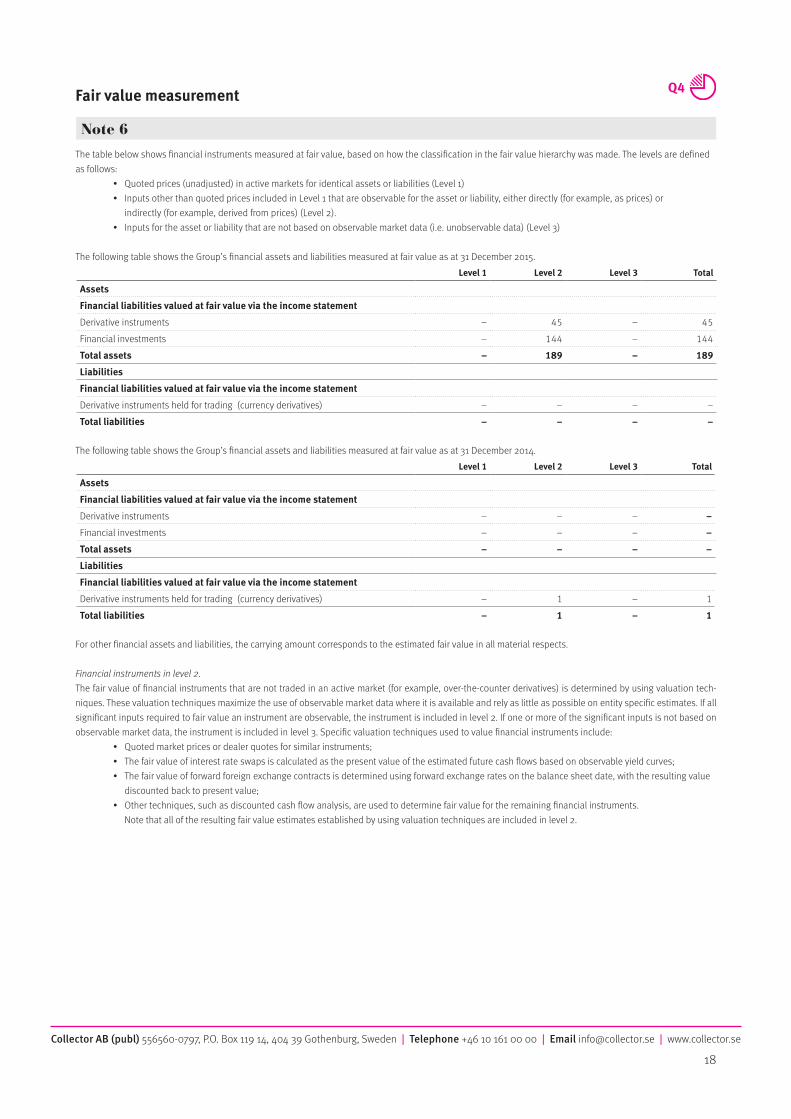
Fair value measurement
The table below shows financial instruments measured at fair value, based on how the classification in the fair value hierarchy was made. The levels are defined as follows: • Quoted prices (unadjusted) in active markets for identical assets or liabilities (Level 1) • Inputs other than quoted prices included in Level 1 that are observable for the asset or liability, either directly (for example, as prices) or indirectly (for example, derived from prices) (Level 2). • Inputs for the asset or liability that are not based on observable market data (i.e. unobservable data) (Level 3)
The following table shows the Group’s financial assets and liabilities measured at fair value as at 31 December 2015.Level 1 Level 2 Level 3 Total
Assets
Financial liabilities valued at fair value via the income statement
Derivative instruments – 45 – 45 Financial investments – 144 – 144Total assets – 189 – 189
Liabilities
Financial liabilities valued at fair value via the income statement
Derivative instruments held for trading (currency derivatives) – – – –Total liabilities – – – –
The following table shows the Group’s financial assets and liabilities measured at fair value as at 31 December 2014.Level 1 Level 2 Level 3 Total
Assets
Financial liabilities valued at fair value via the income statement
Derivative instruments – – – –
Financial investments – – – –
Total assets – – – –
Liabilities
Financial liabilities valued at fair value via the income statement
Derivative instruments held for trading (currency derivatives) – 1 – 1Total liabilities – 1 – 1
For other financial assets and liabilities, the carrying amount corresponds to the estimated fair value in all material respects.
Financial instruments in level 2.The fair value of financial instruments that are not traded in an active market (for example, over-the-counter derivatives) is determined by using valuation tech-niques. These valuation techniques maximize the use of observable market data where it is available and rely as little as possible on entity specific estimates. If all significant inputs required to fair value an instrument are observable, the instrument is included in level 2. If one or more of the significant inputs is not based on observable market data, the instrument is included in level 3. Specific valuation techniques used to value financial instruments include: • Quoted market prices or dealer quotes for similar instruments; • The fair value of interest rate swaps is calculated as the present value of the estimated future cash flows based on observable yield curves; • The fair value of forward foreign exchange contracts is determined using forward exchange rates on the balance sheet date, with the resulting value discounted back to present value; • Other techniques, such as discounted cash flow analysis, are used to determine fair value for the remaining financial instruments. Note that all of the resulting fair value estimates established by using valuation techniques are included in level 2.
Note 6