Embed Size (px)
Citation preview
1
President & CEO Staffan Hanstorp
Year-End Report 2015January 1 – December 31
February 5, 2016
2
Agenda
Quarterly and full-year summary
Significant events
Financial development
The business
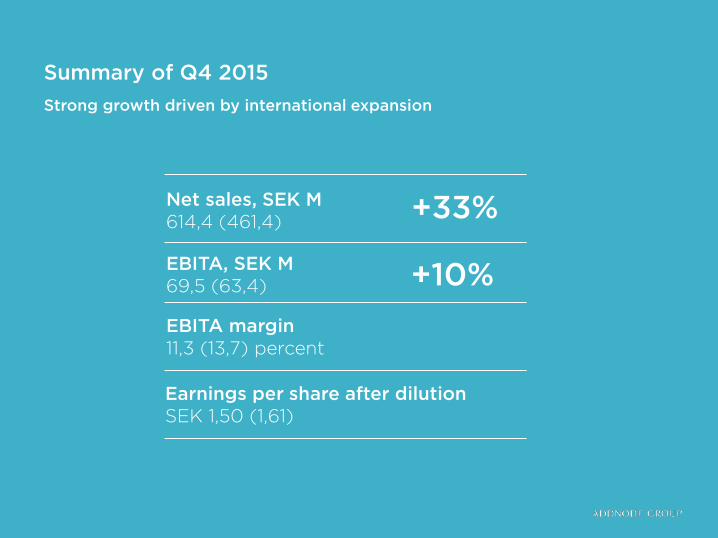
Summary of Q4 2015Strong growth driven by international expansion
Net sales, SEK M 614,4 (461,4)
EBITA, SEK M 69,5 (63,4)
EBITA margin11,3 (13,7) percent
Earnings per share after dilutionSEK 1,50 (1,61)
+33%
+10%
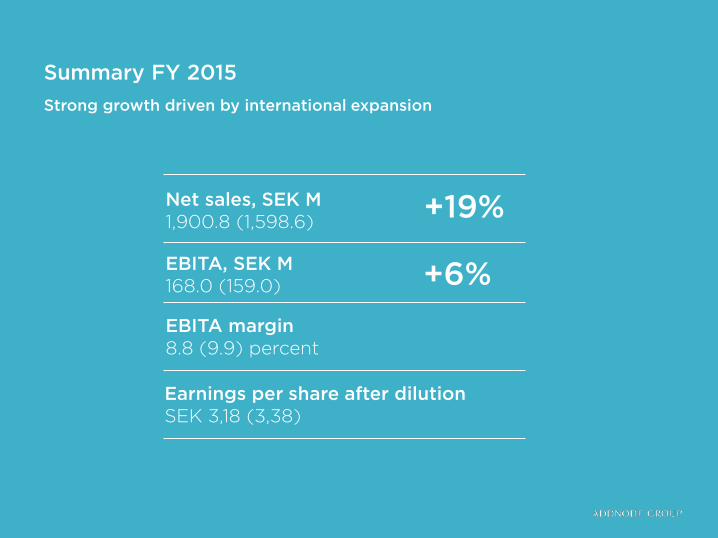
Summary FY 2015Strong growth driven by international expansion
Net sales, SEK M 1,900.8 (1,598.6)
EBITA, SEK M 168.0 (159.0)
EBITA margin8.8 (9.9) percent
Earnings per share after dilutionSEK 3,18 (3,38)
+19%
+6%
Significant events during Q4 2015
Ida Infront has renewed the agreement withthe Swedish Transport Administration (Trafikverket), order value of SEK 12 M
Parts of Cad-Q’s business model are changing
Significant events after the end of the period
Renewed agreement with technical consultancy company, order value of SEK 31 M.
Renewed agreement with German car manufacturer, order value of approximately SEK 75 M.
Acquisition of software company 5D System.
The Board of Directors proposes an unchanged dividend of SEK 2.25 (2.25) per share.
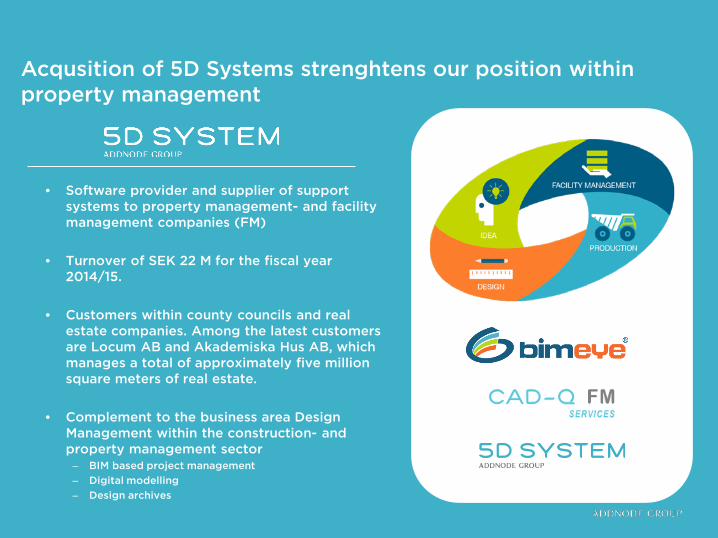
Acqusition of 5D Systems strenghtens our position withinproperty management
• Software provider and supplier of support systems to property management- and facility management companies (FM)
• Turnover of SEK 22 M for the fiscal year 2014/15.
• Customers within county councils and real estate companies. Among the latest customers are Locum AB and Akademiska Hus AB, which manages a total of approximately five million square meters of real estate.
• Complement to the business area Design Management within the construction- and property management sector
– BIM based project management– Digital modelling– Design archives
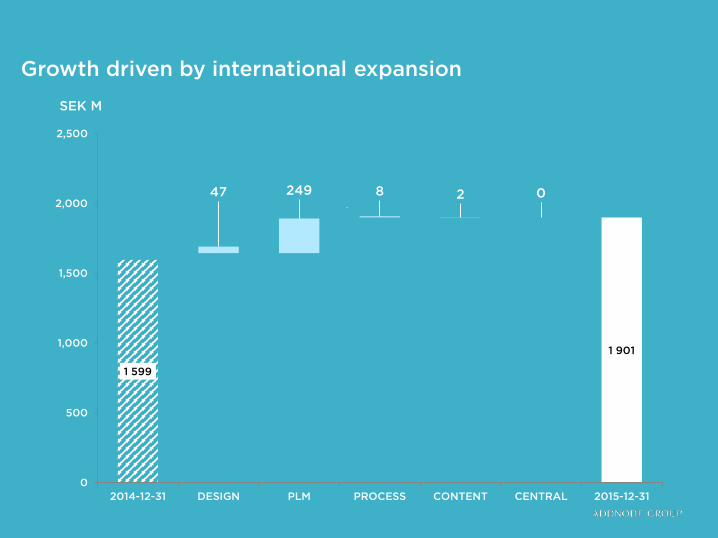
1 599
47 249 8 2 0
1 901
0
500
1,000
1,500
2,000
2,500
2014-12-31 DESIGN PLM PROCESS CONTENT CENTRAL 2015-12-31
Growth driven by international expansion
SEK M
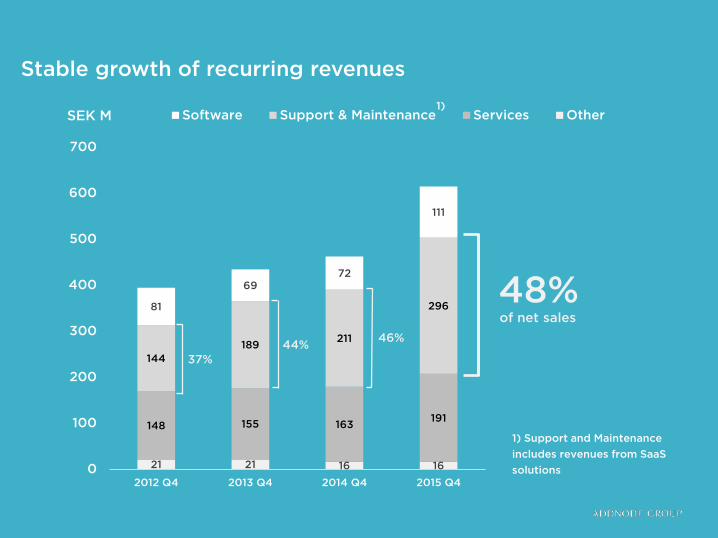
Stable growth of recurring revenues
21 21 16 16
148 155 163 191
144189 211
29681
6972
111
0
100
200
300
400
500
600
700
2012 Q4 2013 Q4 2014 Q4 2015 Q4
Software Support & Maintenance Services Other
48% of net sales
37%44% 46%
SEK M1)
1) Support and Maintenanceincludes revenues from SaaSsolutions
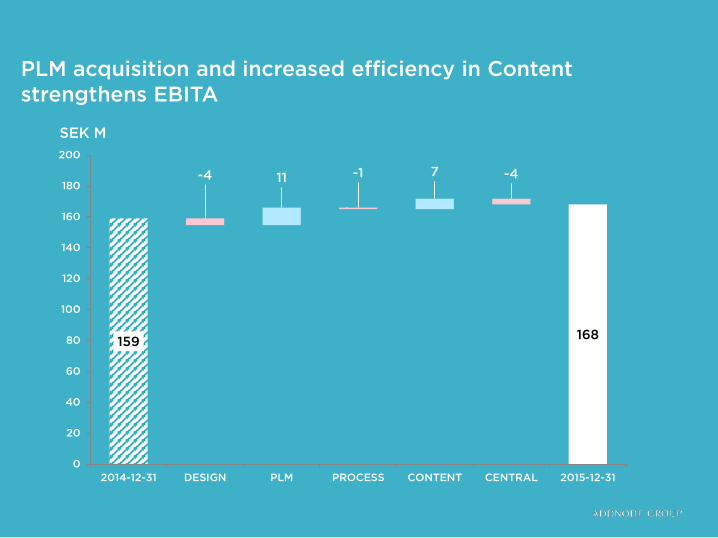
PLM acquisition and increased efficiency in Content strengthens EBITA
159
-4 11 -1 7 -4
168
0
20
40
60
80
100
120
140
160
180
200
2014-12-31 DESIGN PLM PROCESS CONTENT CENTRAL 2015-12-31
SEK M
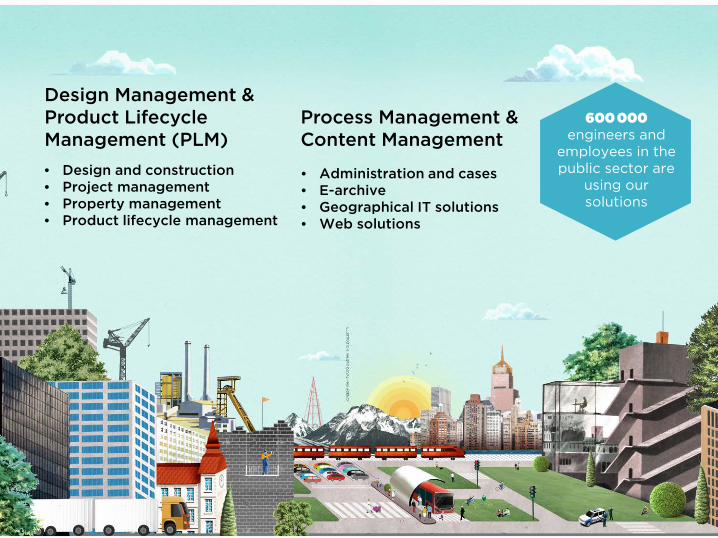
600 000 engineers and
employees in the public sector are
using our solutions
Design Management & Product Lifecycle Management (PLM)• Design and construction• Project management• Property management• Product lifecycle management
Process Management & Content Management
• Administration and cases• E-archive• Geographical IT solutions• Web solutions
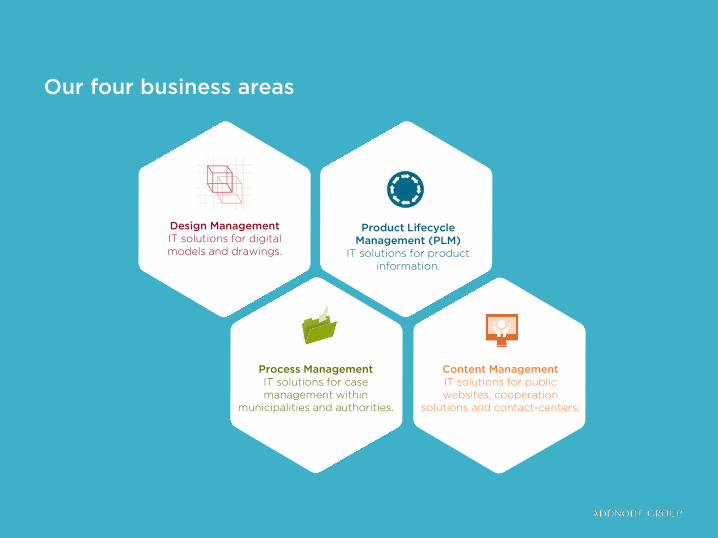
Our four business areas
Design ManagementIT solutions for digital models and drawings.
Product Lifecycle Management (PLM)
IT solutions for product information.
Process Management IT solutions for casemanagement within
municipalities and authorities.
Content ManagementIT solutions for public websites, cooperation
solutions and contact-centers.
Design ManagementIT solutions for design and construction.
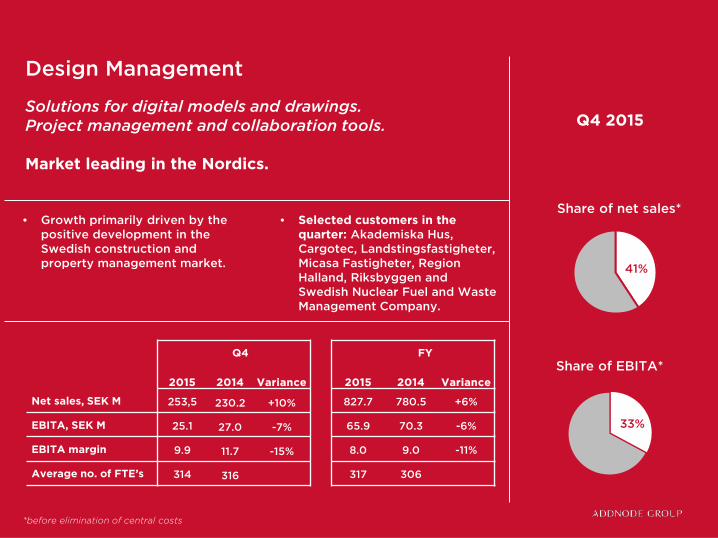
Solutions for digital models and drawings. Project management and collaboration tools.
Market leading in the Nordics.
41%
Share of net sales*
33%
Share of EBITA*
Q4 2015
Q4 FY
2015 2014 Variance 2015 2014 Variance
Net sales, SEK M 253,5 230.2 +10% 827.7 780.5 +6%
EBITA, SEK M 25.1 27.0 -7% 65.9 70.3 -6%
EBITA margin 9.9 11.7 -15% 8.0 9.0 -11%
Average no. of FTE’s 314 316 317 306
Design Management
• Growth primarily driven by the positive development in the Swedish construction and property management market.
• Selected customers in the quarter: Akademiska Hus, Cargotec, Landstingsfastigheter, Micasa Fastigheter, Region Halland, Riksbyggen and Swedish Nuclear Fuel and Waste Management Company.
*before elimination of central costs
Product Lifecycle Management (PLM)IT solutions for product information.
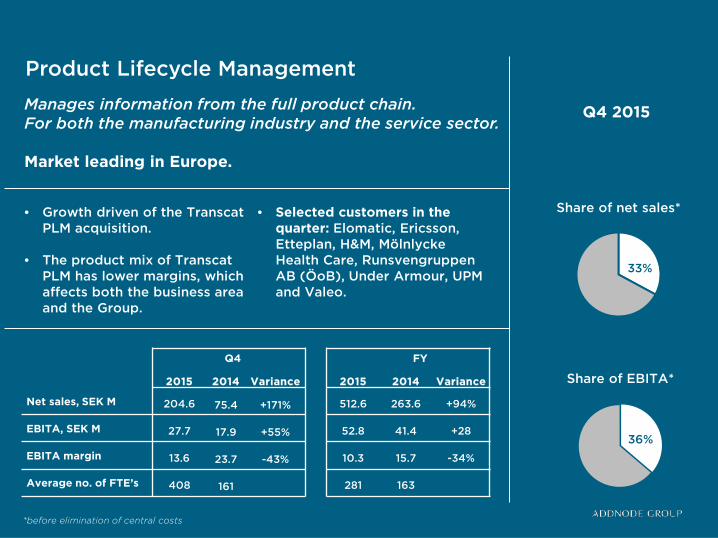
Manages information from the full product chain. For both the manufacturing industry and the service sector.
Market leading in Europe.
33%
Share of net sales*
36%
Share of EBITA*
Q4 2015
Product Lifecycle Management
• Growth driven of the TranscatPLM acquisition.
• The product mix of TranscatPLM has lower margins, which affects both the business area and the Group.
• Selected customers in the quarter: Elomatic, Ericsson, Etteplan, H&M, MölnlyckeHealth Care, RunsvengruppenAB (ÖoB), Under Armour, UPM and Valeo.
Q4 FY
2015 2014 Variance 2015 2014 Variance
Net sales, SEK M 204.6 75.4 +171% 512.6 263.6 +94%
EBITA, SEK M 27.7 17.9 +55% 52.8 41.4 +28
EBITA margin 13.6 23.7 -43% 10.3 15.7 -34%
Average no. of FTE’s 408 161 281 163
*before elimination of central costs
Process Management IT solutions for document and casemanagement for municipalities and authorities.
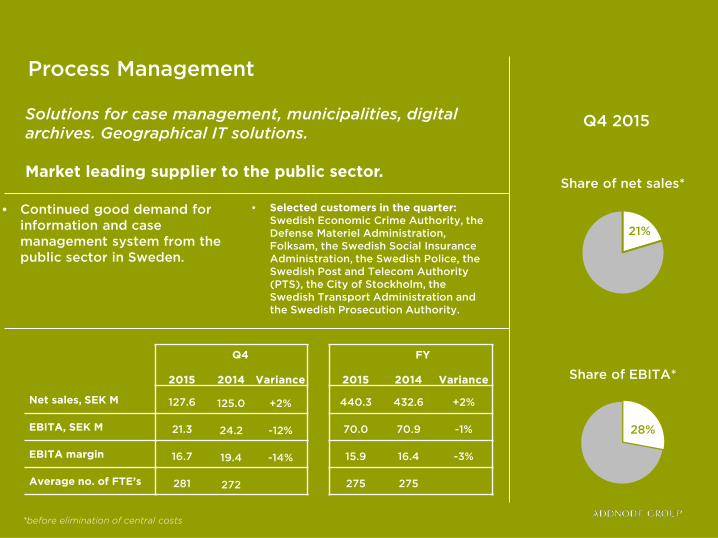
Solutions for case management, municipalities, digital archives. Geographical IT solutions.
Market leading supplier to the public sector.
21%
Share of net sales*
28%
Share of EBITA*
Q4 2015
Process Management
• Continued good demand for information and case management system from the public sector in Sweden.
• Selected customers in the quarter: Swedish Economic Crime Authority, the Defense Materiel Administration, Folksam, the Swedish Social Insurance Administration, the Swedish Police, the Swedish Post and Telecom Authority (PTS), the City of Stockholm, the Swedish Transport Administration and the Swedish Prosecution Authority.
Q4 FY
2015 2014 Variance 2015 2014 Variance
Net sales, SEK M 127.6 125.0 +2% 440.3 432.6 +2%
EBITA, SEK M 21.3 24.2 -12% 70.0 70.9 -1%
EBITA margin 16.7 19.4 -14% 15.9 16.4 -3%
Average no. of FTE’s 281 272 275 275
*before elimination of central costs
Content ManagementIT solutions for websites, collaboration tools and contact-centers.
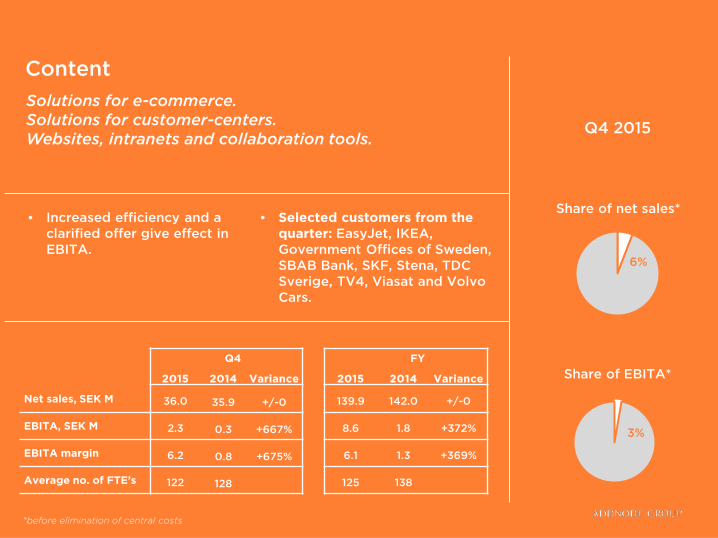
Solutions for e-commerce. Solutions for customer-centers. Websites, intranets and collaboration tools.
6%
Share of net sales*
3%
Share of EBITA*
Q4 2015
Q4 FY
2015 2014 Variance 2015 2014 Variance
Net sales, SEK M 36.0 35.9 +/-0 139.9 142.0 +/-0
EBITA, SEK M 2.3 0.3 +667% 8.6 1.8 +372%
EBITA margin 6.2 0.8 +675% 6.1 1.3 +369%
Average no. of FTE’s 122 128 125 138
Content
• Increased efficiency and a clarified offer give effect in EBITA.
• Selected customers from the quarter: EasyJet, IKEA, Government Offices of Sweden, SBAB Bank, SKF, Stena, TDC Sverige, TV4, Viasat and Volvo Cars.
*before elimination of central costs
21
Financial development
Johan Andersson CFO
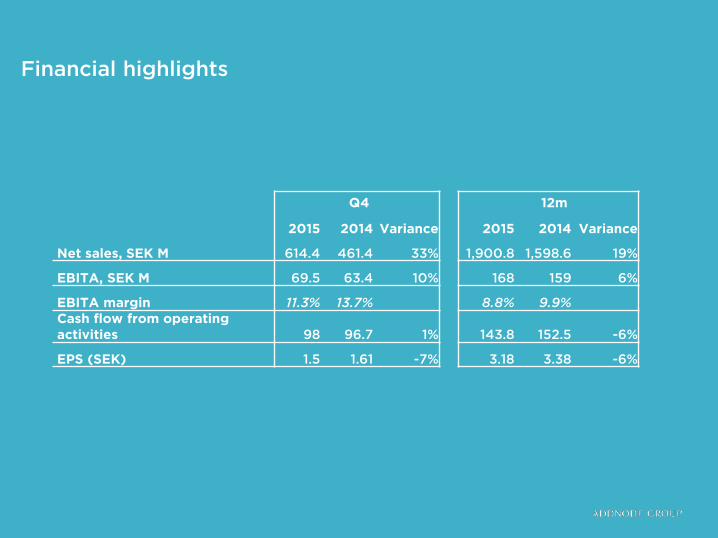
Q4 12m
2015 2014 Variance 2015 2014 Variance
Net sales, SEK M 614.4 461.4 33% 1,900.8 1,598.6 19%
EBITA, SEK M 69.5 63.4 10% 168 159 6%
EBITA margin 11.3% 13.7% 8.8% 9.9%Cash flow from operating activities 98 96.7 1% 143.8 152.5 -6%
EPS (SEK) 1.5 1.61 -7% 3.18 3.38 -6%
Financial highlights
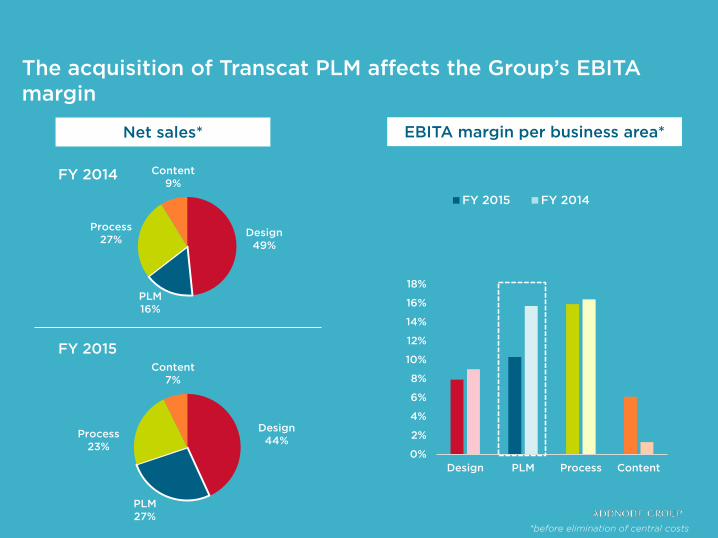
The acquisition of Transcat PLM affects the Group’s EBITA margin
Design44%
PLM27%
Process23%
Content7%
Design49%
PLM16%
Process27%
Content9%
Net sales*
FY 2014
FY 2015
EBITA margin per business area*
0%
2%
4%
6%
8%
10%
12%
14%
16%
18%
Design PLM Process Content
FY 2015 FY 2014
*before elimination of central costs
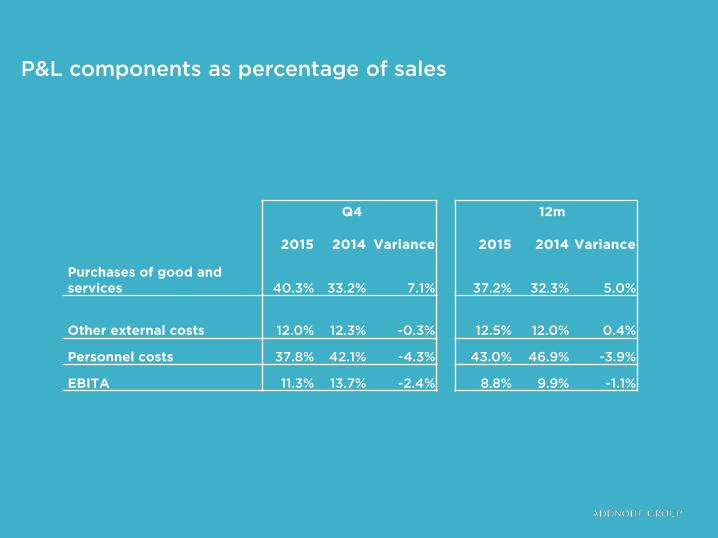
Q4 12m
2015 2014 Variance 2015 2014 Variance
Purchases of good and services 40.3% 33.2% 7.1% 37.2% 32.3% 5.0%
Other external costs 12.0% 12.3% -0.3% 12.5% 12.0% 0.4%
Personnel costs 37.8% 42.1% -4.3% 43.0% 46.9% -3.9%
EBITA 11.3% 13.7% -2.4% 8.8% 9.9% -1.1%
P&L components as percentage of sales
25
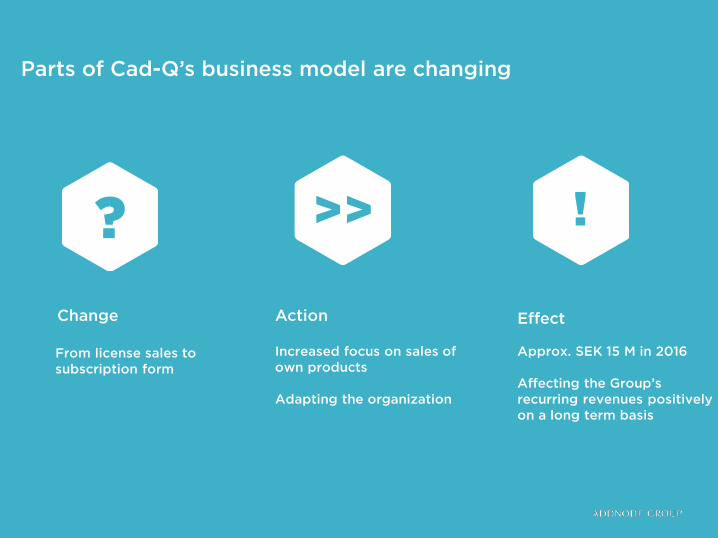
From license sales to subscription form
Increased focus on sales ofown products
Adapting the organization
Approx. SEK 15 M in 2016
Affecting the Group’srecurring revenues positivelyon a long term basis
? >> !
Change Action Effect
Parts of Cad-Q’s business model are changing
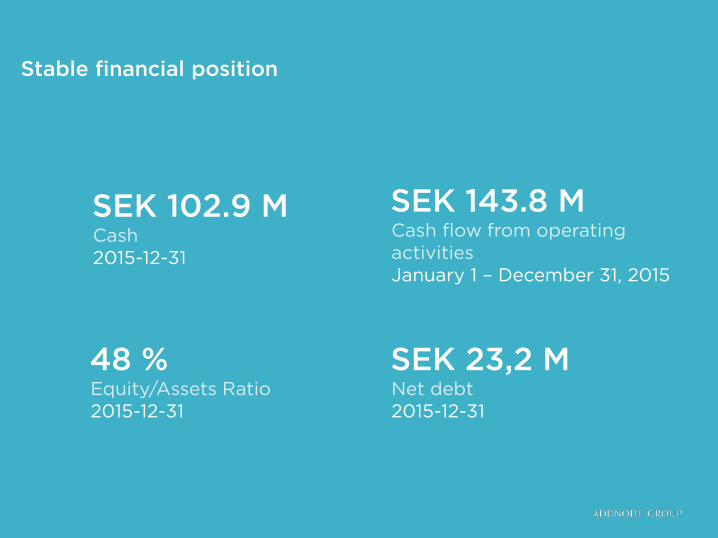
Cash2015-12-31
SEK 102.9 M
Equity/Assets Ratio2015-12-31
48 %
Cash flow from operating activitiesJanuary 1 – December 31, 2015
SEK 143.8 M
Net debt2015-12-31
SEK 23,2 M
Stable financial position
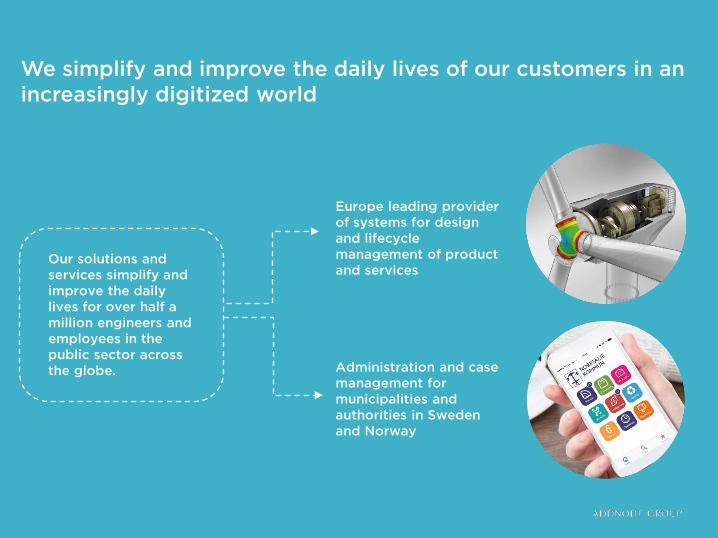
We simplify and improve the daily lives of our customers in an increasingly digitized world
Our solutions and services simplify and improve the dailylives for over half a million engineers and employees in the public sector acrossthe globe.
Europe leading providerof systems for design and lifecyclemanagement of productand services
Administration and casemanagement for municipalities and authorities in Sweden and Norway
28
Questions?
President and CEOStaffan Hanstorp [email protected] +46 (0) 733 77 24 30
CFO and Head of Investor RelationsJohan Andersson [email protected] +46 (0) 704 20 58 31