Embed Size (px)
Citation preview

2002
Annual ReportYear Ended March 31, 2003
Nissan: Enriching people’s lives
Fiscal year 2002 saw the launch of the NISSAN 180
three-year business plan. Its result for the first year:
operating profit of ¥737 billion, and an industry-leading
operating margin of 10.8 percent. Automotive debt was
completely eliminated. Two of the plan’s main goals
were achieved within NISSAN 180’s first year. We’re
pleased to share this news of NISSAN 180’s smooth
progress in this Annual Report.
As it celebrates its 70th anniversary, Nissan can
proudly point to an increasingly strong product
development capability and much stronger brand
power in its markets around the globe. It will continue
to work toward achieving all the goals of NISSAN 180
while pursuing the corporate vision of “Enriching
people’s lives.”
Join us in this Annual Report, as we share our vision
for the future of Nissan.
VisionNissan: Enriching people’s lives
MissionNissan provides unique and innovative automotive
products and services that deliver superior measurable
values to all stakeholders* in alliance with Renault.
*Our stakeholders include customers, shareholders, employees, dealers,suppliers, as well as the communities where we work and operate.
This Annual Report contains forward-looking statements on Nissan’s futureplans and targets, and related operating investment, product planning andproduction targets. Please note that there can be no assurance that thesetargets and plans will actually be achieved. Achieving them will depend onmany factors, including not only Nissan’s activities and development, but onthe dynamics of the automobile industry worldwide and the global economy.
Contents
1 Financial Highlights
2 Letter from the President and CEO
6 Business Overview: Nissan: Once Again Among the Pacesetters
12 Nissan Management Way: Focus on the Quality of Management
14 Products: Success Through New Products
18 Design: Building the Brand with World-Leading Design
20 Technology: Investment for the Future
23 Telematics/IT and ITS: Creating Comfortable, Convenient Driving
24 Environment: Environmental Action Plan
26 Safety: The Quest for Real World Safety
28 Manufacturing: Building on Top Productivity
31 Purchasing: A Win-Win Relationship
32 Sales and Marketing: Moving into Extended Growth
37 Sales Financing: Providing Comprehensive Sales Financing Services
38 Corporate Citizenship: Supporting Tomorrow’s Society
40 Alliance with Renault: Synergies for Growth
42 Motorsports: Putting Technology to the Test
43 Industrial Machinery & Marine Business: Applying Automotive Abilities
44 Nissan Executives
46 Corporate Data
47 Financial Section
47 Consolidated Five-Year Summary
48 Financial Review
52 Consolidated Balance Sheets
54 Consolidated Statements of Operations
55 Consolidated Statements of Shareholders’ Equity
56 Consolidated Statements of Cash Flows
57 Notes to Consolidated Financial Statements
84 Report of Independent Auditors
85 Non-Consolidated Five-Year Summary
86 Subsidiaries and Affiliates
On the cover: FAIRLADY Z

Nissan Annual Report 2002 1
Millions of yen Millions of(except per share amounts and number of employees) U.S. dollars(Note 1)
2002 2001 2000 1999 1998 2002For the years ended Mar. 31, 2003 Mar. 31, 2002 Mar. 31, 2001 Mar. 31, 2000 Mar. 31, 1999 Mar. 31, 2003
Net sales ¥6,828,588 ¥6,196,241 ¥6,089,620 ¥5,977,075 ¥6,580,001 $56,905
Operating income 737,230 489,215 290,314 82,565 109,722 6,144
Net income (loss) 495,165 372,262 331,075 (684,363) (27,714) 4,126
Net income (loss) per share(Note 2) 117.75 92.61 83.53 (179.98) (11.03) 0.98
Cash dividends paid(Note 3) 50,800 27,841 0 0 17,591 423
Shareholders’ equity(Note 4) ¥1,808,304 ¥1,620,822 ¥ 957,939 ¥ 563,830 ¥ 943,365 $15,069
Total assets(Note 4) 7,349,183 7,215,005 6,451,243 6,175,658 6,606,331 61,243
Net consolidated automotive debt (8,602) 431,714 952,657 1,348,696 1,867,100 (72)
Number of employees 127,625 125,099 133,833 141,526 131,260
Notes: 1. Unless indicated otherwise, all dollar figures herein refer to U.S. currency. Yen amounts have been translated into U.S. dollars, forconvenience only, at ¥120=$1, the approximate exchange rate on March 31, 2003.
Notes: 2. Net income (loss) per share amounts are based on the weighted average number of shares of common stock outstanding during each year.Figures for net income (loss) per share are in exact yen and U.S. dollars.Number of shares outstanding as of March 31, 2003: 4,520,715,112.
Notes: 3. Cash dividends during the full year by subsidiary companies to non-Nissan minority shareholders are not included.Notes: 4. Shareholders’ equity and total assets for fiscal years 1998-1999 were restated in accordance with the changes in the regulations relating to
the presentation of currency translation adjustments effective fiscal year 2000.
6,580 5,977 6,090 6,196
Net Sales(Billions of yen)
’98 ’99 ’00
6,829
’01 ’02
110 83 290
Operating Income (Billions of yen)
’98 ’99 ’00
489
’01
737
’02
1,867 2,041
Net ConsolidatedAutomotive Debt(Billions of yen)
’98’98
(28)
(684)
331
Net Income (Loss)(Billions of yen)
’98 ’99 ’00
372
’01
495
’02
*restated under the new GAAP
1,349 953
’99 ’00
432 (9)
’01 ’02*
Financial HighlightsNissan Motor Co., Ltd. and Consolidated SubsidiariesFiscal years 2002, 2001, 2000, 1999 and 1998

Nissan Annual Report 20022
Letter from the President and CEO
The first year of NISSAN 180 is now history.
The results are a matter of public record. Record-setting revenues, an
industry-leading operating margin, the total elimination of net automotive
debt at constant accounting standards—these results are significant,
certainly, but their achievement is even greater when viewed in the context
of Nissan’s revival process.
Considering the state of affairs in 1999, before the Alliance with
Renault, Nissan’s financial performance over the past four years is nothing
short of remarkable.
Sales revenues have grown by ¥1 trillion. Aside from recognizing the
string of attractive new products that have supported that achievement,
it is important to note that our sales have grown in extremely difficult
market and economic conditions. In the United States, particularly, the
market was artificially fueled by the combination of high cash discounts
and zero percent financing. We have continued to resist that approach.
Our strategy continues to be based more on optimizing profitability than
maximizing volumes.
Another key indicator of performance—operating profit—reflects
a nine-fold increase, and Nissan’s operating margin now leads the industry
at 10.8 percent. I have said on many occasions that profit gives you
important information about your operations. The lack of profit is like
a fever. When your business is not profitable, that’s a serious signal that
something is wrong. Either the products are not right, or marketing is
inefficient, or the cost base is too high—something is wrong. If you ignore
a fever, you can get very sick. If you ignore unprofitability, the situation can
only worsen. So Nissan’s return to significant profitability is a healthy
signal. Our profits tell us that we are doing some things right.
Our consolidated net income of ¥495 billion also reflects a return to
normalcy. After years of low or negative tax rates resulting from prior-year
losses, Nissan is returning to a more standard level of tax payments.
83 290 489 737
Consolidated Operating Profit/Margin
’99 ’00 ’01 ’0212
8
4
0
Operating profit (billions of yen)Operating margin (%)
1.4
4.75
7.910.8
Nissan’s return to significant profitability is a healthy signal;
our profits tell us that we are doing some things right.

Nissan Annual Report 2002 3
The year 2003 will be the first year of normal tax treatment in Japan.
Focusing on total profitability allows us to pay our shareholders
competitive dividends, which is a reasonable expectation. It is also
gratifying to realize that Nissan’s share price more than doubled since the
start of the Nissan Revival Plan in April 2000, even as the Nikkei stock
index has slid 50 percent. Our three-year dividend policy expresses our
confidence in Nissan’s future performance and provides for the tripling of
the dividend by the end of NISSAN 180—from ¥8 per share for fiscal year
2001 to ¥24 per share for fiscal year 2004.
Finally, another important measure of progress is debt reduction.
Before the Alliance, Nissan’s net automotive debt was at the level of ¥2.1
trillion. Today, at constant accounting standards, the debt is gone, and,
more importantly, debt elimination will no longer be a constraint that must
be taken into account as we manage our business. We are free to make
investment decisions only on their merit, using return on invested capital
as a guiding criterion.
The power of peopleAs I review the striking progress Nissan has made over the past few years,
I cannot help but be aware of one more important fact: A major factor in
Nissan’s revival has been our people.
The same people who were worried and frustrated by the state of our
business throughout the 1990s have joined together with great motivation
and determination to reshape Nissan’s fate. Each one is to be commended
for making contributions, both great and small. The teamwork and
performance that put Nissan back on course includes our extended team
as well—our supplier partners, our dealers and our shareholders.
With great faith in our ability to make changes and to create a bold new
direction for our future, we are reviving a proud company. The power of
transformation has come from within. The talents and experience of
125,000 employees around the world are the brainpower and muscle
behind Nissan’s revival. In the lives of the men and women who make up
Nissan’s diverse, global workforce, you can sense the atmosphere of
change in our offices, our plants and our showrooms. Pride is growing.
Mindsets and behaviors have changed. The revival is real.
Opening ceremony of the Canton plant,Mississippi, May 27, 2003

Nissan Annual Report 20024
What is next?How will we follow the record-setting performance of fiscal year 2002?
With more performance and the added stretch of growth.
With our financial position on solid ground, Nissan is now in a position
to take advantage of opportunities in new markets, in new product
segments and in new technologies.
In the coming year, we will enter China with a 50-50 partnership with
DongFeng, one of the country’s three largest truck and car manufacturers.
Our joint venture, Dongfeng Motor Company, has great potential, and we
are optimistic about the opportunities we see with this large, well-
established manufacturer in one of the world’s fastest-growing markets.
In North America, we are breaking new ground as we enter the high-
volume, high-profit full-size vehicle segments that have been the
stronghold of American manufacturers. From our new plant in Canton,
Mississippi, our full-size trucks and sport utility vehicles will generate
incremental sales in segments where Nissan has never had a presence
before. Those new products will not only support our ambitious sales
objective, but, by expanding our North American product lineup, they will
also draw a spotlight on the Nissan brand.
On a broader scale, Nissan continues to make steady and substantial
investments in product and technology developments for the future.
Innovation is the lifeblood of any company’s future. At Nissan,
our commitment is to provide the necessary resources to assure our
long-term competitiveness.
The first year of NISSAN 180 may be over, but our revival is not
yet complete.
We are tempering our enthusiasm for the future with the keen
awareness that the global automotive industry is a demanding
environment. We are continuing to work on costs, quality, sales and
marketing efficiency, distribution efficiency, and all the fundamentals that
are essential to our business. We refuse to be slowed by complacency.
We intend to keep our momentum building.
Nissan continues to make steady and substantial investments
in product and technology developments for the future.
Titan King Cab, the first full-size pickupmade at the Canton plant
Signing agreement creating DongfengMotor Company, September 19, 2002

Nissan Annual Report 2002 5
Even though we have achieved two of our three NISSAN 180 commitments
in the first year—those of achieving an 8 percent operating margin and
zero debt—the commitment to sell an additional one million units will
require our total focus. It’s true that 16 all-new models will support our
sales objectives during the remainder of NISSAN 180, but the sales goal is
high. Our ability to design, produce and sell attractive models will be tested
to the extreme. Our responsibility will be to manage our business so that
Nissan will continue to move forward, achieving all of NISSAN 180 while
remaining the industry’s most profitable global automaker.
In this, our 70th anniversary year, we are grateful for the advances we
have made and the rich heritage of the Nissan name. Even as we make
changes and stretch ourselves to deliver our full potential, some things
will never change. We will continue to honor our commitment to being a
good corporate citizen. Our obligation to protect the environment and use
resources wisely. Our passion to create specific, attractive products for
Nissan customers. Our promise to be transparent with all of our
stakeholders. Our determination to create value and enrich people’s lives.
We remain confident that Nissan’s best years lie ahead. Thank you for
your ongoing support of our efforts.
Carlos Ghosn
President and Chief Executive Officer
Opening ceremony for Yokohama PlantGuest Hall and Engine Museum, March 25,2003
Founded in 1933, Nissan celebrates its 70thanniversary in 2003
Nissan Annual Report 20026
Business Overview
Nissan: Once Again Among the Pacesetters
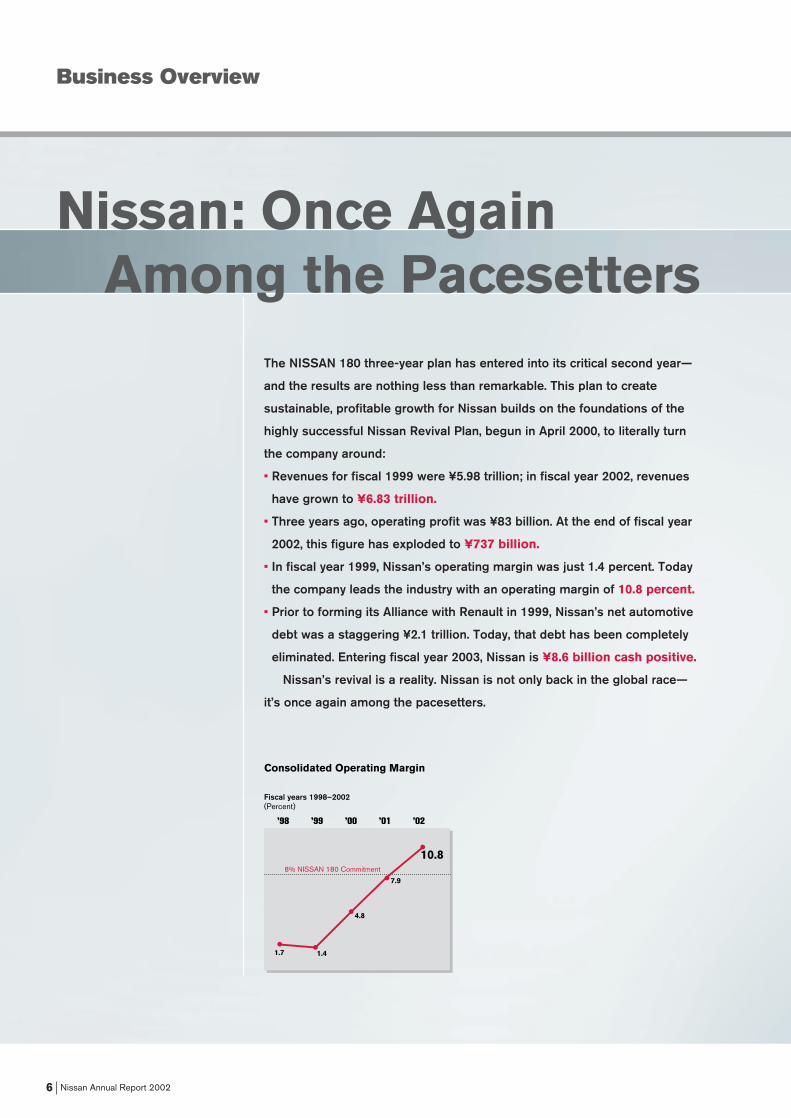
The NISSAN 180 three-year plan has entered into its critical second year—
and the results are nothing less than remarkable. This plan to create
sustainable, profitable growth for Nissan builds on the foundations of the
highly successful Nissan Revival Plan, begun in April 2000, to literally turn
the company around:
• Revenues for fiscal 1999 were ¥5.98 trillion; in fiscal year 2002, revenues
have grown to ¥6.83 trillion.
• Three years ago, operating profit was ¥83 billion. At the end of fiscal year
2002, this figure has exploded to ¥737 billion.
• In fiscal year 1999, Nissan’s operating margin was just 1.4 percent. Today
the company leads the industry with an operating margin of 10.8 percent.
• Prior to forming its Alliance with Renault in 1999, Nissan’s net automotive
debt was a staggering ¥2.1 trillion. Today, that debt has been completely
eliminated. Entering fiscal year 2003, Nissan is ¥8.6 billion cash positive.
Nissan’s revival is a reality. Nissan is not only back in the global race—
it’s once again among the pacesetters.
1.7 1.4
4.8
Fiscal years 1998–2002(Percent)
8% NISSAN 180 Commitment
7.9
’98 ’99 ’00 ’01 ’02
Consolidated Operating Margin
10.8

Nissan Annual Report 2002 7
Debt is goneThe effort to eliminate debt is no longer the driving force in Nissan
business management. Return on Invested Capital (ROIC)—the ratio
between operating profit and automotive fixed assets, net working capital
and cash—will instead take center stage. Nissan now has an ROIC level of
19.8 percent—currently second among major auto manufacturers
worldwide—and Nissan intends to stay at an ROIC level of 20 percent or
higher. In both operating margin and ROIC, Nissan’s objective is to remain
the most profitable global automaker.
Nissan had the best-performing stock of the entire global automotive
industry in fiscal 2002. By the end of fiscal year 2002, the company’s share
price had doubled since the start of the Nissan Revival Plan in April of 2000,
in a period that has seen the Nikkei stock index slide by a full 50 percent.
At the Annual General Meeting in June 2003, the Nissan board of directors
asked shareholders to approve a dividend of ¥14 per share for fiscal year
2002, as announced in October 2002. The annual dividend per share is
planned to increase to ¥19 for fiscal year 2003 and ¥24 for fiscal year 2004.
Fiscal years 1998-2002(Billions of yen)
’98 ’99 ’00 ’01 ’02
2,041 1,349 953 432 (9)
Net Consolidated Automotive Debt
1.3 7.5
12.7
Fiscal years 1999–2004(Percent)
19.8
’99 ’00 ’01 ’02 ’03 ’04
Automotive: ROIC (Return on Invested Capital)
20
NISSAN 180 Target

Nissan Annual Report 20028
When the Nissan Revival Plan was announced in 1999, much of the focus
from outside was on what Nissan had to do to streamline its business—
closing plants, reducing headcounts, shrinking and transforming suppliers
and eliminating non-core assets. This was only one part of the plan’s goals,
however. Its true goal was to free resources so they could be invested in
recovery through a global product and a global brand. It was a plan for the
redeployment of the company for a future of sustainable, profitable growth.
NISSAN 180 has three commitments:
• One million additional vehicles sold worldwide by the end of fiscal year
2004, measured between October 2004 and September 2005 and
compared to fiscal year 2001;
• An eight percent operating margin; and
• Zero net automotive debt, both at constant accounting standards,
Building to One Million Additional Sales
NISSAN 180 Sales Volume(unit: 1,000s)
2,597 3,600
’01 ’04
General Overseas Markets +300K
Europe +100K
U.S. +300K
Japan +300K

Nissan Annual Report 2002 9
In the first year of NISSAN 180, the second commitment of an 8 percent
margin had already been attained, with the company now at the highest
level in the industry.
Automotive debt is now a thing of the past. Now Nissan focuses
on the first commitment, growth.
Expansion in 2003Fiscal year 2003 will mark the start of a dynamic period for Nissan.
Operations have begun at Dongfeng Motor Company, the joint venture
established with DongFeng Motor Corporation in China. Nissan plans to
launch six models by 2006 through Dongfeng, all of which will be
manufactured locally. The first model is the Sunny. By the year 2006,
Nissan targets sales of 550,000 vehicles in China. Nissan’s expansion in
the rapidly developing Chinese market is a long-term project with great
potential; the market represents a significant growth and profit opportunity
for Nissan.
New Models for Fiscal Year 2003
EuropeMicra
Z Coupe
Car-derived Van
JapanNew Presage
Cube derivative
New President
Z Roadster
Mini-LCV
Mini-Truck
Mexico & GOMInfiniti FX35/45
Pathfinder Armada
Murano
Z Roadster
Titan King Cab
Titan Crew Cab
New Quest
Teana
U.S.New Quest
Z Roadster
Pathfinder Armada
Titan King Cab
Titan Crew Cab
Infiniti Full-size SUV
* General Overseas Markets
*
The Sunny, the first model produced atDongfeng Motor Co., Ltd.

Nissan Annual Report 200210
In the United States, the brand-new plant in Canton, Mississippi, is now in
production, with the all-new Quest minivan going on sale in July. Fiscal
year 2003 will very much be the Year of the United States. Five of the six
new models Nissan will launch in the US market will be built in Canton.
Each new model will be launched in high-volume, high-profit segments.
Because Nissan has not participated in the full-size vehicle segment—
where the Titan King Cab, Titan Crew Cab, Pathfinder Armada and Infiniti
full-size SUV will compete—incremental sales and profits are expected to
make a significant contribution to performance in fiscal year 2003.
A Path to Enrich People’s LivesIn 2003, Nissan’s 70th anniversary year, the company’s vision has never
been clearer. Like the Nissan Revival Plan, NISSAN 180 is designed to
build for the future. The company has removed the burden of debt and is
now focusing on providing a top level of return on invested capital. A lean
cost base and the ability to offer attractive products are essential for the
company’s competitiveness. Nissan will continue to fine-tune the same
tools, the same management practices and the same level of commitment
that have contributed to its revival. The company has significantly
increased its capital expenditures, investing in assets that will generate
tomorrow’s sales and profits.
NISSAN 180 is setting a course for sustainable, profitable growth—a
path that will enrich people’s lives.

Nissan Annual Report 2002 11
China: Key Future MarketChina is a huge market, and one that is developing rapidly. With the country’s entry into
the WTO, tariffs are being eliminated, and vehicle sales grew by more than 38 percent
in 2002. If just 10 percent of its population purchases an automobile, this represents a
market roughly the same size as the total population of Japan—clearly a market
demanding a strong presence. China is expected to be a major part of Nissan’s
strategy in the period beyond NISSAN 180. Even today, Nissan sales are taking off in
China, with fiscal year 2002 sales more than double that of fiscal year 2001.
On June 9, 2003, Nissan and DongFeng Motor Corporation announced the joint
establishment of Dongfeng Motor Co., Ltd., the result of a strategic
partnership between the two companies that dates to September of
2002. The company, with the total equity of 16.7 Renminbi (¥240
billion, US$2 billion) held equally by the two partners, began
operations on July 1, 2003. Headquartered in Wuhan, Hubei
Province, Dongfeng Motor Co., Ltd. will employ 74,000, including
employees of affiliated companies.
Dongfeng Motor Co., Ltd. will be the first Sino-foreign, full-line automobile joint
venture in China, producing passenger vehicles, trucks, buses and light commercial
vehicles. Its passenger vehicles will bear the Nissan brand, while most of its
commercial vehicles will carry the Dongfeng brand. Sales by 2006 are targeted at
550,000 units—220,000 passenger vehicles and 330,000 commercial vehicles.
Current plans call for six additional new passenger car models to be produced by
Dongfeng Motor Co., Ltd. by 2006, starting with the Sunny—known locally as the
Yang Guang. The Sunny is being produced at the Huadu plant, Guangzhou, and went
on sale nationwide in China in June 2003, entering a rapidly growing compact car
market in China. Teana, the
luxury sedan successfully
launched in Japan in
February of 2003, will also
be produced by the new
company in 2004.
Press conferenceannouncing theestablishment ofDongfeng Motor Co., Ltd., June 9, 2003
Dongfeng Facilities in China
ShiyanCommercial vehicle plant
LiuzhouCommercial vehicle plant Guangzhou
Passenger vehicle plant
XiangfanCommercial and passenger vehicle plant
WuhanCompany headquarters
HangzhouCommercial vehicle plant
Nissan Management Way
Nissan Annual Report 200212
To be among the world’s best, not only
the quality of the product but the quality
of management is critical to compete.
During the Nissan Revival Plan, the
foundations were created for the Nissan
Management Way, a program to
increase the quality of management and
to increase decision-making speed. The
program’s two cornerstones are cross-
functional teams (CFTs) and the Value-
Up program.
Cross-Functional Teams
In 1999, nine CFTs, international teams
bringing together people from different
business areas within the company,
were established. Each CFT was under
the leadership of two Executive
Committee members, each headed by a
“pilot,” and each given a topic to handle.
There was one goal—to make proposals
to develop Nissan’s business and reduce
costs—and one rule: no sacred cows,
no taboos, no constraints. The NRP was
planned based on these proposals.
Today there are 14 CFTs, and their role
continues: to challenge the company to
do better by addressing strategic and
structural issues, and to propose
breakthrough ideas to enhance the
company’s operations and profitability.
The CFTs are expected to develop
fresh, original ideas without being
bound to past work practices or habits.
One CFT is specifically targeted at
enhancing the quality of management—
to maximize the company’s target
results using a minimum of
management resources in the shortest
possible time.
Focus on the Quality of Management
Nissan knows that success comes from the quality
of management as well as of the product—and
that the company must act more globally.
Addressing this is Nissan Management Way,
intended to provide innovative thinking and faster
decision-making abilities for the company.
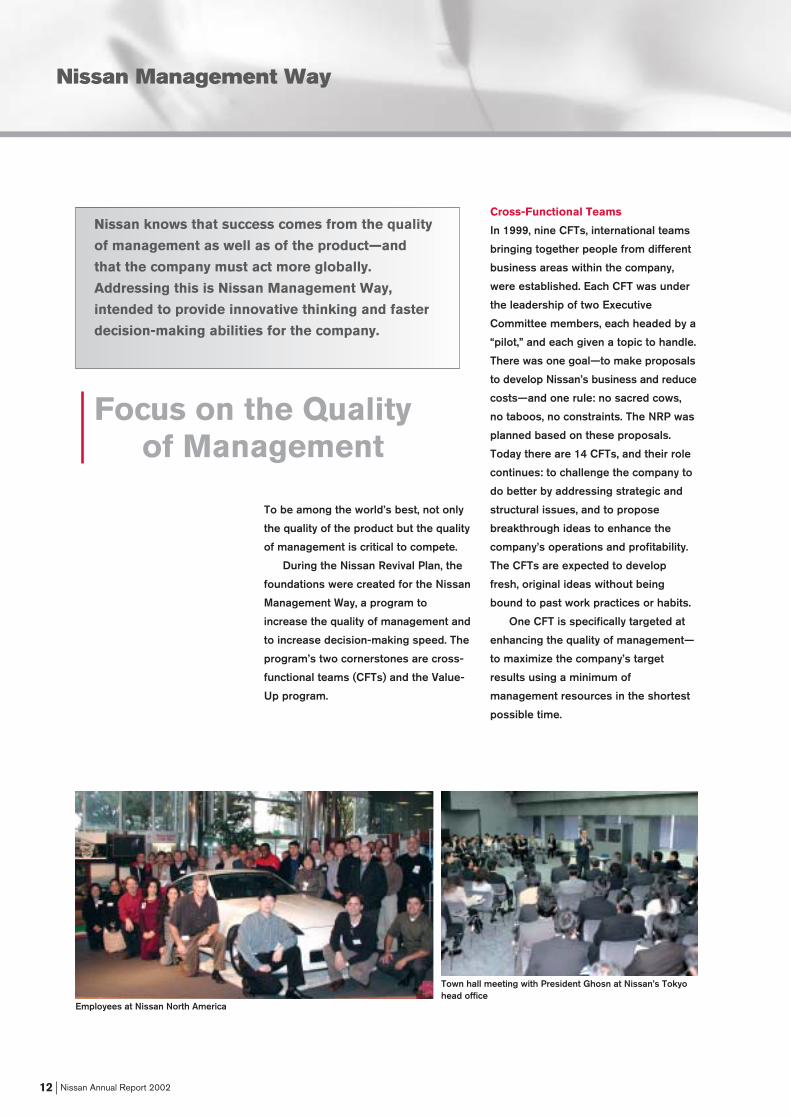
Town hall meeting with President Ghosn at Nissan’s Tokyohead office
Employees at Nissan North America

Nissan Annual Report 2002 13
Cross-functional teams in North
America also have been established to
develop coordinated launch plans for
the Maxima, Quest, Titan and a new full-
size SUV. The launch team concept was
applied very successfully for the launch
of the 2002 Altima, a success attributed
in part to the effective communications
made possible by the CFTs’ high
priority on transparent communications.
Value-Up Program
The Value-Up Program is a tool for
achieving the goals of NISSAN 180,
using successful implementation of
developments obtained during the NRP.
Like the CFTs, the Value-Up Program is
cross-functional across different
departments and is designed to produce
quantifiable, measurable results through
the use of effective tools.
A total of 300 V-Pilots—the leaders
who set the issues to be resolved—and
4,000 crews have been trained, and
some 1,200 Value-Up projects have
been launched. The program has been
in full implementation since April
of 2003.
Employee Feedback Critical
These efforts at increasing quality and
speed during NISSAN 180 are not
simply top-down directives. The
structure of both the CFTs and the
Value-Up teams ensures that ideas are
continuously being brought from within
the company to management. Nissan is
also keenly interested in receiving the
constructive feedback that will shape
management quality. During 2002, a
NISSAN 180 survey of more than 20,000
employees representing all of Nissan
activities worldwide was conducted.
A Focus on Corporate Governance
Corporate governance is a key responsibilityof management. At Nissan, clear managementobjectives and policy are released for allstakeholders, both inside and outside thecompany—shareholders, customers andsuppliers, the local community and, of course,employees. The achievement status andresults of these goals and policies aredisclosed early and with transparency.
Nissan has also adopted a number ofcorporate reforms. The board of directormembership has been reduced from nine toseven members from the June 2003shareholders’ meeting, in order to improvemanagement efficiency.
Auditing has been strengthened byadopting outside corporate auditors as threeof the four corporate auditors. Nissanestablished the Japan Internal Audit Office toconduct internal audits of operations on aregular basis; the Chief Internal Audit Officerconducts global audits. Three-way auditinghas been adopted thorough this combinationof corporate auditors, auditing firms andinternal audit functions.
Nissan has also set out the Nissan GlobalCode of Conduct and established the GlobalCompliance Committee, both intended tostrengthen compliance with laws and ethicsand avoid illegal and unethical conduct withinthe global Nissan group.
President Ghosn with employees on theopening day of the Canton Plant, Mississippi,May 27, 2003

Products
Nissan Annual Report 200214
The future profitable growth of Nissan is
based on one thing: selling automobiles.
NISSAN 180 sets this out with the bold
goal of selling an additional one million
new cars from the beginning of the
program to September 2005: 100,000
additional cars in Europe and 300,000
additional cars each in Japan, the US
and Nissan’s other global markets. It
means the creation of compelling and
profitable new vehicles that can
continue the growth of Nissan’s market
share around the world.
Fiscal year 2002 was the biggest
product year in Nissan history, as the
company launched 12 all-new models
globally, covering everything from
minicars to luxury sedans. By the
completion of NISSAN 180, this will
have risen to at least 28 all-new
vehicles launched to markets
throughout the world.
However, this is not simply about
increasing the number of Nissan cars
available. “There are a lot of new
products coming,” said Nissan
Model Launch Schedule Fiscal years 2000–2004
’00 ’01 ’02 ’03 ’04
4 5 12 16
16 all-new products
Success Through New Products
FAIRLADY Z
Nissan’s strong financial performance in fiscal year
2002 was supported by a wave of new products: 12
all-new models, the biggest production year in
Nissan history. This exciting new lineup of products
will continue to expand and fuel Nissan growth in
the coming years.
Nissan Annual Report 2002 15
President Carlos Ghosn, “but there are
two types of product we will not build:
those that are unprofitable, and those
that fail to quicken your pulse with pure
styling and performance. We are
developing products to enter new
markets and new market segments. We
want a wide base of products that will
help us face the future with stability and
reinforce profit improvement. We have
many very strong products to come—
important products whose full effect
may not be felt until 2003 or 2004.
Those critics who say our recovery is
strictly a result of cost cutting and asset
sales are missing the point, and they
are in for a surprise.”
Japan
Nissan’s strong growth in the Japanese
market during the year was fueled by
the release of a comprehensive lineup
of new models: the Moco, Elgrand,
Fairlady Z, Cube, Skyline Coupe and the
Teana sedan.
The Moco marked Nissan’s entry
into the important minicar market in
Japan (vehicles with engine
displacements of less than 660cc)—
small, but with an unexpected level of
roominess. The Elgrand is Nissan’s
high-end luxury minivan, striking on the
exterior and able to carry eight
passengers in its roomy interior.
The Fairlady Z (350Z in North America)
is the latest incarnation of the classic
Z—and a highly anticipated car. The
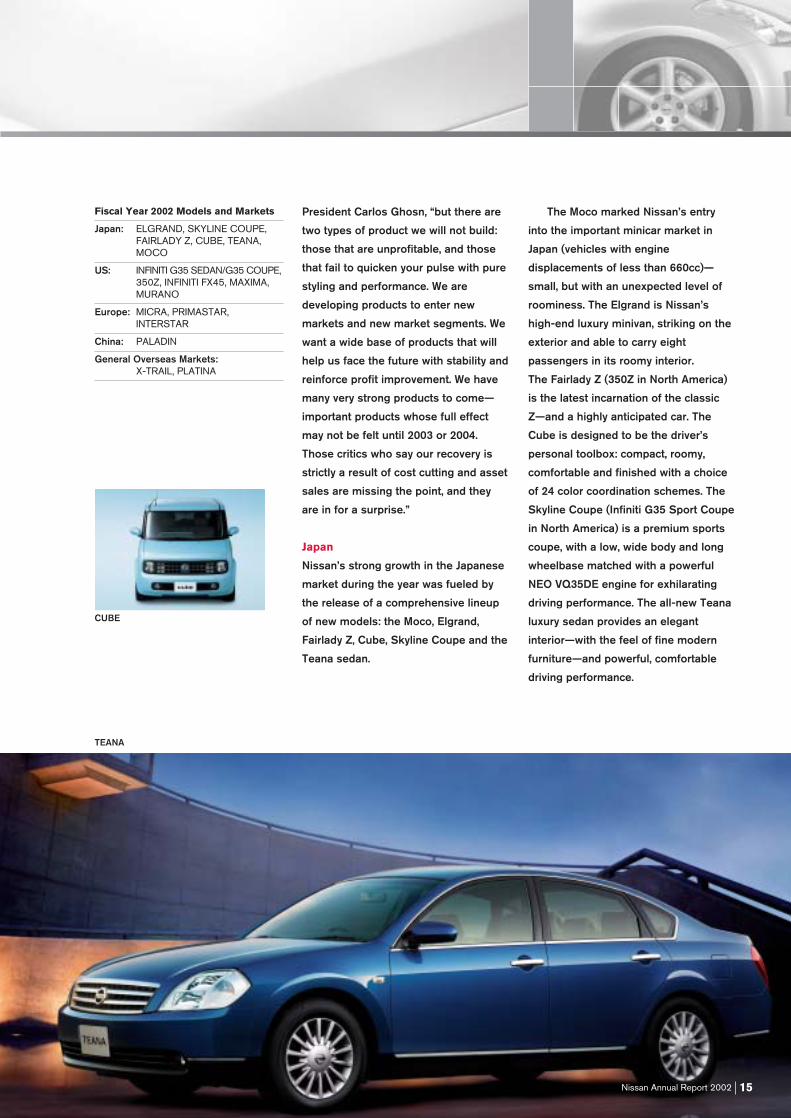
Cube is designed to be the driver’s
personal toolbox: compact, roomy,
comfortable and finished with a choice
of 24 color coordination schemes. The
Skyline Coupe (Infiniti G35 Sport Coupe
in North America) is a premium sports
coupe, with a low, wide body and long
wheelbase matched with a powerful
NEO VQ35DE engine for exhilarating
driving performance. The all-new Teana
luxury sedan provides an elegant
interior—with the feel of fine modern
furniture—and powerful, comfortable
driving performance.
TEANA
Fiscal Year 2002 Models and Markets
Japan: ELGRAND, SKYLINE COUPE,FAIRLADY Z, CUBE, TEANA,MOCO
US: INFINITI G35 SEDAN/G35 COUPE,350Z, INFINITI FX45, MAXIMA,MURANO
Europe: MICRA, PRIMASTAR,INTERSTAR
China: PALADIN
General Overseas Markets:X-TRAIL, PLATINA
CUBE

Nissan Annual Report 200216
North America
The Infiniti G35 Sedan and Coupe,
Murano, 350Z, Infiniti FX45 and new
Maxima were launched in the North
American market. The Murano is a
crossover SUV developed for the North
American market and conceived as a
striking alternative to other crossover
SUVs now entering the market. It uses
the same FF-L platform as the award-
winning Altima to provide the strength
of an SUV below, and the style of a
sport sedan above. The Infiniti FX45 is
also a crossover SUV, providing V8
power with the style and luxury of the
Infiniti name. The Maxima is Nissan’s
flagship sedan in the North American
market—the best-selling import-brand
V6 for the past 17 years (based on R.L.
Polk total registrations). The Altima was
redesigned for 2002 with a new,
distinctive exterior design, sophisticated
drivetrain, performance-oriented
suspension and increases in all major
dimensions, keeping with Nissan’s
design concept for consistency and
design grouping by class combined
with individual styling to heighten the
personality of the individual model.
Europe
The Micra leads Nissan’s efforts in
building the European market. While the
Micra is the sister model of the March in
Japan, it features an interior design
created in Europe and is produced by
Nissan in the UK. The B platform used
in the Micra is shared with Renault—
one of the first physical realizations of
the Alliance.
Diesel engines are a key to success
in the European market. Nissan
provides an extensive range of diesel
engines in the Micra, Almera, Almera
Tino and Primera. Some engines are
shared models with Renault.
Two light commercial vehicles, the
Interstar and Primastar, joined the
Nissan lineup during fiscal year 2002.
The Primastar is produced by Nissan in
its Barcelona, Spain factory, and both
models are part of the Renault/Nissan
MICRA
INFINITI G35 COUPE
QUEST
INFINITI FX45

Nissan Annual Report 2002 17
cross-badging strategy. The Interstar
and Primastar provide operation
efficiency, with sleek, professional
designs that also help to protect
them through the tough life of a
commercial vehicle.
Mexico
The Platina and 350Z were the new
models released in 2002. The Platina is
also an example of the Alliance with
Renault, based on the Renault Clio, and
was very well received in the Mexican
subcompact segment.
New Models Continue for 2003
In fiscal 2003, Nissan will launch
10 all-new vehicles, providing 23
regional product launches. Six will be in
Japan, six in the US (most of these to
be produced at the new Canton,
Mississippi plant), three in Europe, and
eight in Nissan’s other global markets.
In Japan, this began with the release
of the Presage. The Presage is a
versatile, high-quality minivan, providing
roomy practicality and versatile seating
arrangements with a more comfortable
package. An agreement with Mitsubishi
Motors will enhance Nissan’s position
in the mini-vehicle market, which it
entered during 2002 with the Moco, by
providing 20,000 mini commercial
vehicles for the Japanese market.
In the US, the Canton plant will be
the production base for the Quest, a
revolutionary new minivan; the full-size
Pathfinder Armada SUV; the Titan full-
size truck; and the full-size Infiniti SUV.
In Europe, Nissan’s new product
offering will see the introduction of the
350Z. The Kubistar, a cross-badged
model derived from the Renault
Kangoo, will also join Nissan’s light
commercial vehicle lineup during fiscal
year 2003.
Z ROADSTER
PRESAGE
PLATINA
TITAN CREW CAB

Nissan Annual Report 200218
Design
Building the Brand withWorld-Leading Design
Design is the interface between
customers and the brand. Nissan
believes that it has the speed and
power to communicate across borders
through form and shape.
Nissan designers realize that a car
is much more than metal, rubber and
fabrics. It’s more than mere
transportation. The automobile
represents freedom, self-expression—
even desire. Understanding this
fundamental concept allows designers
Quest Concept, unveiled at the 2002 North AmericanInternational Auto Show, Detroit
Design is key to today’s expansion of the Nissan
brand. It defines the first and lasting impression
customers have about the Nissan product and plays
an important role in expressing the Nissan brand
identity. The aim is to create design that
reverberates in the heart, appeals to the mind’s
eye and delivers concept and message.
Design Acknowledged in Awards
Nissan garnered an amazing number ofdesign awards during 2002:
Fairlady Z/350Z:• The Japan Industrial Design Promotion
Organization’s Good Design Award, ProductDesign Division
• Golden Clay Trophy at the Japan Car DesignAward 2002–2003
• Car of the Year Award Special Jury Prize “Funto Drive” Award
• Canada Car of the Year• Canada Best Design of the Year
G35 Sport Sedan/Coupe: • Motor Trend Car of the Year
March: • The Japan Industrial Design Promotion
Organization’s Good Design Award, ProductDesign Division
• Japan Fashion Color Association Auto ColorAwards 2003 Grand Prize, Color Division
Cube: • Japan Fashion Color Association Auto Color
Awards 2003, Interior Coordination DesignAward
Stagea: • The Japan Industrial Design Promotion
Organization’s Good Design Award, Product Design Division
Elgrand:• The Japan Industrial Design Promotion
Organization’s Good Design Award, Product Design Division
Murano:• Canada Truck of the Year
Nissan Gallery (Ginza and Head Office): • Japan Society of Commercial Space
Designers Design Award 2002

Nissan Annual Report 2002 19
to blend passion and practicality,
creating cars that meet customers’
unanswered needs. In doing so, they
work closely with product planners and
engineers to foster innovative concepts
and designs with impact. They can dare
to be bold in their designs, but it is a
boldness tempered by thoughtfulness.
The commitment is straightforward:
Nissan design will be a creative force
that stirs curiosity, nurtures innovation
and challenges the conventional to
create attractive, distinctive products.
Design Central:
the New Nissan Design Europe
A significant step in reinforcing Nissan’s
European design strength came with
the opening of its new design center in
London. Nissan Design Europe, housed
in the striking Rotunda building, a
former railway depot in Paddington,
unifies all of Nissan’s European design
resources into one location. Nissan is
steadily building its strength in the
European market, targeting sales of
more than 500,000 units in 2003.
Significantly, an increasing number of
these automobiles are not only
produced, but are designed in Europe.
Nissan Design Europe employs
some 50 international designers,
modelers and support staff. Their task
will be to develop future designs for
Europe, as well as for other markets in
conjunction with Nissan’s five other
design studios—three in Japan, two in
the US.
The new Nissan Design Europe, London
Infiniti Triant concept car, 2003 North AmericanInternational Auto Show, Detroit

Nissan Annual Report 200220
Technology
Investment for the Future
The Nissan Revival Plan was often
misinterpreted as only as a cost-cutting
and restructuring plan; in fact, it was
very much about redeploying assets for
future growth.
Nowhere is that clearer than in the
investment in R&D. From an R&D
investment of ¥231.7 billion in fiscal
year 2000, Nissan has continued to
increase its expenditures to ¥300 billion
in fiscal year 2002. These exceeded
Nissan’s growth in revenue over the
same period, as these figures as a
percentage of total revenue grew from
3.8 percent to 4.4 percent. Capital
expenditures grew even more
dramatically, from ¥205 billion to
¥378 billion.
Part of this investment was in
facilities: Nissan opened the new
Nissan Design Europe center in London,
the sixth Nissan design studio
worldwide, while $40 million has been
applied to an expansion of the Nissan
Technical Center North America, located
near Detroit. In Japan, Nissan acquired
the Atsugi campus of Aoyama Gakuin
University, where it is constructing and
will soon open the Nissan Advanced
Technology Center.
The investments are not entirely in
infrastructure, however; Nissan has
been steadily increasing its team of
engineering experts, the people whose
skills and passion have fueled the
company’s growth.
231.7 262.1 300.3
Research & Development(Billions of yen)
’00 ’01 ’02
Per
cent
of n
et re
venu
e
3
4
5
205.6 293.8 377.9
Capital Expenditure(Billions of yen)
’00 ’01 ’02
Per
cent
of n
et re
venu
e
3
5
4
6
Nissan Technical Center Europe
Nissan Technical Center North America
Nissan Technical Center Japan
Nissan’s increased investment in technology
Throughout the exciting changes and challenges
that have come as Nissan has streamlined,
refocused and rededicated itself to creating
long-term, profitable growth, the company has
never lost sight of the need to invest in the new
technologies that underlie future success.

Nissan Annual Report 2002 21
brought close to the car; doors and
tailgate can simply be opened by
pressing a button on the door handle,
and a turn of the ignition starts the
motor—no key has to be removed from
bag or pocket. Another “smart key” is
the secret behind the Engine
Immobilizer system. A chip inside the
key sends a signal to the engine;
without it, the engine can’t be started.
The Immobilizer will be standard on all
large-size, sport and SUV vehicles by
the end of fiscal year 2004.
And a simple addition to driving—
especially in countries such as Japan
where there are many tunnels—is
Nissan Autolight, which automatically
turns the headlamps on and off as the
surroundings become dark.
Enhancing Driving Pleasure
Enriching people’s lives: nowhere is
Nissan’s new motto felt more directly
than in creating a more enjoyable
driving and riding experience in
Nissan automobiles.
It starts from the base up, in the
platforms on which award-winning
Nissan cars are built. The FF-L (front-
engine, front-drive, large) package
provides for an attractive design with
spacious cabin and body size, enabling
excellent handling while minimizing the
space needed for engine and
transmission. The FR-L (front-engine,
rear-drive, large) package achieves a
User-Friendly, Pragmatic Technology
Nissan technology must be real-world,
useful, pragmatic and easy to use.
A good example, the e•4WD system,
emerged from Nissan’s hybrid car
research, and is currently applied in the
March and Cube. e•4WD is a compact,
lightweight four-wheel-drive system
that provides the traction and stability
of 4WD only when needed. Sensors
perceive the amount of slip in the front
wheels and apply electricity to an
electric motor driving the rear wheels.
This provides the fuel savings of
on-demand-only 4WD and eliminates
the propeller shaft and transfer case
normally needed to supply power to
the rear wheels.
Nissan leads the industry in the
application of technologies to the full
range of its vehicles. The Intelligent Key
also shows the company’s focus on
practical technologies. The vehicle
senses when the Intelligent Key is
MARCH
e.4WD system
Intelligent Key
Generator
Motor (On)
Reductiongear
Clutch(Engaged)
4WD control unit
Rear-wheeldrive unit
Vehicle front
Power supply
4WDdashboard switch

Nissan Annual Report 200222
dCi diesel engine
Titan’s newly designed body-on-frameplatform
TITAN CREW CAB
3.5-liter VQ engine
compact body and large cabin, for
sporty driving and a comfortable ride.
The FF-L platform is the foundation
for the incredibly successful Altima, the
2002 North American Car of the Year—
the first ever for a Japanese car. The
new Murano SUV—winner of the
Canadian Best Truck of the Year
Award—shares the same platform, as
do the strong-selling Maxima and new
Teana luxury sedan.
The new 350Z perfectly showcases
the FR-L platform, and the awards prove
it: Japan Car of the Year Most Fun Prize
winner; Best of the Year on
“MotorWeek,” PBS television, US; Best
New Sports Car, Kiplinger’s Personal
Finance magazine; Canadian Car of the
Year; and many more. The Infiniti G35,
Motor Trend’s Car of the Year, and the
all-new Skyline also boast outstanding
driving enjoyment, thanks to the
FM Package.
Nissan’s platform technology will be
highlighted again in the coming year as
the full-size Nissan Titan pickup truck,
which applies the newly designed body-
on-frame platform with fully boxed
frame side rails for superior durability,
moves into production in the US.
Nissan received confirmation of its
powertrain prowess in 2002 as the 3.5-
liter VQ engine was named as one of
“Ward’s Ten Best Engines,” published
by Ward’s Communications, Inc., for
the ninth year in a row. No other engine
has made the list every year it has
been published.
As sales of diesel-engine powered
vehicles continues to expand across
Europe, Nissan has benefited greatly
from the Alliance with Renault and its
family of dCi diesel engines. These
powerful, smooth-running engines are
being applied to the Micra, Almera,
Almera Tino and Primera in Europe.
Safety, the Environment and
Advanced Technologies
Making driving more fun is just part of
the technology story at Nissan. New
safety technologies, such as the six-unit
SRS Airbag System, are making Nissan
vehicles safer than ever for driver and
passengers alike. The company is also
focusing on the development of the
new technologies for the future, such as
fuel cells, that will reduce the impact of
the automobile on the environment.
The Nissan Virtual Engine allows
engineers to perform complete
computer simulations of combustion,
from fuel injection to flame
propagation, without having to use a
traditional optical engine test unit.
Nissan is also working on new metallic
materials research that promises to
reduce weight while increasing
strength: laser welding, injection
molding, high-speed deformation
strength analysis, and the reduction of
friction within and the size of engines
and transmissions through material
surface modification and ultra-precision
micro surface machining.

Telematics/IT and ITS
Nissan Annual Report 2002 23
Creating Comfortable, Convenient Driving
Telematics/IT
Nissan took a bold step into the new
world of Telematics with the
introduction of CARWINGS, Japan’s first
total telematics service. CARWINGS
integrates human-assisted and
automatic services, mobile phone and
personal computer technologies to
bring a variety of information to the
vehicle occupants. Through an LCD
screen and assisted by verbal interface,
the driver can access real-time traffic
conditions, news, restaurant, weather
and other information; make hands-free
telephone calls; inform others of the
automobile’s current location; and ask
help-desk operators for navigation,
search and emergency support. The
driver can also input vehicle destination
and midpoints via mobile phone or PC.
CARWINGS is currently available as
a reasonably priced unit on the March
and Cube; an advanced DVD navigation
system with CARWINGS functions is
also available on the Elgrand, Primera,
Fairlady Z, Teana, X-Trail and Presage.
The number of CARWINGS-capable
vehicles will continue to grow in
the future.
Intelligent Transport System (ITS)
ITS technologies now being realized at
Nissan promise driving that is more
efficient, environmentally friendly,
comfortable and enjoyable.
The Lane-Keep Support System
helps to reduce driver workload, helping
to keep the car in its own lane. Images
taken by a CCD camera are processed
to detect the white lane markers. The
system then assists the driver in
keeping the vehicle within the lane,
even when affected by side winds or a
slanting road surface. Driver operation
of the steering wheel or the turn signals
temporarily deactivates the system.
Adaptive Cruise Control (ACC) also
helps to make driving more comfortable
and convenient. The system uses a
radar sensor to brake ahead of the
driver’s reaction when necessary, hold
speed at a pre-set maximum and
control the distance behind the vehicle
in front.
CARWINGS
In Nissan’s CARWINGS system, Japan’s first total
Telematics service, a variety of information is now
available in the automobile—at an affordable
price. This points to the emerging Telematics/IT
and Intelligent Transport System (ITS)
technologies that make driving more efficient and
more enjoyable.
Lane-Keep Support System
The Lane-Keep Support System helps to keep the carwithin its lane, even when the car is affected by roadinclination or crosswinds. This reduces driver strain andimproves driving comfort.

Nissan Annual Report 200224
Environment
Environmental Action Plan
Nissan believes that a sound
environmental policy is at the core of a
sound business practice. To address
this conviction, in January 2002 Nissan
announced the Nissan Green Program
2005 for the Japanese market, a mid-
term environmental action plan which
outlines a series of concrete targets to
be achieved by fiscal year 2005:
In products and technology:
• To achieve 2010 fuel efficiency
standards for gasoline-powered
vehicles by 2005;
• To accelerate the introduction of
ultra-low emission vehicles (U-LEVs)
and to achieve 80-percent U-LEV
sales for all Nissan passenger cars
by the end of March 2003—
accomplished ahead of schedule;
• The development of clean energy
vehicles, with development for the
practical implementation of FCVs
completed in 2005;
• To achieve 95-percent recyclability or
greater for all new vehicles by 2005.
In corporate activities:
• Manufacturing: to eliminate direct
landfill disposal of waste by the end
of fiscal year 2001 (accomplished),
and to reduce incinerated waste
volumes to 50 percent of 1999 levels
by fiscal year 2005.
• Sales and service: to certify all Japan
Nissan dealers to the Nissan Green
Shop certification, based on ISO
14001 by the end of fiscal year 2001
(accomplished), and to develop and
deploy new technologies and
processes for the treatment of end-
of-life vehicles.
• Recycling: to enhance recycling
activities at all levels throughout
the company.
80-Percent U-LEV: Ahead of Schedule
In February, 2003, Nissan announced
that it had reached its goal of
Target
(%)100
80
60
40
20
0FY ’01 FY ’02 FY ’03
Sal
es v
olum
e ra
tio
Nissan
Company B
Company A
Nissan: leading the industry in U-LEV introduction
Nissan is committed to protecting and sustaining
the environment; part of this commitment is the
Nissan Green Program 2005 environmental action
plan. Nissan has already achieved its goal of more
than 80 percent of all its passenger vehicles being
U-LEV—ahead of schedule, ahead of the industry—
while pressing ahead on tomorrow’s technologies.
U-LEV certification mark
Leading the industry: from a Nissan U-LEV television commercial in Japan

Nissan Annual Report 2002 25
80 percent of all its domestic vehicles
certified as U-LEV—two months earlier
than planned, and far ahead of all other
Japanese manufacturers. At the end of
January, 2003, 80.7 percent were U-LEV
vehicles. A U-LEV has exhaust emissions
that are 75 percent or more below
Japan’s 2000 exhaust emission
regulations. Nissan estimates that
reaching this level has the same effect
in hydrocarbon and nitrogen oxide
reductions as selling 400,000 zero-
emission vehicles, such as fuel cell
vehicles (FCVs). A “real world”
application of Nissan technology that is
affordable, widely available and that has
a real impact in improving air quality.
Fuel Cells: Tomorrow’s Technology
U-LEV vehicles are today’s “real”
technology providing measurable
improvements for the environment. For
the future, Nissan continues to take an
active role in the development of fuel
cell technology. Fuel cells offer
outstanding efficiency and zero
emissions and are a promising
mainstream power source for the
future—although issues such as
creating the necessary fuel supply
infrastructure will take some time. As
a participant in the Japan Hydrogen &
Fuel Cell Demonstration Project (JHFC
Project) being conducted by the Ministry
of Economy, Trade and Industry, Nissan
is working to resolve these issues,
preparing for the growing popularity of
fuel cell vehicles (FCVs) in the future.
Nissan began initial FCV research
activities in 1996; today, with approval
by Japan’s Minister of Land,
Infrastructure and Transport, it has
begun public road tests of its X-Trail
FCV. This testing is in preparation for
limited marketing in 2003—two years
ahead of the original schedule. The X-
Trail FCV is a high-efficiency, hybrid fuel
cell vehicle with a compact, high-
performance lithium-ion battery pack
that has been commercialized on
Nissan's electric vehicle and other
alternative fuel vehicles. The power
plant is a fuel cell developed by UTC
Fuel Cells (UTCFC); Nissan has also
joined with UTCFC for an agreement to
jointly develop proton exchange
membrane (PEM) fuel cell technology.
Nissan is also part of the California
Fuel Cell Partnership and has
conducted public road tests of the
Xterra FCV since April of 2001.
Hybrid Tie-Up with Toyota
In September 2002, Nissan announced
a tie-up with hybrid technology leader
Toyota for a long-term hybrid
partnership, including technical
cooperation. Aiming at a business
relationship of at least 10 years, the
agreement adds to Nissan’s hybrid
technologies, such as its high-
performance lithium-ion battery pack,
with Toyota’s state-of-the-art hybrid
components, while both companies will
exchange information and work toward
the joint development of hybrid
system components.
X-TRAIL Fuel Cell Vehicle
Nissan Executive Vice President Nobuo Okubowith Toyota Vice President Akihiko Saito

Nissan Annual Report 200226
Safety
The Quest for Real World Safety
Nissan’s policy toward safety is a quest
for Real World Safety. Nissan has long
worked to create safer vehicles; the
company has been analyzing actual
accident data involving Nissan vehicles
in Japan. This data is the base for
Nissan’s development of safety
technologies, with the goal to cut the
number of fatal and severe injuries in
Nissan vehicles to half the level of 1995.
Ongoing Nissan research has
resulted in the adoption of the Active
Head Restraint System, effective in SRS Curtain Airbag System
Fatalities and injuries involving automobiles, 2000
Active Head RestraintSystem
The Active Head RestraintSystem is effective inrestraining head and neckmotion in rear-end collisions
Nissan takes a real-world approach to safety,
using actual crash data as its first step in new
development. The quest is to develop safer
vehicles through the analysis of this accident data,
with the goal of reducing by half the number of
fatal and severe injuries.
Injuries caused by rear impactCasualties by impact area
Front
Back
Left side Right side
17.7% (77,059)
(41,589)(30,064)
(26,667) (30,142)
(13,644)(12,266)
(203,374)
9.5%6.9%
6.1% 6.9%
3.1%2.8%
46.6%
Trunk3.1%
Head, face2.6%
Other
Neck and head 91.8%
Figures in parenthesis = number of personsSource: Institute for Traffic Accident Research and Data Analysis
(210,502)
rear-end collisions, and the SRS Curtain
Airbag System, designed to protect
vehicle occupants in side collisions.
About 50 percent of all accidents
involve rear-end collisions; neck injuries
account for more than 90 percent of all
injuries incurred in rear-end collisions.
In a rear-end collision, Nissan’s active
head restraint system moves the
headrest forward, reducing rearward
rotation and motion of the head and
neck. The result is an approximate 45
percent reduction of neck motion, and
an estimated 60 percent reduction of
rotation of the head to the rear—and
greatly reduced neck loading. The
Active Head Restraint System will be
standard equipment on all Nissan
passenger cars and RVs by fiscal
year 2004.
Pedal stroke sensor
Laser radar sensor
Motorized pre-tension belt
Control unit
Nissan Annual Report 2002 27
In side collisions, some 75 percent
of all injuries are to the head, face and
neck. In a side collision, the SRS
Curtain Airbag System immediately
expands from the roof side, protecting
passengers in both the front and rear
seats. It protects the head and face
from impact with the side glass and
pillars, reducing excessive neck motion
and cervical injuries. The system will be
standard on most Nissan passenger
cars and RVs by fiscal year 2005.
Creating Unique Technologies
Nissan has completed development of
a Brake-Operated Pre-crash Seatbelt
designed to help mitigate occupant
injury in the event of a collision. The
system will be introduced in 2003, and
is effective in about 25 percent of all
serious and fatal accidents. This
technology is patented by Nissan and is
available to competitors through a
licensing process.
The brake-operated pre-crash
seatbelt system is one result of Nissan
Advanced Safety Vehicle (ASV) research
activities. Other advanced ASV
technologies include the world ’s first
Lane-Keeping Support system featured
on the Cima, and the Adaptive Cruise
Control (ACC) system currently
available on medium-size and larger
Nissan models.
In its new Far-Infrared Imaging
Sensor, Nissan succeeded in creating a
system that can detect pedestrians at
night at distances up to 50 meters. The
headlamp illumination pattern is
controlled to illuminate the pedestrian
and alert the driver. Another application
of infrared sensor technology is Intruder
Warning. An infrared sensor embedded
in an A-pillar detects the entrance of an
intruder into the vehicle and issues
a warning.
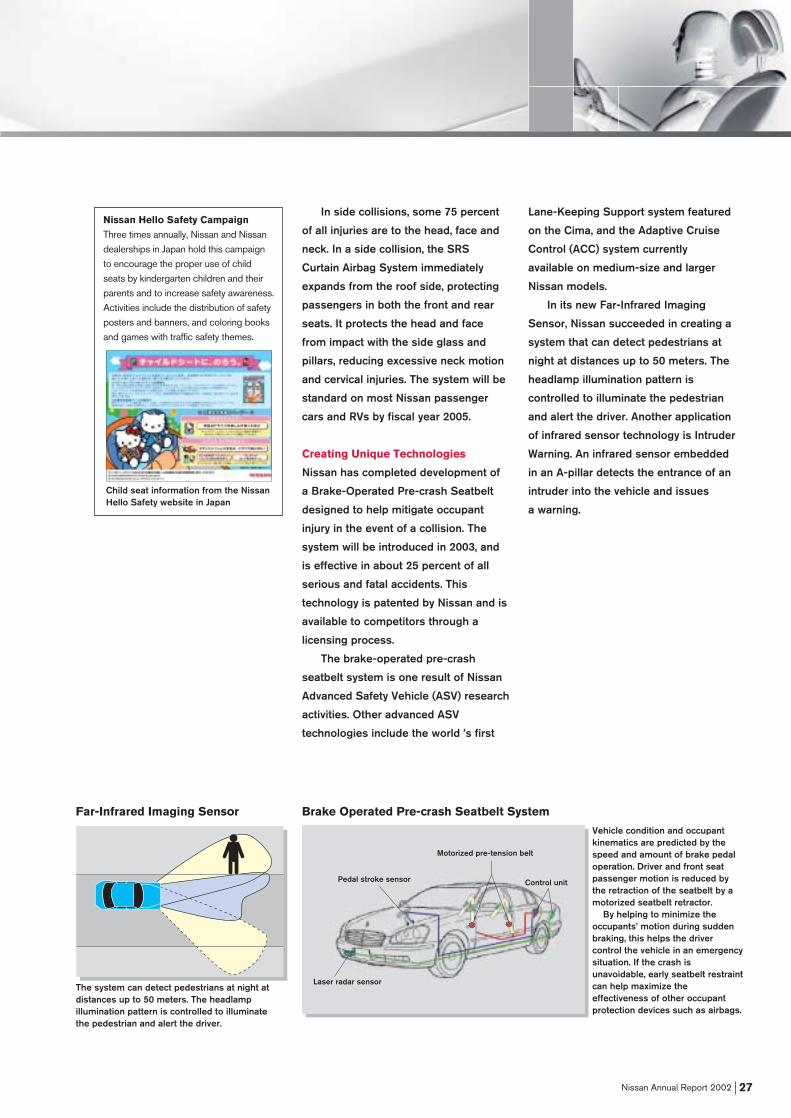
Nissan Hello Safety Campaign
Three times annually, Nissan and Nissandealerships in Japan hold this campaignto encourage the proper use of childseats by kindergarten children and theirparents and to increase safety awareness.Activities include the distribution of safetyposters and banners, and coloring booksand games with traffic safety themes.
Brake Operated Pre-crash Seatbelt SystemFar-Infrared Imaging Sensor
The system can detect pedestrians at night atdistances up to 50 meters. The headlampillumination pattern is controlled to illuminatethe pedestrian and alert the driver.
Vehicle condition and occupantkinematics are predicted by thespeed and amount of brake pedaloperation. Driver and front seatpassenger motion is reduced bythe retraction of the seatbelt by amotorized seatbelt retractor.
By helping to minimize theoccupants’ motion during suddenbraking, this helps the drivercontrol the vehicle in an emergencysituation. If the crash isunavoidable, early seatbelt restraintcan help maximize theeffectiveness of other occupantprotection devices such as airbags.
Child seat information from the NissanHello Safety website in Japan

Nissan Annual Report 200228
Manufacturing
Nissan sets the standards in the
automobile industry for productivity. Its
Sunderland plant, UK, has been ranked
number one in Europe for seven
consecutive years, according to the
World Markets Research Centre.
Nissan’s Smyrna, Tennessee plant, US
has ranked number one for nine
straight years in the Harbour Report
North America, while its Japanese
plants also lead the domestic market.
The company is not about to rest on
its productivity laurels, however; it is
just the first of six manufacturing areas
that Nissan has focused on during its
revival. Plant utilization, manufacturing
flexibility, common platforms, cross-
manufacturing and localization are all
key factors in better building at Nissan.
Plant utilization is key. Nissan’s
production facilities in Japan are today
operating at much higher levels of
capacity utilization than in 1999. Flexible
manufacturing systems that make it
possible to build different models on
the same line have reduced lead times
and cut the costs involved in shifting
production to a new line. Common
platforms—both within Nissan and with
Alliance partner Renault—have reduced
the total number of platforms, as well
as development costs and time to
market. Cross-manufacturing has
allowed Nissan to enter Brazil and
Argentina by opening a new joint factory
at Renault’s production facilities in
Brazil; similarly, Renault was able to
enter Mexico through Nissan’s
production facilities, while Nissan
optimized capacity utilization in
the country.
Building on Top Productivity
Nissan’s Smyrna plant, Tennessee
Local manufacturing: Micra production at the Sunderland plant UK
Nissan leads in the industry in productivity—but
continues to strive for higher levels of efficiency
and quality in many different areas. Backing this is
massive investment in production facilities in the
markets where the vehicles are to be used,
helping Nissan to react more quickly to ever-
changing market trends.

Nissan Annual Report 2002 29
Building Locally
Nissan’s massive investment in
manufacturing as close to the markets
where vehicles are to be used is the
clearest realization of localization. This
reduces currency exchange risks while
increasing the speed of response to
market needs. Nissan’s new production
facility in Canton, Mississippi, US,
opened in May of 2003, while the first
Paladin SUV rolled out of Zhengzhou
Nissan, China, in March.
The 3.5-million-square-foot,
US$1.43-billion Canton plant began
with the production of the popular
Quest, to be followed by production of
the new Titan truck and the Pathfinder
Armada SUV. Nissan’s Smyrna,
Tennessee plant and its Decherd,
Tennessee engine plant have also been
greatly expanded to increase Nissan’s
production capabilities within the
US market.
In June 2003, Nissan and DongFeng
Motor Corporation announced the
foundation of Dongfeng Motor Co., Ltd.,
a comprehensive strategic partnership
between the two companies for the
China market. Dongfeng Motor Co.,, Ltd.
will be the first joint Sino-foreign full-
line vehicle manufacturer; the new
Sunny is the first model produced by
the company, rolling out as a Nissan
brand in June of 2003.
Thanks to growing demand in
Europe, production capacity of the
Micra at the Sunderland plant, UK, was
increased by 25 percent, to 200,000
vehicles annually.
Nissan Production Way
Since 1994, Nissan has continued to
systemize its Nissan Production Way
(NPW) concept. The company is
committed to realizing Douki-Seisan—
a build-to-order system schedule
synchronized with the customer—which
is the ultimate NPW goal.Micra, manufactured in the UK
Production begins at the Canton plant,Mississippi
US-produced Pathfinder Armada
Launch ceremony for Sunny in China, June 16, 2003
Sunny, produced in China

Nissan Annual Report 200230
The first purpose of NPW is to
enhance customer satisfaction—
to increase competitiveness in quality,
delivery and cost while providing
the maximum possible service. It helps
to demonstrate that Nissan provides
its customers with excellent cost
performance, high quality, excellent
product sense and a short
delivery period.
NPW also aims to raise the asset
turnover ratio by reducing inventory
assets while improving cash flow.
Inventory reduction also is a means for
discovering problems within the
manufacturing process.
The third focus is on improving the
manufacturing system by resolving
those problems which are discovered.
This is an ongoing process of discovery
and the application of solutions which
will bring NPW to a higher stage while
continuing to move to closer
synchronization of production to the
customer’s demands.
Smoothing Supply and
Enhancing Quality
At the end of 2001, Nissan took another
step to shorten lead times from order
taking to delivery, lower inventory levels
and reduce costs throughout the supply
chain. The establishment of the Supply
Chain Management (SCM) Division
brings together the supply chain
management operations that formerly
were controlled by several divisions into
one unified division. This will provide for
more efficient control of information
flow from clients, and of parts and
vehicle logistics. With 12 new vehicles
launched during fiscal year 2002—the
highest number ever in Nissan history—
realizing the higher level of efficiency
provided by SCM really was a necessity.
More Modularization
One way the company is already
boosting speed, efficiency and quality is
through the increased application of
modular manufacturing. Modularization
is being incorporated as a basic
function at Nissan’s new Canton, US,
plant, following its use in Japanese
plants, and is increasingly being applied
at the company’s other plants
worldwide. In modularization, suppliers
provide not simple components but
complete modular units, such as front
end or cockpit modules, built separately
and brought together precisely when
needed for assembly. This improves
production efficiency and quality while
increasing the use of common parts
and integration of components—which
in turn reduces costs and speeds new
product development.
Quest production, Canton plant, Mississippi

Purchasing
Nissan Annual Report 2002 31
Purchasing is the greatest cost source
for any automobile maker—but Nissan
executives immediately saw that
reducing purchasing costs was one of
the keys to the company’s revival and
growth to long-term, profitable growth.
By March 2002, a 20 percent cost
reduction had already been met—one
year ahead of schedule.
Today, as part of NISSAN 180, a
commitment for a further 15 percent
cost reduction has been made. Fiscal
year 2002, the first year of NISSAN 180,
has already seen purchasing cost
reductions proceeding on schedule.
Nissan 3-3-3 is a major part of the
cost reduction, aiming at fully 50
percent of the total reduction. Key to
this is the first “3”: suppliers,
purchasing and engineering, working
together in close teamwork. “The great
majority of our suppliers have
embraced the NRP and accepted
changing the way they work with us,
while challenging their own
performance,” said Carlos Ghosn. “They
gave us the performance we crucially
needed. Now suppliers expect more
growth for us and more volume for
them—and we will provide them with
both. We will have at least 28 new
products during NISSAN 180, and these
are opportunities for the suppliers to
expand their business. It truly is a win-
win situation.” Nissan 3-3-3 has not only
reduced costs, but it has also resulted
in increased efficiency and performance,
without a reduction in quality.
Major Alliance Contributions
The Renault-Nissan Purchasing
Organization (RNPO), the joint
purchasing company established as
part of the Alliance between the two
companies, has also greatly aided in the
process of building the highest
purchasing competitiveness in quality,
cost and delivery while managing
supplier relations globally. The RNPO
principle of “one voice to suppliers”
exceeded cost reduction commitments
in fiscal year 2002 and succeeded in
expanding the scope of commodities
covered, particularly in powertrains.
Already accounting for annual
purchasing volumes of US$21 billion—
accounting for 43 percent of both
companies’ global purchasing—it is
anticipated that this figure will
eventually grow to 70 percent or higher.
Reduced Purchasing CostsPurchasing cost reduction (percent)
100
90
80
70
60Target
-11
-20
FY ’00 ’00 ’01 ’02 ’03 ’04
Purchasing Cost Reduction 15%
-15%
-20%
A Win-Win Relationship
Reducing purchasing costs—the largest single
cost source—has been a key part of Nissan’s
growth. Costs have been cut ahead of schedules,
thanks to the Nissan 3-3-3 program, Alliance
purchasing synergies, and a new win-win
relationship between suppliers and Nissan.
Nissan 3-3-3 activity meeting

Sales and Marketing
Nissan Annual Report 200232
Moving into Extended Growth
The start of NISSAN 180 was reflected
in fiscal year 2002 with growth in sales
and in the opening stages of the major
introduction of new models that will truly
herald the arrival of a new, strong,
profitable Nissan.
One symbol seen by nearly every
customer is the dealership, and Nissan
is investing to ensure that it possesses
an effective—and attractive—distribution
network for its exciting new cars. Many
Japanese outlets are now being
modernized, new outlets are opening
where there is business demand, and
others are being consolidated where
there is overlap. The modernization
involves not just minor cosmetic
changes but a transformation of interior
layouts. This will reinforce the sense of
quality customers feel when they enter
the showroom. Some 300 sales outlets
received this brand enhancement;
almost all Japanese sales outlets are
scheduled to be completed by fiscal
year 2005.
Nissan Sales and Service Way
The Nissan Sales and Service Way
(NSSW) is a global initiative that will
help to differentiate the Nissan
purchase experience from that of its
competitors—much like Nissan products
differentiate the company from others
in the market. The customer experience
at a Nissan dealership anywhere in the
world is one of the most important
factors in their decision to purchase a
Nissan car—or not.
NSSW will first focus on building
core strengths, so that all dealership
staff support basic levels of service at
any dealership globally. The second
phase focuses on differentiation. As the
Nissan brand evolves with bold new
products, new customers with higher
expectations will be visiting dealerships
for the first time. Just as Nissan’s new
automobiles more clearly define and
differentiate Nissan from its
competitors, the entire customer
experience—visually, emotionally and
substantively—must also define and
differentiate Nissan.
Much improved—but Nissan is
working to further build its brand around
the globe.
2,530 2,633 2,597 2,771
Global Sales VolumeFiscal years 1999–2002(Thousands of units)
’99 ’00 ’01 ’02
3,600
NISSAN 180
Target
Contribution of Key Regions to Net Sales Fiscal year 2002
Japan29%
US26%
Europe17%
Other Markets27%
Building on the foundations established for
increasing market share and profitability, 2002
results show strong growth for Nissan around the
world. Meanwhile, the Nissan Sales and Service
Way seeks to ensure a positive customer
experience at a critical meeting place with
Nissan—dealerships.
Dealership in the USJapan dealership

Nissan Annual Report 2002 33
861 760 733 714
Unit Sales(Thousands of units, including minicar sales)
’98 ’99 ’00 ’01
816
’02
Mar
ket s
hare
(%)*
15
20
25
* Market share does not include minicar sales
Nissan had an excellent year in its
home market in fiscal year 2002.
Despite the tough economic conditions
in Japan, Nissan both increased sales
by 14.3 percent to 816,000 units, and
increased its market share (excluding
minicars) to 19 percent. This was a 1.1
percent growth in market share over the
previous year, the first time Nissan has
increased annual market share by more
than one percent in 31 years.
While the growth was led in the
critically important mini and entry-level
segment—represented by the March—
Nissan also scored highly in Japan with
the highly anticipated launch of the
Fairlady Z. The new Teana luxury sedan
and Skyline Coupe also contributed
strongly to increased sales toward the
end of the year. All of the six new
models introduced during the year
—the Moco, Elgrand, Fairlady Z, Cube,
Skyline Coupe and Teana—met or
exceeded sales targets.
With 158,000 units of the March sold
in 2002, this is an all-time sales record
for the model, and the highest annual
sales for any one model since fiscal
year 1991. The March has remained in
Japan’s top-10 best-selling cars
throughout the year; it was joined on
the list for more than eight months by
the Cube.
Japan
TEANA FAIRLADY Z
MARCH
CUBE

Nissan Annual Report 200234
While the US market declined by 1.9
percent during 2002, Nissan sales rose
by one percent to 726,000 units. The
Infiniti Division had its highest sales
year ever since the founding of the
division in 1989, making it the fastest-
growing luxury brand in the United
States. The growth to 96,000 units was
driven by the G35 Sedan and Coupe,
named Motor Trend’s Car of the Year,
as well as the FX45 and M45. Infiniti
also boasts the lowest incentives in the
luxury segment of the industry.
Nissan Division sales were down
2.7 percent, to 631,000 units. Both the
Altima and 350Z continued to sell
strongly; Altima sales were up 30
percent over the previous year, to
204,000 units, while the 350 Z is the
best-selling sports car in the US.
Nissan’s strategy continues to be
profitability rather than volume, so the
record levels of incentives in the entry-
level sedan and truck segments—and
Nissan’s resistance to them—resulted in
lower than expected results for the
Sentra, Frontier and Xterra. The Murano
and Maxima, launched in the last quarter
of fiscal year 2002, are beginning to
make a significant contribution to sales.
US
744
Unit Sales(Thousands of units, retail sales basis)
’00 ’02
719 726
’01
Mar
ket s
hare
(%)
628 713
2.0
3.0
4.0
5.0’98 ’99
INFINITI FX45
MAXIMA INFINITI G35 SEDAN
MURANO
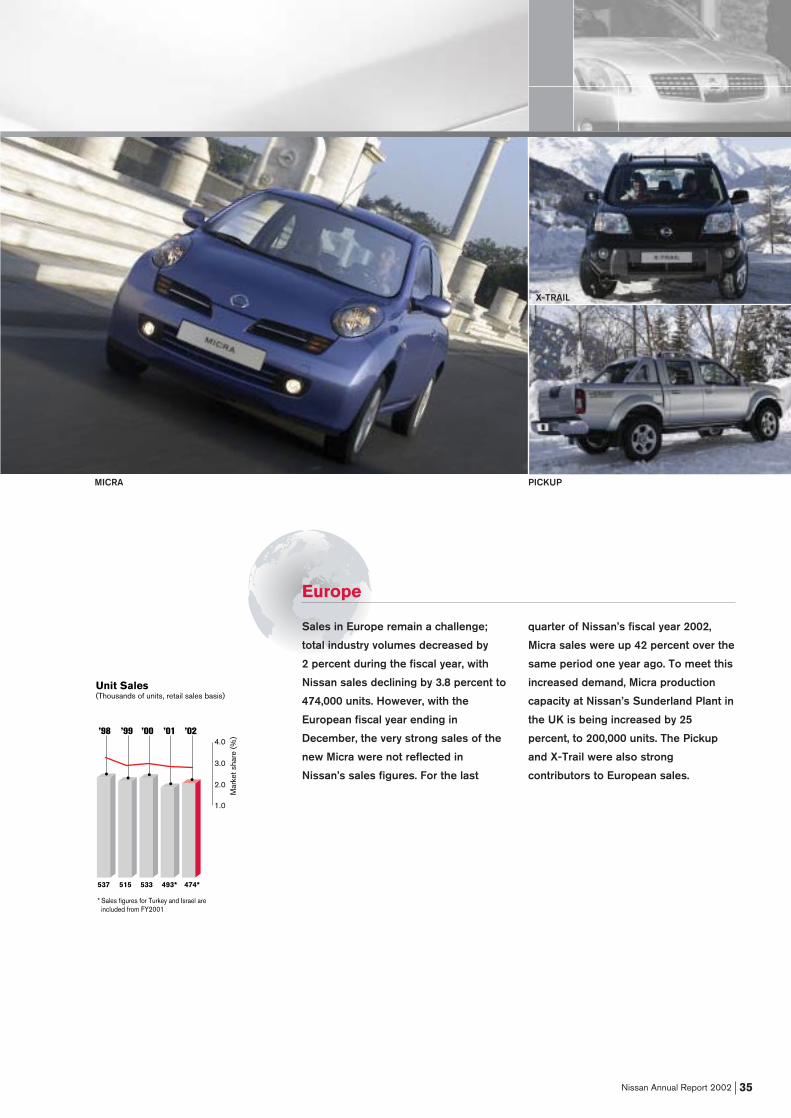
Nissan Annual Report 2002 35
Sales in Europe remain a challenge;
total industry volumes decreased by
2 percent during the fiscal year, with
Nissan sales declining by 3.8 percent to
474,000 units. However, with the
European fiscal year ending in
December, the very strong sales of the
new Micra were not reflected in
Nissan’s sales figures. For the last
quarter of Nissan’s fiscal year 2002,
Micra sales were up 42 percent over the
same period one year ago. To meet this
increased demand, Micra production
capacity at Nissan’s Sunderland Plant in
the UK is being increased by 25
percent, to 200,000 units. The Pickup
and X-Trail were also strong
contributors to European sales.
Europe
Unit Sales(Thousands of units, retail sales basis)
’00 ’01
Mar
ket s
hare
(%)
537 515 533 493* 474*
1.0
2.0
3.0
4.0
* Sales figures for Turkey and Israel are included from FY2001
’98 ’99 ’02
MICRA PICKUP
X-TRAIL

Nissan Annual Report 200236
Asia/OceaniaThe rapidly expanding Chinese market
once again was the setting for more
than double the sales of the previous
year. Sales in Taiwan also increased by
15.3 percent to 61,900 units, giving
Nissan third place in the market.
Thailand also showed major growth of
28 percent to 44,400 units, buoyed by
increased sales of the Frontier Pickup.
Significant growth also came from the
Australian market, where Nissan sales
rose by 12.8 percent. This was driven
by strong sales of the X-Trail and
4WD Pickup.
GCC CountriesNissan sales throughout the region
were the highest on record since 1982.
The Pathfinder and Sunny were
particularly popular models throughout
the region. However, sales in Saudi
Arabia decreased by 13 percent, due
to a sluggish automobile market
resulting from tensions surrounding
the Iraq conflict.
South AfricaStrong sales of the Almera and the
introduction of the Pickup helped to
build a 10.6 percent increase in sales to
29,900 units in South Africa.
MexicoNissan recorded excellent results in
Mexico, with sales increasing by 11.3
percent to 211,600 units. Both the
Tsuru and Sentra remain popular
models in the country.
Latin America and the CaribbeanDespite ongoing economic and social
unrest in Argentina and Venezuela, and
a depressed market trend in Brazil,
Nissan sales in Latin America and the
Caribbean were the best since 1998.
Sales growth was 22.5 percent over
fiscal year 2001, boosting Nissan’s
market share to 2.2 percent, a rise of
0.6 percent. This was largely due to the
successful launch of the Frontier
Pickup, produced in Brazil—winner of
three awards including Pickup of the
Year—as well as buoyant sales in
Central America, the Dominican
Republic and Puerto Rico.
SUNNY
X-TRAIL
FRONTIER
SENTRA
672 755
Unit Sales(Thousands of units, retail sales basis)
’01 ’02
(including Canada)

Sales Financing
Nissan Annual Report 2002 37
Providing Comprehensive Sales Financing Services
Nissan sales financing companies in
Japan, the US and Canada made a
significant contribution to financial
results during fiscal year 2002. Revenues
increased by 7.9 percent to ¥396 billion,
while assets grew by 8.4 percent to
¥3,104 billion. In Japan, sales finance
activities were more fully integrated into
the sales strategy of the domestic sales
division, creating a deeper collaboration
with dealers, manufacturer and finance
company. Sales financing in the US also
showed steady growth. The growth of
Nissan’s financing business is supported
by strict risk management and a
conservative credit policy to help it
maintain asset quality at a high level.
Operating profit was ¥60 billion,
equal to a 15.2 percent operating margin
in fiscal year 2002, with a global ROA
before tax exceeding 1.5 percent.
Increased Japanese Penetration
Nissan Financial Service (NFS) supports
domestic car sales through
comprehensive financial products and
services, including auto loans, car
leasing, credit cards, car rental and car
insurance. During fiscal year 2002, NFS
increased credit penetration on new car
sales to 22.4 percent, from 18.7 percent
the previous year. This increase was
achieved by a series of attractive
financial programs jointly introduced with
the domestic car sales division, and
through improved services to dealers
and customers. NFS drastically reduced
credit decision times through advanced
web technology and auto scoring
systems. NFS’s Customer Service Center
plays an active role in communicating
with and serving customers in an
interactive way.
NFS also enhanced its corporate
customer activities through car leasing
and competitive fleet management
systems. In April of 2003, NFS and
Nissan’s domestic sales division
established a new joint organization for
corporate fleet business activities.
Expanding US Operations
Nissan Motor Acceptance Corporation
(NMAC) strengthened its US market
presence in fiscal year 2002, with the
new car penetration rate growing from
52 percent in the previous year to 54
percent. NMAC’s Infiniti Division
received the top luxury brand ranking in
JD Power’s consumer survey 2002 for
initial loan satisfaction. NMAC’s new
customer service center facility in Irving,
Texas, which will allow for more
efficient customer and dealer service,
was completed in April 2003. This
268,000-square-foot center is designed
to accommodate the growth of NMAC
expected with future vehicle
sales expansion.
Dealer inventory financing is another
area for NMAC, Nissan/Infiniti dealers
using this service grew from 25 percent
at the end of fiscal year 2001 to 35
percent in 2002.
NMAC also reinforced its
cooperation with its sister company in
Canada, Nissan Canada Finance Inc
(NCFI) by sharing its know-how and
back office functions. As a result, NCFI’s
assets grew by 46 percent, with
penetration on new car sales reaching
49 percent at a time when Nissan sales
in Canada grew rapidly.
New NMAC Customer Service Center,Texas
NFS Customer Service Center, Japan
Sales financing business forms an integral part of
Nissan’s core business and supports automotive
sales strongly, while maintaining strong
profitability and healthy financial conditions
through strict risk management.

Nissan Annual Report 200238
Corporate Citizenship
Supporting Tomorrow’s Society
Global Investment
In Japan, Nissan has held the Nissan
Children’s Storybook and Picture Book
Grand Prix contest since 1984. The
contest is intended to discover and
publicize outstanding works and writers
of children’s literature. The winning
entries are published and donated by
Nissan dealers to some 3,500 libraries
throughout Japan.
Nissan directly invests in society
through its partnership with a number
of non-profit organizations (NPOs),
particularly in the areas of fostering the
creativity of children and of building
better understanding of environmental
protection. These include storybook
contests, concert support, educational
programs, and more. For example,
Nissan is the main sponsor of the Hans
Christian Andersen Awards, an
international program for the creators
of children’s books. Nissan has also
entered the sixth year of the Nissan-
NPO Learning Scholarship Program, a
program to give young people an
opportunity to expand their intellectual
capacities through a work experience at
a non-profit organization.
The Nissan Science Foundation,
established in 1974, provides research
grants for cutting-edge research in
the fields of environmental and
natural science.
International Efforts
Locally, Nissan group companies in
North America and Europe are involved
in a vast range of corporate citizenship
projects, responding to the needs of
each country.
In the US, the Nissan Mississippi
Scholarship Fund, draws from a
US$1million fund to assist state high
school students with college tuition.
Nissan is also a sponsor of the Hispanic
Scholarship Fund, aiding Hispanic
students with college tuition grants. The
Nissan Foundation, established in 1992,
supports educational programs that
celebrate and foster an appreciation
and understanding for a diverse cultural
heritage as essential for enhancing
human potential and building
community. The foundation also works
to enhance career potentials for young
people in the local area in the
automobile industry. Nissan is a
supporter of United We Stand, has
donated $1 million to the American Red
Cross in Washington, D.C. and the Twin
Towers Fund, and has further matched
As the world changes, shifting from the industrial
to the intellectual, Nissan’s goal is to be a
company that transforms with the times—one that
helps create social values. Investment in the
Future: Nissan’s goal of finding people looking to
the future and to provide them with the
opportunity to help build tomorrow’s society.
Nissan Children’s Storybookand Picture Book Grand Prix
Nissan-NPO Learning Scholarship awardceremony, June 23, 2003

Nissan Annual Report 2002 39
employee contributions to these funds.
To date, Nissan has contributed an
additional $337,000 in direct and
matching contributions from Nissan
employees. Nissan Neighbors is a
company-wide, community-focused
initiative supporting organizations that
are working to improve communities
across the nation.
In France, Nissan is making a
donation to UNICEF for every model of
the 4x4 range sold between April 1,
2003 and March 31, 2004. The funds will
be used to vaccinate children against
the six most common illnesses, largely
in Mauritania. The donation from every
vehicle will allow the vaccination of
three children; with an estimated 10,000
units anticipated to be sold in France,
this will allow for the vaccination of at
least 30,000 children. Nissan is also
donating a Patrol equipped with
refrigeration units to the local UNICEF
office, which will be used to preserve
the vaccines during the campaign.
In the UK, Nissan established the
Nissan Institute of Japanese Studies at
Oxford University in 1981. Throughout
Europe, the company and its employees
are involved in a wide array of projects,
from Christmas gift gathering in the UK
to a variety of educational and training
programs throughout the region. In May
2003, Nissan made a significant
donation including four Paladin SUVs
and a bus to China to support the battle
against SARS.
Focus on Employees
Nissan’s efforts in helping to build a
better society for tomorrow are not
entirely external; Nissan has
consistently worked to raise a spirit of
community involvement among its
employees, including financial support
for volunteer activities. These have
included fund-raising and blood
donations after the massive Hanshin
earthquake in Japan in 1995 and the
September 11 terrorist attacks in the
US, Afghan refugee relief activities,
and more.
Nissan/Hispanic Scholarship Fund
An accelerated school in the US, recipient of aNissan Foundation grant
Nissan Institute of Japanese Studies, Oxford

Nissan Annual Report 200240
Alliance
Synergies for Growth
The agreement to form the Renault-
Nissan Alliance was announced on
March 27, 1999. This alliance is the first
of its kind, involving a Japanese and
French company each with its own
distinct corporate culture and brand
identity. Both companies share a single
joint strategy of profitable growth and a
community of interests. To promote this
shared objective, the Renault-Nissan
Alliance set up joint project structures
as early as June of 1999, covering most
activities at both companies.
Today global combined sales have
reached five million vehicles per year,
representing more than nine percent of
global market share.
Thanks to the strong sales and
industrial complementarities of the two
companies, the Renault-Nissan Alliance
has been able to grow in the global
automotive market. These
complementarities generate considerable
potential for exchanges of best
practices leading to cost savings and
synergies.
At present, each company has a
direct interest in the results of its
partner. At the end of March 2003,
Renault held a 44.3 percent stake in
Nissan, while Nissan owns 15 percent
of Renault shares.
Alliance Structure
On March 28, 2002, Renault Nissan BV,
the alliance strategic management
company, was founded. Renault Nissan
BV is jointly and equally owned by
Nissan and Renault and hosts the
Alliance Board, which met for the first
time on May 29, 2002.
The Alliance Board is responsible
for medium- and long-term strategic
decisions—three-, five- and 10-year
plans—and reinforces the management
structure of Renault-Nissan products
and powertrains and sets out the
principles of the two partners’ financial
policy. The Alliance Board has the
exclusive right to propose the creation
of joint companies to Nissan and
Renault, as well as significant changes
in market or product coverage, major
investments and third-party strategic
cooperation. The Board steers the
Renault-Nissan Purchasing
Organization (RNPO) and Renault-
Nissan Information Services (RNIS).
Alliance Achievements
The first four years of cooperation
between Nissan and Renault have
already resulted in a considerable
number of achievements, such as
developing common platforms, sharing
industrial facilities, cooperating in
research and setting up joint structures
in purchasing, information systems
and sales.
The Alliance with Renault has been an integral
part of Nissan’s return to long-term, profitable
growth. The synergies resulting from this joining
of forces has created countless new activities in
purchasing, shared production, common
platforms, stronger distribution in markets
worldwide, and more.
Nissan Motor Ibérica, S.A. Primastarassembly line
Celebrating the Frontier, the first vehicleproduced at Nissan and Renault’s first jointplant in Brazil

Nissan Annual Report 2002 41
PRODUCTS: Cross-badging, common platforms, joint powertrain use
2001 September: Sales of the Renault Kangoo 4x4, fitted witha Nissan transmission system, begin.
2002 March: The Nissan March, the first vehicle built on acommon platform, goes on sale in Japan.
March: Sales of the Renault Vel Satis fitted with theNissan VQ35 V6 3.5-liter engine, begin.
March: The Nissan Interstar, an adapted version of theRenault Master, goes on sale in Europe.
April: Sales of the Nissan Platina produced at Nissan’sAguascalientes Plant, Mexico, begin.
September: Sales of the Renault Mégane II, based on thecommon C platform, begin.
October: Sales of the Primastar, the first cross-manufacturing project in Europe, begin.
December: European sales of the Nissan Almera with theRenault 1.5 diesel begin.
2003 January: The new Nissan Micra, based on the March andbuilt on the common B platform, is launched in Europe.
March: European sales of the Nissan Primera with theRenault 1.9 diesel begin.
April: Sales of the Micra with the Renault 1.5 dieselengine begin, completing the new common-rail dieselengine lineup for the European market.
SALES AND MARKETING: Entry into new markets with partner support,reorganization of dealer network
2000 October: Renault begins distribution of Nissan vehicles inMorocco.
2001 February: The first joint Single Legal Entity (SLE)companies are established in Switzerland and theNetherlands.May: The first Renault showroom in Australia opens, withsupport from Nissan.
July: Sales of Renault cars in Taiwan through local Nissandistributor begin.
November: Sales of Renault cars in Indonesia throughlocal Nissan distributor begin.
2002 September: Renault and Nissan’s new commoncommercial organization in Europe, the third SLE, isestablished in Germany.
December: The FASA Group, Nissan’s distributor inPanama, becomes a Renault importer.
2003 January: Sales of Renault vehicles through local Nissansales network in Kuwait begin.
January: Renault begins managing the importing anddistribution of Nissan vehicles in Romania.
February: Sales of Renault vehicles through local Nissansales network in Bahrain begin.
May: Sales of Renault vehicles through local Nissan salesnetwork in Qatar begin.
May: Distribution of Nissan cars by Renault Importer(ARTES) in Tunisia begins.
June: A common commercial organization, the fourth SLE,is established in Austria.
MANUFACTURING: Sharing facilities, exchanging best practices
2000 December: Production of the Renault Scénic at Nissan’sCuernavaca Plant, Mexico, begins.
2001 December: Production of the Renault Clio at Nissan’sAguascalientes Plant, Mexico, begins.
December: Renault and Nissan inaugurate a joint lightcommercial vehicle (LCV) plant in Curitiba, Brazil.
December: Production of the Renault Master Van, thefirst model produced at the Curitiba LCV plant, begins.
2002 March: Production of the Nissan Platina, derived from theRenault Clio, begins at Nissan’s Aguascalientes, Mexicoplant.
April: Production of the Nissan Frontier pickup, thesecond model produced at the Curitiba LCV plant, begins.
October: Production of the X83 compact van, the firstcross-manufacturing project in Europe (sold as theRenault Trafic, Nissan Primastar and Opel/Vauxhall Vivaro)begins at Nissan’s Barcelona, Spain, plant.
2003 March: Production of the Nissan Xterra, the third modelproduced at the Curitiba LCV plant, begins.
PURCHASING, INFORMATION SYSTEMS
2001 April: Joint purchasing company Renault NissanPurchasing Organization (RNPO) is established.
2002 July: Renault-Nissan Information Services (RNIS)established.

Motorsports
Nissan Annual Report 200242
Putting Technology to the Test
At Nissan, motorsports are the
passionate expression of the brand,
providing excitement for customers and
excellent exposure around the world.
Racing is also an outstanding
opportunity for both advancing and
showcasing the company’s
technological capabilities.
Nissan has a long history of
involvement in motorsports, including
rally, Le Mans 24 Hours, Indy Racing
League, touring-car racing and other
categories. Nissan continues to
challenge its competitors on stages
around the world, particularly in
catagories that take models close to the
actual Nissan commercial lineup—for a
stronger impact in enhancing the brand
and Nissan sales.
Nissan Rally Raid Team
Nissan technology is truly challenged
in the grueling Dakar Rally, a roughly
three-week, 8,500-kilometer-plus
race from France to Africa across
uncompromising desert terrain. The
Dakar Rally is an outstanding showcase
of 50 years of Nissan 4x4 experience,
with a worldwide audience and
particular interest in Europe.
In its first year participating as a full
works team at the Dakar Rally 2003,
Nissan made an amazing showing.
Three of the five South African-
produced Nissan Pickup trucks entered,
finished with remarkable fifth-, seventh-
and 11th-place results. The Team is
now in the second year of a four-year
challenge to win the Rally, and data
gained during this highly successful
attempt will be used in the coming
years to move even closer to the
winner’s circle.
Japan GT Championship
Japan’s most popular touring car race
series is the Japan GT Championship,
and Skyline GT-Rs are there fighting
for position in this exciting racing
format. The race brings together
highly modified version of production
line vehicles with a set of tight
technical regulations to ensure very
tough competition before crowds
averaging 50,000.
March Cup One-Make Race
Racing is largely a spectator sport, but
Nissan is making the excitement of race
driving a reality for many average
Japanese through its March Cup One-
Make Race series. Using a standard
Nissan automobile—currently a version
of the highly popular March—with
standardized adaptations for racing, the
series gives amateurs a truly
professional, yet affordable, standard
for racing. The series also features a
school where drivers not only pick up
tips on improving lap times through
analysis of their onboard data-loggers,
but instruction in track etiquette and
maintenance techniques from
professional drivers.
Nissan at the Dakar Rally
Japan GT Championship
Motorsports are an exciting showcase for the
Nissan brand—and Nissan is involved at all levels,
from international rally raid to grassroots motor
sports activities where the general public can
enjoy the excitement of automobile racing.
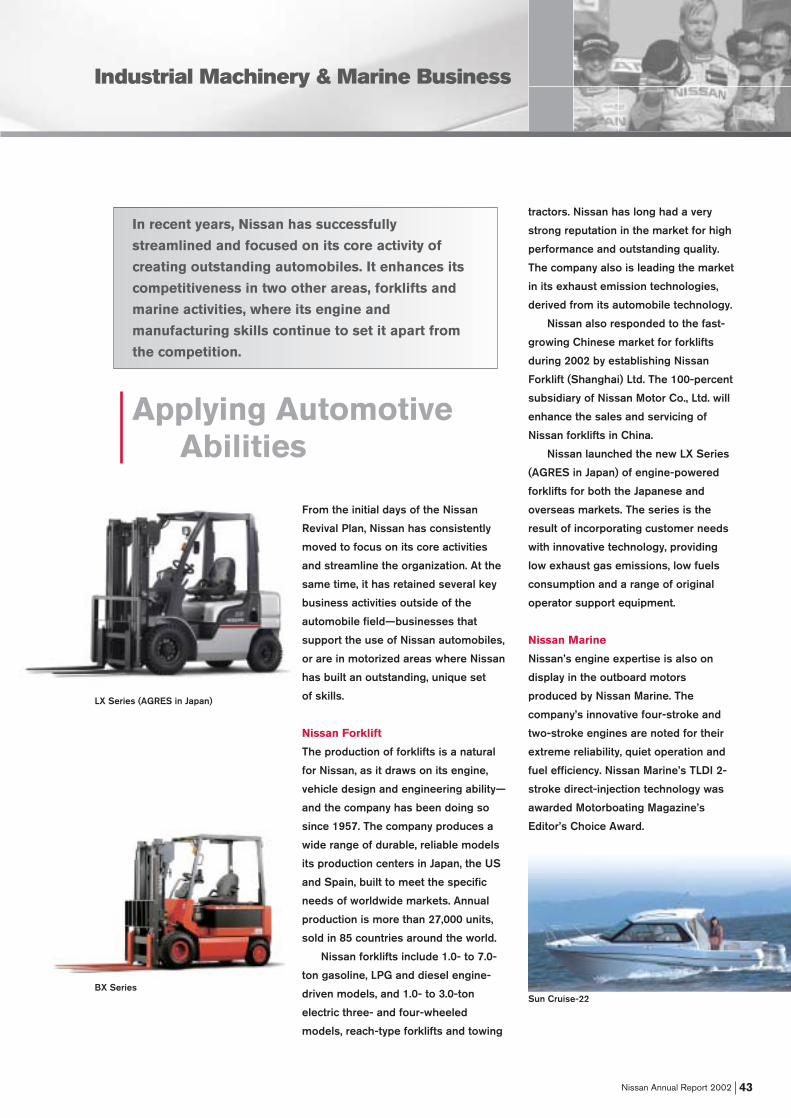
Industrial Machinery & Marine Business
Nissan Annual Report 2002 43
Applying Automotive Abilities
From the initial days of the Nissan
Revival Plan, Nissan has consistently
moved to focus on its core activities
and streamline the organization. At the
same time, it has retained several key
business activities outside of the
automobile field—businesses that
support the use of Nissan automobiles,
or are in motorized areas where Nissan
has built an outstanding, unique set
of skills.
Nissan Forklift
The production of forklifts is a natural
for Nissan, as it draws on its engine,
vehicle design and engineering ability—
and the company has been doing so
since 1957. The company produces a
wide range of durable, reliable models
its production centers in Japan, the US
and Spain, built to meet the specific
needs of worldwide markets. Annual
production is more than 27,000 units,
sold in 85 countries around the world.
Nissan forklifts include 1.0- to 7.0-
ton gasoline, LPG and diesel engine-
driven models, and 1.0- to 3.0-ton
electric three- and four-wheeled
models, reach-type forklifts and towing
tractors. Nissan has long had a very
strong reputation in the market for high
performance and outstanding quality.
The company also is leading the market
in its exhaust emission technologies,
derived from its automobile technology.
Nissan also responded to the fast-
growing Chinese market for forklifts
during 2002 by establishing Nissan
Forklift (Shanghai) Ltd. The 100-percent
subsidiary of Nissan Motor Co., Ltd. will
enhance the sales and servicing of
Nissan forklifts in China.
Nissan launched the new LX Series
(AGRES in Japan) of engine-powered
forklifts for both the Japanese and
overseas markets. The series is the
result of incorporating customer needs
with innovative technology, providing
low exhaust gas emissions, low fuels
consumption and a range of original
operator support equipment.
Nissan Marine
Nissan’s engine expertise is also on
display in the outboard motors
produced by Nissan Marine. The
company’s innovative four-stroke and
two-stroke engines are noted for their
extreme reliability, quiet operation and
fuel efficiency. Nissan Marine’s TLDI 2-
stroke direct-injection technology was
awarded Motorboating Magazine’s
Editor’s Choice Award.
LX Series (AGRES in Japan)
In recent years, Nissan has successfully
streamlined and focused on its core activity of
creating outstanding automobiles. It enhances its
competitiveness in two other areas, forklifts and
marine activities, where its engine and
manufacturing skills continue to set it apart from
the competition.
Sun Cruise-22BX Series

Nissan Annual Report 200244
Nissan Executives
BOARD OF DIRECTORS AND AUDITORS
Representative Board Members
Carlos Ghosn
President
Co-Chairman, Board of Directors
Itaru Koeda
Executive Vice President
Co-Chairman, Board of Directors
Board Members
Norio Matsumura
Nobuo Okubo
Patrick Pélata
Tadao Takahashi
Shemaya Lévy
Auditors
Keishi Imamura
Hiroshi Moriyama
Hideo Nakamura
Haruhiko Takenaka
Executive Committee Members
Carlos Ghosn
Itaru Koeda
Norio Matsumura
Nobuo Okubo
Patrick Pélata
Tadao Takahashi
Alain-Pierre Raynaud
Toshiyuki Shiga
(As of June 19, 2003)
Itaru Koeda Norio Matsumura Nobuo Okubo
Patrick Pélata
Toshiyuki Shiga
Tadao Takahashi Alain-Pierre Raynaud
Carlos Ghosn
F. Pitchal/N
issan
On June 19, 2003, Yoshikazu Hanawa retired asChairman of the Board of Directors. He wasappointed Advisor and Honorary Chairman. ThierryMoulonguet retired as Chief Financial Officer andExecutive Vice President on the same date.

Nissan Annual Report 2002 45
Corporate Officers
President
Chief Executive Officer
Carlos Ghosn
Executive Vice Presidents
Itaru Koeda
Purchasing
Administration for Affiliated Companies
Norio Matsumura
Global Sales & Marketing
North American Operations
Global Aftersales Business
Nobuo Okubo
Research
Technology and Engineering Development
Cost Engineering
Patrick Pélata
Planning and Design
European Operations
Tadao Takahashi
Manufacturing
SCM (Supply Chain Management)
Industrial Machinery
Marine
Vice Chairman
Takeshi Isayama
External and Government Affairs
Senior Vice Presidents
Eiichi Abe
Eiji Imai
Hidetoshi Imazu
Shigeo Ishida
Hiroyasu Kan
Yukio Kitahora
Jean-Jacques Le Goff
Shiro Nakamura
Alain-Pierre Raynaud
Bernard Rey
Hiroto Saikawa
Sadao Sekiyama
Toshiyuki Shiga
Kazuhiko Toida
Shiro Tomii
Kuniyuki Watanabe
Shuji Yamagata
(As of July 1, 2003)

Nissan Annual Report 200246
Nissan Motor Co., Ltd.
17-1, Ginza 6-chome
Chuo-ku, Tokyo 104-8023
Japan
Phone: +81(0)3-3543-5523
Date of Establishment
December 26, 1933
Paid-in Capital
¥605,813 million
Common Stock
Issued and outstanding:
4,520,715,112 shares
Number of Shareholders
119,440
Major Registered Shareholders
% of total*
Renault.............................................................44.3
The Master Trust Bank of Japan, Ltd. (Trust) ............ 4.1
Japan Trustee Services Bank Ltd. (Trust) ................................. 3.2
The State Street Bank and Trust Company.................................... 2.9
The Dai-ichi Mutual Life Insurance Company.......................... 1.9
Nippon Life Insurance Company ....... 1.7
Sompo Japan Insurance Inc................. 1.4
The Chase Manhattan Bank N.A. London S.L. Omnibus A/C ............ 1.4
Moxley & Co. ................................................. 1.4
UFJ Trust Bank Limited (Trust A) ...... 1.3
* Ratio of holding stock to total issued and outstanding
stock.
Securities Traded
• Tokyo Stock Exchange
(7201 T)
• NASDAQ: (One American
Depositary Receipt represents
two shares underlying stock)
(NSANY)
Transfer Agent and Registrar for
Common Stock
The Chuo Mitsui Trust & Banking
Co., Ltd.
33-1, Shiba 3-chome
Minato-ku, Tokyo 105-8574
Japan
Depositary and Transfer Agent for
American Depositary Receipts
JPMorgan Chase Bank
One Chase Manhattan Plaza,
New York, New York 10081, USA
Auditor
Shin Nihon & Co.
Major Offices and Facilities
Corporate Headquarters (Tokyo, Japan)
Nissan North America (Gardena, US)
Nissan Europe (Tráppes, France)
Nissan Technical Center (Atsugi, Japan)
Nissan Technical Center North America
(Farmington Hills, US)
Nissan Technical Centre Europe
(Cranfield, UK)
Nissan Design America
(San Diego, US)
Nissan Design Europe
(London, UK)
Major Production Sites
Japan
Oppama Plant
Tochigi Plant
Kyushu Plant
Yokohama Plant
Iwaki Plant
North America
Nissan North America (Smyrna, US)
Nissan Mexicana S.A. de C.V.
Europe
Nissan Motor Manufacturing (UK) Ltd.
Nissan Motor Ibérica S.A. (Spain)
Corporate Data(As of March 31, 2003)

Nissan Annual Report 2002 47
Sales and Production (units) 2002 2001 2000 1999 1998Mar. 31, 2003 Mar. 31, 2002 Mar. 31, 2001 Mar. 31, 2000 Mar. 31, 1999
Global vehicle production(Note 1) 2,761,246 2,474,888 2,613,948 2,402,264 2,465,796
Japan 1,444,314 1,272,851 1,313,527 1,336,918 1,528,461
United States 392,458 363,366 352,927 348,214 279,392
Mexico 337,631 329,091 334,061 216,140 169,339
Spain 96,218 109,813 153,807 105,245 96,000
United Kingdom 303,411 290,046 332,532 286,865 275,993
Others 187,214 109,721 127,094 108,882 116,611
Global unit sales (wholesale) 2,635,686 2,460,484 2,564,160 2,415,433 2,541,736
Japan 792,767 702,657 725,842 758,603 872,507
North America(Notes 2 and 3) 1,040,684 968,030 985,168 874,160 656,789
Europe(Note 3) 458,222 453,697 513,048 500,836 549,547
Others(Note 2) 344,013 336,100 340,102 281,834 462,893
Notes: 1. All the figures for global vehicle production are on an April to March basis.Notes: 2. Unit sales in Mexico for 2002, 2001, 2000 and 1999 are included in “North America” according to new geographical segmentation applied
at April 1999. Those for years before 1999 have still been included in “Others.”Notes: 3. Sales for Europe and Mexico are on a January to December basis.
Millions ofU.S. dollars(Note 1)
Millions of yen (except per(except per share amounts and number of employees) share amounts)
2002 2001 2000 1999 1998 2002Mar. 31, 2003 Mar. 31, 2002 Mar. 31, 2001 Mar. 31, 2000 Mar. 31, 1999 Mar. 31, 2003
Net sales ¥6,828,588 ¥6,196,241 ¥6,089,620 ¥5,977,075 ¥6,580,001 $56,905
Operating income 737,230 489,215 290,314 82,565 109,722 6,144
Net income (loss) 495,165 372,262 331,075 (684,363) ( 27,714) 4,126
Net income (loss) per share(Note 2) 117.75 92.61 83.53 (179.98) (11.03) 0.98
Cash dividends paid(Note 3) 50,800 27,841 0 0 17,591 423
Shareholders’ equity(Note 4) ¥1,808,304 ¥1,620,822 ¥ 957,939 ¥ 563,830 ¥ 943,365 $15,069
Total assets(Note 4) 7,349,183 7,215,005 6,451,243 6,175,658 6,606,331 61,243
Long-term debt 1,603,246 1,604,955 1,402,547 1,655,610 1,591,596 13,360
Depreciation
and amortization 371,125 374,827 360,191 434,553 498,444 3,093
Number of employees 127,625 125,099 133,833 141,526 131,260
Notes: 1. Unless indicated otherwise, all dollar figures herein refer to U.S. currency. Yen amounts have been translated into U.S. dollars, forconvenience only, at ¥120=$1, the approximate exchange rate on March 31, 2003.
Notes: 2. Net income (loss) per share amounts are based on the weighted average number of shares of common stock outstanding during each year.Figures for net income (loss) per share are in exact yen and U.S. dollars.Number of shares outstanding as of March 31, 2003: 4,520,715,112.
Notes: 3. Cash dividends during the full year by subsidiary companies to non-Nissan minority shareholders are not included.Notes: 4. Shareholders’ equity and Total assets for fiscal years 1998-1999 were restated in accordance with the changes in the regulations relating to
the presentation of translation adjustments effective fiscal year 2000.
Financial Section
Consolidated Five-Year SummaryNissan Motor Co., Ltd. and Consolidated SubsidiariesFiscal years 2002, 2001, 2000, 1999 and 1998
For the years ended
For the years ended

Financial Section
Financial Review
FISCAL YEAR 2002 BUSINESS
PERFORMANCE
Overall, Nissan sold 2,771,000 vehicles
worldwide, an increase of 174,000, or
6.7%, over fiscal year 2001 sales, in
a very difficult environment.
Fiscal year 2002 marked the biggest
product year in Nissan history, with 12
all-new models representing 21
regional product events. Sales and
market share have grown in every
region except Europe.
NET SALES
Consolidated revenues came to
¥6,828.6 billion, up 10.2% from last year,
mainly due to higher volume and mix,
including the expansion of the scope of
consolidation, primarily as a result of
the integration of Diamondmatic, an
automatic transmission and CVT
affiliate of Mitsubishi, into JATCO. On a
consistent basis, the increase was 9.5%.
Foreign exchange rates produced
a negative impact of ¥87 billion.
OPERATING INCOME
Nissan consolidated operating profit
improved by 50.7% from ¥489.2 billion
in fiscal year 2001 to a record ¥737.2
billion. As a percentage of net sales,
the operating profit margin came to
10.8%—the top level in the global
automotive industry, and by far the
highest level in Nissan history.
There are several factors behind the
variance between the ¥489.2 billion
consolidated operating profit in fiscal
year 2001 and ¥737.2 billion in fiscal
year 2002:
• The effect of foreign exchange
rates produced a ¥35 billion
negative impact on consolidated
operating profits for the full year.
• The change in the scope of
consolidation produced no impact
on operating profits.
• Higher volumes and mix globally
contributed ¥146 billion.
• Selling expenses increased by
¥28 billion.
• Sales finance companies
contributed an additional
¥22 billion.
Momentum continues to build at Nissan; the force behind this progress is the NISSAN
180 program, enhanced by the high motivation and teamwork of Nissan employees
around the globe. NISSAN 180 goals include increasing sales by one million addition-
al units by the end of fiscal year 2004; achieving an 8% operating margin; and reduc-
ing net automotive debt to zero. In fiscal year 2002, the first year of NISSAN 180, two
of these goals were already met.
6,580 5,977 6,090 6,196
Net Sales(Billions of yen)
’98 ’99 ’00
6,829
’01 ’02
110 83 290
Operating Income (Billions of yen)
’98 ’99 ’00
489
’01
737
’02
Nissan Annual Report 200248

• Purchasing cost improvement was
again a major contributor to the
growth in profitability. The net
accounting effect of this year’s
effort came to ¥227 billion,
reinforcing the competitiveness
of Nissan’s supplier base.
• Product enrichment and regulation
costs had a negative impact of
¥67 billion.
• As previously announced, an
additional ¥38 billion was allocated
to R&D related to Nissan’s growing
product development program and
necessary additional expenses for
new technologies.
• Increased efficiencies in
manufacturing and logistics
contributed an additional
¥17 billion.
• General and administrative
expenses and others factors
increased profit by ¥4 billion.
489.2(35)
+22
FY2001Operating
IncomeForeign
exchange
Salesfinancing
Volume/Mix
Product enrichment
Purchasing cost reductions
(67)
+227
(28)
(38)
+4
737.2
FY2002 Operating
Income
Others+17
Manufacturingexpenses
R&D
Sales cost
increase
Impacts on Operating ProfitFiscal year 2002 (Billions of yen)
900
800
700
600
500
400
300
200
100
0
+146
Operating Income by RegionFiscal years 2001-2002 (Billions of yen)
500
400
300
200
100
0
Japan US & Canada Europe Other Markets
’01 ’02 ’01 ’02 ’01 ’02 ’01 ’02
289.7 390.6 158.9 242.0 3.2 21.9 57.8 77.6
Eliminations ’01 -20.4’02 5.1
Nissan Annual Report 2002 49

NET INCOME
Current taxes and deferred taxes came
to ¥198.7 billion, which represents 29%
of income before income taxes. The
evaluation loss of Nissan Europe NV in
Amsterdam at the non-consolidated
loss reduced first-half consolidated
taxes, which made the effective tax rate
lower than the normal rate. Minority
interest in companies not fully owned
by Nissan represented a charge of ¥0.7
billion for fiscal year 2002.
Nissan reported a consolidated net
income of ¥495.2 billion, an increase of
33.0%, or 7.3% net margin, in fiscal year
2002, compared to ¥372.3 billion in
fiscal year 2001. This is the best net
result in the company’s history.
FINANCIAL POSITION
ASSETS
Total consolidated assets increased by
1.9% to ¥7.3 trillion in fiscal year 2002,
compared to ¥7.2 trillion at the end of
fiscal year 2001.
Current assets increased by 5.2% or
¥183 billion during fiscal year 2002 to
¥3.7 trillion. Sales finance receivables
increased by ¥181 billion, mainly due to
higher penetration by Nissan Motor
Acceptance Corporation (NMAC).
Fixed assets decreased by 1.3% to
¥3.6 trillion yen from ¥3.7 trillion,
caused mainly by the decrease of
investment securities by the
reclassification of treasury stock
holding by associated companies to
equity. Property, plant and equipment
increased by ¥110.2 billion as the net of
CAPEX ¥377.9 billion, including the
investment in the new Canton,
Mississippi plant, and depreciation of
¥204.2 billion.
In May, Nissan purchased an
additional 1.5% of Renault, bringing
the total to 15% of Renault capital.
The cross-shareholding is completed
and is not to be changed in the
foreseeable future.
Nissan Annual Report 200250

SHAREHOLDERS’ EQUITY
Total shareholder equity increased from
¥1.62 trillion to ¥1.81 trillion in fiscal
year 2002, thanks to improved
profitability.
Consolidated shareholder equity
strengthened during the fiscal year,
representing 26% of total revenues and
25% of total assets.
At the shareholder meeting on June
19, 2003, the company proposed
increasing its dividend to ¥14 per share
in 2002, from ¥8 in 2001. Nissan’s
three-year dividend plan is to increase
dividend per share to ¥19 yen in 2003
and ¥24 in 2004.
DEBT
The objective of eliminating net
automotive debt was achieved at the
end of fiscal year 2002—two years
ahead of the NISSAN 180 plan—
showing a ¥8.6 billion net cash position
at constant accounting standards. The
generation of profit from the operation
and improvement in working capital
largely contributed to the reduction in
fiscal year 2002.
The net automotive debt of ¥2.1
trillion yen that existed at the end fiscal
year 1999 was totally eliminated.
Nissan has been upgraded by rating
agencies and is now in the investment
grade category.
CASH FLOW
Consolidated cash generated from
operating activities more than doubled
during fiscal year 2002, to ¥575 billion
from ¥222 billion the year before. The
higher profits from operations and
improved working capital requirements.
This cash was mainly used for
investments for future growth.
4.0%
3.4%
5.3% 5.5%5.6%
’99 ’00 ’01 ’02 ’033
4
5
6
3.9%
3.8%4.2%
4.4%
4.8%
Investment for GrowthFiscal years 1999-2003 (% to net sales)
Capital expenditureR&D
*Figures from 2001 onward include investment in the Canton plant
*
1,867 2,041
Net ConsolidatedAutomotive Debt(Billions of yen)
’98’98
*restated under the new GAAP
1,349 953
’99 ’00
432 (9)
’01 ’02*
Nissan Annual Report 2002 51

Thousands ofMillions of yen U.S. dollars(Note 3)
2002 2001 2002ASSETS As of Mar. 31, 2003 Mar. 31, 2002 Mar. 31, 2003
Current assets:
Cash and cash equivalents(Note 8) ¥ 269,817 ¥ 279,653 $ 2,248,475
Short-term investments(Note 19) 36 666 300
Receivables, less allowance
for doubtful receivables(Notes 4 and 8) 2,328,383 2,179,854 19,403,191
Inventories(Note 5) 543,608 534,051 4,530,067
Other current assets 558,213 523,031 4,651,775
Total current assets 3,700,057 3,517,255 30,833,808
Property, plant and equipment, at cost(Notes 6, 8 and 16): 6,201,074 6,211,552 51,675,617
Less accumulated depreciation (3,211,740) (3,332,394) (26,764,500)
Property, plant and equipment, net 2,989,334 2,879,158 24,911,117
Investments and other assets(Notes 8 and 19):
Investment securities:
Unconsolidated subsidiaries and affiliates 236,404 117,969 1,970,033
Other 30,642 281,144 255,350
Other assets 392,746 419,479 3,272,884
Total investments and other assets 659,792 818,592 5,498,267
Total assets ¥7,349,183 ¥7,215,005 $61,243,192
Financial SectionFinancial Section
Consolidated Balance SheetsNissan Motor Co., Ltd. and Consolidated SubsidiariesFiscal years 2002 and 2001
Nissan Annual Report 200252

Nissan Annual Report 2002 53
Thousands ofMillions of yen U.S. dollars(Note 3)
2002 2001 2002LIABILITIES AND SHAREHOLDERS’ EQUITY As of Mar. 31, 2003 Mar. 31, 2002 Mar. 31, 2003
Current liabilities:Short-term borrowings and current portion of
long-term debt(Note 8) ¥1,315,222 ¥1,424,804 $10,960,184Notes and accounts payable(Note 7) 1,047,364 990,273 8,728,033Accrued income taxes(Note 13) 36,907 46,706 307,558Other current liabilities 522,325 546,232 4,352,708
Total current liabilities 2,921,818 3,008,015 24,348,483
Long-term liabilities:
Long-term debt(Note 8) 1,603,246 1,604,955 13,360,383
Accrued retirement benefits(Note 9) 433,266 400,342 3,610,550
Accrual for losses on business restructuring – 49,591 –
Accrual for warranty costs 154,582 160,938 1,288,184
Other long-term liabilities 339,516 293,053 2,829,300
Total long-term liabilities 2,530,610 2,508,879 21,088,417
Minority interests in consolidated subsidiaries 88,451 77,289 737,092
Shareholders’ equity(Notes 10, 14 and 22):Common stock, without par value:
Authorized—6,000,000,000 shares;Issued —4,520,715,112 shares in 2002 and
4,517,045,210 shares in 2001 605,814 604,556 5,048,450Capital surplus 804,470 803,212 6,703,917Retained earnings 878,655 430,751 7,322,125Unrealized holding gain on securities 1,831 4,406 15,258Translation adjustments (320,276) (221,973) (2,668,967)
1,970,494 1,620,952 16,420,783
Less treasury common stock, at cost; 54,512,876 shares in 2002 and 173,987 shares in 2001 (162,190) (130) (1,351,583)
Total shareholders’ equity 1,808,304 1,620,822 15,069,200
Commitments and contingencies(Note 17)
Total liabilities and shareholders’ equity ¥7,349,183 ¥7,215,005 $61,243,192
See notes to consolidated financial statements.

Thousands of Millions of yen U.S. dollars(Note 3)
2002 2001 2000 2002For the years ended Mar. 31, 2003 Mar. 31, 2002 Mar. 31, 2001 Mar. 31, 2003
Net sales ¥6,828,588 ¥6,196,241 ¥6,089,620 $56,904,900
Cost of sales(Notes 6 and 11) 4,872,324 4,546,526 4,633,780 40,602,700
Gross profit 1,956,264 1,649,715 1,455,840 16,302,200
Selling, general and administrative
expenses(Notes 6 and 11) 1,219,034 1,160,500 1,165,526 10,158,617
Operating income 737,230 489,215 290,314 6,143,583
Other income (expenses):
Interest income 7,566 12,250 7,692 63,050
Interest expense (25,060) (34,267) (42,241) (208,833)
Equity in earnings of unconsolidated
subsidiaries and affiliates 11,395 921 9,239 94,958
Other, net(Note 12) (36,507) (103,903) 24,694 (304,225)
(42,606) (124,999) (616) (355,050)
Income before income taxes and
minority interests 694,624 364,216 289,698 5,788,533
Income taxes(Note 13):
Current 113,185 87,446 68,105 943,208
Deferred 85,513 (102,148) (130,637) 712,608
198,698 (14,702) (62,532) 1,655,816
Minority interests (761) (6,656) (21,155) (6,342)
Net income(Note 18) ¥ 495,165 ¥ 372,262 ¥ 331,075 $ 4,126,375
See notes to consolidated financial statements.
Financial SectionFinancial Section
Consolidated Statements of IncomeNissan Motor Co., Ltd. and Consolidated SubsidiariesFiscal years 2002, 2001 and 2000
Nissan Annual Report 200254

Financial SectionFinancial Section
Consolidated Statements of Shareholders’ EquityNissan Motor Co., Ltd. and Consolidated Subsidiaries Fiscal years 2002, 2001 and 2000
Thousands of Millions of yen U.S. dollars(Note 3)
2002 2001 2000 2002For the years ended Mar. 31, 2003 Mar. 31, 2002 Mar. 31, 2001 Mar. 31, 2003
Common stock:
Balance at beginning of the year
(2002—4,517,045,210 shares;
2001—3,977,295,210 shares;
2000—3,977,293,751 shares) ¥ 604,556 ¥ 496,606 ¥ 496,605 $ 5,037,967
Private placement (Note 10)
(2001—539,750,000 shares) – 107,950 – –
Conversion of convertible bonds
(2002—3,669,902 shares
2000— 1,459 shares; 1,258 – 1 10,483
Balance at end of the year
(2002—4,520,715,112 shares;
2001—4,517,045,210 shares;
2000—3,977,295,210 shares) ¥ 605,814 ¥ 604,556 ¥ 496,606 $ 5,048,450
Capital surplus:
Balance at beginning of the year ¥ 803,212 ¥ 690,262 ¥ 690,262 $ 6,693,434
Private placement (Note 10) 1,258 112,950 – 10,483
Conversion of convertible bonds – – 0 –
Balance at end of the year ¥ 804,470 ¥ 803,212 ¥ 690,262 $ 6,703,917
Retained earnings (deficit):
Balance at beginning of the year ¥ 430,751 ¥ 87,626 ¥(237,301) $ 3,589,592
Net income 495,165 372,262 331,075 4,126,375
Cash dividends paid (50,800) (27,841) – (423,333)
Bonuses to directors and statutory auditors (407) (286) (131) (3,392)
Other(Note 14) 3,946 (1,010) (6,017) 32,883
Balance at end of the year ¥ 878,655 ¥ 430,751 ¥ 87,626 $ 7,322,125
Unrealized holding gain on securities:
Balance at beginning of the year ¥ 4,406 ¥ 1,438 ¥ – $ 36,717
Net change during the year (2,575) 2,968 1,438 (21,459)
Balance at end of the year ¥ 1,831 ¥ 4,406 ¥ 1,438 $ 15,258
Translation adjustments:
Balance at beginning of the year ¥(221,973) ¥(316,481) ¥(365,526) $(1,849,775)
Net change during the year (98,303) 94,508 49,045 (819,192)
Balance at end of the year ¥(320,276) ¥(221,973) ¥(316,481) $(2,668,967)
See notes to consolidated financial statements.
Nissan Annual Report 2002 55
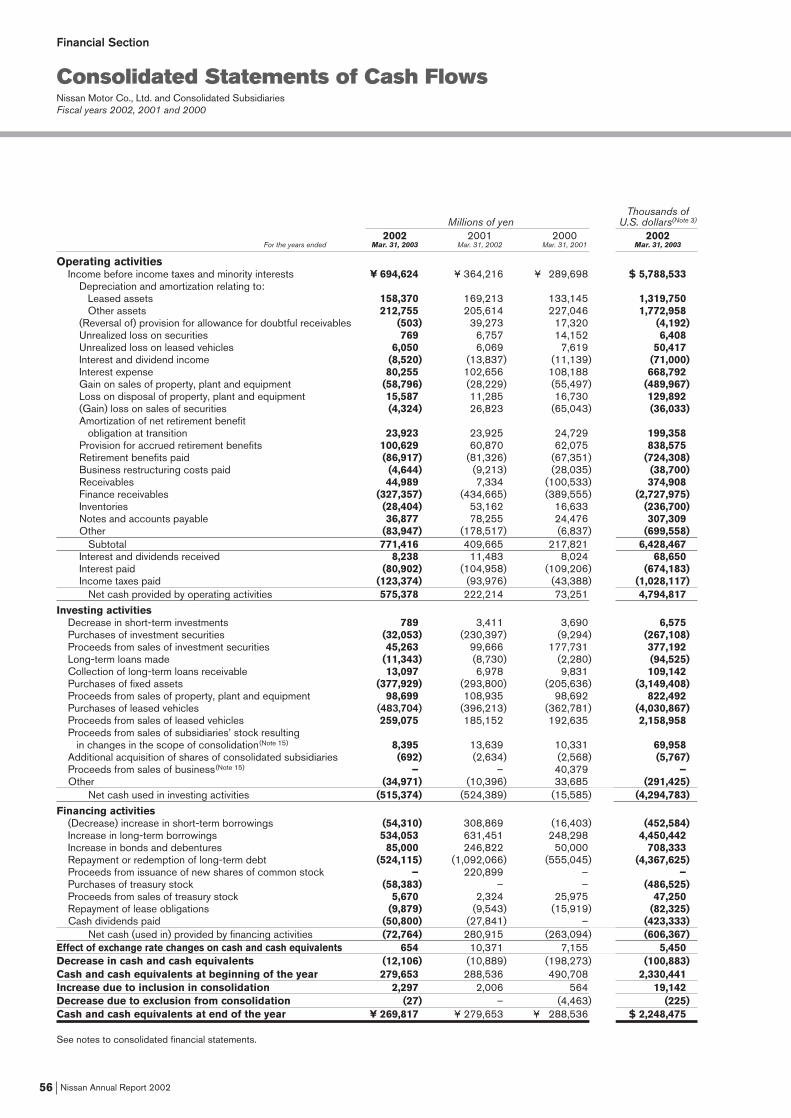
Thousands of Millions of yen U.S. dollars(Note 3)
2002 2001 2000 2002For the years ended Mar. 31, 2003 Mar. 31, 2002 Mar. 31, 2001 Mar. 31, 2003
Operating activitiesIncome before income taxes and minority interests ¥ 694,624 ¥ 364,216 ¥ 289,698 $ 5,788,533
Depreciation and amortization relating to:Leased assets 158,370 169,213 133,145 1,319,750Other assets 212,755 205,614 227,046 1,772,958
(Reversal of) provision for allowance for doubtful receivables (503) 39,273 17,320 (4,192)Unrealized loss on securities 769 6,757 14,152 6,408Unrealized loss on leased vehicles 6,050 6,069 7,619 50,417Interest and dividend income (8,520) (13,837) (11,139) (71,000)Interest expense 80,255 102,656 108,188 668,792Gain on sales of property, plant and equipment (58,796) (28,229) (55,497) (489,967)Loss on disposal of property, plant and equipment 15,587 11,285 16,730 129,892(Gain) loss on sales of securities (4,324) 26,823 (65,043) (36,033)Amortization of net retirement benefit
obligation at transition 23,923 23,925 24,729 199,358Provision for accrued retirement benefits 100,629 60,870 62,075 838,575Retirement benefits paid (86,917) (81,326) (67,351) (724,308)Business restructuring costs paid (4,644) (9,213) (28,035) (38,700)Receivables 44,989 7,334 (100,533) 374,908Finance receivables (327,357) (434,665) (389,555) (2,727,975)Inventories (28,404) 53,162 16,633 (236,700)Notes and accounts payable 36,877 78,255 24,476 307,309Other (83,947) (178,517) (6,837) (699,558)
Subtotal 771,416 409,665 217,821 6,428,467Interest and dividends received 8,238 11,483 8,024 68,650Interest paid (80,902) (104,958) (109,206) (674,183)Income taxes paid (123,374) (93,976) (43,388) (1,028,117)
Net cash provided by operating activities 575,378 222,214 73,251 4,794,817
Investing activitiesDecrease in short-term investments 789 3,411 3,690 6,575Purchases of investment securities (32,053) (230,397) (9,294) (267,108)Proceeds from sales of investment securities 45,263 99,666 177,731 377,192Long-term loans made (11,343) (8,730) (2,280) (94,525)Collection of long-term loans receivable 13,097 6,978 9,831 109,142Purchases of fixed assets (377,929) (293,800) (205,636) (3,149,408)Proceeds from sales of property, plant and equipment 98,699 108,935 98,692 822,492Purchases of leased vehicles (483,704) (396,213) (362,781) (4,030,867)Proceeds from sales of leased vehicles 259,075 185,152 192,635 2,158,958Proceeds from sales of subsidiaries’ stock resulting
in changes in the scope of consolidation(Note 15) 8,395 13,639 10,331 69,958Additional acquisition of shares of consolidated subsidiaries (692) (2,634) (2,568) (5,767)Proceeds from sales of business(Note 15) – – 40,379 –Other (34,971) (10,396) 33,685 (291,425)
Net cash used in investing activities (515,374) (524,389) (15,585) (4,294,783)
Financing activities(Decrease) increase in short-term borrowings (54,310) 308,869 (16,403) (452,584)Increase in long-term borrowings 534,053 631,451 248,298 4,450,442Increase in bonds and debentures 85,000 246,822 50,000 708,333Repayment or redemption of long-term debt (524,115) (1,092,066) (555,045) (4,367,625)Proceeds from issuance of new shares of common stock – 220,899 – –Purchases of treasury stock (58,383) – – (486,525)Proceeds from sales of treasury stock 5,670 2,324 25,975 47,250Repayment of lease obligations (9,879) (9,543) (15,919) (82,325)Cash dividends paid (50,800) (27,841) – (423,333)
Net cash (used in) provided by financing activities (72,764) 280,915 (263,094) (606,367)Effect of exchange rate changes on cash and cash equivalents 654 10,371 7,155 5,450Decrease in cash and cash equivalents (12,106) (10,889) (198,273) (100,883)Cash and cash equivalents at beginning of the year 279,653 288,536 490,708 2,330,441Increase due to inclusion in consolidation 2,297 2,006 564 19,142Decrease due to exclusion from consolidation (27) – (4,463) (225)Cash and cash equivalents at end of the year ¥ 269,817 ¥ 279,653 ¥ 288,536 $ 2,248,475
See notes to consolidated financial statements.
Financial SectionFinancial Section
Consolidated Statements of Cash FlowsNissan Motor Co., Ltd. and Consolidated Subsidiaries Fiscal years 2002, 2001 and 2000
Nissan Annual Report 200256

Financial SectionFinancial Section
Notes to Consolidated Financial StatementsNissan Motor Co., Ltd. and Consolidated Subsidiaries Fiscal year 2002 (Year ended March 31, 2003)
1. BASIS OF PRESENTATION
Nissan Motor Co., Ltd. (the “Company”) and its domestic subsidiariesmaintain their books of account in conformity with the financial accountingstandards of Japan, and its foreign subsidiaries maintain their books ofaccount in conformity with those of their countries of domicile.
The accompanying consolidated financial statements have been pre-pared in accordance with accounting principles and practices generallyaccepted and applied in Japan, which may differ in certain material
respects from accounting principles and practices generally accepted incountries and jurisdictions other than Japan, and have been compiledfrom the consolidated financial statements prepared by the Company asrequired by the Securities and Exchange Law of Japan.
Certain amounts in the prior years’ financial statements have beenreclassified to conform to the current year’s presentation.
2. SUMMARY OF SIGNIFICANT ACCOUNTING POLICIES
(a) Principles of consolidation and accounting for investmentsin unconsolidated subsidiaries and affiliates
The accompanying consolidated financial statements include theaccounts of the Company and any significant companies controlleddirectly or indirectly by the Company. Companies over which theCompany exercises significant influence in terms of their operatingand financial policies have been included in the consolidated finan-cial statements on an equity basis. All significant intercompany bal-ances and transactions have been eliminated in consolidation.
The financial statements of the Company’s subsidiaries in certainforeign countries including Mexico have been prepared based ongeneral price-level accounting. The related revaluation adjustmentsmade to reflect the effect of inflation in those countries in the accom-panying consolidated financial statements have been charged orcredited to operations and are directly reflected in retained earnings.
Investments in subsidiaries and affiliates which are not consolidat-ed or accounted for by the equity method are carried at cost or less.Where there has been a permanent decline in the value of suchinvestments, the Company has written down the investments.
Differences between the cost and the underlying net equity at fairvalue of investments in consolidated subsidiaries and in companieswhich are accounted for by the equity method have been amortizedby the straight-line method over periods not exceeding 20 years.
(b) Foreign currency translationThe balance sheet accounts of the foreign consolidated subsidiariesare translated into yen at the rates of exchange in effect at the bal-ance sheet date, except for the components of shareholders’ equitywhich are translated at their historical exchange rates. Revenue andexpense accounts are translated at the average rate of exchange ineffect during the year, except for those of the subsidiary in Mexicowhich are translated at the rate of exchange in effect at the balancesheet date. Translation adjustments are presented as a componentof shareholders’ equity and minority interests in its consolidatedfinancial statements.
(c) Cash equivalentsAll highly liquid investments with a maturity of three months or lesswhen purchased are considered cash equivalents.
(d) InventoriesInventories are stated principally at the lower of cost or market. The costof finished products, work in process and purchased parts is deter-mined primarily by the average method, and the cost of raw materialsand supplies is determined primarily by the last-in, first-out method.
(e) Short-term investments and investment securitiesSecurities other than those of subsidiaries and affiliates are classi-fied into three categories: trading, held-to-maturity or other securi-ties. Trading securities are carried at fair value and held-to-maturitysecurities are carried at amortized cost. Marketable securities classi-fied as other securities are carried at fair value with changes in unre-alized holding gain or loss, net of the applicable income taxes,included directly in shareholders’ equity. Non-marketable securitiesclassified as other securities are carried at cost. Cost of securitiessold is determined by the moving average method.
(f) Property, plant and equipment and depreciationDepreciation of property, plant and equipment of the Company andits consolidated subsidiaries is calculated principally by the straight-line method based on the estimated useful lives and the residualvalue determined by the Company. Significant renewals and addi-tions are capitalized at cost. Maintenance and repairs are charged toincome.
(g) LeasesNoncancelable lease transactions are primarily accounted for asoperating leases (whether such leases are classified as operating orfinance leases) except that lease agreements which stipulate thetransfer of ownership of the leased assets to the lessee are account-ed for as finance leases.
Nissan Annual Report 2002 57

(h) Retirement benefitsAccrued retirement benefits for employees have been providedmainly at an amount calculated based on the retirement benefitobligation and the fair value of the pension plan assets as of balancesheet dates, as adjusted for unrecognized net retirement benefitobligation at transition, unrecognized actuarial gain or loss, andunrecognized prior service cost. The retirement benefit obligation isattributed to each period by the straight-line method over the esti-mated years of service of the eligible employees. The net retirementbenefit obligation at transition is being amortized principally over aperiod of 15 years by the straight-line method.
Actuarial gain and loss are amortized in the year following the yearin which the gain or loss is recognized primarily by the straight-linemethod over periods (principally 8 years through 18 years) which areshorter than the average remaining years of service of the employ-ees. Certain foreign consolidated subsidiaries have adopted the cor-ridor approach for the amortization of actuarial gain and loss.
Prior service cost is being amortized as incurred by the straight-line method over periods (principally 9 years through 15 years)which are shorter than the average remaining years of service of theemployees.
See Note 9 for the method of accounting for the separation of thesubstitutional portion of the benefit obligation from the corporateportion of the benefit obligation under Welfare Pension Fund Plan.
(i) Income taxesDeferred tax assets and liabilities have been recognized in the con-solidated financial statements with respect to the differencesbetween financial reporting and the tax bases of the assets and lia-bilities, and were measured using the enacted tax rates and lawswhich will be in effect when the differences are expected to reverse.
(j) Research and development costsResearch and development costs are charged to income whenincurred.
(k) Revenue recognitionRevenue is generally recognized on sales of products at the time ofshipment.
(l) Accounting for sales incentiveIn accordance with a new accounting standard for sales incentiveswhich became effective the year ended March 31, 2002 in theUnited States, certain sales promotion expenses (i.e., incentives paidin cash based on sales volume) of subsidiaries in the United Statesand Mexico, which had previously been included in selling, generaland administrative expenses, have been accounted for as deductionsfrom sales. As a result of this change, sales and gross profit for theyear ended March 31, 2002 decreased by ¥98,920 million as com-pared with the corresponding amounts for the previous year.However, this change had no impact on operating income andincome before income taxes and minority interests. See Note 21.
(m) Derivative financial instrumentsThe Company and certain consolidated subsidiaries have enteredinto various derivative transactions in order to manage certain risksarising from adverse fluctuations in foreign currency exchange rates,interest rates, and stock and commodity prices. Derivative financialinstruments are carried at fair value with changes in unrealized gainor loss charged or credited to operations, except for those whichmeet the criteria for deferral hedge accounting under which unreal-ized gain or loss is deferred as an asset or a liability. Receivablesand payables hedged by qualified forward foreign exchange con-tracts are translated at the corresponding foreign exchange contractrates.
(n) Appropriation of retained earningsUnder the Commercial Code of Japan, the appropriation of retainedearnings with respect to a given financial year is made by resolutionof the shareholders at a general meeting held subsequent to theclose of such financial year. The accounts for that year do not, there-fore, reflect such appropriations. See Note 22.
(o) Treasury stock and reduction of legal reservesEffective April 1, 2002 the Company adopted a new accountingstandard for treasury stock and reduction of legal reserves. Theeffect of the adoption of this new accounting standard on operatingresults was immaterial for the year ended March 31, 2003.
3. U.S. DOLLAR AMOUNTS
Amounts in U.S. dollars are included solely for the convenience ofthe reader. The rate of ¥120 = US$1.00, the approximate rate ofexchange in effect on March 31, 2003, has been used. The inclusion
of such amounts is not intended to imply that yen amounts havebeen or could be readily converted, realized or settled in U.S. dollarsat that or any other rate.
Nissan Annual Report 200258

4. RECEIVABLES
Receivables at March 31, 2003 and 2002 consisted of the following:Thousands of
Millions of yen U.S. dollars 2002 2001 2002
As of Mar. 31, 2003 Mar. 31, 2002 Mar. 31, 2003
Notes and accounts receivable ...................................................................................................... ¥ 501,127 ¥ 532,936 $ 4,176,058Finance receivables ........................................................................................................................... 1,896,953 1,716,024 15,807,942Less allowance for doubtful receivables....................................................................................... (69,697) (69,106) (580,809).................................................................................................................................................. ¥2,328,383 ¥2,179,854 $19,403,191
Finance receivables principally represent receivables from customers on loans made by financing subsidiaries in connection with sales ofautomobiles.
5. INVENTORIES
Inventories at March 31, 2003 and 2002 were as follows:Thousands of
Millions of yen U.S. dollars2002 2001 2002
As of Mar. 31, 2003 Mar. 31, 2002 Mar. 31, 2003
Finished products............................................................................................................................... ¥394,936 ¥381,671 $3,291,134Work in process and other .............................................................................................................. 148,672 152,380 1,238,933................................................................................................................................................................ ¥543,608 ¥534,051 $4,530,067
6. PROPERTY, PLANT AND EQUIPMENT
Property, plant and equipment at March 31, 2003 and 2002 is summarized as follows:Thousands of
Millions of yen U.S. dollars2002 2001 2002
As of Mar. 31, 2003 Mar. 31, 2002 Mar. 31, 2003
Land ..................................................................................................................................................... ¥ 782,009 ¥ 768,800 $ $ 6,516,742Buildings and structures ................................................................................................................. 1,251,036 1,288,439 10,425,300Machinery and equipment............................................................................................................... 3,914,070 3,997,661 32,617,250Construction in progress ................................................................................................................ 253,959 156,652 2,116,325................................................................................................................................................. ¥6,201,074 ¥6,211,552 $51,675,617
Depreciation of property, plant and equipment for each of the three years in the period ended March 31, 2003 was as follows:Thousands of
Millions of yen U.S. dollars2002 2001 2000 2002
For the years ended Mar. 31, 2003 Mar. 31, 2002 Mar. 31, 2001 Mar. 31, 2003
................................................................................................................................ ¥355,372 ¥362,601 ¥334,168 $2,961,433
Nissan Annual Report 2002 59

7. NOTES AND ACCOUNTS PAYABLE
Notes and accounts payable at March 31, 2003 and 2002 consisted of the following: Thousands of
Millions of yen U.S. dollars2002 2001 2002
As of Mar. 31, 2003 Mar. 31, 2002 Mar. 31, 2003
Notes and accounts payable ...................................................................................................... ¥ 656,411 ¥611,311 $5,470,092Accrued expenses and other ...................................................................................................... 390,953 378,962 3,257,941.............................................................................................................................................. ¥1,047,364 ¥990,273 $8,728,033
8. SHORT-TERM BORROWINGS AND LONG-TERM DEBT
At March 31, 2003 and 2002, short-term borrowings and the current portion of long-term debt consisted of the following:Thousands of
Millions of yen U.S. dollars2002 2001 2002
As of Mar. 31, 2003 Mar. 31, 2002 Mar. 31, 2003
Loans, principally from banks...................................................................................................... ¥ 436,897 ¥ 610,872 $ 3,640,809Import bills payable........................................................................................................................ – 2,390 –Commercial paper ......................................................................................................................... 132,034 62,038 1,100,283Current portion of long-term debt.............................................................................................. 746,291 749,504 6,219,092.............................................................................................................................................. ¥1,315,222 ¥1,424,804 $10,960,184
The annual interest rates applicable to short-term borrowings outstanding at March 31, 2003 and 2002 ranged principally from 0.1% to 7.8%and from 0.2% to 11.7%, respectively.
At March 31, 2003 and 2002, long-term debt consisted of the following:Thousands of
Millions of yen U.S. dollars2002 2001 2002
As of Mar. 31, 2003 Mar. 31, 2002 Mar. 31, 2003
Debt with collateral:Loans from banks and other financial institutions due
through 2012 at rates ranging from 0.7% to 8.0%..................................................... ¥1,039,807 ¥ 926,113 $ 8,665,058Debt without collateral:
Loans from banks and other financial institutions due through 2018 at rates ranging from 0.1% to 6.4%..................................................... 442,796 520,496 3,689,967
Bonds in yen due through 2007 at rates ranging from 0.6% to 3.6% ........................ 617,320 626,100 5,144,333Medium-term notes in U.S. dollars due through 2008
at rates ranging from 1.3% to 3.3%................................................................................ 59,258 4,130 493,817Euro medium-term notes in yen, U.S. dollars and
Euro due through 2006 at rates ranging from 2.5% to 5.0%................................... 17,556 102,254 146,3001.6% convertible bonds in yen due 2003 .......................................................................... – 2,566 –Floating rate bonds with warrants in yen due 2004......................................................... 172,800 172,800 1,440,000
.............................................................................................................................................. 2,349,537 2,354,459 19,579,475Less current portion ...................................................................................................................... 746,291 749,504 6,219,092.............................................................................................................................................. ¥1,603,246 ¥1,604,955 $13,360,383
See Note 10 with respect to information on the warrants issued with the floating rate bonds due 2004.At March 31, 2003, if all warrants had been exercised at the then current exercise price, 154,100 thousand new shares would have been
issuable.The exercise price of the warrants is subject to adjustment in certain cases which include stock splits. A sufficient number of shares of
common stock is reserved for the exercise of all warrants.
Nissan Annual Report 200260
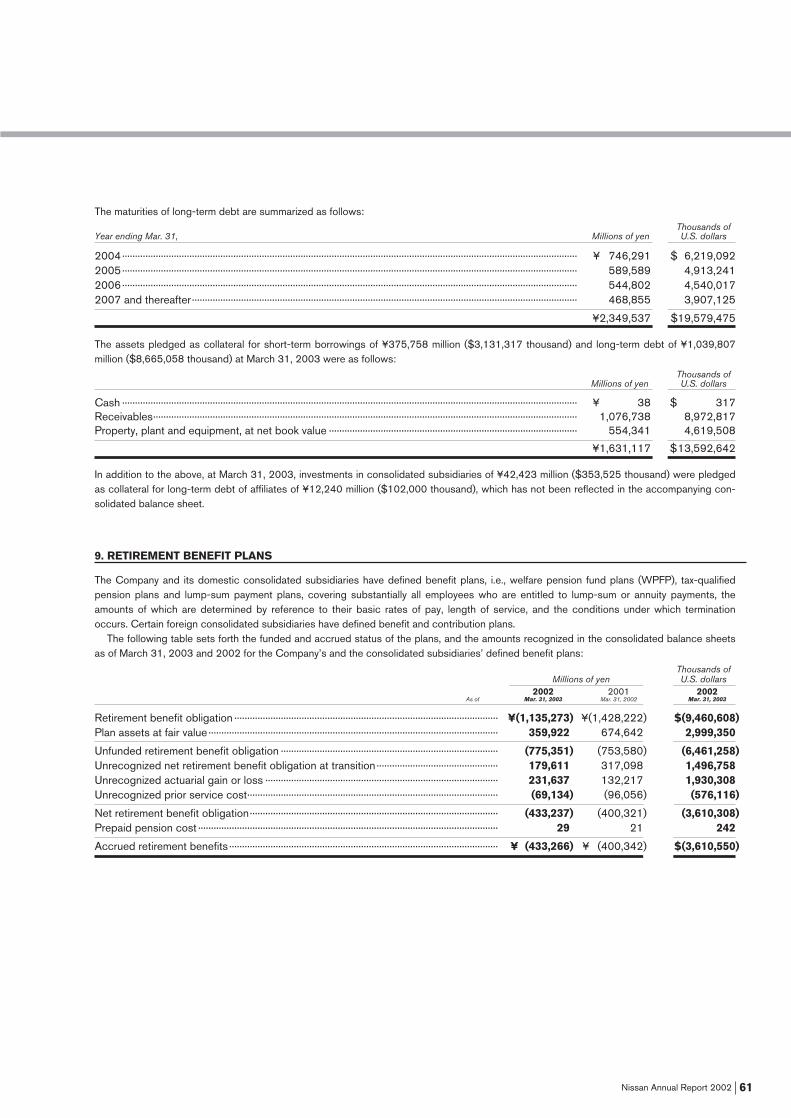
The maturities of long-term debt are summarized as follows:Thousands of
Year ending Mar. 31, Millions of yen U.S. dollars
2004................................................................................................................................................................................ ¥ 746,291 $ 6,219,0922005................................................................................................................................................................................ 589,589 4,913,2412006................................................................................................................................................................................ 544,802 4,540,0172007 and thereafter..................................................................................................................................................... 468,855 3,907,125.......................................................................................................................................................................................... ¥2,349,537 $19,579,475
The assets pledged as collateral for short-term borrowings of ¥375,758 million ($3,131,317 thousand) and long-term debt of ¥1,039,807million ($8,665,058 thousand) at March 31, 2003 were as follows:
Thousands ofMillions of yen U.S. dollars
Cash ................................................................................................................................................................................ ¥ 38 $ 317Receivables.................................................................................................................................................................... 1,076,738 8,972,817Property, plant and equipment, at net book value ................................................................................................ 554,341 4,619,508
...................................................................................................................................................................................................... ¥1,631,117 $13,592,642
In addition to the above, at March 31, 2003, investments in consolidated subsidiaries of ¥42,423 million ($353,525 thousand) were pledgedas collateral for long-term debt of affiliates of ¥12,240 million ($102,000 thousand), which has not been reflected in the accompanying con-solidated balance sheet.
9. RETIREMENT BENEFIT PLANS
The Company and its domestic consolidated subsidiaries have defined benefit plans, i.e., welfare pension fund plans (WPFP), tax-qualifiedpension plans and lump-sum payment plans, covering substantially all employees who are entitled to lump-sum or annuity payments, theamounts of which are determined by reference to their basic rates of pay, length of service, and the conditions under which terminationoccurs. Certain foreign consolidated subsidiaries have defined benefit and contribution plans.
The following table sets forth the funded and accrued status of the plans, and the amounts recognized in the consolidated balance sheetsas of March 31, 2003 and 2002 for the Company’s and the consolidated subsidiaries’ defined benefit plans:
Thousands of Millions of yen U.S. dollars
2002 2001 2002As of Mar. 31, 2003 Mar. 31, 2002 Mar. 31, 2003
Retirement benefit obligation ...................................................................................................... ¥(1,135,273) ¥(1,428,222) $(9,460,608)Plan assets at fair value ................................................................................................................ 359,922 674,642 2,999,350
Unfunded retirement benefit obligation .................................................................................... (775,351) (753,580) (6,461,258)Unrecognized net retirement benefit obligation at transition............................................... 179,611 317,098 1,496,758Unrecognized actuarial gain or loss .......................................................................................... 231,637 132,217 1,930,308Unrecognized prior service cost................................................................................................. (69,134) (96,056) (576,116)
Net retirement benefit obligation................................................................................................ (433,237) (400,321) (3,610,308)Prepaid pension cost .................................................................................................................... 29 21 242
Accrued retirement benefits ........................................................................................................ ¥ (433,266) ¥ (400,342) $(3,610,550)
Nissan Annual Report 2002 61

The substitutional portion of the benefits under the WPFP has been included in the amounts shown in the above table. During the year endedMarch 31, 2001, the Company and certain consolidated subsidiaries made amendments to their WPFP with respect to the age of eligibilityfor annuity payments for the substitutional portion of the benefits in accordance with the amendments to the Welfare Pension Insurance Lawof Japan in March 2000, and also made amendments to their lump-sum payment plans and tax-qualified pension plans. In addition, effectiveApril 1, 2001, the Company discontinued providing certain benefits under the WPFP for future services. As a result, prior service cost (areduction of the liability) was incurred for the years ended March 31, 2002 and 2001.
On March 1, 2003, the Company received approval from the Minister of Health, Labor and Welfare with respect to its application forexemption from the obligation for benefits related to future employee services under the substitutional portion of the WPFP. In accordancewith the transitional provision stipulated in “Practical Guidelines for Accounting for Retirement Benefits,” the Company accounted for the sep-aration of the substitutional portion of the benefit obligation from the corporate portion of the benefit obligation under its WPFP as of the dateof approval of its exemption assuming that the transfer to the Japanese government of the substitutional portion of the benefit obligation andrelated pension plan assets had been completed as of that date. As a result, the Company recognized a loss of ¥30,945 million ($257,875thousand) for the year ended March 31, 2003. The pension assets which are to be transferred were calculated at ¥241,203 million($2,010,025 thousand) at March 31, 2003.
The components of retirement benefit expenses for the years ended March 31, 2003 and 2002 are outlined as follows:
Thousands of Millions of yen U.S. dollars
2002 2001 2000 2002For the years ended Mar. 31, 2003 Mar. 31, 2002 Mar. 31, 2001 Mar. 31, 2003
Service cost...................................................................................................................... ¥ 51,543 ¥50,147 ¥57,881 $ 429,525Interest cost...................................................................................................................... 45,269 43,086 45,390 377,242Expected return on plan assets ................................................................................... (26,708) (27,791) (31,092) (222,567)Amortization of net retirement benefit obligation at transition .............................. 24,280 24,369 25,232 202,333Amortization of actuarial gain or loss.......................................................................... 11,464 13,378 (239) 95,533Amortization of prior service cost ................................................................................ (7,762) (7,408) (10,848) (64,683)Other .................................................................................................................................. 5 (190) 480 42
Retirement benefit expenses ........................................................................................ ¥ 98,091 ¥95,591 ¥86,804 $ 817,425Loss on return of the substitution portion of welfare pension fund plans.......... 30,945 – – 257,875
Retirement benefit expenses ........................................................................................ ¥129,036 ¥95,591 ¥86,804 $1,075,300
The assumptions used in accounting for the above plans were as follows:2002 2001
For the years ended Mar. 31, 2003 Mar. 31, 2002
Discount rates Domestic companies .......................................................................... 2.3% - 2.5% 3.0%Foreign companies.............................................................................. 5.4% - 7.3% 5.5% - 7.5%
Expected return on assets Domestic companies .......................................................................... Mainly 4.0% Mainly 4.0%Foreign companies.............................................................................. 6.5% - 9.0% 7.0% - 9.0%
Nissan Annual Report 200262

10. SHAREHOLDERS’ EQUITY
In accordance with the Commercial Code of Japan (the “Code”), the Company has provided a legal reserve, which was included in retainedearnings. The Code provides that an amount equal to at least 10% of the amount to be disbursed as distributions of earnings be appropriatedto the legal reserve until the total of such reserve and the additional paid-in capital account equals 25% of the common stock account. Thelegal reserve amounted to ¥53,839 million ($448,658 thousand) as of both March 31, 2003 and 2002.
The Code provides that neither additional paid-in capital nor the legal reserve is available for dividends, but both may be used to reduce oreliminate a deficit by resolution of the shareholders or may be transferred to common stock by resolution of the Board of Directors. OnOctober 1, 2001, an amendment (the “Amendment”) to the Code became effective. The Amendment provides that if the total amount of addi-tional paid-in capital and the legal reserve exceeds 25% of the amount of common stock, the excess may be distributed to the shareholderseither as a return of capital or as dividends subject to the approval of the shareholders. In addition, the Amendment eliminates the stated parvalue of the Company’s outstanding shares, which resulted in all outstanding shares having no par value as of October 1, 2001. TheAmendment also provides that all share issuances after September 30, 2001 will be of shares with no par value. Prior to the date on whichthe Amendment came into effect, the Company’s shares had a par value of ¥50.
On May 28, 1999, the Company issued 1,464,250 thousand new shares of common stock at ¥400 per share to Renault, a French corpo-ration, for a total of ¥585,700 million.
On the same date, the Company issued to Renault floating rate bonds due 2004 with warrants which amounted to ¥215,900 million. Thewarrants, which may not be transferred to a third party, entitled Renault to subscribe for shares of common stock of the Company at an exer-cise price of ¥400 per share.
In March 2002, Renault exercised all the warrants and the Company issued 539,750 thousand new shares of common stock to Renault for¥220,900 million. As a result, Renault’s equity interest in the Company increased to 44.37% as of March 31, 2002. In March and May 2002, theCompany indirectly acquired shares of common stock of Renault representing a 15.0% interest, in the aggregate, in Renault for ¥247,566 million.
11. RESEARCH AND DEVELOPMENT COSTS
Research and development costs included in selling, general and administrative expenses and manufacturing costs for the years ended March31, 2003, 2002 and 2001 amounted to ¥300,330 million ($2,502,750 thousand), ¥262,121 million and ¥231,672 million, respectively.
12. OTHER INCOME (EXPENSES)
The components of “Other, net” in “Other income (expenses)” for each of the three years in the period ended March 31, 2003 were as follows:Thousands of
Millions of yen U.S. dollars2002 2001 2000 2002
For the years ended Mar. 31, 2003 Mar. 31, 2002 Mar. 31, 2001 Mar. 31, 2003
Dividend income.............................................................................................................. ¥ 954 ¥ 1,587 ¥ 3,447 $ 7,950Net realized gain on sales of securities...................................................................... – – 38,599 –Unrealized loss on securities ........................................................................................ (769) (6,757) (14,152) (6,408)Gain on sales of property, plant and equipment...................................................... 58,796 28,229 55,497 489,967Loss on disposal of property, plant and equipment ................................................ (15,587) (11,285) (16,730) (129,892)Gain (loss) on sales of investment securities ........................................................... 4,324 (26,823) 26,444 36,033Foreign exchange gain (loss)........................................................................................ 18,318 (1,895) (2,797) 152,650Amortization of net retirement benefit obligation at transition .............................. (23,923) (23,925) (24,729) (199,358)Loss on return of the substitution portion of
welfare pension fund plans (Note 9)................................................................... (30,945) – – (257,875)Other .................................................................................................................................. (47,675) (63,034) (40,885) (397,292)................................................................................................................................. ¥(36,507) ¥(103,903) ¥ 24,694 $(304,225)
Nissan Annual Report 2002 63

13. INCOME TAXES
Income taxes in Japan applicable to the Company and its domestic consolidated subsidiaries consist of corporation tax, inhabitants’ taxes andenterprise tax, which, in the aggregate, resulted in a statutory rate of approximately 42% for 2002, 2001 and 2000. Income taxes of the for-eign consolidated subsidiaries are based generally on the tax rates applicable in their countries of incorporation.
The effective tax rates reflected in the consolidated statements of income for the years ended March 31, 2003, 2002 and 2001 differ fromthe statutory tax rate for the following reasons:
2002 2001 2000For the years ended Mar. 31, 2003 Mar. 31, 2002 Mar. 31, 2001
Statutory tax rate ......................................................................................................................................... 41.9% 41.9% 41.9%Effect of:
Decrease in valuation allowance.................................................................................................... (10.4) (42.9) (60.9)Different tax rates applied to foreign subsidiaries........................................................................... (3.8) (4.3) (2.9)Adjustments in deferred tax assets and liabilities due to change in tax rate ............................... 0.8 – –Other .................................................................................................................................................... 0.1 1.3 0.3
Effective tax rates........................................................................................................................................ 28.6% (4.0)% (21.6)%
New legislation was enacted in March 2003 which will change the aggregate statutory tax rate from 41.9% to 40.6% effective for fiscal yearsbeginning after March 31, 2004. The effect of this tax rate change was to decrease deferred tax assets (net of deferred tax liabilities) by ¥5,467million ($45,558 thousand) at March 31, 2003 and to increase income taxes – deferred by ¥5,501 million ($45,842 thousand) for the yearended March 31, 2003.
The significant components of deferred tax assets and liabilities as of March 31, 2003 and 2002 were as follows:Thousands of
Millions of yen U.S. dollars2002 2001 2002
As of Mar. 31, 2003 Mar. 31, 2002 Mar. 31, 2003
Deferred tax assets:.................................................................................................................................Net operating loss carryforwards................................................................................................ ¥ 86,643 ¥ 165,554 $ 722,025Accrued retirement benefits......................................................................................................... 159,828 147,614 1,331,900Accrued warranty costs ................................................................................................................ 47,359 – 394,658Accrual for losses on business restructuring........................................................................... – 26,659 –Other.................................................................................................................................................. 316,634 320,260 2,638,617
Gross deferred tax assets ................................................................................................................ 610,464 660,087 5,087,200
Valuation allowance ........................................................................................................................... (66,439) (169,634) (553,658)
Total deferred tax assets................................................................................................................... 544,025 490,453 4,533,542
Deferred tax liabilities: .......................................................................................................................Reserves under Special Taxation Measures Law, etc. .......................................................... (266,326) (197,806) (2,219,383)Difference between cost of investments and their underlying net equity at fair value ..................... (68,517) (70,553) (570,975)Unrealized holding gain on securities....................................................................................................... (1,362) (2,146) (11,350)Other.................................................................................................................................................. (102,452) (17,249) (853,767)
Total deferred tax liabilities ............................................................................................................... (438,657) (287,754) (3,655,475)
Net deferred tax assets..................................................................................................................... ¥105,368 ¥ 202,699 $ 878,067
Nissan Annual Report 200264

14. RETAINED EARNINGS
Other changes in retained earnings for each of the three years in the period ended March 31, 2003 were as follows:Thousands of
Millions of yen U.S. dollars2002 2001 2000 2002
For the years ended Mar. 31, 2003 Mar. 31, 2002 Mar. 31, 2001 Mar. 31, 2003
Adjustments for revaluation of the accountsof the consolidated subsidiaries based on general price-level accounting (Note 2(a)) .................................................................. ¥14,464 ¥ 1,455 ¥ 4,346 $120,533
Loss on disposal of treasury stock.............................................................................. (2,664) – – (22,200)
Adjustments to retained earnings at beginning ofthe year for inclusion in or exclusion from consolidation or the equity method of accounting for subsidiariesand affiliates, and certain other adjustments.......................................................... (7,854) (2,465) (10,363) (65,450)
................................................................................................................................. ¥ 3,946 ¥ (1,010) ¥ (6,017) $ 32,883
15. SUPPLEMENTARY CASH FLOW INFORMATION
a) Summary of assets and liabilities of companies excluded from consolidation following the sale of their stock The following is a summary of the transferred assets and liabilities, the relevant selling prices and the net cash inflows from sales of stock ofRhythm Corporation, and two other companies in the year ended March 31, 2003, from sales of stock of Nissan Altia Co., Ltd., and eight othercompanies in the year ended March 31, 2002 and from sales of stock of Satio Yamagata Co., Ltd., and thirteen other companies in the yearended March 31, 2001:
Thousands of Millions of yen U.S. dollars
2002 2001 2000 2002For the years ended Mar. 31, 2003 Mar. 31, 2002 Mar. 31, 2001 Mar. 31, 2003
Current assets ................................................................................................................ ¥ 22,561 ¥ 46,516 ¥ 41,441 $188,008Fixed assets..................................................................................................................... 7,493 51,729 40,385 62,442(Loss) gain on sales of investment securities ......................................................... (1,765) 2,048 4,254 (14,708)Current liabilities ............................................................................................................ (11,991) (53,027) (46,563) (99,925)Long-term liabilities ....................................................................................................... (5,366) (24,526) (12,596) (44,717)Minority interests in consolidated subsidiaries ....................................................... (1,962) (6,612) (3,360) (16,350)
Proceeds from sales of stock ..................................................................................... 8,970 16,128 23,561 74,750Cash and cash equivalents held by subsidiaries.................................................... (575) (2,489) (13,230) (4,792)
Net proceeds .................................................................................................................. ¥ 8,395 ¥ 13,639 ¥ 10,331 $ 69,958
b) Summary of assets and liabilities excluded following the sales of business
Fiscal year 2000 (For the year ended Mar. 31, 2001) Millions of yen
Current assets ................................................................................................................ ¥26,325Fixed assets..................................................................................................................... 33,700Gains on sales of tangible fixed assets ........................................................................ 6,856Current liabilities ............................................................................................................ (12,346)Long-term liabilities ....................................................................................................... (3,625)Accrual for losses on business restructuring............................................................... (10,522)
Proceeds from sales of stock ..................................................................................... 40,388Cash and cash equivalents ......................................................................................... (9)
Net proceeds .................................................................................................................. ¥40,379
Nissan Annual Report 2002 65

16. LEASE TRANSACTIONS
a) Lessees’ accountingThe following pro forma amounts represent the acquisition costs, accumulated depreciation and net book value of the leased assets as ofMarch 31, 2003 and 2002, which would have been reflected in the consolidated balance sheets if finance lease accounting had been appliedto the finance leases currently accounted for as operating leases:
Millions of yen Thousands of U.S. dollarsAcquisition Accumulated Net book Acquisition Accumulated Net book
Fiscal year 2002 (As of Mar. 31, 2003) costs depreciation value costs depreciation value
Machinery and equipment................................................ ¥ 89,470 ¥35,823 ¥ 53,647 $ 745,583 $298,525 $ 447,058Other ..................................................................................... 155,704 60,472 95,232 1,297,533 503,933 793,600
Total ....................................................................................... ¥245,174 ¥96,295 ¥148,879 $2,043,116 $802,458 $1,240,658
Millions of yenAcquisition Accumulated Net book
Fiscal year 2001 (As of Mar. 31, 2002) costs depreciation value
Machinery and equipment................................................. ¥ 64,835 ¥ 22,940 ¥41,895Other...................................................................................... 132,844 77,903 54,941
Total........................................................................................ ¥197,679 ¥100,843 ¥96,836
Lease payments relating to finance leases accounted for as operating leases in the accompanying consolidated financial statements amount-ed to ¥45,638 million ($380,317 thousand), ¥47,317 million and ¥52,053 million for the years ended March 31, 2003, 2002 and 2001,respectively. Depreciation of the leased assets computed by the straight-line method over the respective lease terms and the interest portionincluded in lease payments amounted to ¥42,444 million ($353,700 thousand) and ¥3,039 million ($25,325 thousand), respectively, for theyear ended March 31, 2003, ¥44,282 million and ¥3,207 million, respectively, for the year ended March 31, 2002, and ¥49,136 million and¥3,160 million, respectively, for the year ended March 31, 2001.
Future minimum lease payments subsequent to March 31, 2003 on noncancelable operating leases and finance leases accounted for asoperating leases are summarized as follows:
Thousands of Millions of yen U. S. dollars
Finance Operating Finance Operating Year ending Mar. 31, leases leases leases leases
2004 ....................................................................................................................................... ¥ 53,648 ¥ 4,731 $ 447,067 $ 39,4252005 and thereafter ............................................................................................................ 97,532 20,638 812,767 171,983
Total......................................................................................................................................... ¥151,180 ¥25,369 $1,259,834 $211,408
b) Lessors’ accountingThe following amounts represent the acquisition costs, accumulated depreciation and net book value of the leased assets relating to financeleases accounted for as operating leases at March 31, 2003 and 2002:
Millions of yen Thousands of U.S. dollarsAcquisition Accumulated Net book Acquisition Accumulated Net book
Fiscal year 2002 (As of Mar. 31, 2003) costs depreciation value costs depreciation value
Machinery and equipment ......................................................... ¥89,924 ¥41,199 ¥48,725 $749,367 $343,325 $406,042Other .............................................................................................. 7,483 3,768 3,715 62,358 31,400 30,958
Total ................................................................................................ ¥97,407 ¥44,967 ¥52,440 $811,725 $374,725 $437,000
Millions of yenAcquisition Accumulated Net book
Fiscal year 2001 (As of Mar. 31, 2002) costs depreciation value
Machinery and equipment ......................................................... ¥91,035 ¥43,055 ¥47,980Other .............................................................................................. 5,018 3,163 1,855
Total ................................................................................................ ¥96,053 ¥46,218 ¥49,835
Nissan Annual Report 200266

Lease income relating to finance leases accounted for as operating leases in the accompanying consolidated financial statements amountedto ¥21,216 million ($176,800 thousand), ¥21,850 million and ¥37,591 million for the years ended March 31, 2003, 2002, and 2001,respectively. Depreciation of the assets leased under finance leases accounted for as operating leases and the interest portion included inlease income amounted to ¥18,351 million ($152,925 thousand) and ¥2,649 million ($22,075 thousand), respectively, for the year endedMarch 31, 2003, ¥18,946 million and ¥3,452 million, respectively, for the year ended March 31, 2002, and ¥23,751 million and ¥2,125 mil-lion, respectively, for the year ended March 31, 2001.
Future minimum lease income subsequent to March 31, 2003 for noncancelable operating leases and finance leases accounted for asoperating leases is summarized as follows:
Thousands of Millions of yen U. S. dollars
Finance Operating Finance Operating Year ending Mar. 31, leases leases leases leases
2004......................................................................................................................................... ¥17,490 ¥163,917 $145,750 $1,365,9752005 and thereafter ............................................................................................................. 36,666 239,166 305,550 1,993,050
Total .......................................................................................................................................... ¥54,156 ¥403,083 $451,300 $3,359,025
17. COMMITMENTS AND CONTINGENCIES
At March 31, 2003, the Company and its consolidated subsidiaries had the following contingent liabilities:Thousands of
Millions of yen U. S. dollars
As endorser of notes receivable discounted with banks ....................................................................................... ¥ 816 $ 6,800As guarantor of employees’ housing loans from banks and others..................................................................... 232,680 1,939,000............................................................................................................................................................................................. ¥233,496 $1,945,800
In addition to the above, at March 31, 2003, the Company was committed to provide guarantees of indebtedness of unconsolidated sub-sidiaries and affiliates in the aggregate amount of ¥3,296 million ($27,467 thousand) at the request of the lending banks. In addition, theCompany provided letters of awareness to financial institutions regarding the indebtedness of an affiliate which amounted to ¥75 million($625 thousand). The Company also provided letters of awareness to financial institutions to whom outstanding trade receivables of¥121,007 million ($1,008,392 thousand) had been sold. The outstanding balance of installment receivables sold with recourse amounted to¥240 million ($2,000 thousand) at March 31, 2003.
Certain consolidated subsidiaries have entered into overdraft and loan commitment agreements amounting to ¥39,151 million ($326,258thousand) with their customers and others. The loans receivable outstanding and the unused balances under these credit facilities as ofMarch 31, 2003 amounted to ¥3,361 million ($28,008 thousand) and ¥35,790 million ($298,250 thousand), respectively. Since many ofthese facilities expire without being utilized and the related borrowings are sometimes subject to a review of the borrowers’ credibility, anyunused amount will not necessarily be utilized at the full amount.
Nissan Annual Report 2002 67

18. AMOUNTS PER SHARE
Yen U.S. dollars2002 2001 2000 2002
For the years ended Mar. 31, 2003 Mar. 31, 2002 Mar. 31, 2001 Mar. 31, 2003
Net income:Basic........................................................................................................................................... ¥117.75 ¥92.61 ¥83.53 $0.981Diluted........................................................................................................................................ 116.88 92.13 79.45 0.974
Cash dividends applicable to the year................................................................................... 14.00 8.00 7.00 0.117
(Cash dividends per share for those issued during the year ended March 31, 2002 are ¥4.00.)Yen U.S. dollars
2002 2001 2002As of Mar. 31, 2003 Mar. 31, 2002 Mar. 31, 2003
Net assets........................................................................................................................................................... ¥434.11 ¥358.84 $3.618
Until the year ended March 31, 2002, basic net income per share was computed based on the net income reported in the consolidated state-ments of income and the weighted average number of shares of common stock outstanding during each year, and diluted net income pershare was computed based on the net income reported and the weighted average number of shares of common stock outstanding duringeach year after giving effect to the dilutive potential of shares of common stock to be issued upon the conversion of convertible bonds and theexercise of warrants. Amounts per share of net assets were computed based on the net assets reported in the consolidated balance sheetsand the number of shares of common stock outstanding at each balance sheet date.
In accordance with a new accounting standard for earnings per share which became effective April 1, 2002, basic net income per sharewas computed based on the net income available for distribution to shareholders of common stock and the weighted average number ofshares of common stock outstanding during the year, and diluted net income per share was computed based on the net income available fordistribution to the shareholders and the weighted average number of shares of common stock outstanding during each year after giving effectto the dilutive potential of shares of common stock to be issued upon the conversion of convertible bonds and the exercise of warrants for theyear ended March 31, 2003. Amounts per share of net assets at March 31, 2003 was computed based on net assets available for distribu-tion to the shareholders and the number of shares of common stock outstanding at the year end. If the previous method of computation hadbeen followed for the year ended March 31, 2003, basic net income per share, dilutive net income per share and amounts per share of netassets would have been ¥109.93, ¥109.17 and ¥404.89, respectively.
Cash dividends per share represent the cash dividends proposed by the Board of Directors as applicable to the respective years togetherwith the interim cash dividends paid.
Nissan Annual Report 200268

19. SECURITIES
a) Information regarding marketable securities classified as held-to-maturity debt securities and other securities as of March 31, 2003 and 2002 is as follows:
Marketable held-to-maturity debt securitiesMillions of yen Thousands of U.S. dollars
Carrying Estimated Unrealized Carrying Estimated UnrealizedFiscal year 2002 (As of Mar. 31, 2003) value fair value gain (loss) value fair value gain (loss)
Securities whose fair value exceeds their carrying value:Government bonds....................................................................... ¥ 60 ¥ 61 ¥ 1 $ 500 $ 508 $ 8Corporate bonds........................................................................... 313 336 23 2,608 2,800 192
Subtotal............................................................................................... ¥ 373 ¥ 397 ¥24 $ 3,108 $ 3,308 $200
Securities whose carrying value exceeds their fair value:Other bonds ................................................................................... ¥3,068 ¥3,068 ¥ 0 $25,567 $25,567 $ 0
Subtotal............................................................................................... ¥3,068 ¥3,068 ¥ 0 $25,567 $25,567 $ 0
Total...................................................................................................... ¥3,441 ¥3,465 ¥24 $28,675 $28,875 $200
Millions of yenCarrying Estimated Unrealized
Fiscal year 2001 (As of Mar. 31, 2002) value fair value gain (loss)
Securities whose fair value exceeds their carrying value:Government bonds....................................................................... ¥ 67 ¥ 70 ¥ 3Corporate bonds........................................................................... 348 363 15
Subtotal............................................................................................... ¥ 415 ¥ 433 ¥ 18
Securities whose carrying value exceeds their fair value:Corporate bonds........................................................................... ¥1,400 ¥1,263 ¥(137)
Subtotal............................................................................................... ¥1,400 ¥1,263 ¥(137)
Total...................................................................................................... ¥1,815 ¥1,696 ¥(119)
Nissan Annual Report 2002 69

Marketable other securitiesMillions of yen Thousands of U.S. dollars
Acquisition Carrying Unrealized Acquisition Carrying UnrealizedFiscal year 2002 (As of Mar. 31, 2003) cost value gain (loss) cost value gain (loss)
Securities whose carrying value exceeds their acquisition cost:
Stock................................................................................ ¥ 1,243 ¥ 4,492 ¥ 3,249 $ 10,358 $ 37,433 $27,075Debt securities............................................................... 19 20 1 158 166 8Others.............................................................................. 8,976 9,779 803 74,800 81,492 6,692
Subtotal............................................................................... ¥10,238 ¥14,291 ¥ 4,053 $ 85,316 $119,091 $33,775
Securities whose acquisition cost exceeds their carrying value:
Stock................................................................................ ¥ 3,544 ¥ 2,883 ¥ (661) $ 29,534 $ 24,025 $ (5,509)Debt securities............................................................... 100 82 (18) 833 684 (149)
Subtotal............................................................................... ¥ 3,644 ¥ 2,965 ¥ (679) $ 30,367 $ 24,709 $ (5,658)
Total...................................................................................... ¥13,882 ¥17,256 ¥3,374 $115,683 $143,800 $28,117
Millions of yenAcquisition Carrying Unrealized
Fiscal year 2001 (As of Mar. 31, 2002) cost value gain (loss)
Securities whose carrying value exceeds their acquisition cost:
Stock ............................................................................... ¥ 1,040 ¥ 5,886 ¥4,846Debt securities .............................................................. 27 30 3
Subtotal .............................................................................. ¥ 1,067 ¥ 5,916 ¥4,849Securities whose acquisition cost exceeds
their carrying value:Stock ............................................................................... ¥222,146 ¥221,588 ¥ (558)Debt securities .............................................................. 2,000 1,916 (84)Others ............................................................................. 200 200 0
Subtotal .............................................................................. ¥224,346 ¥223,704 ¥ (642)
Total ..................................................................................... ¥225,413 ¥229,620 ¥4,207
b) Sales of securities classified as other securities with aggregate gain and loss are summarized as follows:Thousands of
Millions of yen U.S. dollars2002 2001 2000 2002
For the years ended Mar. 31, 2003 Mar. 31, 2002 Mar. 31, 2001 Mar. 31, 2003
Sales proceeds .............................................................................................................. ¥12,770 ¥ 72,388 ¥145,621 $106,417Aggregate gain............................................................................................................... 3,446 12,818 43,888 28,717Aggregate loss ............................................................................................................... (3,167) (43,720) – (26,392)
c) The redemption schedule for securities with maturity dates classified as other securities and held-to-maturity debt securities as of March31, 2003 is summarized as follows:
Millions of yen Thousands of U.S. dollarsDue in Due after one Due after five Due Due in Due after one Due after five Due
one year or year through years through after one year or year through years through after Fiscal year 2002 (As of Mar. 31, 2003) less five years ten years ten years less five years ten years ten years
Government bonds ...................... ¥ 60 ¥ 20 ¥0 ¥ 0 $ 500 $ 167 $0 $0Corporate bonds .......................... 5,090 245 0 60 42,417 2,042 0 500Other debt securities .................. 3,068 0 0 105 25,567 0 0 875
Total ................................................. ¥8,218 ¥265 ¥0 ¥165 $68,484 $2,209 $0 $1,375
Nissan Annual Report 200270

20. DERIVATIVE TRANSACTIONS
Hedging Policies
The Company and its consolidated subsidiaries (collectively, the “Group”) utilize derivative transactions for the purpose of hedging their exposureto fluctuation in foreign exchange rates, interest rates and market prices. However, based on an internal management rule on financial market risk(the “Rule”) approved by the Company’s Board of Directors, they do not enter into transactions involving derivatives for speculative purposes. TheRule prescribes that (i) the Group’s financial market risk is to be controlled by the Company in a centralized manner, and that (ii) no individual sub-sidiary can initiate a hedge position without the prior approval of, and regular reporting back to the Company.
Risk to be hedged by derivative transactions
(1) Market riskThe financial market risk to which the Group is generally exposed in its operations and the relevant derivative transactions primarily used for hedg-ing are summarized as follows:
· Foreign exchange risk associated with assets and liabilities denominated in foreign currencies; forward foreign exchange contracts, foreign cur-rency options, and currency swaps;
· Interest rate risk associated with sourcing funds and investing: interest-rate swaps;· Risk of fluctuation in stock prices: options on stocks;· Risk of fluctuation in commodity prices (mainly for precious metals): commodity futures contracts
(2) Credit riskThe Group is exposed to the risk that a counterparty to its financial transactions could default and jeopardize future profits. We believe that thisrisk is insignificant as the Group enters into derivative transactions only with financial institutions which have a sound credit profile. The Groupenters into these transactions also with Renault Finance S.A. (“RF”), a specialized financial subsidiary of the Renault Group which, we believe, isnot subject to any such material risk. This is because RF enters into derivative transactions to cover such derivative transactions with us only withfinancial institutions of the highest caliber carefully selected by RF based on its own rating system which takes into account each counterparty’slong-term credit rating and shareholders’ equity.
(3) Legal riskThe Group is exposed to the risk of entering into a financial agreement which may contain inappropriate terms and conditions as well as the riskthat an existing contract may be affected by revisions to the relevant laws and regulations. The Company’s Legal Department and FinanceDepartment make every effort to minimize legal risk by reviewing any new agreements of significance and by reviewing the related documents in acentralized way.
Risk Management
All strategies to manage financial market risk and risk hedge operations of the Group are carried out pursuant to the Rule which stipulates theGroup’s basic policies for derivative transactions, management policies, management items, procedures, criteria for the selection of counterpar-ties, and the reporting system, and so forth. The Rule prescribes that (i) the Group’s financial market risk is to be controlled by the Company in acentralized manner, and that (ii) no individual subsidiary is permitted to initiate a hedging operation without the prior approval of , and regularreporting back to the Company.
The basic hedge policy is subject to the approval of the Monthly Hedge Policy Meeting attended by Chief Financial Officer (“CFO”). Executionand management of all deals are to be conducted pursuant to the Rule. Derivative transactions are conducted by a special section of the FinanceDepartment and monitoring of contracts for such transactions and confirming the balance of all open positions are the responsibility of back officeand risk management section. Commodity futures contracts are to be handled also by Finance Department under guidelines which are to bedrawn up by the MRMC (Materials Risk Management Committee). The MRMC is chaired by the corporate officer in charge of the PurchasingDepartment and the CFO and it will meet approximately once every six months.
The status of derivative transactions in reported on a daily basis to the corporate officer in charge of Finance Department and on an annualbasis to the Board of Directors. Credit risk is monitored quantitatively with reference to Renault’s rating system based principally on the counter-parties’ long-term credit ratings and on their shareholders’ equity. The Finance Department sets a maximum upper limit on positions with each ofthe counterparties for the Group and monitors the balances of open positions every day.
Nissan Annual Report 2002 71

Summarized below are the notional amounts and the estimated fair value of the derivative instruments outstanding at March 31, 2003 and 2002:
1) Currency-related transactions
Millions of yen Thousands of U.S. dollarsNotional Fair Unrealized Notional Fair Unrealized
Fiscal year 2002 (As of Mar. 31, 2003) amount value gain (loss) amount value gain (loss)
Forward foreign exchange contracts:Sell:
US$......................................................................................... ¥103,749 ¥102,000 ¥1,749 $864,575 $850,000 $14,575AU$......................................................................................... – – – – – –Others..................................................................................... 1 1 0 8 8 0
Buy:CAN$. .................................................................................... 10,542 10,663 121 87,850 88,858 1,008£ Stg....................................................................................... 2,391 2,365 (26) 19,925 19,708 (217)US$......................................................................................... – – – – – –Euro......................................................................................... – – – – – –Others..................................................................................... 691 600 (91) 5,758 5,000 (758)
Currency swaps:US$......................................................................................... ¥ 8,645 ¥ (320) ¥ (320) $ 72,042 $ (2,667) $ (2,667)£ Stg....................................................................................... 34,186 339 339 284,883 2,825 2,825CAN$...................................................................................... 2,242 (59) (59) 18,683 (491) (491)Euro......................................................................................... 34,840 (1,032) (1,032) 290,333 (8,600) (8,600)
Total................................................................................................ – – ¥ 681 – – $ 5,675
Millions of yenNotional Fair Unrealized
Fiscal year 2001 (As of Mar. 31, 2002) amount value gain (loss)
Forward foreign exchange contracts:Sell:
US$......................................................................................... ¥ 1,919 ¥ 1,904 ¥ 15AU$......................................................................................... 705 706 (1)Others..................................................................................... 438 520 (82)
Buy:£ Stg....................................................................................... 15,064 14,786 (278)US$......................................................................................... 22,744 22,525 (219)Euro......................................................................................... 33,280 33,691 411Others..................................................................................... 1,301 1,223 (78)
Currency swaps:US$......................................................................................... ¥ 4,927 ¥ (45) ¥ (45)£ Stg....................................................................................... 4,755 677 677CAN$ ..................................................................................... 2,284 (114) (114)Euro......................................................................................... 912 148 148
Total ............................................................................................... – – ¥ 434
Note: The notional amounts of the forward foreign exchange contracts and currency swaps presented above exclude those entered into to hedgereceivables and payables denominated in foreign currencies which have been translated and are reflected at their corresponding contracted ratesin the accompanying consolidated balance sheets.
Nissan Annual Report 200272

2) Interest-related transactions
Millions of yen Thousands of U.S. dollarsNotional Fair Unrealized Notional Fair Unrealized
Fiscal year 2002 (As of Mar. 31, 2003) amount value gain (loss) amount value gain (loss)
Interest rate swaps:Receive/floating and pay/fixed ...................................... ¥187,187 ¥(2,095) ¥(2,095) $1,559,892 $(17,458) $(17,458)Receive/fixed and pay/floating ...................................... 262,154 7,247 7,247 2,184,617 60,392 60,392Receive/floating and pay/floating................................. 2,500 (30) (30) 20,833 (250) (250)
Options:Caps sold........................................................................... ¥461,860 $3,848,833(Premium)........................................................................... (–) (4,605) (4,605) (–) (38,375) (38,375)Caps purchased............................................................... ¥461,860 $3,848,833(Premium)........................................................................... (–) 4,605 4,605 (–) 38,375 38,375
Total ........................................................................................ – – ¥ 5,122 – – $ 42,684
Millions of yenNotional Fair Unrealized
Fiscal year 2001 (As of Mar. 31, 2002) amount value gain (loss)
Interest rate swaps:Receive/floating and pay/fixed ......................................... ¥260,996 ¥(5,327) ¥(5,327)Receive/fixed and pay/floating ......................................... 244,650 8,347 8,347Receive/floating and pay/floating .................................... 2,500 (48) (48)
Options:Caps sold............................................................................ ¥448,872(Premium)........................................................................... – (5,092) (5,092)Caps purchased................................................................. ¥448,872(Premium)........................................................................... – 5,092 5,092
Total ........................................................................................ – – ¥ 2,972
Nissan Annual Report 2002 73

21. SEGMENT INFORMATION
The Company and its consolidated subsidiaries are primarily engaged in the manufacture and sales of products in the automobile segmentand in providing various financial services to users of the Company’s products in the sales financing segment. These products, which are soldin Japan and overseas, principally in North America and Europe, include passenger cars, buses and trucks as well as the related components.Financial services include primarily leases and credits in Japan and North America. As net sales, operating income and total assets of theautomobile segment constituted more than 90% of the consolidated totals for the years ended March 31, 2001, the disclosure of businesssegment information has been omitted.
Business segments
The business segment information for the Company and its consolidated subsidiaries for the years ended March 31, 2003 and 2002 is as follows:Fiscal year 2002 (For the year ended Mar. 31, 2003)
Automobile Sales Financing Total Eliminations ConsolidatedMillions of yen
I. Sales and operating incomeSales to third parties ......................................................... ¥6,444,460 ¥ 384,128 ¥6,828,588 ¥ – ¥6,828,588Inter-area sales and transfers.......................................... 42,775 11,740 54,515 (54,515) –
Total sales ............................................................................ 6,487,235 395,868 6,883,103 (54,515) 6,828,588Operating expenses .......................................................... 5,818,023 335,986 6,154,009 (62,651) 6,091,358
Operating income .............................................................. ¥ 669,212 ¥ 59,882 ¥ 729,094 ¥ 8,136 ¥ 737,230
II. Assets, depreciation and capital expendituresTotal assets.......................................................................... ¥5,607,323 ¥3,103,889 ¥8,711,212 ¥(1,362,029) ¥7,349,183Depreciation........................................................................ ¥ 213,569 ¥ 157,556 ¥ 371,125 ¥ – ¥ 371,125Capital Expenditures ......................................................... ¥ 410,003 ¥ 451,630 ¥ 861,633 ¥ – ¥ 861,633
Fiscal year 2002 (For the year ended Mar. 31, 2003)
Automobile Sales Financing Total Eliminations ConsolidatedThousands of U.S. dollars
I. Sales and operating incomeSales to third parties........................................................ $53,703,833 $ 3,201,067 $56,904,900 $ – $56,904,900Inter-area sales and transfers ........................................ 356,458 97,833 454,291 (454,291) –
Total sales........................................................................... 54,060,291 3,298,900 57,359,191 (454,291) 56,904,900Operating expenses......................................................... 48,483,525 2,799,883 51,283,408 (522,091) 50,761,317
Operating income............................................................. $ 5,576,766 $ 499,017 $ 6,075,783 $ 67,800 $ 6,143,583
II. Assets, depreciation and capital expendituresTotal assets ........................................................................ $46,727,692 $25,865,742 $72,593,434 $(11,350,242) $61,243,192Depreciation ...................................................................... $ 1,779,742 $ 1,312,966 $ 3,092,708 $ – $ 3,092,708Capital Expenditures........................................................ $ 3,416,692 $ 3,763,583 $ 7,180,275 $ – $ 7,180,275
Fiscal year 2001 (For the year ended Mar. 31, 2002)
Automobile Sales Financing Total Eliminations ConsolidatedMillions of yen
I. Sales and operating incomeSales to third parties ......................................................... ¥5,842,648 ¥ 353,593 ¥6,196,241 ¥ – ¥6,196,241Inter-area sales and transfers.......................................... 49,755 13,059 62,814 (62,814) –
Total sales ............................................................................ 5,892,403 366,652 6,259,055 (62,814) 6,196,241Operating expenses .......................................................... 5,435,656 328,536 5,764,192 (57,166) 5,707,026
Operating income .............................................................. ¥ 456,747 ¥ 38,116 ¥ 494,863 ¥ (5,648) ¥ 489,215
II. Assets, depreciation and capital expendituresTotal assets.......................................................................... ¥5,418,619 ¥2,862,560 ¥8,281,179 ¥(1,066,174) ¥7,215,005Depreciation........................................................................ ¥ 209,174 ¥ 165,653 ¥ 374,827 ¥ – ¥ 374,827Capital Expenditures ......................................................... ¥ 346,994 ¥ 343,019 ¥ 690,013 ¥ – ¥ 690,013
Nissan Annual Report 200274

1) Summarized consolidated balance sheets by business segment
Millions of yen Thousands of U.S. dollarsSales Consolidated Sales Consolidated
Fiscal year 2002 (As of Mar. 31, 2003) Automobile Financing total Automobile Financing total
Cash and cash equivalents .................................. ¥ 263,146 ¥ 6,671 ¥ 269,817 $ 2,192,883 $ 55,592 $2,248,475Short-term investments......................................... 21 15 36 175 125 300Receivables, less allowance for
doubtful receivables........................................ 267,704 2,060,679 2,328,383 2,230,866 17,172,325 19,403,191Inventories ................................................................ 526,062 17,546 543,608 4,383,850 146,217 4,530,067Other current assets.............................................. 397,157 161,056 558,213 3,309,642 1,342,133 4,651,775Total current assets ............................................... 1,454,090 2,245,967 3,700,057 12,117,416 18,716,392 30,833,808
Property, plant and equipment, net .................... 2,223,124 766,210 2,989,334 18,526,034 6,385,083 24,911,117Investment securities ............................................. 256,515 10,531 267,046 2,137,625 87,758 2,225,383Other assets ............................................................ 311,542 81,204 392,746 2,596,184 676,700 3,272,884Total assets.............................................................. ¥4,245,271 ¥3,103,912 ¥7,349,183 $35,377,259 $25,865,933 $61,243,192
Short-term borrowings and currentportion of long-term debt ............................. ¥ (653,588) ¥1,968,810 ¥1,315,222 $ (5,446,566) $16,406,750 $10,960,184
Notes and accounts payable ............................... 1,015,967 31,397 1,047,364 8,466,391 261,642 8,728,033Accrued income taxes........................................... 36,907 – 36,907 307,558 – 307,558Other current liabilities .......................................... 432,629 89,696 522,325 3,605,242 747,466 4,352,708Total current liabilities............................................ 831,915 2,089,903 2,921,818 6,932,625 17,415,858 24,348,483
Long-term debt ....................................................... 1,024,686 578,560 1,603,246 8,539,050 4,821,333 13,360,383Other long-term liabilities ..................................... 772,081 155,283 927,364 6,434,009 1,294,025 7,728,034Total long-term liabilities....................................... 1,796,767 733,843 2,530,610 14,973,059 6,115,358 21,088,417Total liabilities .......................................................... 2,628,682 2,823,746 5,452,428 21,905,684 23,531,216 45,436,900
Minority interests .................................................... 88,451 – 88,451 737,092 – 737,092
Common stock........................................................ 523,707 82,107 605,814 4,364,225 684,225 5,048,450Capital surplus ........................................................ 774,403 30,067 804,470 6,453,358 250,558 6,703,916Retained earnings .................................................. 730,373 148,282 878,655 6,086,442 1,235,683 7,322,125Unrealized holding gain on securities ................ 1,934 (103) 1,831 16,116 (858) 15,258Translation adjustments ........................................ (340,089) 19,813 (320,276) (2,834,075) 165,109 (2,668,966)Treasury stock ......................................................... (162,190) – (162,190) (1,351,583) – (1,351,583)Total Shareholders’ equity.................................... 1,528,138 280,166 1,808,304 12,734,483 2,334,717 15,069,200Total liabilities and shareholders’ equity ........... ¥4,245,271 ¥3,103,912 ¥7,349,183 $35,377,259 $25,865,933 $61,243,192
In accordance with a new accounting standard for sales incentives which became effective the year ended March 31, 2002 in the UnitedStates, certain sales promotion expenses (i.e., incentives paid in cash based on sales volume) of subsidiaries in the United States and Mexico,which had previously been included in selling, general and administrative expenses, have been accounted for as deductions from sales. As aresult of this change, sales and operating expenses in the automobile segment for the year ended March 31, 2002 decreased by ¥98,920million as compared with the corresponding amounts for the previous year.
The following tables set forth the summarized financial statements by business segment for the years ended March 31, 2003 and 2002.Amounts for the sales financing segment represent the aggregate of the figures for the sales financing subsidiaries in Japan and NorthAmerica. Amounts for the automobile segment represent the differences between the consolidated totals and those for the sales financingsegment.
Nissan Annual Report 2002 75

Millions of yenSales Consolidated
Fiscal year 2001 (As of Mar. 31, 2002) Automobile Financing total
Cash and cash equivalents ............................... ¥ 272,742 ¥ 6,911 ¥ 279,653Short-term investments...................................... 651 15 666Receivables, less allowance for
doubtful receivables..................................... 363,953 1,815,901 2,179,854Inventories ............................................................. 521,577 12,474 534,051Other current assets........................................... 364,171 158,860 523,031Total current assets............................................. 1,523,094 1,994,161 3,517,255
Property, plant and equipment, net ................. 2,103,261 775,897 2,879,158Investment securities .......................................... 373,379 25,734 399,113Other assets ......................................................... 352,711 66,768 419,479Total assets........................................................... ¥4,352,445 ¥2,862,560 ¥7,215,005
Short-term borrowings and current portion of long-term debt.......................................... ¥ (317,818) ¥1,742,622 ¥1,424,804
Notes and accounts payable ............................ 957,597 32,676 990,273Accrued income taxes ........................................ 46,706 – 46,706Other current liabilities ....................................... 417,494 128,738 546,232Total current liabilities......................................... 1,103,979 1,904,036 3,008,015
Long-term debt .................................................... 1,022,274 582,681 1,604,955Other long-term liabilities .................................. 769,883 134,041 903,924Total long-term liabilities .................................... 1,792,157 716,722 2,508,879Total liabilities ....................................................... 2,896,136 2,620,758 5,516,894
Minority interests.................................................. 77,289 – 77,289
Common stock..................................................... 534,949 69,607 604,556Capital surplus ..................................................... 785,645 17,567 803,212Retained earnings................................................ 319,023 111,728 430,751Unrealized holding gain on securities ............. 3,728 678 4,406Translation adjustments ..................................... (264,195) 42,222 (221,973)Treasury stock ...................................................... (130) – (130)Total Shareholders’ equity................................. 1,379,020 241,802 1,620,822Total liabilities and shareholders’ equity......... ¥4,352,445 ¥2,862,560 ¥7,215,005
Nissan Annual Report 200276

(Interest bearing debt)
Millions of yen Thousands of U.S. dollarsSales Consolidated Sales Consolidated
Fiscal year 2002 (As of Mar. 31, 2003) Automobile Financing total Automobile Financing total
Short-term borrowings from third parties ............ ¥ 420,041 ¥ 895,181 ¥1,315,222 $ 3,500,342 $ 7,459,842 $10,960,184Internal loans to sales financing companies ....... (1,073,629) 1,073,629 – (8,946,908) 8,946,908 –Short-term borrowings per the balance sheet ... (653,588) 1,968,810 1,315,222 (5,446,566) 16,406,750 10,960,184Bonds and debentures ............................................ 772,220 5,940 778,160 6,435,167 49,500 6,484,667Long-term borrowings from third parties ............. 252,772 572,314 825,086 2,106,433 4,769,283 6,875,716Internal loans to sales financing companies ....... (306) 306 – (2,550) 2,550 –Long-term borrowings per the balance sheet .... 252,466 572,620 825,086 2,103,883 4,771,833 6,875,716Total interest bearing debt ...................................... 371,098 2,547,370 2,918,468 3,092,484 21,228,083 24,320,567Cash and cash equivalents ..................................... 263,146 6,671 269,817 2,192,883 55,592 2,248,475Net interest bearing debt......................................... 107,952 2,540,699 2,648,651 899,601 21,172,491 22,072,092Debt for Canton Plant included in the above...... 116,554 – 116,554 971,283 – 971,283Net interest bearing debt
(excluding that related to Canton Plant)..... ¥ (8,602) ¥2,540,699 ¥2,532,097 $ (71,682) $21,172,491 $21,100,809
Millions of yenSales Consolidated
Fiscal year 2001 (As of Mar. 31, 2002) Automobile Financing total
Short-term borrowings from third parties ............ ¥ 444,998 ¥ 979,806 ¥1,424,804Internal loans to sales financing companies ....... (762,816) 762,816 –Short-term borrowings per the balance sheet ... (317,818) 1,742,622 1,424,804Bonds and debentures ............................................ 786,258 9,900 796,158Long-term borrowings from third parties ............. 249,263 559,534 808,797Internal loans to sales financing companies ....... (13,247) 13,247 –Long-term borrowings per the balance sheet .... 236,016 572,781 808,797Total interest bearing debt ...................................... 704,456 2,325,303 3,029,759Cash and cash equivalents ..................................... 272,742 6,911 279,653Net interest bearing debt......................................... 431,714 2,318,392 2,750,106Debt for Canton Plant included in the above...... – – –Net interest bearing debt
(excluding that related to Canton Plant)..... ¥ 431,714 ¥2,318,392 ¥2,750,106
Nissan Annual Report 2002 77

2) Summarized consolidated statements of income by business segment
Millions of yen Thousands of U.S. dollarsSales Consolidated Sales Consolidated
Fiscal year 2002 (For the year ended Mar. 31, 2003) Automobile Financing total Automobile Financing total
Net sales...................................................................... ¥6,432,720 ¥395,868 ¥6,828,588 $53,606,000 $3,298,900 $56,904,900
Cost of sales .............................................................. 4,617,368 254,956 4,872,324 38,478,067 2,124,633 40,602,700Gross profit................................................................. 1,815,352 140,912 1,956,264 15,127,933 1,174,267 16,302,200
Operating income...................................................... 677,348 59,882 737,230 5,644,566 499,017 6,143,583Operating income as a percentage of net sales. 10.5% 15.1% 10.8% 10.5% 15.1% 10.8%Net financial cost....................................................... (16,543) 3 (16,540) (137,858) 25 (137,833)
Income before income taxes and minority interests ............................................... 634,818 59,806 694,624 5,290,150 498,383 5,788,533
Net income.................................................................. ¥ 458,611 ¥ 36,554 ¥ 495,165 $ 3,821,758 $ 304,617 $ 4,126,375
(Detail of net financial cost)
Millions of yen Thousands of U.S. dollarsSales Consolidated Sales Consolidated
Fiscal year 2002 (For the year ended Mar. 31, 2003) Automobile Financing total Automobile Financing total
Total net financial cost ............................................. ¥(16,543) ¥3 ¥(16,540) $(137,858) $25 $(137,833)Intersegment elimination.......................................... (5,677) – (5,677) (47,308) – (47,308)Net financial cost for segment................................ (10,866) 3 (10,863) (90,550) 25 (90,525)
Millions of yenSales Consolidated
Fiscal year 2001 (For the year ended Mar. 31, 2002) Automobile Financing total
Net sales...................................................................... ¥5,829,589 ¥366,652 ¥6,196,241
Cost of sales .............................................................. 4,294,565 251,961 4,546,526Gross profit................................................................. 1,535,024 114,691 1,649,715
Operating income...................................................... 451,099 38,116 489,215Operating income as a percentage of net sales . 7.7% 10.4% 7.9%Net financial cost....................................................... (20,428) (2) (20,430)
Income before income taxes andminority interests ............................................... 327,197 37,019 364,216
Net income.................................................................. ¥ 349,890 ¥ 22,372 ¥ 372,262
(Detail of net financial cost)
Millions of yenSales Consolidated
Fiscal year 2001 (For the year ended Mar. 31, 2002) Automobile Financing total
Total net financial cost ............................................. ¥(20,428) ¥(2) ¥(20,430)Intersegment elimination.......................................... (5,469) – (5,469)Net financial cost for segment................................ (14,959) (2) (14,961)
Nissan Annual Report 200278

3) Summarized consolidated statements of cash flows by business segment
Millions of yen Thousands of U.S. dollarsSales Consolidated Sales Consolidated
Fiscal year 2002 (For the year ended Mar. 31, 2003) Automobile Financing total Automobile Financing total
Operating activitiesIncome before income taxes and
minority interests............................................. ¥ 634,818 ¥ 59,806 ¥ 694,624 $5,290,150 $ 498,383 $ 5,788,533Depreciation and amortization......................... 213,569 157,556 371,125 1,779,742 1,312,967 3,092,709Decrease (increase) in finance receivables . 64,057 (391,414) (327,357) 533,808 (3,261,783) (2,727,975)Others ................................................................... (115,097) (47,917) (163,014) (959,142) (399,308) (1,358,450)Net cash provided by (used in)
operating activities.......................................... 797,347 (221,969) 575,378 6,644,558 (1,849,741) 4,794,817Investing activitiesProceeds from sales of investment securities
including shares of subsidiaries .................. 39,816 13,842 53,658 331,800 115,350 447,150Proceeds from sales of property,
plant and equipment ...................................... 94,828 3,871 98,699 790,233 32,259 822,492Purchases of fixed assets........................................ (376,429) (1,500) (377,929) (3,136,908) (12,500) (3,149,408)Purchases of leased vehicles ................................. (33,522) (450,182) (483,704) (279,350) (3,751,517) (4,030,867)Proceeds from sales of leases vehicles ............... 15,644 243,431 259,075 130,367 2,028,591 2,158,958Others .......................................................................... (46,720) (18,453) (65,173) (389,333) (153,775) (543,108)
Net cash used in investing activities.............. (306,383) (208,991) (515,374) (2,553,191) (1,741,592) (4,294,783)Financing activities(Decrease) increase in short-term borrowings... (369,506) 315,196 (54,310) (3,079,217) 2,626,633 (452,584)(Decrease) increase in long-term borrowings .... (81,106) 91,044 9,938 (675,883) 758,700 82,817Increase in bonds and debentures........................ 85,000 – 85,000 708,333 – 708,333Proceeds from sales of treasury stock ................. 5,670 – 5,670 47,250 – 47,250Others .......................................................................... (144,062) 25,000 (119,062) (1,200,517) 208,334 (992,183)Net cash (used in) provided by financing activities .... (504,004) 431,240 (72,764) (4,200,034) 3,593,667 (606,367)Effect of exchange rate changes on cash
and cash equivalents ........................................... 1,174 (520) 654 9,783 (4,333) 5,450(Decrease) increase in cash and cash equivalents .... (11,866) (240) (12,106) (98,884) (1,999) (100,883)Cash and cash equivalents at beginning of the year.. 272,742 6,911 279,653 2,272,850 57,591 2,330,441Increase due to inclusion in consolidation .......... 2,297 – 2,297 19,142 – 19,142Decrease due to exclusion from consolidation .. (27) – (27) (225) – (225)Cash and cash equivalents at end of the year ... ¥263,146 ¥ 6,671 ¥269,817 $2,192,883 $ 55,592 $2,248,475
Nissan Annual Report 2002 79

Millions of yenSales Consolidated
Fiscal year 2001 (For the year ended Mar. 31, 2002) Automobile Financing total
Operating activitiesIncome before income taxes and
minority interests............................................. ¥ 327,197 ¥ 37,019 ¥ 364,216Depreciation and amortization......................... 209,174 165,653 374,827Decrease (increase) in finance receivables . 135,274 (569,939) (434,665)Others ................................................................... (42,492) (39,672) (82,164)Net cash provided by (used in)
operating activities.......................................... 629,153 (406,939) 222,214Investing activities
Proceeds from sales of investment securities including shares of subsidiaries 106,292 7,013 113,305
Proceeds from sales of property, plant and equipment ...................................... 108,874 61 108,935
Purchases of fixed assets................................. (293,100) (700) (293,800)Purchases of leased vehicles .......................... (53,868) (342,345) (396,213)Proceeds from sales of leases vehicles........ 38,213 146,939 185,152Others ................................................................... (233,522) (8,246) (241,768)
Net cash used in investing activities..................... (327,111) (197,278) (524,389)Financing activities
(Decrease) increase in short-term borrowings ....................................................... (331,786) 640,655 308,869
(Decrease) increase in long-term borrowings ....................................................... (415,935) (44,680) (460,615)
Increase in bonds and debentures................. 236,922 9,900 246,822Proceeds from sales of treasury stock.......... 2,324 – 2,324Others ................................................................... 183,515 – 183,515Net cash (used in) provided by
financing activities .......................................... (324,960) 605,875 280,915Effect of exchange rate changes on cash
and cash equivalents ........................................... 9,937 434 10,371(Decrease) increase in cash and cash
equivalents ............................................................. (12,981) 2,092 (10,889)Cash and cash equivalents at beginning
of the year............................................................... 283,717 4,819 288,536Increase due to inclusion in consolidation .......... 2,006 – 2,006Cash and cash equivalents at end of
the year ................................................................... ¥ 272,742 ¥ 6,911 ¥ 279,653
Nissan Annual Report 200280

Geographical areas
The geographical segment information for the Company and its consolidated subsidiaries for the years ended March 31, 2003, 2002 and2001 is as follows:
Fiscal year 2002 (For the year ended Mar. 31, 2003)
North Other foreignJapan America Europe countries Total Eliminations Consolidated
Millions of yen
Sales to third parties.................. ¥2,554,374 ¥ 2,879,500 ¥963,440 ¥431,274 ¥6,828,588 ¥ – ¥6,828,588Inter-area sales and transfers .. 1,766,102 32,763 26,765 4,174 1,829,804 (1,829,804) –
Total sales..................................... 4,320,476 2,912,263 990,205 435,448 8,658,392 (1,829,804) 6,828,588Operating expenses................... 3,929,920 2,607,699 968,253 418,682 7,924,554 (1,833,196) 6,091,358
Operating income....................... ¥ 390,556 ¥ 304,564 ¥ 21,952 ¥ 16,766 ¥ 733,838 ¥ 3,392 ¥ 737,230
Total assets .................................. ¥4,881,842 ¥3,463,261 ¥502,028 ¥140,849 ¥8,987,980 ¥(1,638,797) ¥7,349,183
Thousands of U.S. dollars
Sales to third parties.................. $21,286,450 $23,995,833 $8,028,667 $3,593,950 $56,904,900 $ – $56,904,900Inter-area sales and transfers .. 14,717,517 273,025 223,042 34,783 15,248,367 (15,248,367) –
Total sales..................................... 36,003,967 24,268,858 8,251,709 3,628,733 72,153,267 (15,248,367) 56,904,900Operating expenses................... 32,749,333 21,730,825 8,068,775 3,489,017 66,037,950 (15,276,633) 50,761,317
Operating income....................... $ 3,254,634 $ 2,538,033 $ 182,934 $ 139,716 $ 6,115,317 $ 28,266 $ 6,143,583
Total assets .................................. $40,682,017 $28,860,508 $4,183,567 $1,173,742 $74,899,834 $(13,656,642) $61,243,192
Fiscal year 2001 (For the year ended Mar. 31, 2002)
North Other foreignJapan America Europe countries Total Eliminations Consolidated
Millions of yen
Sales to third parties.................. ¥2,370,162 ¥2,649,212 ¥818,555 ¥358,312 ¥6,196,241 ¥ – ¥6,196,241Inter-area sales and transfers .. 1,458,965 15,475 32,912 4,709 1,512,061 (1,512,061) –
Total sales..................................... 3,829,127 2,664,687 851,467 363,021 7,708,302 (1,512,061) 6,196,241Operating expenses................... 3,539,431 2,455,062 848,239 356,794 7,199,526 (1,492,500) 5,707,026
Operating income....................... ¥ 289,696 ¥ 209,625 ¥ 3,228 ¥ 6,227 ¥ 508,776 ¥ (19,561) ¥ 489,215
Total assets .................................. ¥4,988,676 ¥3,506,180 ¥471,008 ¥114,081 ¥9,079,945 ¥(1,864,940) ¥7,215,005
Nissan Annual Report 2002 81

In accordance with a new accounting standard for sales incentives which became effective the year ended March 31, 2002 in the UnitedStates, certain sales promotion expenses (i.e., incentives paid in cash based on sales volume) of subsidiaries in the United States and Mexico,which had previously been included in selling, general and administrative expenses, have been accounted for as deductions from sales. As aresult of this change, sales and operating expenses for “North America” for the year ended March 31, 2002 decreased by ¥98,920 million ascompared with the corresponding amounts for the previous year.
Fiscal year 2000 (For the year ended Mar. 31, 2001)
North Other foreignJapan America Europe countries Total Eliminations Consolidated
Millions of yen
Sales to third parties.................. ¥2,536,750 ¥2,469,918 ¥822,756 ¥260,196 ¥6,089,620 ¥ – ¥6,089,620Inter-area sales and transfers .. 1,381,037 12,134 17,606 2,410 1,413,187 (1,413,187) –
Total sales..................................... 3,917,787 2,482,052 840,362 262,606 7,502,807 (1,413,187) 6,089,620Operating expenses................... 3,743,458 2,331,590 867,648 258,617 7,201,313 (1,402,007) 5,799,306
Operating income (loss)............ ¥ 174,329 ¥ 150,462 ¥ (27,286) ¥ 3,989 ¥ 301,494 ¥ (11,180) ¥ 290,314
Total assets .................................. ¥4,984,516 ¥2,416,774 ¥425,172 ¥ 76,373 ¥7,902,835 ¥(1,451,592) ¥6,451,243
Overseas sales
Overseas sales, which include export sales of the Company and its domestic consolidated subsidiaries and sales (other than exports toJapan) of the foreign consolidated subsidiaries, for the years ended March 31, 2003, 2002 and 2001 are summarized as follows:
Fiscal year 2002 (For the year ended Mar. 31, 2003)
North Other foreignAmerica Europe countries Total
Millions of yen
Overseas sales.......................................................................................................... ¥2,785,334 ¥974,872 ¥763,368 ¥4,523,574Consolidated net sales............................................................................................ 6,828,588
Thousands of U.S. dollars
Overseas sales.......................................................................................................... $23,211,117 $8,123,933 $6,361,400 $37,696,450Consolidated net sales............................................................................................ 56,904,900
Overseas sales as a percentage of consolidated net sales ..................................................................................... 40.8% 14.3% 11.1% 66.2%
Fiscal year 2001 (For the year ended Mar. 31, 2002)
North Other foreignAmerica Europe countries Total
Millions of yen
Overseas sales.......................................................................................................... ¥2,588,300 ¥825,696 ¥670,556 ¥4,084,552Consolidated net sales............................................................................................ 6,196,241
Overseas sales as a percentage of consolidated net sales ..................................................................................... 41.8% 13.3% 10.8% 65.9%
Nissan Annual Report 200282

In accordance with a new accounting standard for sales incentives which became effective the year ended March 31, 2002 in the UnitedStates, certain sales promotion expenses (i.e., incentives paid in cash based on sales volume) of subsidiaries in the United States and Mexico,which had previously been included in selling, general and administrative expenses, have been accounted for as deductions from sales. As aresult of this change, sales for “North America” for the year ended March 31, 2002 decreased by ¥98,920 million as compared with the cor-responding amounts for the previous year.
Fiscal year 2000 (For the year ended Mar. 31, 2001)
North Other foreignAmerica Europe countries Total
Millions of yen
Overseas sales.......................................................................................................... ¥2,429,722 ¥794,251 ¥554,221 ¥3,778,194Consolidated net sales............................................................................................ 6,089,620
Overseas sales as a percentage of consolidated net sales ..................................................................................... 39.9% 13.0% 9.1% 62.0%
22. SUBSEQUENT EVENTS
a) In accordance with Articles 280-20 and 280-21 of the Commercial Code of Japan and a resolution approved at the annual general meet-ing of the shareholders held on June 20, 2002, the Board of Directors of the Company resolved on April 23, 2003 to grant stock subscrip-tion rights free of charge to certain employees of the Company and certain directors and employees of the Company’s subsidiarieseffective May 7, 2003. The holders of these rights are entitled to subscribe for shares of common stock of the Company at a fixed price of¥932 per share. The aggregate number of units and shares granted for subscription are 124,300 units and 12,430,000 shares, respectively.
b) The Company and Dongfeng Automotive Industry Investment Co., Ltd. (“DAI”), a Chinese corporation, jointly will establish Dongfeng MotorCo., Ltd. (“DMC”) in accordance with a comprehensive and strategic agreement between the two parties. A business license from the rele-vant Chinese authorities was obtained on May 20, 2003 and DMC will commence operations effective July 1, 2003 with approximately74,000 employees including those at its subsidiaries. DMC is primarily engaged in the manufacture and sales of passenger vehicles, com-mercial vehicles, buses and trucks. Its registered capital is RMB16,700 million or approximately ¥240 billion ($2,000,000 thousand). Thisregistered capital is to be contributed equally by the Company in the form of cash and by DAI in the form of operating assets.
c) The following appropriations of retained earnings of the Company were approved at a shareholders’ meeting held on June 19, 2003:Thousands of
Millions of yen U. S. dollars
Year-end cash dividends(¥10.00 = U.S.$0.083 per share) ............................................................................................................................ ¥44,662 $372,183
Bonuses to directors ........................................................................................................................................................ 390 3,250
Nissan Annual Report 2002 83

Report of Independent Auditors
The Board of Directors
Nissan Motor Co., Ltd.
We have audited the accompanying consolidated balance sheets of Nissan Motor Co., Ltd. and consolidated subsidiaries
as of March 31, 2003 and 2002, and the related consolidated statements of income, shareholders’ equity, and cash flows
for each of the three years in the period ended March 31, 2003, all expressed in yen. These financial statements are the
responsibility of the Company's management. Our responsibility is to independently express an opinion on these financial
statements based on our audits.
We conducted our audits in accordance with auditing standards, procedures and practices generally accepted and applied
in Japan. Those standards, procedures and practices require that we plan and perform the audit to obtain reasonable
assurance about whether the financial statements are free of material misstatement. An audit includes examining, on a test
basis, evidence supporting the amounts and disclosures in the financial statements. An audit also includes assessing the
accounting principles used and significant estimates made by management, as well as evaluating the overall financial state-
ment presentation. We believe that our audits provide a reasonable basis for our opinion.
In our opinion, the financial statements referred to above present fairly, in all material respects, the consolidated financial
position of Nissan Motor Co., Ltd. and consolidated subsidiaries at March 31, 2003 and 2002, and the consolidated results
of their operations and their cash flows for each of the three years in the period ended March 31, 2003 in conformity with
accounting principles and practices generally accepted in Japan.
The U.S. dollar amounts in the accompanying consolidated financial statements with respect to the year ended March 31,
2003 are presented solely for convenience. Our audit also included the translation of yen amounts into U.S. dollar amounts
and, in our opinion, such translation has been made on the basis described in Note 3 to the consolidated financial statements.
June 19, 2003
See Note 1 to the consolidated financial statements which explains the basis of preparation of the consolidated financial statements of
Nissan Motor Co., Ltd. and consolidated subsidiaries under Japanese accounting principles and practices.
Nissan Annual Report 200284

Financial SectionFinancial Section
Non-consolidated Five-Year SummaryNissan Motor Co., Ltd. Fiscal years 2002, 2001, 2000, 1999 and 1998
Millions ofU.S. dollars(Note 1)
Millions of yen (except per(except per share amounts and number of employees) share amounts)
2002 2001 2000 1999 1998 2002For the years ended Mar. 31, 2003 Mar. 31, 2002 Mar. 31, 2001 Mar. 31, 2000 Mar. 31, 1999 Mar. 31, 2003
Net sales ¥3,419,068 ¥3,019,860 ¥2,980,130 ¥2,997,020 ¥3,319,659 $28,492
Operating income 316,059 242,279 127,762 (15,674) 15,165 2,634
Net income (loss) 72,869 183,449 187,485 (790,694) (34,809) 607
Net income (loss) per share(Note 2) 16.09 45.61 47.14 (204.93) (13.85) 0.13
Cash dividends paid(Note 3-4) 14.00 8.00 7.00 0.00 0.00 0.12
Shareholders’ equity ¥1,798,716 ¥1,829,052 ¥1,450,159 ¥1,263,075 ¥1,477,498 $14,989
Total assets 3,933,993 3,915,031 3,576,466 3,563,853 3,595,272 32,783
Long-term debt 902,118 942,518 798,009 909,178 750,028 7,518
Depreciation
and amortization 56,760 56,265 49,074 89,858 105,229 473
Number of employees 31,128 30,365 30,747 32,707 39,467
Notes: 1. Unless indicated otherwise, all dollar figures herein refer to U.S. currency. Yen amounts have been translated into U.S. dollars, for convenience only, at ¥120=$1, the approximate exchange rate on March 31, 2003.
Notes: 2. Net income (loss) per share amounts are based on the weighted average number of shares of common stock outstanding during each year.Figures for net income (loss) per share are in exact yen and U.S. dollars.Number of shares outstanding as of March 31, 2003: 4,520,715,112.
Notes: 3. Cash dividends paid represent the amounts proposed by the Board of Directors as applicable to the respective years, together with theinterim cash dividends paid.
Notes: 4. Cash dividends applicable to FY2002 is ¥14.00 per share.
Nissan Annual Report 2002 85

Consolidated Subsidiaries
as of Mar. 31, 2003
Company Location Principal Business Capital (millions) Nissanshare*(%)
Japan
Nissan Shatai Co., Ltd. Hiratsuka, Kanagawa Manufacture and sales of automobiles and parts ¥7,904 42.59
Aichi Machine Industry Co., Ltd. Nagoya, Aichi Manufacture and sales of automotive parts ¥8,518 41.51
JATCO Ltd. Fuji, Shizuoka Manufacture and sales of automotive parts ¥29,935 81.76
Nissan Kohki Co., Ltd. Samukawa, Kanagawa Manufacture and sales of automotive parts ¥2,020 91.82
Nissan Motor Car Carrier Co., Ltd. Tokyo International automobile transport ¥640 60.00
Nissan Trading Co., Ltd. Yokohama, Kanagawa Import and export of automobiles, parts, etc. ¥320 100.00
Nissan Financial Services Co., Ltd. Chiba, Chiba Automobile financing and leasing ¥16,387 100.00
Autech Japan, Inc. Chigasaki, Kanagawa Development, manufacture and sales of ¥480 100.00limited-edition automobiles
Nissan Real Estate Development Tokyo Real estate sales, purchase and leasing ¥1,000 70.50Corporation
Nissan Finance Co., Ltd. Tokyo Finance and accounting support ¥2,491 100.00
Aichi Nissan Motor Co., Ltd. Nagoya, Aichi Sales of automobiles and parts ¥4,000 100.00
Tokyo Nissan Motor Sales Co., Ltd. Tokyo Sales of automobiles and parts ¥3,400 100.00
Nissan Prince Tokyo Motor Sales Tokyo Sales of automobiles and parts ¥3,246 100.00Co., Ltd.
Nissan Satio Osaka Co., Ltd. Osaka Sales of automobiles and parts ¥2,000 100.00
Nissan Chuo Parts Sales Co., Ltd. Yokohama, Kanagawa Sales of automobile repair parts ¥545 80.61
Nissan Keihin Service Center Ayase, Kanagawa Inspection and service of new automobiles ¥215 100.00Co., Ltd.
Nissan Used Car Center Co., Ltd. Zama, Kanagawa Sales of used cars and parts ¥480 100.00
USNissan North America, Inc. Gardena, California Management of North American subsidiaries, $1,791 100.00
manufacture and sales of automobiles and parts
Nissan Motor Acceptance Torrance, California Finance of wholesale and retail automobile sales $499 100.00Corporation in US
Nissan Motor Corporation Honolulu, Hawaii Sales of automobiles and parts $6 100.00in Hawaii, Ltd.
Nissan Capital of America, Inc. Torrance, California Financing for group companies $1 100.00
Nissan CR Corporation Farmington Hills, Sales of automobiles and parts $28 100.00Michigan
Nissan Technical Center Farmington Hills, Research and development, testing $16 100.00North America, Inc. Michigan
Nissan Motor Insurance Corporation Honolulu, Hawaii Casualty insurance $10 100.00
Nissan Forklift Co., North America Marengo, Illinois Manufacture and sales of forklifts and parts $34 100.00
CanadaNissan Canada, Inc. Mississauga, Ontario Sales of automobiles and parts CAN$68 100.00
Nissan Canada Finance Inc. Mississauga, Ontario Finance of wholesale and retail automobile CAN$170 100.00sales in Canada
MexicoNissan Mexicana, S.A. de C.V. Mexico D.F. Manufacture and sales of automobiles and parts P17,056 100.00
*Percent of voting rights held by Nissan Motor Co., Ltd.
Subsidiaries and Affiliates
Nissan Annual Report 200286

Europe
Nissan Europe S.A.S. Trappes, France Management of European manufacturing €1,626 100.00and sales
Nissan International Finance Amsterdam, Financing for group companies €13 100.00(Netherlands) B.V. The Netherlands
Nissan France S.A. Trappes, France Sales of automobiles and parts €4 94.77
Nissan Motor (GB) Ltd. Rickmansworth, UK Sales of automobiles and parts £136 100.00
Nissan Holding (UK) Ltd. Sunderland, UK Holding company for English subsidiaries €870 100.00
Nissan Italia S.p.A. Rome, Italy Sales of automobiles and parts €5 100.00
Nissan Motor Manufacturing Sunderland, UK Manufacture and sales of automobiles and parts £250 100.00(UK) Ltd.
Nissan Technical Center Cranfield, UK Research and development, testing £15 100.00Europe Ltd.
Nissan Forklift Europe B.V. Amsterdam, Sales of forklifts and parts €6 100.00The Netherlands
Nissan Motor Iberica, S.A. Barcelona, Spain Manufacture and sales of automobiles and parts €725 99.74
Nissan Motor Espana, S.A. Barcelona, Spain Sales of automobiles and parts €12 100.00
Nissan Forklift Espana, S.A. Noain, Spain Manufacture and sales of forklifts and parts €9 100.00
AustraliaNissan Motor Co. (Australia) Pty. Ltd. Dandenong, Victoria Sales of automobiles and parts A$290 100.00
New ZealandNissan New Zealand Ltd. Auckland Managing New Zealand subsidiaries; NZ$51 100.00
automobile sales
South AfricaNissan Motor Company Rosslyn Managing South African subsidiaries; R39 99.39South Africa (Pty) Ltd. automobile manufacturing and sales
Middle EastNissan Middle East F.Z.E. Dubai, UAE Automobile sales Dh2 100.00
AsiaNissan Motor (China) Ltd. Hong Kong Automobile sales HK$16 100.00
Other consolidated subsidiaries 189 companies
Total consolidated subsidiaries 234 companies
Nissan Annual Report 2002 87
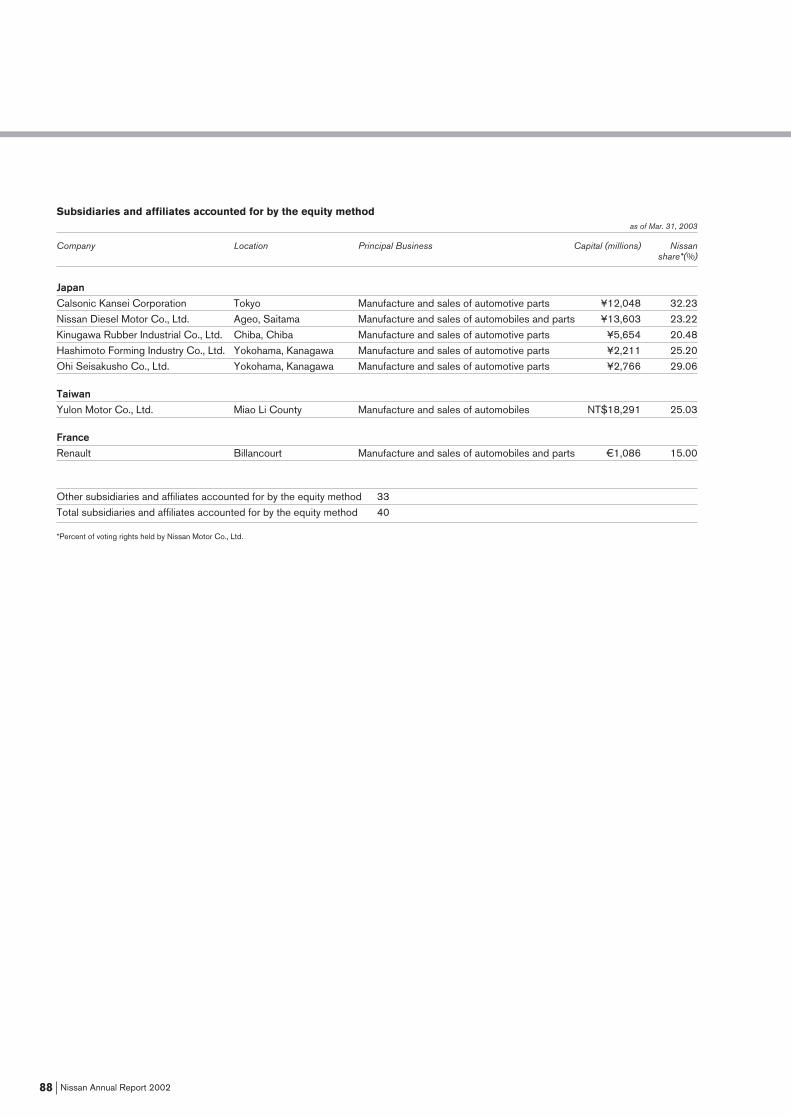
Subsidiaries and affiliates accounted for by the equity methodas of Mar. 31, 2003
Company Location Principal Business Capital (millions) Nissanshare*(%)
JapanCalsonic Kansei Corporation Tokyo Manufacture and sales of automotive parts ¥12,048 32.23
Nissan Diesel Motor Co., Ltd. Ageo, Saitama Manufacture and sales of automobiles and parts ¥13,603 23.22
Kinugawa Rubber Industrial Co., Ltd. Chiba, Chiba Manufacture and sales of automotive parts ¥5,654 20.48
Hashimoto Forming Industry Co., Ltd. Yokohama, Kanagawa Manufacture and sales of automotive parts ¥2,211 25.20
Ohi Seisakusho Co., Ltd. Yokohama, Kanagawa Manufacture and sales of automotive parts ¥2,766 29.06
TaiwanYulon Motor Co., Ltd. Miao Li County Manufacture and sales of automobiles NT$18,291 25.03
FranceRenault Billancourt Manufacture and sales of automobiles and parts €1,086 15.00
Other subsidiaries and affiliates accounted for by the equity method 33
Total subsidiaries and affiliates accounted for by the equity method 40
*Percent of voting rights held by Nissan Motor Co., Ltd.
Nissan Annual Report 200288

FOR FURTHER INFORMATION,PLEASE CONTACT
Investor Relations Nissan Motor Co., Ltd.Global Communications and Investor Relations Department17-1, Ginza 6-chome, Chuo-ku Tokyo 104-8023, Japanphone: +81(0)3-5565-2334 fax: +81(0)3-3546-2669
JAPANNissan Motor Co., Ltd.Global Communications and Investor Relations Department17-1, Ginza 6-chome, Chuo-ku Tokyo 104-8023, Japanphone: +81(0)3-5565-2141 fax: +81(0)3-3546-2669
NORTH AMERICANissan North America, Inc.Corporate Communications 18501 South Figueroa Street Gardena, California 90248, U.S.A.phone: +1(310)771-5631 fax: +1(310)516-7967
EUROPENissan Europe S.A.S.Communications DepartmentParc de Pissaloup 13, Avenue Jean d’Alembert B.P. 123 78194 Tráppes cedex, Francephone: +33(0)1 30 13 67 70 fax: +33(0)1 30 13 68 70
Corporate Information Websitehttp://www.nissan-global.com/
Investor Relations Websitehttp://www.nissan-global.com/EN/IR/
This annual report is printed on recycled paper.
Nissan Annual Report 2002 89

2003-07-12000Printed in Japan