Embed Size (px)
Citation preview
Teacher and Administrator Evaluation in Tennessee A Report on Year 3 Implementation
Tennessee Department of Education | April 2015
TEACHER AND ADMINISTRATOR EVALUATION IN TENNESSEE: A REPORT ON YEAR 3 IMPLEMENTATION
1
Contents I. Executive Summary II. Student Results III. Teacher Evaluation IV. Administrator Evaluation V. Non-Tested Grades and Subjects VI. Feedback VII. Key Changes for 2014-15 VIII. Flexibility IX. Looking Forward X. Conclusion
TEACHER AND ADMINISTRATOR EVALUATION IN TENNESSEE: A REPORT ON YEAR 3 IMPLEMENTATION
2
Executive Summary The 2013-14 school year was the third full year of implementation of Tennessee’s
comprehensive, multiple-measure, student outcomes-based, educator evaluation system.
Successful implementation was a key tenet of Tennessee’s historic First to the Top Act, which
was adopted with bipartisan support by the General Assembly in 2010. The act was a crucial
component of Tennessee’s successful bid to win funding in the Race to the Top competition,
which yielded an award of $501 million to improve educational offerings and student outcomes
through a core set of reforms.
The Year 3 report will provide an overview of 2013-14 implementation and highlight student
outcomes, evaluation data, and changes from the first two years, as well as provide a look
forward at what’s to come.
Student Results Although the main focus of this report is on educator evaluation in Tennessee, it is important to
analyze the growth we are seeing in classrooms as well. Since the inception of teacher
evaluation, we have evidence that evaluation has made a significant positive impact on
education outcomes in Tennessee. At the elementary level, proficiency levels have grown in
every subject area. In 2014, approximately 100,000 additional students were on grade level in
math as compared to 2010, and more than 57,000 additional students were on grade level in
science.
We have also seen continued growth at the high school level. End of Course performance has
grown steadily since 2009-10, with the exception of English III, which had a slight decrease in
the 2013-14 school year. Overall, students have made tremendous gains in the last four years,
with many more students scoring proficient and advanced.
Tennessee students take the ACT suite of assessments in grades 8, 10, and 11(students take the
PLAN in eighth grade, EXPLORE in tenth grade, and the actual ACT in eleventh grade). These
assessments are nationally normed, and scores on all three tests have risen in past years,
although the progress has been slow. We have also seen promising results on our students’
ACT growth. The statewide graduating cohort’s 2014 ACT composite score reached an all-time
high of 19.3.
TEACHER AND ADMINISTRATOR EVALUATION IN TENNESSEE: A REPORT ON YEAR 3 IMPLEMENTATION
3
Teacher Evaluation Teacher evaluation continues to be an important tool to support and grow teachers. It is used
to both accurately identify teachers across various levels of effectiveness and to provide
actionable feedback to teachers about how to improve their practice. To do this, the evaluation
system looks at a number of different metrics, including classroom observations, student
growth, student achievement, and in some districts, student perception surveys.
For the second year in a row, the department increased the rigor of the evaluator certification
test, which is required for all evaluators to pass prior to conducting observations, and
evaluators rose to the occasion. Over time, we have seen a closer correlation between
observations and student growth measures, especially at levels 4 and 5. Our data shows us that
evaluators are effectively differentiating between their lower performing teachers and their
higher performing teachers, and that teachers are receiving better, more accurate feedback
than they were prior to the adoption of a multiple-measure teacher evaluation model in 2011.
Additionally, when looking at evaluation results overall, both individual growth and observation
scores have remained relatively stable over the last three years.
Administrator Evaluation The administrator evaluation system has evolved since its inception in the 2011-12 school year.
The first year saw the rollout of the system aligned to the old Tennessee Instructional
Leadership Standards (TILS) without a rubric with specific indicators and descriptors. In
response to feedback, specific indicators and descriptors were added for the 2012-13 school
year. Year 2 also saw the revision of the TILS to reflect greater alignment with the changing
nature of the principal role. The revised and streamlined TILS were adopted by the State Board
of Education in April 2013.
The revised TILS created the need to align the administrator evaluation rubric with the
numerous standards that focused on shared leadership. The revised rubric was created in the
summer of 2013 and piloted by ten districts across the state in 2013-14. The department also
created a principal evaluation advisory council to receive ongoing feedback to further develop
and strengthen the revised rubric. This targeted feedback focused on the content of the rubric,
the process for evaluation, and the accompanying support tools. This feedback informed
changes to all three areas for the 2014-15 school year.
TEACHER AND ADMINISTRATOR EVALUATION IN TENNESSEE: A REPORT ON YEAR 3 IMPLEMENTATION
4
Administrator evaluation results from the first three years of implementation were consistent
across observation levels with a slight decrease in the percentage of misalignment between
observation and school-wide growth scores. During 2013-14, the 10 districts piloting the revised
rubric had a greater distribution of observation scores, especially in levels 3, 4, and 5, than the
non-pilot districts. We will continue to examine and revise this process as needed in the coming
years.
Non-Tested Grades and Subjects During the 2013-14 school year, approximately 48 percent of teachers with complete data
received an individual growth score. Developing metrics for measuring student growth in
traditionally non-tested grades and subjects continues to be a priority for the department, and
we continue to engage with interested educators and districts to develop rigorous portfolio
models for State Board of Education consideration.
Currently, three models have been approved by the state board for use in generating individual
growth scores for teachers. These models are Fine Arts, World Languages, and Physical
Education (K-5). The department is also currently in the process of developing alternate growth
measure options for pre-K/Kindergarten, middle school physical education, high school physical
education, lifetime wellness, and alternative educators.
Feedback The department is committed to the process of continuous improvement and making
enhancements to the evaluation system in response to data and feedback. These
enhancements take many forms ranging from adjusting internal policies, to proposing new
policies to the State Board of Education, to providing recommendations to the General
Assembly on potential legislative action.
Each year we focus on collecting feedback through a variety of means, including but not limited
to:
• TELL Survey
• TNCRED Survey
• In-person Meetings
• Evaluation Email Address
TEACHER AND ADMINISTRATOR EVALUATION IN TENNESSEE: A REPORT ON YEAR 3 IMPLEMENTATION
5
This year, in addition to our traditional means of collecting feedback, the evaluation team
conducted a statewide feedback tour, stopping in each CORE region to meet with teachers,
school-level leaders, and district leaders. Throughout this tour, the department engaged in over
50 hours of collective conversation with educators. Although the feedback received was varied,
a few common themes were consistently raised, and thus will remain important as we make
decisions moving forward. These themes included:
• A desire to maintain the stability of the current observation rubric
• Time required to perform the observation process with fidelity
• Implementation challenges associated with the 15 percent achievement measure
For the first time during the 2013-14 school year, we also had a teacher serving as our Teacher
Ambassador. This role allowed us to engage deeply with teachers across the state, helping us
learn how to better communicate with and support teachers.
Key Changes during 2014-15 We plan to make several changes to the evaluation system in response to feedback we received
throughout the year. Those changes fall into three main categories:
• 15 Percent Achievement Process: During the 2014 legislative session, legislation
passed that redefines the process around the 15 percent achievement measure
selection process. In previous years, if there was a disagreement on the most
appropriate measure for a teacher to use as his/her 15 percent achievement measure,
the evaluator made the final selection. Moving forward, the person being evaluated will
be able to make the final selection.
• Additional Evaluation Coaches: In 2013-14, struggling evaluators who worked with
state coaches demonstrated better accuracy than the rest of the state. For the 2014-15
school year, we increased the number of coaches and focused their work on both
specific schools that need additional support, as well as district and regional efforts to
strengthen and sustain high-quality implementation.
• Continued Expansion for Non-Tested Grades and Subjects: Continuing to expand
coverage for teachers in non-tested grades and subjects remained a department
priority throughout the 2014-15 school year. We have seen potential coverage expand
each year with the introduction of new portfolio growth models, tailored school-wide
measures, and additional assessment options. Our goal is to continue increasing this
TEACHER AND ADMINISTRATOR EVALUATION IN TENNESSEE: A REPORT ON YEAR 3 IMPLEMENTATION
6
coverage each year, as individual growth measures allow districts, schools, and teachers
to better identify how teachers are performing in every subject area, so that they can
receive support and recognition.
Flexibility As school leaders and teachers increasingly become comfortable with evaluation, we are seeing
more districts take advantage of flexibility to make evaluation their own. District ownership can
take many forms and most districts are already beginning to modify evaluation systems
according to their own local needs. Evaluation flexibility options fall into five main categories:
1. Alternate Models 2. Observation Practices 3. Optional Growth Measures for Non-Tested Grades and Subjects 4. Student Perception Surveys 5. Individual Growth Override
Currently 70 districts have chosen to implement some form of local flexibility, and we hope to
see this continue to increase as districts determine what makes sense for their local community
and context. The department will work to provide additional opportunities for districts in the
following ways:
• Decreasing barriers to transitioning to an alternate model • Increasing knowledge about each State Board of Education approved alternate
model • Increasing transparency about the flexibility that exists within policy • Monitoring results and sharing learning across the state
Looking Forward As we learn more about what successful implementation of evaluation looks like, we will
continue to seek out innovative opportunities to provide districts with more options to tailor
evaluation to their local context. We have worked over the last several years to implement
student perception surveys in pilot districts and expanded upon that work in the 2014-15
school year by introducing some new vendors into the marketplace. Our hope is that this will
result in a more affordable, customizable, and useful tool for districts to utilize.
Another big change moving forward will be our new data system. The Tennessee Department
of Education completed a Request for Proposals (RFP) process to find a vendor for a new data
TEACHER AND ADMINISTRATOR EVALUATION IN TENNESSEE: A REPORT ON YEAR 3 IMPLEMENTATION
7
system that will encompass both evaluation and licensure data and provide enhanced
reporting features. This data previously existed in two separate systems. The new system
should provide a number of advantages for educators, including, but not limited to:
• A single access point for educators
• Better tracking of the number of required observations for each teacher
• Enhanced reporting features
• A more streamlined process for license advancement and renewal
Lastly, we will continue to focus on connecting initiatives across the department. We expect to
see this manifested in a number of ways, including:
• Increased reporting on teacher and administrator evaluation data related to hiring,
retention, recognition, and placement decision-making
• Additional partnerships with researchers interested in studying and evaluating the
progress being made in Tennessee
Our hope is that by purposefully striving to connect initiatives such as evaluation, licensure,
state standards, Response to Instruction and Intervention (RTI2), etc. districts, schools, and
educators will be empowered to make informed decisions using high-quality data.
TEACHER AND ADMINISTRATOR EVALUATION IN TENNESSEE: A REPORT ON YEAR 3 IMPLEMENTATION
8
Introduction The 2013-14 school year was the third full year of implementation of Tennessee’s
comprehensive, multiple-measure, student outcomes-based, educator evaluation system.
Successful implementation was a key tenet of Tennessee’s historic First to the Top Act, which
was adopted with bipartisan support by the General Assembly in 2010. The act was a crucial
component of Tennessee’s successful bid to win funding in the Race to the Top competition,
which yielded an award of $501 million to improve educational offerings and student outcomes
through a core set of reforms.
During the first year of implementation (2011-12), the Tennessee Department of Education
(TDOE) worked intensively to help districts implement the evaluation system with fidelity. This
first year was also a tremendous opportunity for gathering the feedback that led to the tailored
improvements which can be examined in more depth in our Year 1 Report. The most crucial
outcome of this initial push was the landmark growth in student outcomes. In 2011-12, test
scores in Tennessee improved at a faster rate than any previously measured year.
In the 2012-13 school year there was a continued focus on strong implementation, in addition
to a deeper level of support through the eight Centers of Regional Excellence (CORE) offices. As
the evaluation system continued to improve, so did results for Tennessee students. The high
rate of student growth seen in the 2011-12 school year continued in 2012-13, with notable
student growth across a variety of state and national assessments. More specific information
about this growth can be found in our Year 2 Report.
The Year 3 report will provide an overview of 2013-14 implementation and highlight student
outcomes, evaluation data, and changes from the first two years, as well as provide a look
forward at what’s to come.
TEACHER AND ADMINISTRATOR EVALUATION IN TENNESSEE: A REPORT ON YEAR 3 IMPLEMENTATION
9
Student Results Although the main focus of this report is on educator evaluation in Tennessee, it is important to
analyze the growth we are seeing in classrooms as well. Since the inception of teacher
evaluation, we have evidence that evaluation has made a significant positive impact on
education outcomes in Tennessee. Evaluation is not the only driver of the results below, but we
hear from educators and leaders across the state that evaluation has played a significant role in
improving instruction and results for students.
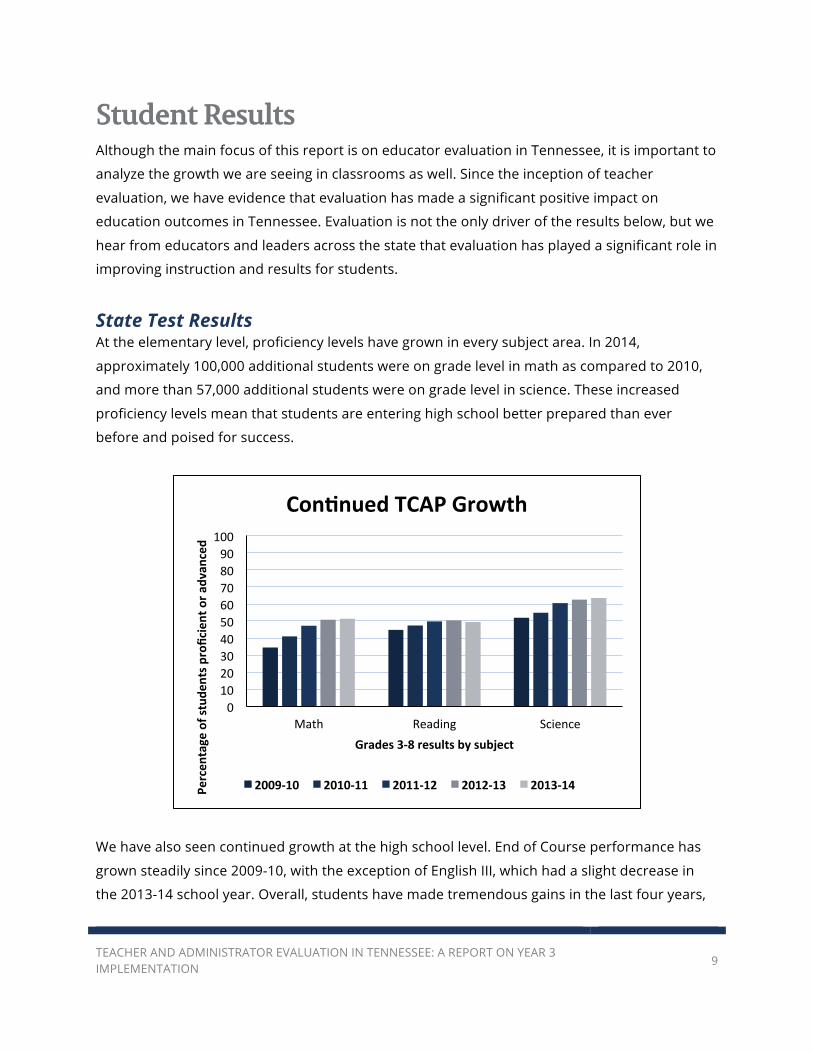
State Test Results At the elementary level, proficiency levels have grown in every subject area. In 2014,
approximately 100,000 additional students were on grade level in math as compared to 2010,
and more than 57,000 additional students were on grade level in science. These increased
proficiency levels mean that students are entering high school better prepared than ever
before and poised for success.
We have also seen continued growth at the high school level. End of Course performance has
grown steadily since 2009-10, with the exception of English III, which had a slight decrease in
the 2013-14 school year. Overall, students have made tremendous gains in the last four years,
0 10 20 30 40 50 60 70 80 90
100
Math Reading Science
Percen
tage of stude
nts p
roficient or a
dvan
ced
Grades 3-‐8 results by subject
Con<nued TCAP Growth
2009-‐10 2010-‐11 2011-‐12 2012-‐13 2013-‐14
TEACHER AND ADMINISTRATOR EVALUATION IN TENNESSEE: A REPORT ON YEAR 3 IMPLEMENTATION
10
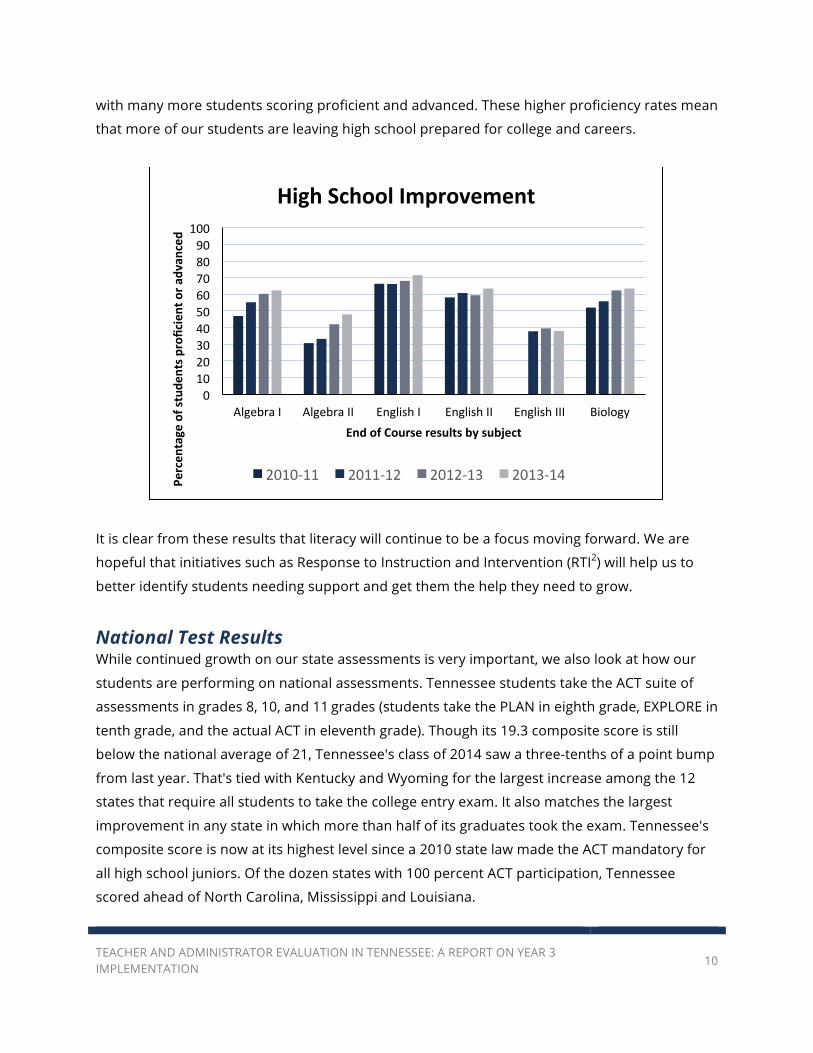
with many more students scoring proficient and advanced. These higher proficiency rates mean
that more of our students are leaving high school prepared for college and careers.
It is clear from these results that literacy will continue to be a focus moving forward. We are
hopeful that initiatives such as Response to Instruction and Intervention (RTI2) will help us to
better identify students needing support and get them the help they need to grow.
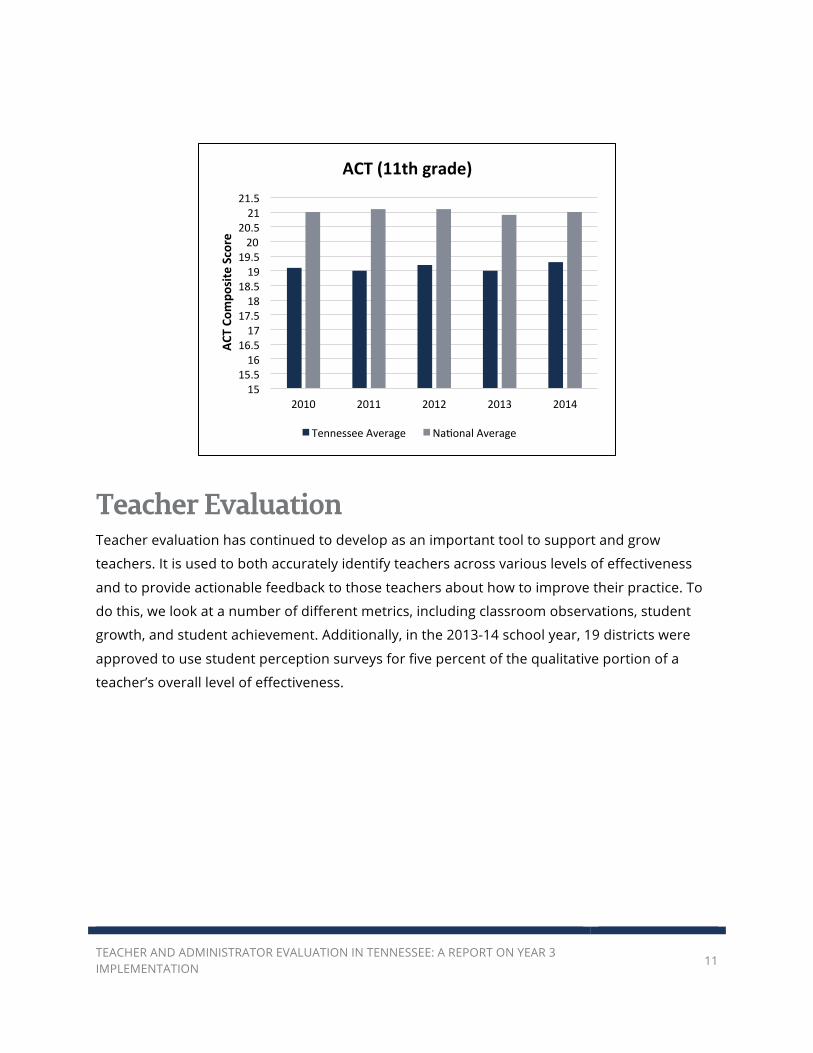
National Test Results While continued growth on our state assessments is very important, we also look at how our
students are performing on national assessments. Tennessee students take the ACT suite of
assessments in grades 8, 10, and 11 grades (students take the PLAN in eighth grade, EXPLORE in
tenth grade, and the actual ACT in eleventh grade). Though its 19.3 composite score is still
below the national average of 21, Tennessee's class of 2014 saw a three-tenths of a point bump
from last year. That's tied with Kentucky and Wyoming for the largest increase among the 12
states that require all students to take the college entry exam. It also matches the largest
improvement in any state in which more than half of its graduates took the exam. Tennessee's
composite score is now at its highest level since a 2010 state law made the ACT mandatory for
all high school juniors. Of the dozen states with 100 percent ACT participation, Tennessee
scored ahead of North Carolina, Mississippi and Louisiana.
0 10 20 30 40 50 60 70 80 90
100
Algebra I Algebra II English I English II English III Biology
Percen
tage of stude
nts p
roficient or a
dvan
ced
End of Course results by subject
High School Improvement
2010-‐11 2011-‐12 2012-‐13 2013-‐14
TEACHER AND ADMINISTRATOR EVALUATION IN TENNESSEE: A REPORT ON YEAR 3 IMPLEMENTATION
11
Teacher Evaluation Teacher evaluation has continued to develop as an important tool to support and grow
teachers. It is used to both accurately identify teachers across various levels of effectiveness
and to provide actionable feedback to those teachers about how to improve their practice. To
do this, we look at a number of different metrics, including classroom observations, student
growth, and student achievement. Additionally, in the 2013-14 school year, 19 districts were
approved to use student perception surveys for five percent of the qualitative portion of a
teacher’s overall level of effectiveness.
15 15.5 16
16.5 17
17.5 18
18.5 19
19.5 20
20.5 21
21.5
2010 2011 2012 2013 2014
ACT Co
mpo
site Score
ACT (11th grade)
Tennessee Average NaGonal Average
TEACHER AND ADMINISTRATOR EVALUATION IN TENNESSEE: A REPORT ON YEAR 3 IMPLEMENTATION
12
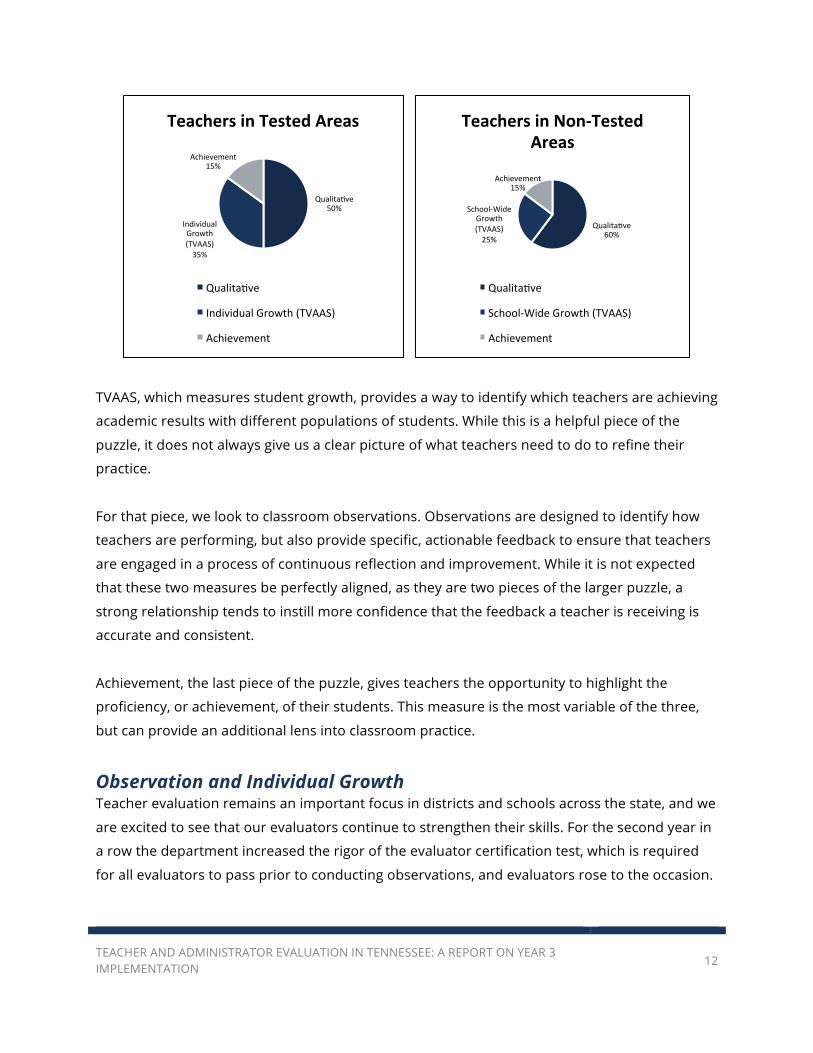
TVAAS, which measures student growth, provides a way to identify which teachers are achieving
academic results with different populations of students. While this is a helpful piece of the
puzzle, it does not always give us a clear picture of what teachers need to do to refine their
practice.
For that piece, we look to classroom observations. Observations are designed to identify how
teachers are performing, but also provide specific, actionable feedback to ensure that teachers
are engaged in a process of continuous reflection and improvement. While it is not expected
that these two measures be perfectly aligned, as they are two pieces of the larger puzzle, a
strong relationship tends to instill more confidence that the feedback a teacher is receiving is
accurate and consistent.
Achievement, the last piece of the puzzle, gives teachers the opportunity to highlight the
proficiency, or achievement, of their students. This measure is the most variable of the three,
but can provide an additional lens into classroom practice.
Observation and Individual Growth Teacher evaluation remains an important focus in districts and schools across the state, and we
are excited to see that our evaluators continue to strengthen their skills. For the second year in
a row the department increased the rigor of the evaluator certification test, which is required
for all evaluators to pass prior to conducting observations, and evaluators rose to the occasion.
QualitaGve 50%
Individual Growth (TVAAS) 35%
Achievement 15%
Teachers in Tested Areas
QualitaGve
Individual Growth (TVAAS)
Achievement
QualitaGve 60%
School-‐Wide Growth (TVAAS) 25%
Achievement 15%
Teachers in Non-‐Tested Areas
QualitaGve
School-‐Wide Growth (TVAAS)
Achievement
TEACHER AND ADMINISTRATOR EVALUATION IN TENNESSEE: A REPORT ON YEAR 3 IMPLEMENTATION
13
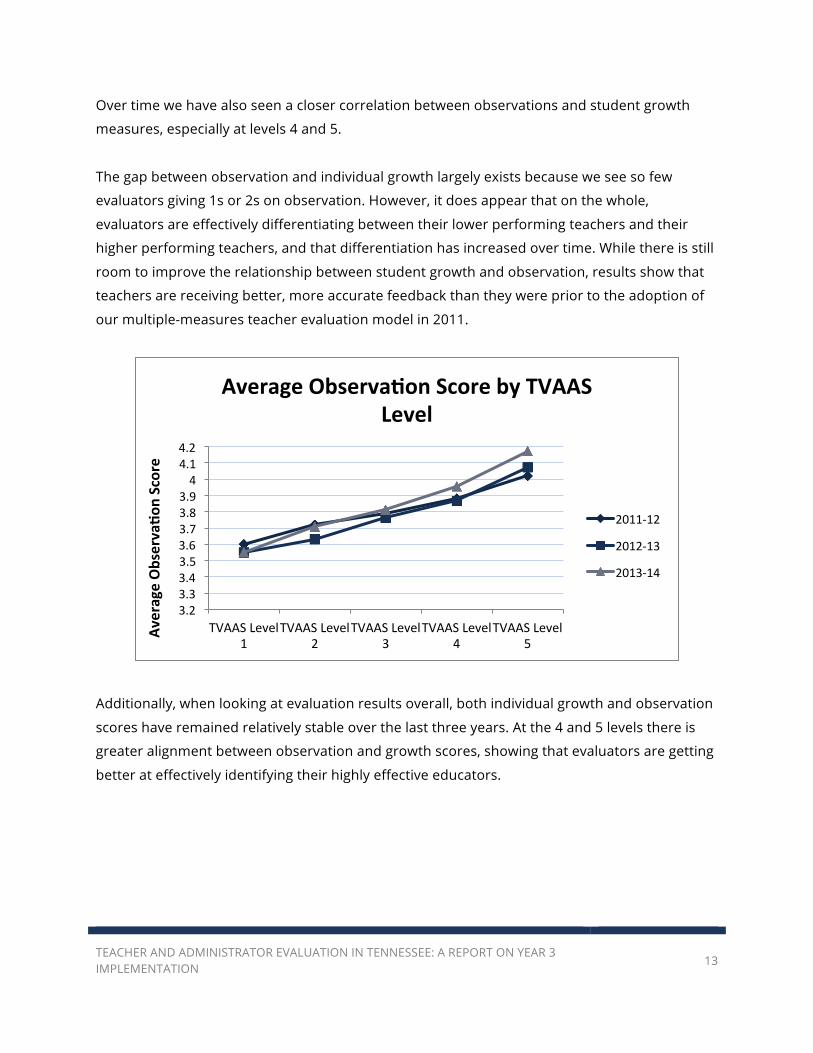
Over time we have also seen a closer correlation between observations and student growth
measures, especially at levels 4 and 5.
The gap between observation and individual growth largely exists because we see so few
evaluators giving 1s or 2s on observation. However, it does appear that on the whole,
evaluators are effectively differentiating between their lower performing teachers and their
higher performing teachers, and that differentiation has increased over time. While there is still
room to improve the relationship between student growth and observation, results show that
teachers are receiving better, more accurate feedback than they were prior to the adoption of
our multiple-measures teacher evaluation model in 2011.
Additionally, when looking at evaluation results overall, both individual growth and observation
scores have remained relatively stable over the last three years. At the 4 and 5 levels there is
greater alignment between observation and growth scores, showing that evaluators are getting
better at effectively identifying their highly effective educators.
3.2 3.3 3.4 3.5 3.6 3.7 3.8 3.9 4
4.1 4.2
TVAAS Level 1
TVAAS Level 2
TVAAS Level 3
TVAAS Level 4
TVAAS Level 5
Average Observa<o
n Score
Average Observa<on Score by TVAAS Level
2011-‐12
2012-‐13
2013-‐14
TEACHER AND ADMINISTRATOR EVALUATION IN TENNESSEE: A REPORT ON YEAR 3 IMPLEMENTATION
14
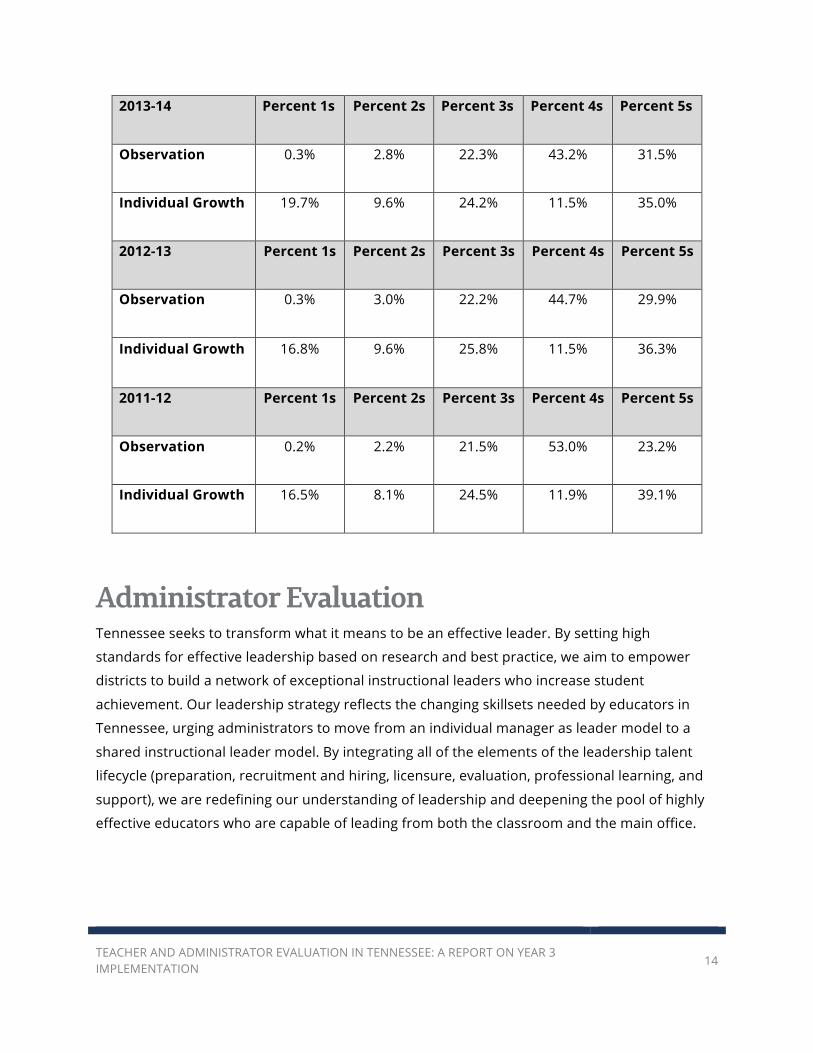
2013-14 Percent 1s Percent 2s Percent 3s Percent 4s Percent 5s
Observation 0.3% 2.8% 22.3% 43.2% 31.5%
Individual Growth 19.7% 9.6% 24.2% 11.5% 35.0%
2012-13 Percent 1s Percent 2s Percent 3s Percent 4s Percent 5s
Observation 0.3% 3.0% 22.2% 44.7% 29.9%
Individual Growth 16.8% 9.6% 25.8% 11.5% 36.3%
2011-12 Percent 1s Percent 2s Percent 3s Percent 4s Percent 5s
Observation 0.2% 2.2% 21.5% 53.0% 23.2%
Individual Growth 16.5% 8.1% 24.5% 11.9% 39.1%
Administrator Evaluation Tennessee seeks to transform what it means to be an effective leader. By setting high
standards for effective leadership based on research and best practice, we aim to empower
districts to build a network of exceptional instructional leaders who increase student
achievement. Our leadership strategy reflects the changing skillsets needed by educators in
Tennessee, urging administrators to move from an individual manager as leader model to a
shared instructional leader model. By integrating all of the elements of the leadership talent
lifecycle (preparation, recruitment and hiring, licensure, evaluation, professional learning, and
support), we are redefining our understanding of leadership and deepening the pool of highly
effective educators who are capable of leading from both the classroom and the main office.
TEACHER AND ADMINISTRATOR EVALUATION IN TENNESSEE: A REPORT ON YEAR 3 IMPLEMENTATION
15
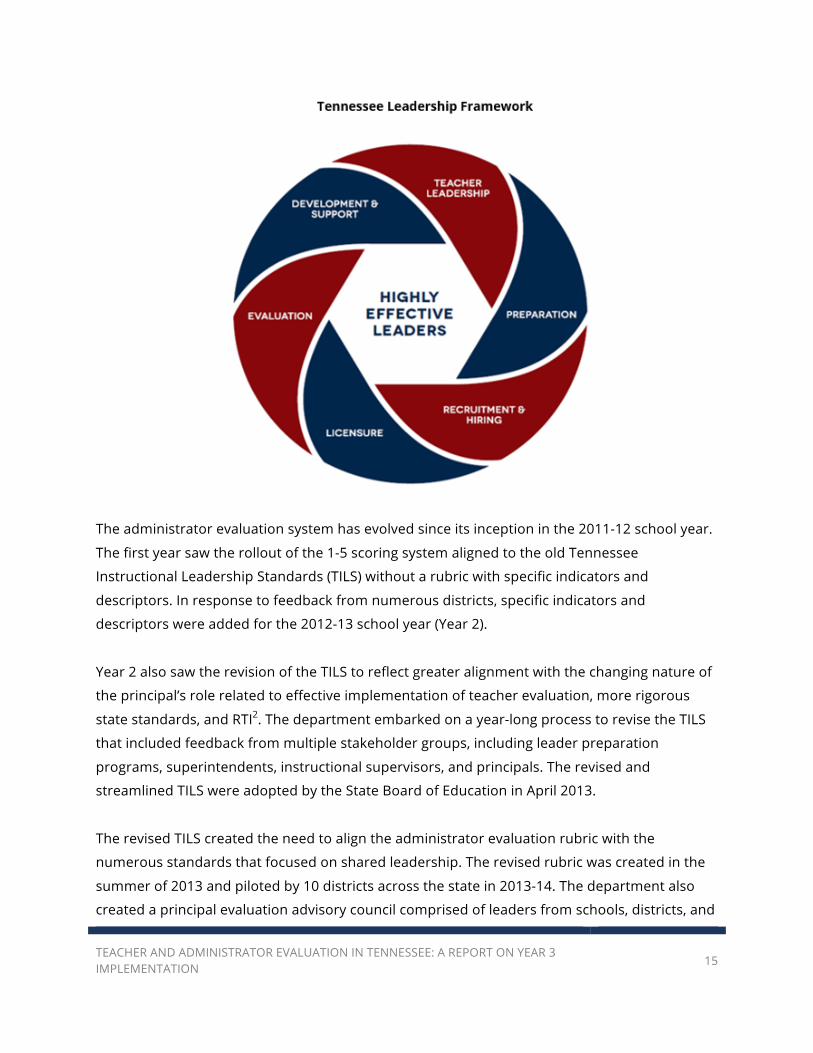
The administrator evaluation system has evolved since its inception in the 2011-12 school year.
The first year saw the rollout of the 1-5 scoring system aligned to the old Tennessee
Instructional Leadership Standards (TILS) without a rubric with specific indicators and
descriptors. In response to feedback from numerous districts, specific indicators and
descriptors were added for the 2012-13 school year (Year 2).
Year 2 also saw the revision of the TILS to reflect greater alignment with the changing nature of
the principal’s role related to effective implementation of teacher evaluation, more rigorous
state standards, and RTI2. The department embarked on a year-long process to revise the TILS
that included feedback from multiple stakeholder groups, including leader preparation
programs, superintendents, instructional supervisors, and principals. The revised and
streamlined TILS were adopted by the State Board of Education in April 2013.
The revised TILS created the need to align the administrator evaluation rubric with the
numerous standards that focused on shared leadership. The revised rubric was created in the
summer of 2013 and piloted by 10 districts across the state in 2013-14. The department also
created a principal evaluation advisory council comprised of leaders from schools, districts, and
TEACHER AND ADMINISTRATOR EVALUATION IN TENNESSEE: A REPORT ON YEAR 3 IMPLEMENTATION
16
leader preparation programs, and in conjunction with the 10 pilot districts, received ongoing
feedback to further develop and strengthen the revised rubric. This invaluable, targeted
feedback focused on the content of the rubric, the evaluation process, and the accompanying
support tools. This feedback informed changes to all three areas for the 2014-15 school year.
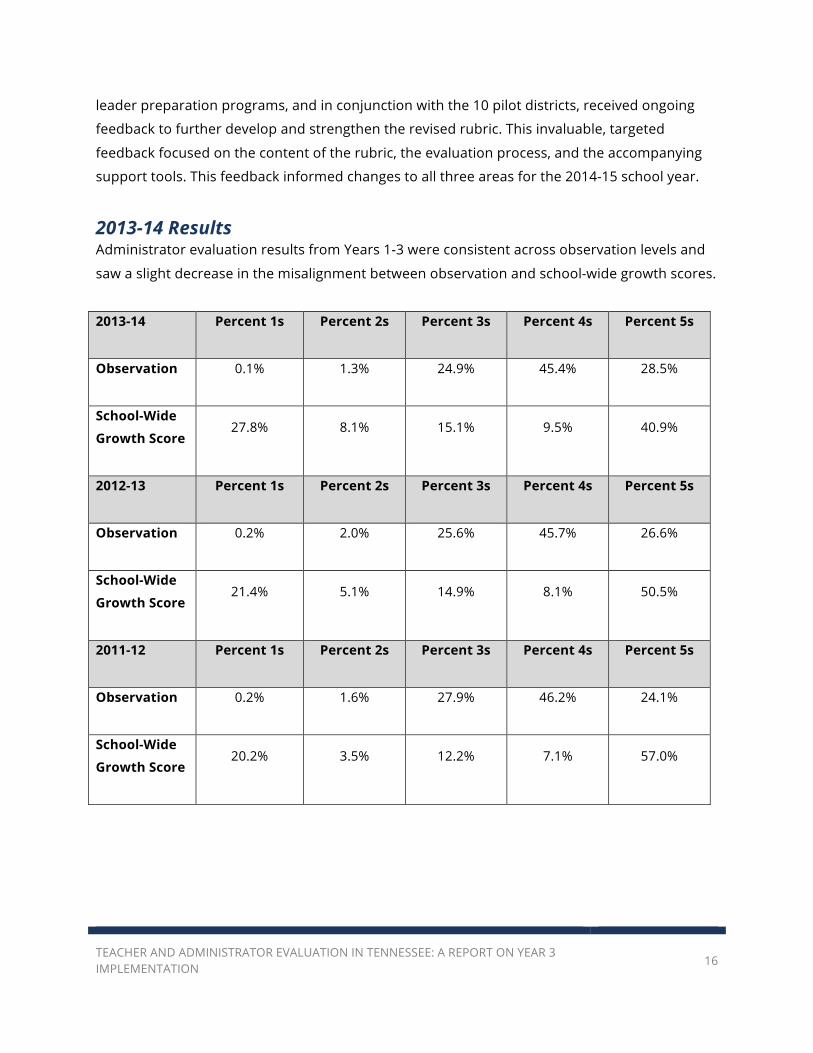
2013-14 Results Administrator evaluation results from Years 1-3 were consistent across observation levels and
saw a slight decrease in the misalignment between observation and school-wide growth scores.
2013-14 Percent 1s Percent 2s Percent 3s Percent 4s Percent 5s
Observation 0.1% 1.3% 24.9% 45.4% 28.5%
School-Wide
Growth Score 27.8% 8.1% 15.1% 9.5% 40.9%
2012-13 Percent 1s Percent 2s Percent 3s Percent 4s Percent 5s
Observation 0.2% 2.0% 25.6% 45.7% 26.6%
School-Wide
Growth Score 21.4% 5.1% 14.9% 8.1% 50.5%
2011-12 Percent 1s Percent 2s Percent 3s Percent 4s Percent 5s
Observation 0.2% 1.6% 27.9% 46.2% 24.1%
School-Wide
Growth Score 20.2% 3.5% 12.2% 7.1% 57.0%
TEACHER AND ADMINISTRATOR EVALUATION IN TENNESSEE: A REPORT ON YEAR 3 IMPLEMENTATION
17
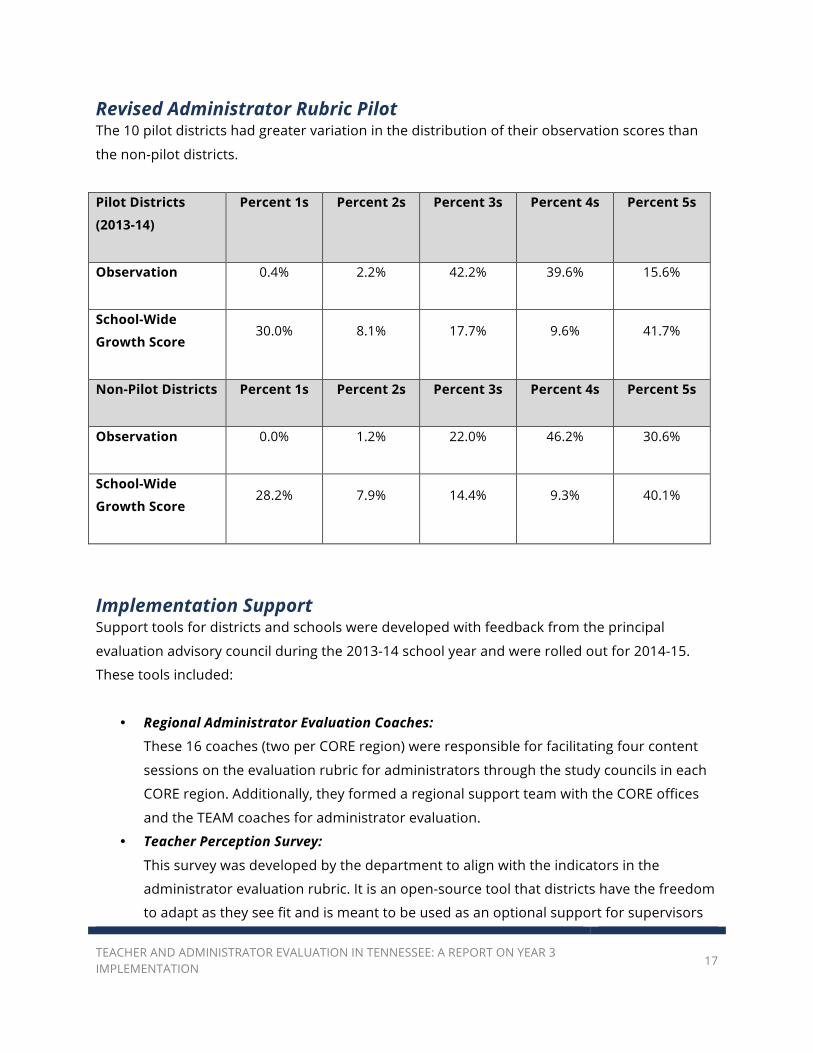
Revised Administrator Rubric Pilot The 10 pilot districts had greater variation in the distribution of their observation scores than
the non-pilot districts.
Pilot Districts
(2013-14)
Percent 1s Percent 2s Percent 3s Percent 4s Percent 5s
Observation 0.4% 2.2% 42.2% 39.6% 15.6%
School-Wide
Growth Score 30.0% 8.1% 17.7% 9.6% 41.7%
Non-Pilot Districts Percent 1s Percent 2s Percent 3s Percent 4s Percent 5s
Observation 0.0% 1.2% 22.0% 46.2% 30.6%
School-Wide
Growth Score 28.2% 7.9% 14.4% 9.3% 40.1%
Implementation Support Support tools for districts and schools were developed with feedback from the principal
evaluation advisory council during the 2013-14 school year and were rolled out for 2014-15.
These tools included:
• Regional Administrator Evaluation Coaches:
These 16 coaches (two per CORE region) were responsible for facilitating four content
sessions on the evaluation rubric for administrators through the study councils in each
CORE region. Additionally, they formed a regional support team with the CORE offices
and the TEAM coaches for administrator evaluation.
• Teacher Perception Survey:
This survey was developed by the department to align with the indicators in the
administrator evaluation rubric. It is an open-source tool that districts have the freedom
to adapt as they see fit and is meant to be used as an optional support for supervisors
TEACHER AND ADMINISTRATOR EVALUATION IN TENNESSEE: A REPORT ON YEAR 3 IMPLEMENTATION
18
when they are scoring. It was used in five districts during the 2013-14 school year and
showed promising results. It differentiated well, and the results were aligned with what
supervisors expected of their school leaders.
• School and District Matching:
For this initiative, highly effective principals were paired with struggling principals to
form learning partnerships. These pairing were made across districts, which created the
opportunity for cross-district sharing in a way we have not seen before.
• Site Visit Tool:
This tool features best practices from districts, including things like:
o Using multiple observers
o Observing an observation and post-conference
o Using an online folder for sharing evidence
It is meant to serve as a resource for observers as they think about how they will
conduct administrator evaluations in their districts.
Non-Tested Grades and Subjects Current Landscape During the 2013-14 school year, approximately 48 percent of teachers with complete data
received an individual growth score, although we estimate that this percentage would be as
high as 70 percent if all districts took advantage of all of the available alternate growth options,
such as portfolios and K-2 assessment. Developing metrics for measuring student growth in
traditionally non-tested grades and subjects remains a priority for the department, and we
continue to engage with interested educators and districts to develop rigorous portfolio models
for State Board of Education consideration.
Currently, three models have been approved by the state board for use in generating individual
growth scores for teachers. These models are Fine Arts, World Languages, and Physical
Education (K-5). Although the models vary based on the unique subject area, they have a
number of commonalities:
• They all require teachers to submit collections of evidence that showcase student work
from two points in time, demonstrating growth in the state standards.
• They are all flexible enough to be applied to a variety of educational settings, including
unique classroom situations, itinerant teachers, diverse student populations, etc.
TEACHER AND ADMINISTRATOR EVALUATION IN TENNESSEE: A REPORT ON YEAR 3 IMPLEMENTATION
19
• They all use the same evidence collection website, called GLADiS, to build online
portfolios. This allows teachers to include a variety of different types of evidence (ex.
video, audio, photo, text), and access their portfolio from anywhere.
• They all use the same principles of scoring, meaning that students are expected to make
at least one level of growth in each collection for a teacher to meet expectations.
• They are all developed and scored by teachers.
Fine Arts The Fine Arts portfolio was developed first by a group of teachers in Memphis City Schools. It
was initially piloted in 2011-12 and received state board approval in the summer of 2012. Three
districts participated in the first year of full implementation, with the number of districts rising
to 12 during the 2013-14 school year.
The Fine Arts portfolio allows teachers in the following areas to generate their own individual
growth score:
• Visual Arts
• General Music
• Vocal Music
• Theatre
• Instrumental Music
• Strings
• Guitar
• Piano
• AP Visual Arts
• Media Arts
• Music Theory
TEACHER AND ADMINISTRATOR EVALUATION IN TENNESSEE: A REPORT ON YEAR 3 IMPLEMENTATION
20
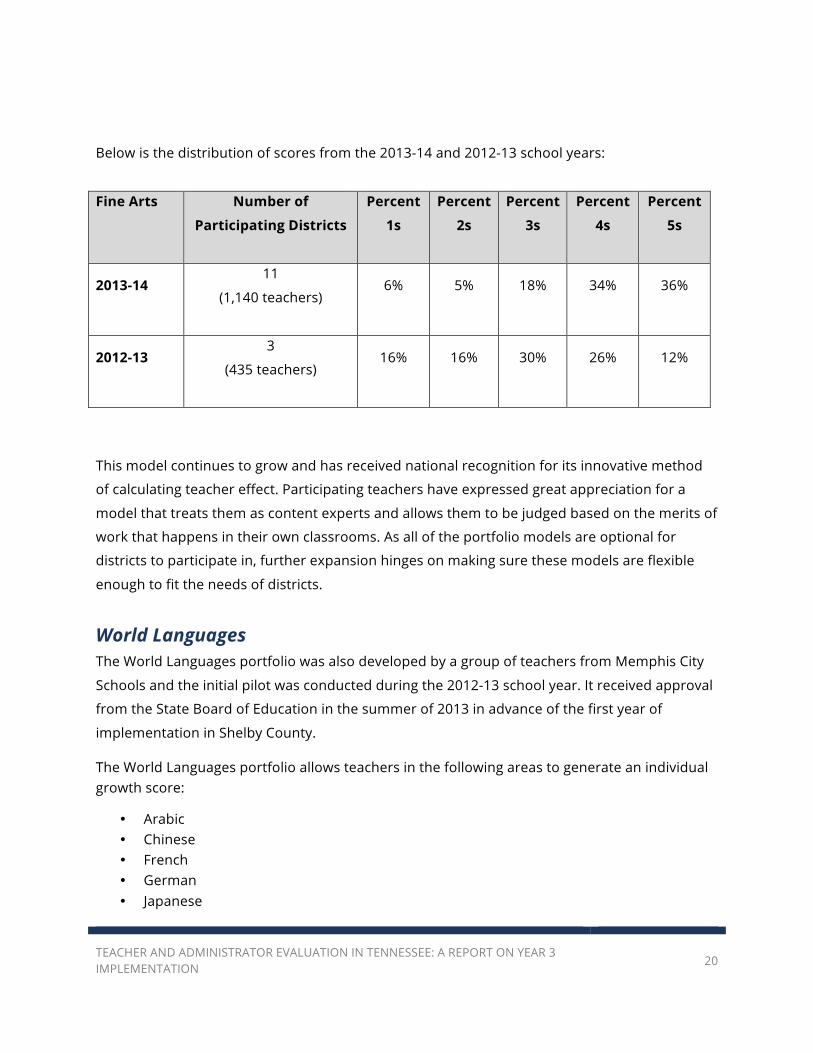
Below is the distribution of scores from the 2013-14 and 2012-13 school years:
Fine Arts Number of
Participating Districts
Percent
1s
Percent
2s
Percent
3s
Percent
4s
Percent
5s
2013-14 11
(1,140 teachers) 6% 5% 18% 34% 36%
2012-13 3
(435 teachers) 16% 16% 30% 26% 12%
This model continues to grow and has received national recognition for its innovative method
of calculating teacher effect. Participating teachers have expressed great appreciation for a
model that treats them as content experts and allows them to be judged based on the merits of
work that happens in their own classrooms. As all of the portfolio models are optional for
districts to participate in, further expansion hinges on making sure these models are flexible
enough to fit the needs of districts.
World Languages The World Languages portfolio was also developed by a group of teachers from Memphis City
Schools and the initial pilot was conducted during the 2012-13 school year. It received approval
from the State Board of Education in the summer of 2013 in advance of the first year of
implementation in Shelby County.
The World Languages portfolio allows teachers in the following areas to generate an individual growth score:
• Arabic • Chinese • French • German • Japanese
TEACHER AND ADMINISTRATOR EVALUATION IN TENNESSEE: A REPORT ON YEAR 3 IMPLEMENTATION
21
• Latin • Russian • Spanish
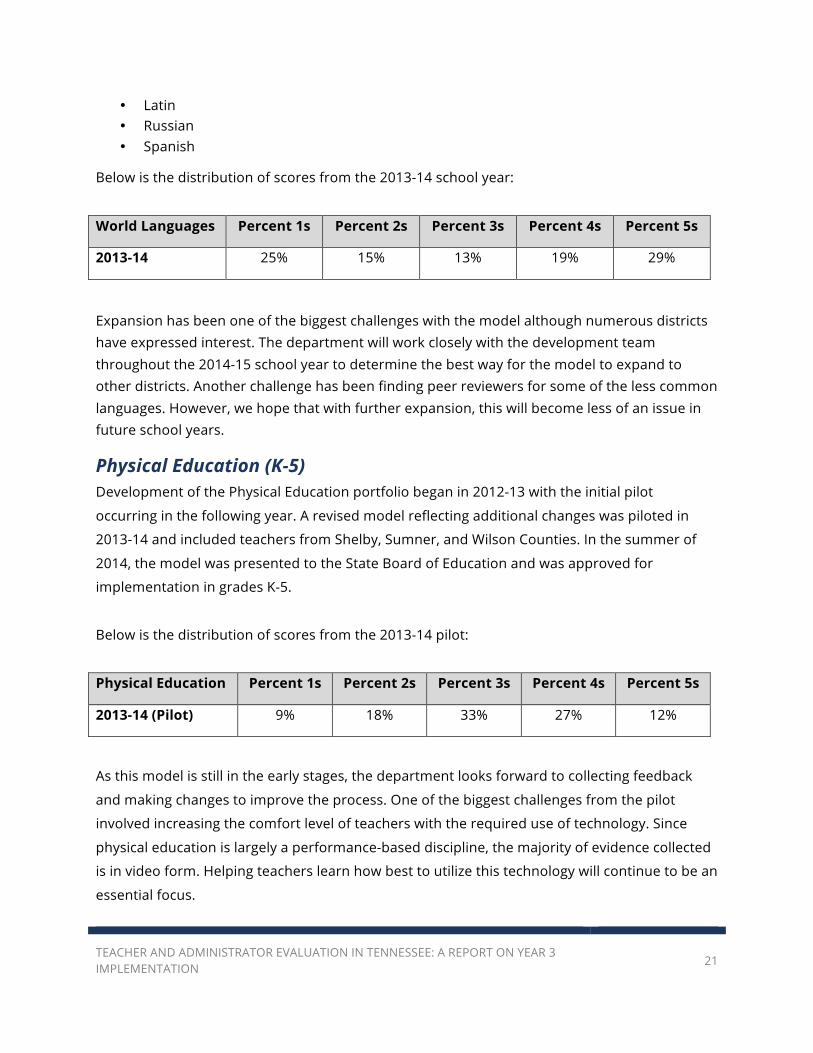
Below is the distribution of scores from the 2013-14 school year:
World Languages Percent 1s Percent 2s Percent 3s Percent 4s Percent 5s
2013-14 25% 15% 13% 19% 29%
Expansion has been one of the biggest challenges with the model although numerous districts have expressed interest. The department will work closely with the development team throughout the 2014-15 school year to determine the best way for the model to expand to other districts. Another challenge has been finding peer reviewers for some of the less common languages. However, we hope that with further expansion, this will become less of an issue in future school years.
Physical Education (K-5) Development of the Physical Education portfolio began in 2012-13 with the initial pilot
occurring in the following year. A revised model reflecting additional changes was piloted in
2013-14 and included teachers from Shelby, Sumner, and Wilson Counties. In the summer of
2014, the model was presented to the State Board of Education and was approved for
implementation in grades K-5.
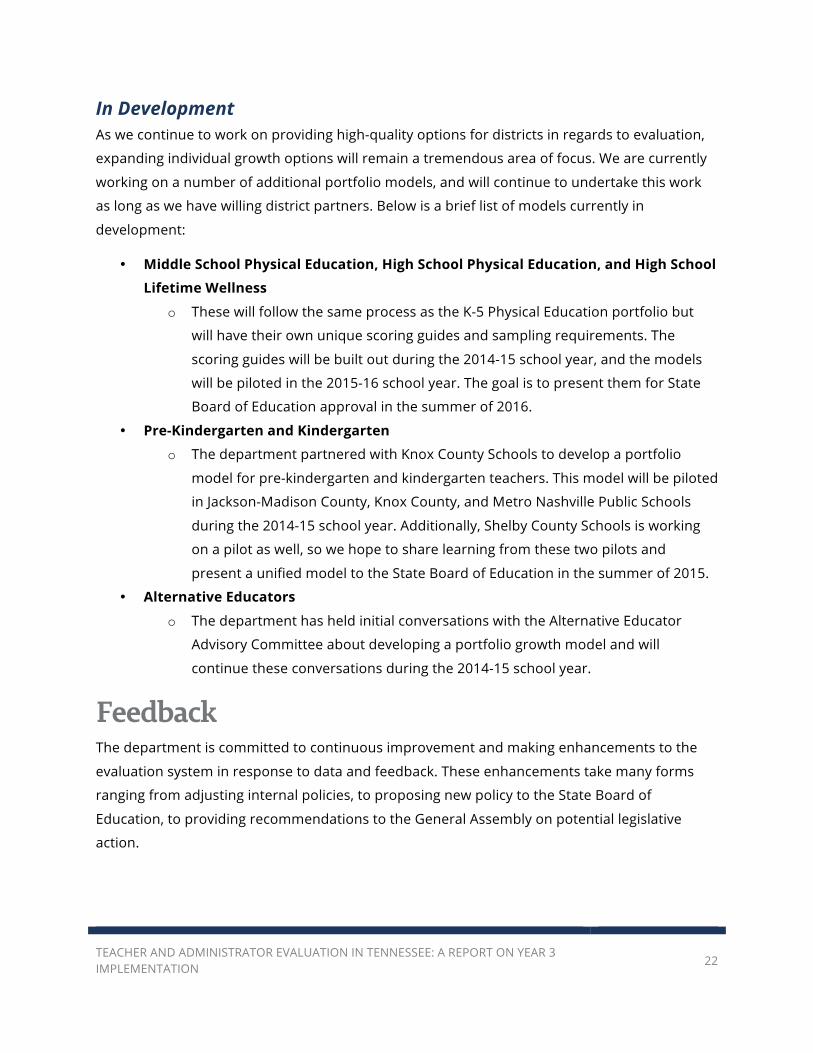
Below is the distribution of scores from the 2013-14 pilot:
Physical Education Percent 1s Percent 2s Percent 3s Percent 4s Percent 5s
2013-14 (Pilot) 9% 18% 33% 27% 12%
As this model is still in the early stages, the department looks forward to collecting feedback
and making changes to improve the process. One of the biggest challenges from the pilot
involved increasing the comfort level of teachers with the required use of technology. Since
physical education is largely a performance-based discipline, the majority of evidence collected
is in video form. Helping teachers learn how best to utilize this technology will continue to be an
essential focus.
TEACHER AND ADMINISTRATOR EVALUATION IN TENNESSEE: A REPORT ON YEAR 3 IMPLEMENTATION
22
In Development As we continue to work on providing high-quality options for districts in regards to evaluation,
expanding individual growth options will remain a tremendous area of focus. We are currently
working on a number of additional portfolio models, and will continue to undertake this work
as long as we have willing district partners. Below is a brief list of models currently in
development:
• Middle School Physical Education, High School Physical Education, and High School
Lifetime Wellness
o These will follow the same process as the K-5 Physical Education portfolio but
will have their own unique scoring guides and sampling requirements. The
scoring guides will be built out during the 2014-15 school year, and the models
will be piloted in the 2015-16 school year. The goal is to present them for State
Board of Education approval in the summer of 2016.
• Pre-Kindergarten and Kindergarten
o The department partnered with Knox County Schools to develop a portfolio
model for pre-kindergarten and kindergarten teachers. This model will be piloted
in Jackson-Madison County, Knox County, and Metro Nashville Public Schools
during the 2014-15 school year. Additionally, Shelby County Schools is working
on a pilot as well, so we hope to share learning from these two pilots and
present a unified model to the State Board of Education in the summer of 2015.
• Alternative Educators
o The department has held initial conversations with the Alternative Educator
Advisory Committee about developing a portfolio growth model and will
continue these conversations during the 2014-15 school year.
Feedback The department is committed to continuous improvement and making enhancements to the
evaluation system in response to data and feedback. These enhancements take many forms
ranging from adjusting internal policies, to proposing new policy to the State Board of
Education, to providing recommendations to the General Assembly on potential legislative
action.
TEACHER AND ADMINISTRATOR EVALUATION IN TENNESSEE: A REPORT ON YEAR 3 IMPLEMENTATION
23
Each year we focus on collecting feedback through a variety of means, including but not limited
to:
• TELL Survey: Over 61,000 teachers responded
• TNCRED Survey: Almost 25,000 teachers responded
• In-person Meetings: More than 100 meetings with over 3,000 educators
• Evaluation Email Address ([email protected]): Answered over 4,000 emails
For the first time during the 2013-14 school year, we also had a teacher serving as our Teacher
Ambassador. This commitment allowed her to engage deeply with teachers across the state on
a variety of evaluation-related issues. Some highlights of her work include:
• Teacher Roundtables: Met with over 300 teachers in 24 districts across the state for
roundtable discussions about education issues
• Teacher Advisory Council: Convened a 12 member teacher council made up of the state
level teachers of the year, representing every region of the state. Council members
provided feedback on improvements to our value-added measurement system, as well
as shared best practices for implementing evaluation in a way that best supports
student growth.
• TVAAS Presentation: Based on feedback gathered from teachers, developed a
presentation on the TVAAS model and tips for putting the data to use to support
student growth. Presented to 2,500 educators. The online version has been viewed over
40,000 times.
Additionally, the evaluation team conducted a statewide feedback tour, stopping in each CORE
region to meet with teachers, school leaders, and district leaders. Throughout this tour, the
department engaged in over 50 hours of conversation with educators. Although the feedback
received was varied, there were a few common themes that were consistently raised, and thus
will remain important as we make decisions moving forward.
The Rubric Educators consistently reference the rubric when discussing evaluation. Almost all feedback
indicated positive feelings toward the rubric, with almost all educators agreeing that it is an
accurate description of the most effective instructional practices. The revisions to the rubric
TEACHER AND ADMINISTRATOR EVALUATION IN TENNESSEE: A REPORT ON YEAR 3 IMPLEMENTATION
24
implemented following the 2012-13 school year were well-received, with educators appreciating
the continued alignment to other statewide initiatives such as RTI2 and more rigorous state
standards. Educators overwhelmingly expressed a desire to maintain the stability of the rubric.
There are some ongoing challenges, specifically when evaluating educators where it is less clear
which rubric is most appropriate, such as school counselors or some interventionists. Most
commonly these challenges arise in scenarios where the educator and evaluator do not have a
consistent understanding of the educator’s role. To help address this issue, we have worked
with a variety of stakeholders to create an observation guidance document to help with the
observation of interventionists. One of these guidance documents already exists for school
counselors.
We heard some concerns about the rubric being used as a checklist, which has been expressly
described as poor practice in trainings and support sessions for the past several years. We are
continuing to address this misunderstanding by providing more support to observers around
this area. Specifically, we will offer a focused training session in our summer 2015 trainings that
dives deep on specific elements of the rubric and explores how they can be evaluated in a
holistic manner.
However, we also heard several districts describe very promising practices. For example, many
districts are having very thoughtful conversations with their teachers at the beginning of the
year to discuss expectations and any areas of the rubric that the teacher may have concerns
about. These proactive conversations on the front end seem to dispel a lot of
misunderstandings throughout the year.
While there is some limited demand for additional rubrics, we are not confident that adding
additional rubrics, and thus increasing the complexity of the process, would help evaluators
more effectively apply the rubric to a variety of classroom situations. Additional guidance
already exists in the form of observation guidance documents, which are revised as needed.
Overall there is overwhelming positive feedback related to the rubric and a clear consensus
that educators would not like to see changes on that front.
TEACHER AND ADMINISTRATOR EVALUATION IN TENNESSEE: A REPORT ON YEAR 3 IMPLEMENTATION
25
Observation Process It is clear that both evaluators and educators are becoming more comfortable with the
observation process. Data indicates that the process is being followed correctly in the vast
majority of cases. There remain some time concerns for evaluators, especially in schools where
there is a high volume of educators who received a level 1 on overall level of effectiveness or on
individual growth. In response to feedback from the first year of implementation, the
observation schedule was adjusted to allow evaluators to spend less time with their high-
performing teachers and more time with their struggling teachers. Although evaluators were
excited about this change, it can present a challenge in schools with a large number of teachers
who require more intensive support.
Time is less of a challenge in schools that describe a strong integration of feedback into daily
practice and positive school culture around continuous improvement. In these schools, the
time challenge tends to be solved largely by including more educators in the feedback process,
such as peer observers, content supervisors, instructional coaches, and district-level evaluators,
a practice that is expressly encouraged through the ‘Capacity Building’ indicator of the
administrator evaluation rubric, which calls for shared leadership.
Spreading best practices from schools that have created a culture around supporting educators
and continuous improvement may alleviate some of the process pressures in schools that
continue to struggle with ensuring the evaluation process is productive. Most feedback related
to the observation process involves concerns about the quality of feedback, and we plan to
offer targeted training on that topic during our summer evaluation trainings.
15 Percent Achievement Measure We continue to hear feedback about the 15 percent achievement measure. Educators
frequently say that it is burdensome to implement effectively, often does not provide useful
information about the performance of a teacher, and that the measures available are not
always aligned with the goals of a teacher or the school and district they work within. District
staff indicated that they struggled to provide the detailed level of guidance requested by
teachers and school leaders while still complying with recent changes in the law that gives final
decision-making authority to teachers.
TEACHER AND ADMINISTRATOR EVALUATION IN TENNESSEE: A REPORT ON YEAR 3 IMPLEMENTATION
26
While there was a general consensus that the 15 percent achievement measure remains a
challenge, there was little consensus about a possible solution. Further engagement will be
needed to identify a long-term solution although there were many ideas presented by
educators including:
• Creating a robust teacher leader/community impact rubric that could be used as an
achievement measure
• Splitting the achievement measure into multiple measures that add up to 15 percent
and allowing districts to modify choices for each 5 percent slice
• Mandating the use of school-wide TVAAS measures for educators who generate
individual growth scores, ensuring that they are working toward the school’s goal as well
as their own
• Developing SMART Goals for teachers on professional growth plans
• Utilizing surveys, including student perception surveys, peer surveys, and parent
surveys, etc.
• Allowing additional targeted observations to be counted
This is an area we will continue to seek feedback on and explore.
Key Changes for 2014-15 15 Percent Achievement Measure Selection During the 2014 legislative session, Chapter 885 of the Public Acts of 2014 was enacted and is in
effect for the 2014-15 school year. This piece of legislation redefines the process around the 15
percent achievement measure selection process.
In previous years, if there was a disagreement on the most appropriate measure for a teacher
to use as their 15 percent achievement measure, the evaluator made the final selection. Moving
forward, the person being evaluated will be able to make the final selection. However,
selections must continue to follow measure selection requirements under State Board of
Education policy.
As in previous years, districts and schools may recommend specific measures and scaling
principles related to achievement measures that are aligned with broader school and district
goals. However, as the final decision is made by the educator, it must be clear that these
recommendations are not mandates. The choices outlined in state board policy are available to
all relevant stakeholders.
TEACHER AND ADMINISTRATOR EVALUATION IN TENNESSEE: A REPORT ON YEAR 3 IMPLEMENTATION
27
Additional Evaluation Coaches During the 2013-14 school year, seven TEAM Coaches, employed by the National Institute for
Excellence in Teaching (NIET), were contracted to work with the department and deployed
through the state’s regional CORE offices to provide support directly to schools. Schools were
identified by examining teachers’ individual growth scores alongside their observation scores.
Schools with a high percentage of teachers who were three or more levels apart on observation
and individual growth were eligible for support. For example, if a large number of teachers in a
school had an individual value-added score of 1 and an observation average of 4 or higher, that
school would have been eligible for state support. In all, 58 schools in 33 districts across the
state were identified.
Once schools are identified, the department works with districts to determine where the
coaches will be the best fit. Each TEAM Coach generally has a roster of 5-15 schools per year
that they work with intensively, although they also provide support as requested to other
schools in their region. Coaches work with observers to improve fidelity of evaluation through a
variety of activities, included, but not limited to:
• Norming
• Conducting co-observations
• Observing evaluators providing feedback
• Modeling effective pre- and post-conference conversations
• Providing support on delivering high-quality actionable feedback
• Providing professional development to teachers on the evaluation process
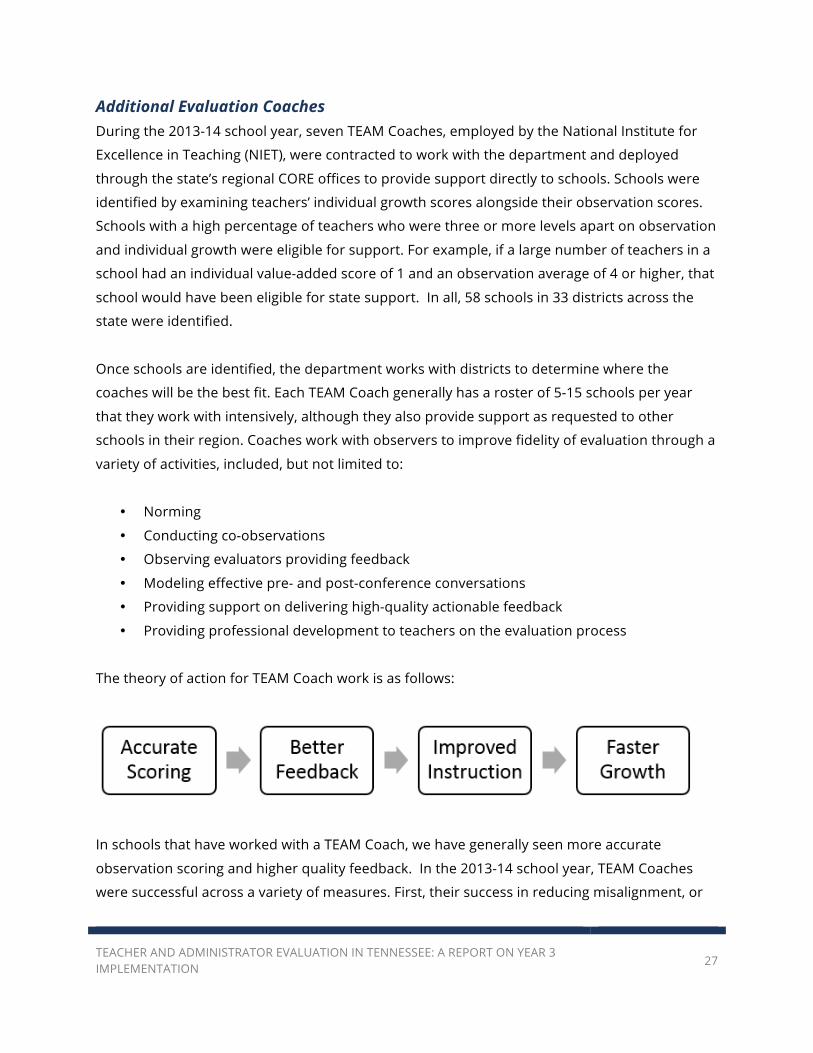
The theory of action for TEAM Coach work is as follows:
In schools that have worked with a TEAM Coach, we have generally seen more accurate
observation scoring and higher quality feedback. In the 2013-14 school year, TEAM Coaches
were successful across a variety of measures. First, their success in reducing misalignment, or
TEACHER AND ADMINISTRATOR EVALUATION IN TENNESSEE: A REPORT ON YEAR 3 IMPLEMENTATION
28
the number of teachers whose observation and individual growth scores were three or more
levels apart, exceeded expectations:
• Nearly 84.5 percent of support schools identified reduced misalignment
• Nearly 77.6 percent of support schools identified reduced misalignment by more than
10 percentage points
• 10 support schools dropped from double digit misalignment to 0 percent misalignment
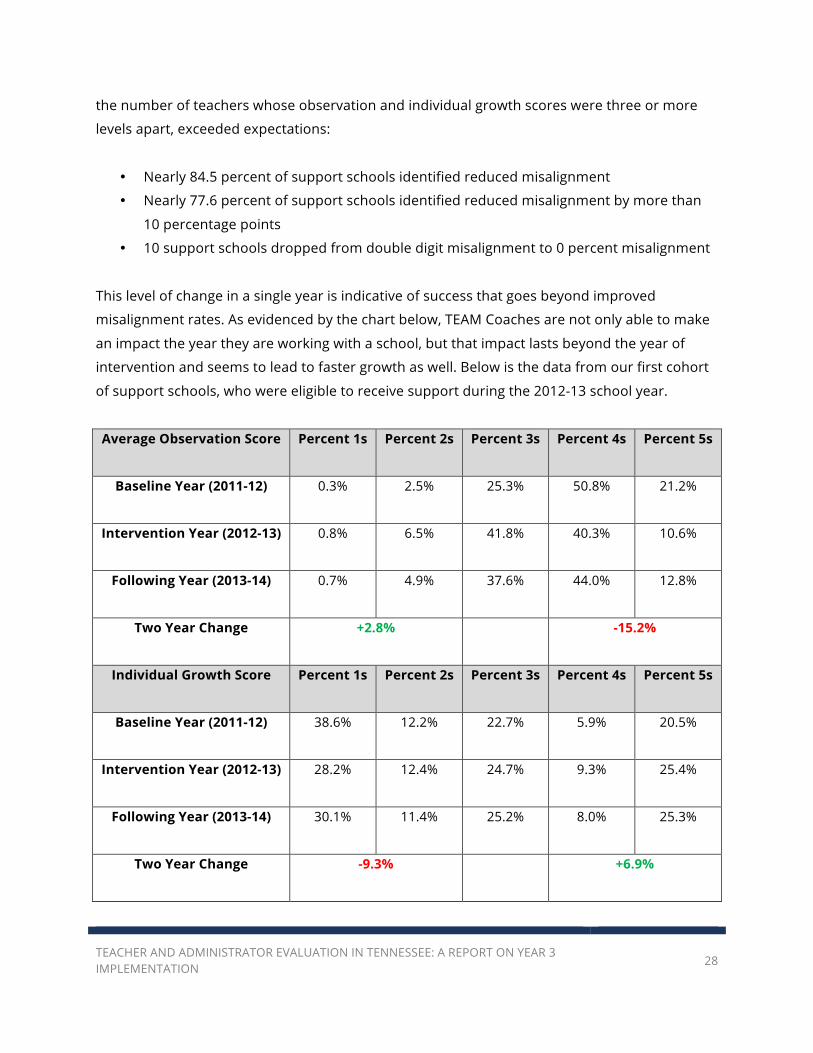
This level of change in a single year is indicative of success that goes beyond improved
misalignment rates. As evidenced by the chart below, TEAM Coaches are not only able to make
an impact the year they are working with a school, but that impact lasts beyond the year of
intervention and seems to lead to faster growth as well. Below is the data from our first cohort
of support schools, who were eligible to receive support during the 2012-13 school year.
Average Observation Score Percent 1s Percent 2s Percent 3s Percent 4s Percent 5s
Baseline Year (2011-12) 0.3% 2.5% 25.3% 50.8% 21.2%
Intervention Year (2012-13) 0.8% 6.5% 41.8% 40.3% 10.6%
Following Year (2013-14) 0.7% 4.9% 37.6% 44.0% 12.8%
Two Year Change +2.8% -15.2%
Individual Growth Score Percent 1s Percent 2s Percent 3s Percent 4s Percent 5s
Baseline Year (2011-12) 38.6% 12.2% 22.7% 5.9% 20.5%
Intervention Year (2012-13) 28.2% 12.4% 24.7% 9.3% 25.4%
Following Year (2013-14) 30.1% 11.4% 25.2% 8.0% 25.3%
Two Year Change -9.3% +6.9%

TEACHER AND ADMINISTRATOR EVALUATION IN TENNESSEE: A REPORT ON YEAR 3 IMPLEMENTATION
29
Most notable, however, was the ability of TEAM Coaches to form positive relationships with
their roster of schools. There was some initial wariness about accepting support from someone
from outside the district, but by the close of the school year, many school leaders were actively
seeking ways to maintain contact with their coaches.
The success of the TEAM Coaches shows that targeted, intensive support at the school level can
change practice, and change it quickly. For the 2014-15 school year, the number of coaches has
increased, and their work is focused on both specific schools that need additional support, as
well as district and regional efforts to strengthen and sustain high-quality implementation.
Increased Coverage for Non-Tested Grades and Subjects As mentioned previously, continuing to expand coverage for teachers in non-tested grades and
subjects will remain a department priority throughout the 2014-15 school year. We have seen
potential coverage expand each year with the introduction of new portfolio growth models,
tailored school-wide measures, and additional assessment options.
We have already outlined the growth of our portfolio models, but it is important to note that if
every district took advantage of these options, we would greatly decrease the number of
teachers relying on a school-wide or system-wide measure of growth. Additionally, we worked
closely with the division of College and Career Readiness (formerly Career and Technical
Education) to create a tailored school-wide measure that allows teachers to only include the
growth of students who have earned three or more credits in a CTE program of study or
program area. Lastly, districts still have the option to administer the K-2 assessment, which can
generate growth scores for teachers in grades 1 through 3.
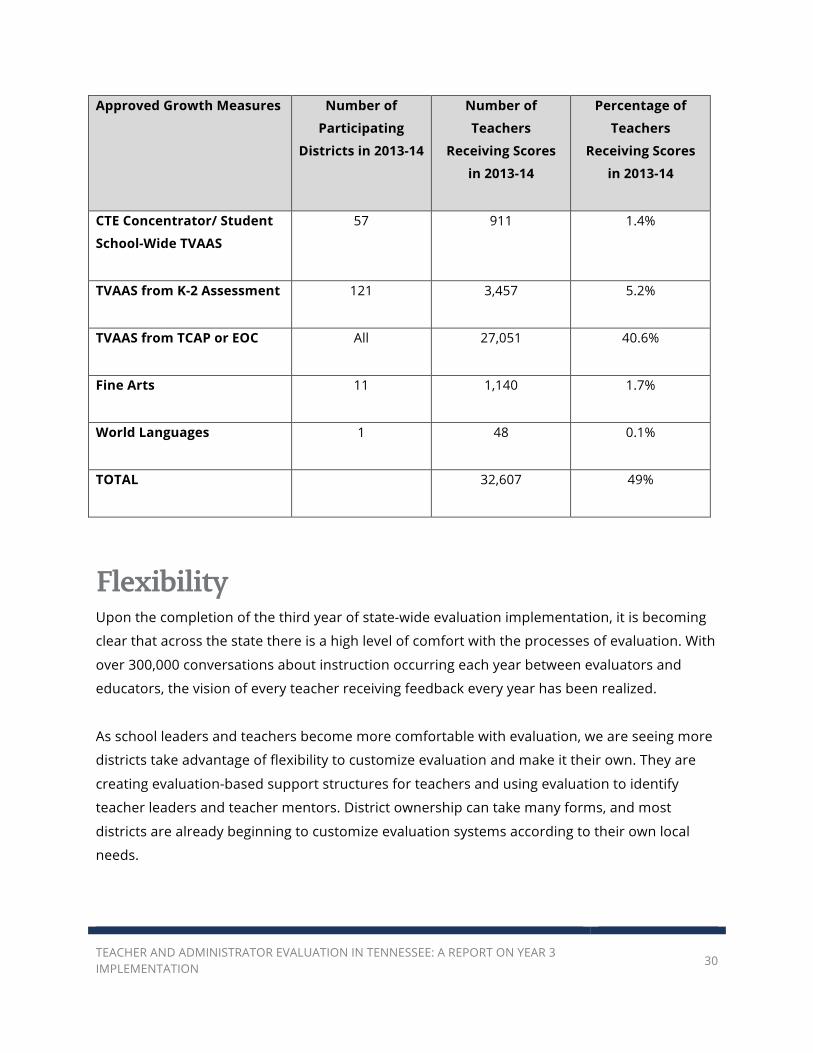
Although it is unlikely that every single teacher will receive an individual growth score, our goal
is to continue increasing this coverage each year. Individual growth measures allow districts,
schools, and teachers to better identify how teachers are performing in every subject area, so
that they can receive the support and recognition they need.
TEACHER AND ADMINISTRATOR EVALUATION IN TENNESSEE: A REPORT ON YEAR 3 IMPLEMENTATION
30
Approved Growth Measures Number of
Participating
Districts in 2013-14
Number of
Teachers
Receiving Scores
in 2013-14
Percentage of
Teachers
Receiving Scores
in 2013-14
CTE Concentrator/ Student
School-Wide TVAAS
57 911 1.4%
TVAAS from K-2 Assessment 121 3,457 5.2%
TVAAS from TCAP or EOC All 27,051 40.6%
Fine Arts 11 1,140 1.7%
World Languages 1 48 0.1%
TOTAL 32,607 49%
Flexibility Upon the completion of the third year of state-wide evaluation implementation, it is becoming
clear that across the state there is a high level of comfort with the processes of evaluation. With
over 300,000 conversations about instruction occurring each year between evaluators and
educators, the vision of every teacher receiving feedback every year has been realized.
As school leaders and teachers become more comfortable with evaluation, we are seeing more
districts take advantage of flexibility to customize evaluation and make it their own. They are
creating evaluation-based support structures for teachers and using evaluation to identify
teacher leaders and teacher mentors. District ownership can take many forms, and most
districts are already beginning to customize evaluation systems according to their own local
needs.
TEACHER AND ADMINISTRATOR EVALUATION IN TENNESSEE: A REPORT ON YEAR 3 IMPLEMENTATION
31
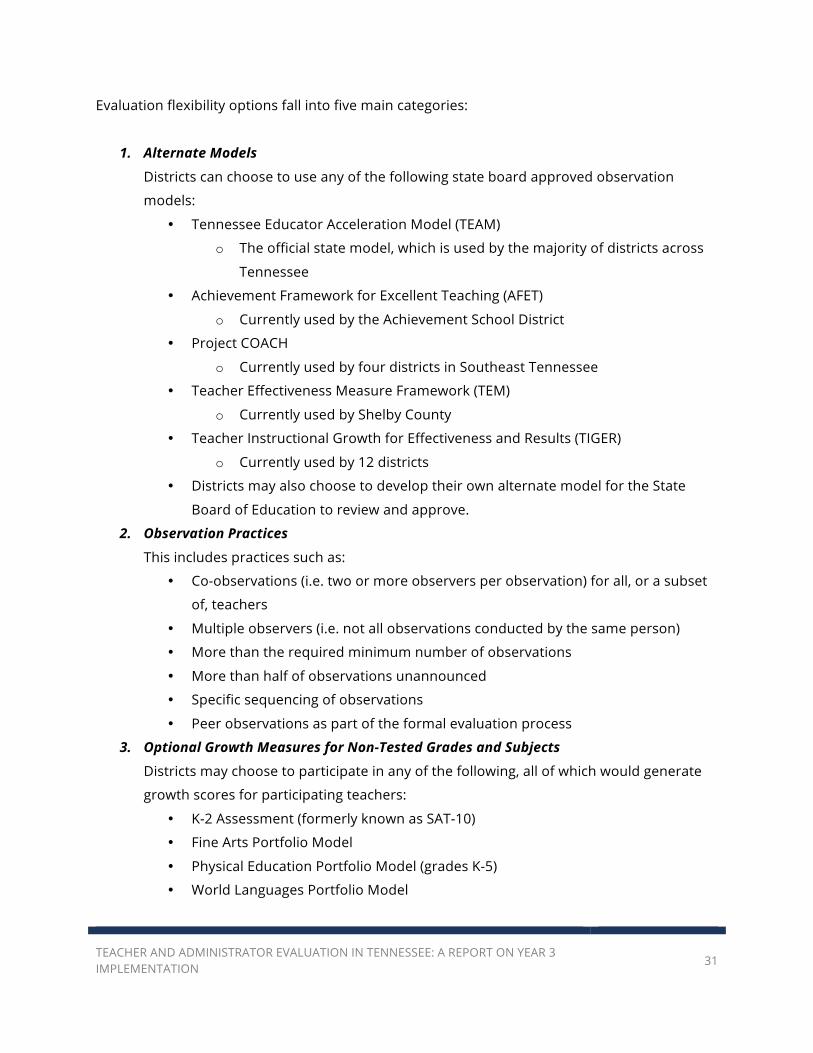
Evaluation flexibility options fall into five main categories:
1. Alternate Models
Districts can choose to use any of the following state board approved observation
models:
• Tennessee Educator Acceleration Model (TEAM)
o The official state model, which is used by the majority of districts across
Tennessee
• Achievement Framework for Excellent Teaching (AFET)
o Currently used by the Achievement School District
• Project COACH
o Currently used by four districts in Southeast Tennessee
• Teacher Effectiveness Measure Framework (TEM)
o Currently used by Shelby County
• Teacher Instructional Growth for Effectiveness and Results (TIGER)
o Currently used by 12 districts
• Districts may also choose to develop their own alternate model for the State
Board of Education to review and approve.
2. Observation Practices
This includes practices such as:
• Co-observations (i.e. two or more observers per observation) for all, or a subset
of, teachers
• Multiple observers (i.e. not all observations conducted by the same person)
• More than the required minimum number of observations
• More than half of observations unannounced
• Specific sequencing of observations
• Peer observations as part of the formal evaluation process
3. Optional Growth Measures for Non-Tested Grades and Subjects
Districts may choose to participate in any of the following, all of which would generate
growth scores for participating teachers:
• K-2 Assessment (formerly known as SAT-10)
• Fine Arts Portfolio Model
• Physical Education Portfolio Model (grades K-5)
• World Languages Portfolio Model
TEACHER AND ADMINISTRATOR EVALUATION IN TENNESSEE: A REPORT ON YEAR 3 IMPLEMENTATION
32
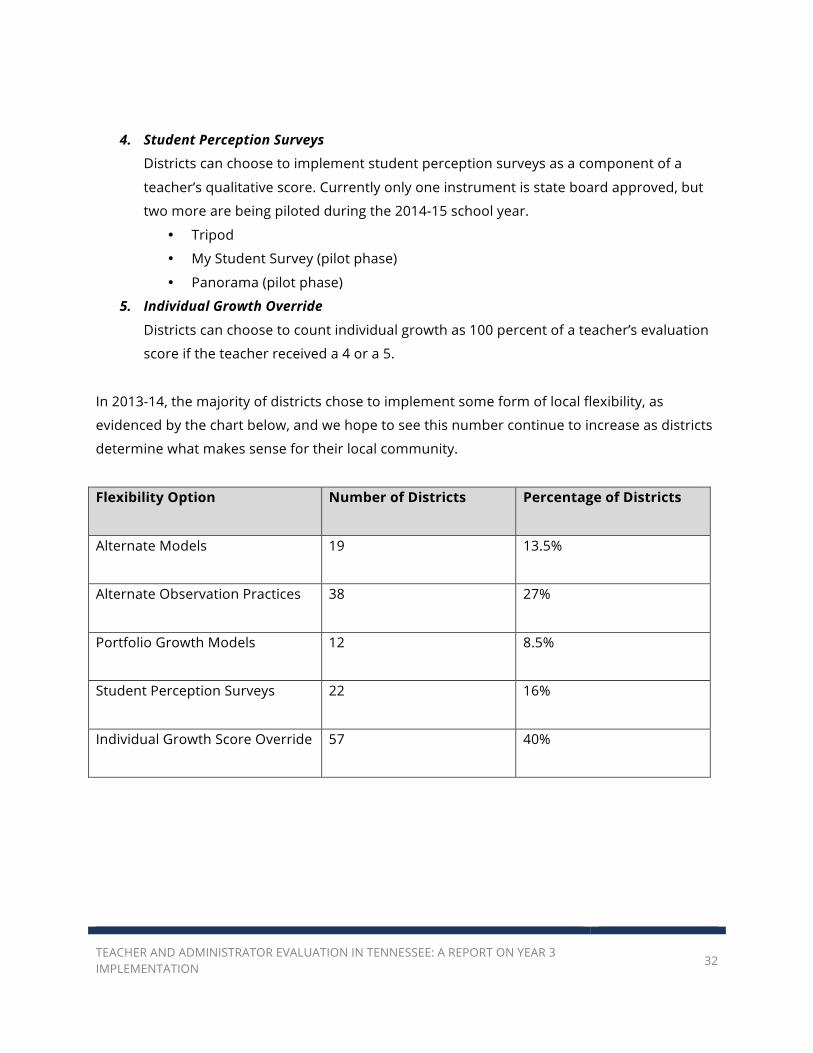
4. Student Perception Surveys
Districts can choose to implement student perception surveys as a component of a
teacher’s qualitative score. Currently only one instrument is state board approved, but
two more are being piloted during the 2014-15 school year.
• Tripod
• My Student Survey (pilot phase)
• Panorama (pilot phase)
5. Individual Growth Override
Districts can choose to count individual growth as 100 percent of a teacher’s evaluation
score if the teacher received a 4 or a 5.
In 2013-14, the majority of districts chose to implement some form of local flexibility, as
evidenced by the chart below, and we hope to see this number continue to increase as districts
determine what makes sense for their local community.
Flexibility Option Number of Districts Percentage of Districts
Alternate Models 19 13.5%
Alternate Observation Practices 38 27%
Portfolio Growth Models 12 8.5%
Student Perception Surveys 22 16%
Individual Growth Score Override 57 40%
TEACHER AND ADMINISTRATOR EVALUATION IN TENNESSEE: A REPORT ON YEAR 3 IMPLEMENTATION
33
The role of the department is multi-fold in building the ownership at the district level and
ensuring districts are taking full advantage of the choices that exist. Our responsibilities include:
• Lowering barriers to transition to an alternate model
One of the largest barriers to transitioning to a new observation system, especially
for smaller districts, is the cost of a new data system and the capacity to train and
monitor evaluators. As the state prepares to transition to a new, more
comprehensive data system, we are hopeful that it will allow for more flexibility in
data entry, allowing it to be used for models aside from TEAM. Additionally, the state
has begun experimenting with the TIGER districts in co-facilitating evaluator training
as TIGER transitions to use the TEAM rubric. This type of partnership shows promise
in helping other districts transition to the model that is the best fit for their needs.
• Increasing knowledge about each State Board of Education approved alternate
model
The department must assume a larger role in facilitating transparent dialogue
between districts interested in adopting new observation systems. This can take the
form of more comprehensive information about alternative observation systems
online or more facilitated conversations with districts currently using an alternate
model.
• Increasing transparency about the flexibility that exists within policy
There are many ways districts can introduce flexibility into their local evaluation
plans without adopting an alternative observation model. For districts wishing to
exercise more flexibility, the department will engage in deeper, more substantive
conversations about their options earlier in the school year in an effort to allow for
better planning and less uncertainty as districts enter the summer months.
• Monitoring results and sharing learning across the state
As flexibility increases and more districts adopt alternative observation models, the
department will need to adopt a larger role in monitoring evaluation outcomes and
flagging potential areas of concern. This is especially true for alternative models that
are currently administered by districts that have neither the capacity nor the
authority to engage in this type of data monitoring but do have a large interest in
preserving the integrity of the systems they created.
TEACHER AND ADMINISTRATOR EVALUATION IN TENNESSEE: A REPORT ON YEAR 3 IMPLEMENTATION
34
Looking Forward Student Surveys During the 2013-14 school year, significantly more districts used student surveys as part of the
formal evaluation system. In total, 19 districts, representing nearly a quarter of teachers in
Tennessee, used student surveys to comprise five percent of the qualitative component of
teachers’ evaluation scores. Three additional districts used student perception surveys for
formative purposes. Student perception data is especially powerful for teacher development
and growth. The feedback comes from students, is aligned to observation feedback, is
predictive of student growth, and is based on specific questions that can be tied to specific
teacher actions.
For the 2014-15 school year, there are only four districts using student perception surveys as a
formal part of the evaluation process. This is a sharp decline from the previous year, and we
have gathered a lot of feedback to determine why this may have happened. Although most
districts found the results very promising, we heard the following concerns:
• Rostering for administration was burdensome and complex
• Mid-year results were not returned soon enough for teachers to take action on the
feedback
• The surveys were too long
• Some questions did not seem appropriate
• Administering without state funding would be too expensive for districts to absorb
In response to this feedback, we are working with additional vendors to try to address some of
these concerns. Two of our largest districts are working with new vendors, My Student Survey
and Panorama, on a pilot for the 2014-15 school year. We believe that introducing new vendors
into the marketplace will yield more affordable options that are easier to implement, more
flexible, and allow for a quicker turnaround on results. While we have experienced some
challenges thus far, we are committed to exploring this avenue as an additional optional
component of our multiple measures evaluation system.
TEACHER AND ADMINISTRATOR EVALUATION IN TENNESSEE: A REPORT ON YEAR 3 IMPLEMENTATION
35
New Data System The Tennessee Department of Education went through a Request for Proposals (RFP) process
to find a vendor for a new data system that will encompass both evaluation and licensure data
and provide enhanced reporting features. This data previously existed in two separate systems.
The new system should provide a number of advantages for educators, including, but not
limited to:
• A single access point for educators
• Better tracking of the number of required observations for each teacher
• Enhanced reporting features
• A more streamlined process for license advancement and renewal
As we work with our vendor to build out this new system, we plan to convene a technical
advisory committee to provide feedback on various elements of the system. Our goal is to
have the new system up and running by July 2015, in time to roll over evaluation data for
the 2015-16 school year. Our focus throughout this transition will be on transparent
communication and training for educators and evaluators on how to take advantage of the
new system.
Increased Connections Throughout 2014-15, we will continue to focus on increasing connections across the
department. We expect to see this manifested in a number of ways, including:
• Licensure and evaluation data combined in a new system
• Increased reporting on teacher and administrator evaluation data related to hiring,
retention, recognition, and placement decision-making
• Additional partnerships with researchers interested in studying and evaluating the
progress occurring in Tennessee
By purposefully connecting evaluation, licensure, state standards, and RTI2, our goal is to
empower districts, schools, and educators to make informed decisions using high-quality data
to increase educator effectiveness.
TEACHER AND ADMINISTRATOR EVALUATION IN TENNESSEE: A REPORT ON YEAR 3 IMPLEMENTATION
36
Conclusion Tennessee is in the midst of a continuous improvement journey with an evaluation system that
is designed to ensure quality, timely feedback to teachers and leaders, provide summative
evaluations of their performance in a way that is fair, drive the development of instruction and
leadership, and improve student outcomes. We began this journey because our previous
evaluation system was too generic and failed to provide actionable feedback. Teachers were
evaluated twice every 10 years, they generally received the highest rating in the system, and
student performance did not play a role in the scoring or targeting of development. Now three
years into our evaluation system, we see clear indications that the system itself is improving
rapidly through the dedicated work of educators across the state. Most importantly, we see
significant signs that students are learning more, and that Tennessee is making progress to
move itself into the top half of national performance and provide the education that our
students and their families expect and deserve.