Embed Size (px)
Citation preview
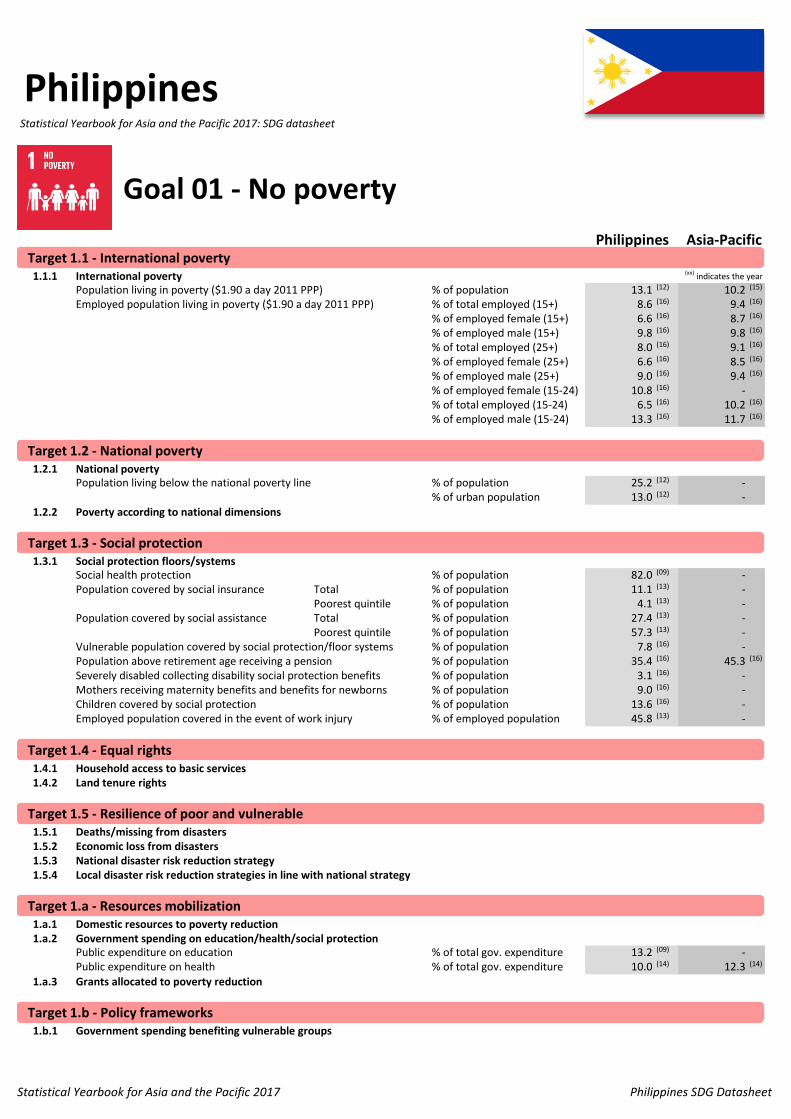
Philippines
1.1.1 International povertyPopulation living in poverty ($1.90 a day 2011 PPP) % of population 13.1 (12) 10.2 (15)
Employed population living in poverty ($1.90 a day 2011 PPP) % of total employed (15+) 8.6 (16) 9.4 (16)
% of employed female (15+) 6.6 (16) 8.7 (16)
% of employed male (15+) 9.8 (16) 9.8 (16)
% of total employed (25+) 8.0 (16) 9.1 (16)
% of employed female (25+) 6.6 (16) 8.5 (16)
% of employed male (25+) 9.0 (16) 9.4 (16)
% of employed female (15-24) 10.8 (16) -% of total employed (15-24) 6.5 (16) 10.2 (16)
% of employed male (15-24) 13.3 (16) 11.7 (16)
1.2.1 National povertyPopulation living below the national poverty line % of population 25.2 (12) -
% of urban population 13.0 (12) -
1.2.2 Poverty according to national dimensions
1.3.1 Social protection floors/systemsSocial health protection % of population 82.0 (09) -Population covered by social insurance Total % of population 11.1 (13) -
Poorest quintile % of population 4.1 (13) -Population covered by social assistance Total % of population 27.4 (13) -
Poorest quintile % of population 57.3 (13) -Vulnerable population covered by social protection/floor systems % of population 7.8 (16) -Population above retirement age receiving a pension % of population 35.4 (16) 45.3 (16)
Severely disabled collecting disability social protection benefits % of population 3.1 (16) -Mothers receiving maternity benefits and benefits for newborns % of population 9.0 (16) -Children covered by social protection % of population 13.6 (16) -Employed population covered in the event of work injury % of employed population 45.8 (13) -
1.4.1 Household access to basic services1.4.2 Land tenure rights
1.5.1 Deaths/missing from disasters1.5.2 Economic loss from disasters1.5.3 National disaster risk reduction strategy1.5.4 Local disaster risk reduction strategies in line with national strategy
1.a.1 Domestic resources to poverty reduction1.a.2 Government spending on education/health/social protection
Public expenditure on education % of total gov. expenditure 13.2 (09) -Public expenditure on health % of total gov. expenditure 10.0 (14) 12.3 (14)
1.a.3 Grants allocated to poverty reduction
1.b.1 Government spending benefiting vulnerable groups
Target 1.3 - Social protection
Target 1.4 - Equal rights
Target 1.5 - Resilience of poor and vulnerable
Target 1.a - Resources mobilization
Target 1.b - Policy frameworks
Statistical Yearbook for Asia and the Pacific 2017: SDG datasheet
Goal 01 - No poverty
Philippines Asia-PacificTarget 1.1 - International poverty
Target 1.2 - National poverty
(xx) indicates the year
Target 1.1 - International poverty
Target 1.2 - National poverty
Target 1.3 - Social protection
Target 1.4 - Equal rights
Target 1.5 - Resilience of poor and vulnerable
Target 1.a - Resources mobilization
Target 1.b - Policy frameworks
Statistical Yearbook for Asia and the Pacific 2017 Philippines SDG Datasheet
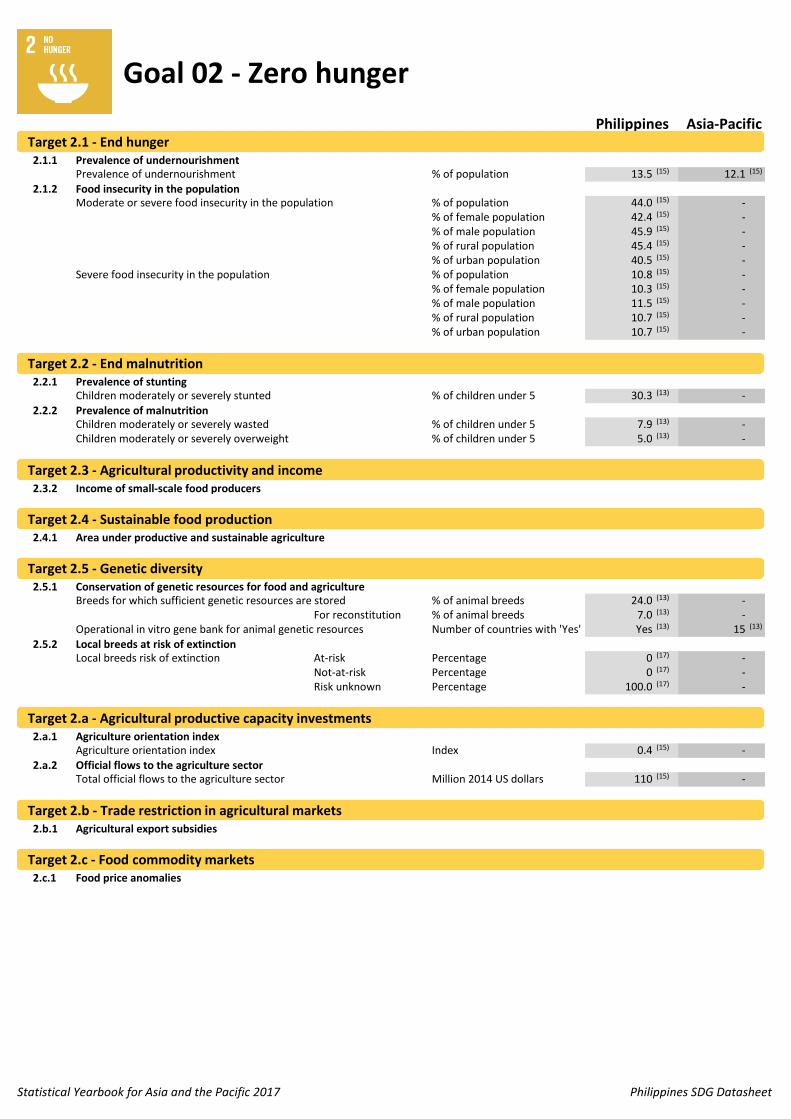
2.1.1 Prevalence of undernourishmentPrevalence of undernourishment % of population 13.5 (15) 12.1 (15)
2.1.2 Food insecurity in the populationModerate or severe food insecurity in the population % of population 44.0 (15) -
% of female population 42.4 (15) -% of male population 45.9 (15) -% of rural population 45.4 (15) -% of urban population 40.5 (15) -
Severe food insecurity in the population % of population 10.8 (15) -% of female population 10.3 (15) -% of male population 11.5 (15) -% of rural population 10.7 (15) -% of urban population 10.7 (15) -
2.2.1 Prevalence of stuntingChildren moderately or severely stunted % of children under 5 30.3 (13) -
2.2.2 Prevalence of malnutritionChildren moderately or severely wasted % of children under 5 7.9 (13) -Children moderately or severely overweight % of children under 5 5.0 (13) -
2.3.2 Income of small-scale food producers
2.4.1 Area under productive and sustainable agriculture
2.5.1 Conservation of genetic resources for food and agricultureBreeds for which sufficient genetic resources are stored % of animal breeds 24.0 (13) -
For reconstitution % of animal breeds 7.0 (13) -Operational in vitro gene bank for animal genetic resources Number of countries with 'Yes' Yes (13) 15 (13)
2.5.2 Local breeds at risk of extinctionLocal breeds risk of extinction At-risk Percentage 0 (17) -
Not-at-risk Percentage 0 (17) -Risk unknown Percentage 100.0 (17) -
2.a.1 Agriculture orientation indexAgriculture orientation index Index 0.4 (15) -
2.a.2 Official flows to the agriculture sectorTotal official flows to the agriculture sector Million 2014 US dollars 110 (15) -
2.b.1 Agricultural export subsidies
2.c.1 Food price anomalies
Target 2.5 - Genetic diversity
Target 2.a - Agricultural productive capacity investments
Target 2.b - Trade restriction in agricultural markets
Target 2.c - Food commodity markets
Target 2.2 - End malnutrition
Target 2.3 - Agricultural productivity and income
Target 2.4 - Sustainable food production
Goal 02 - Zero hunger
Philippines Asia-PacificTarget 2.1 - End hungerTarget 2.1 - End hunger
Target 2.2 - End malnutrition
Target 2.3 - Agricultural productivity and income
Target 2.4 - Sustainable food production
Target 2.5 - Genetic diversity
Target 2.a - Agricultural productive capacity investments
Target 2.b - Trade restriction in agricultural markets
Target 2.c - Food commodity markets
Statistical Yearbook for Asia and the Pacific 2017 Philippines SDG Datasheet
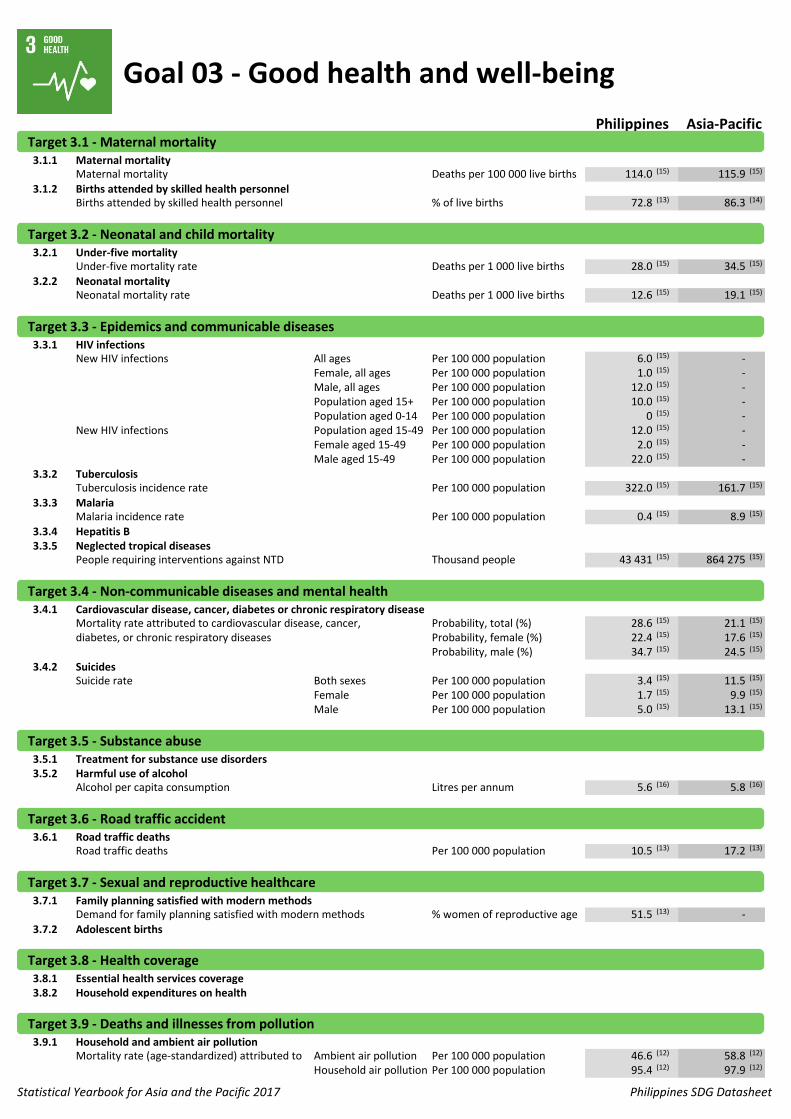
3.1.1 Maternal mortalityMaternal mortality Deaths per 100 000 live births 114.0 (15) 115.9 (15)
3.1.2 Births attended by skilled health personnelBirths attended by skilled health personnel % of live births 72.8 (13) 86.3 (14)
3.2.1 Under-five mortalityUnder-five mortality rate Deaths per 1 000 live births 28.0 (15) 34.5 (15)
3.2.2 Neonatal mortalityNeonatal mortality rate Deaths per 1 000 live births 12.6 (15) 19.1 (15)
3.3.1 HIV infectionsNew HIV infections All ages Per 100 000 population 6.0 (15) -
Female, all ages Per 100 000 population 1.0 (15) -Male, all ages Per 100 000 population 12.0 (15) -Population aged 15+ Per 100 000 population 10.0 (15) -Population aged 0-14 Per 100 000 population 0 (15) -
New HIV infections Population aged 15-49 Per 100 000 population 12.0 (15) -Female aged 15-49 Per 100 000 population 2.0 (15) -Male aged 15-49 Per 100 000 population 22.0 (15) -
3.3.2 TuberculosisTuberculosis incidence rate Per 100 000 population 322.0 (15) 161.7 (15)
3.3.3 MalariaMalaria incidence rate Per 100 000 population 0.4 (15) 8.9 (15)
3.3.4 Hepatitis B3.3.5 Neglected tropical diseases
People requiring interventions against NTD Thousand people 43 431 (15) 864 275 (15)
3.4.1 Cardiovascular disease, cancer, diabetes or chronic respiratory diseaseMortality rate attributed to cardiovascular disease, cancer, Probability, total (%) 28.6 (15) 21.1 (15)
diabetes, or chronic respiratory diseases Probability, female (%) 22.4 (15) 17.6 (15)
Probability, male (%) 34.7 (15) 24.5 (15)
3.4.2 SuicidesSuicide rate Both sexes Per 100 000 population 3.4 (15) 11.5 (15)
Female Per 100 000 population 1.7 (15) 9.9 (15)
Male Per 100 000 population 5.0 (15) 13.1 (15)
3.5.1 Treatment for substance use disorders3.5.2 Harmful use of alcohol
Alcohol per capita consumption Litres per annum 5.6 (16) 5.8 (16)
3.6.1 Road traffic deathsRoad traffic deaths Per 100 000 population 10.5 (13) 17.2 (13)
3.7.1 Family planning satisfied with modern methodsDemand for family planning satisfied with modern methods % women of reproductive age 51.5 (13) -
3.7.2 Adolescent births
3.8.1 Essential health services coverage3.8.2 Household expenditures on health
3.9.1 Household and ambient air pollutionMortality rate (age-standardized) attributed to Ambient air pollution Per 100 000 population 46.6 (12) 58.8 (12)
Household air pollution Per 100 000 population 95.4 (12) 97.9 (12)
Target 3.7 - Sexual and reproductive healthcare
Target 3.8 - Health coverage
Target 3.9 - Deaths and illnesses from pollution
Target 3.1 - Maternal mortality
Target 3.2 - Neonatal and child mortality
Target 3.3 - Epidemics and communicable diseases
Target 3.4 - Non-communicable diseases and mental health
Target 3.5 - Substance abuse
Target 3.6 - Road traffic accident
Goal 03 - Good health and well-being
Philippines Asia-PacificTarget 3.1 - Maternal mortality
Target 3.2 - Neonatal and child mortality
Target 3.3 - Epidemics and communicable diseases
Target 3.4 - Non-communicable diseases and mental health
Target 3.5 - Substance abuse
Target 3.6 - Road traffic accident
Target 3.7 - Sexual and reproductive healthcare
Target 3.8 - Health coverage
Target 3.9 - Deaths and illnesses from pollution
Statistical Yearbook for Asia and the Pacific 2017 Philippines SDG Datasheet
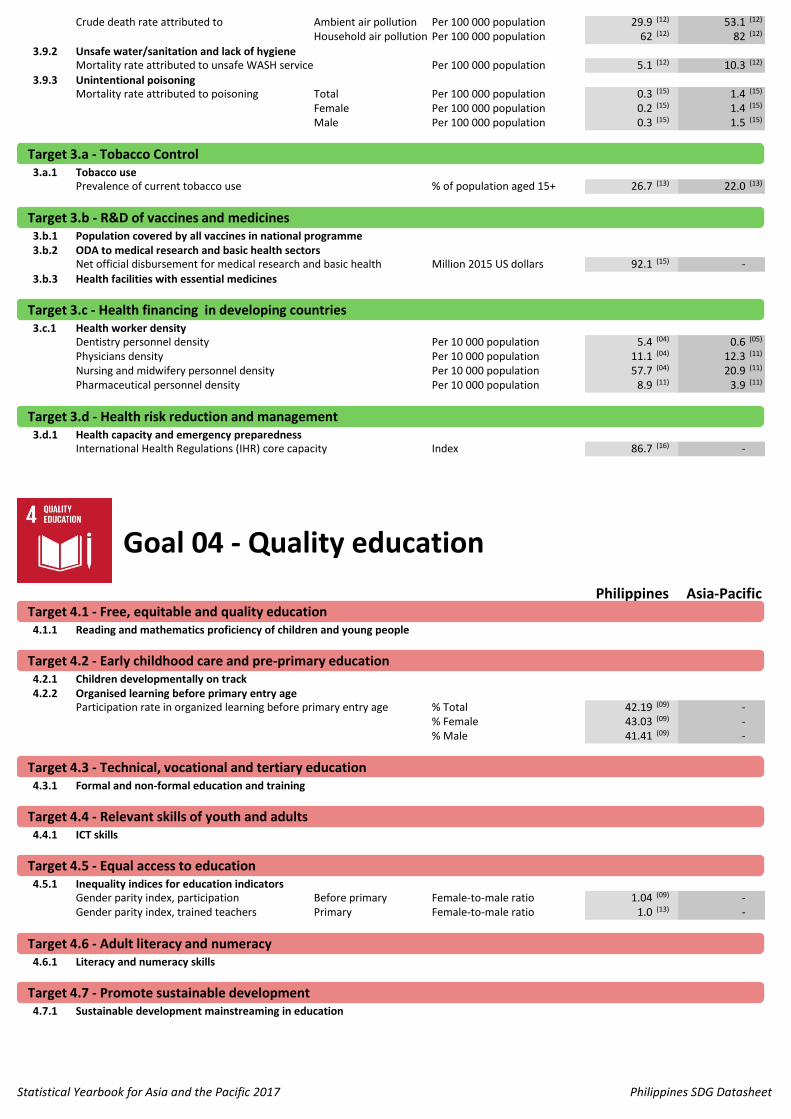
Crude death rate attributed to Ambient air pollution Per 100 000 population 29.9 (12) 53.1 (12)
Household air pollution Per 100 000 population 62 (12) 82 (12)
3.9.2 Unsafe water/sanitation and lack of hygieneMortality rate attributed to unsafe WASH service Per 100 000 population 5.1 (12) 10.3 (12)
3.9.3 Unintentional poisoningMortality rate attributed to poisoning Total Per 100 000 population 0.3 (15) 1.4 (15)
Female Per 100 000 population 0.2 (15) 1.4 (15)
Male Per 100 000 population 0.3 (15) 1.5 (15)
3.a.1 Tobacco usePrevalence of current tobacco use % of population aged 15+ 26.7 (13) 22.0 (13)
3.b.1 Population covered by all vaccines in national programme3.b.2 ODA to medical research and basic health sectors
Net official disbursement for medical research and basic health Million 2015 US dollars 92.1 (15) -
3.b.3 Health facilities with essential medicines
3.c.1 Health worker densityDentistry personnel density Per 10 000 population 5.4 (04) 0.6 (05)
Physicians density Per 10 000 population 11.1 (04) 12.3 (11)
Nursing and midwifery personnel density Per 10 000 population 57.7 (04) 20.9 (11)
Pharmaceutical personnel density Per 10 000 population 8.9 (11) 3.9 (11)
3.d.1 Health capacity and emergency preparednessInternational Health Regulations (IHR) core capacity Index 86.7 (16) -
4.1.1 Reading and mathematics proficiency of children and young people
4.2.1 Children developmentally on track4.2.2 Organised learning before primary entry age
Participation rate in organized learning before primary entry age % Total 42.19 (09) -% Female 43.03 (09) -% Male 41.41 (09) -
4.3.1 Formal and non-formal education and training
4.4.1 ICT skills
4.5.1 Inequality indices for education indicatorsGender parity index, participation Before primary Female-to-male ratio 1.04 (09) -Gender parity index, trained teachers Primary Female-to-male ratio 1.0 (13) -
4.6.1 Literacy and numeracy skills
4.7.1 Sustainable development mainstreaming in education
Target 4.3 - Technical, vocational and tertiary education
Target 4.4 - Relevant skills of youth and adults
Target 4.5 - Equal access to education
Target 4.6 - Adult literacy and numeracy
Target 4.7 - Promote sustainable development
Target 3.d - Health risk reduction and management
Goal 04 - Quality education
Philippines Asia-PacificTarget 4.1 - Free, equitable and quality education
Target 4.2 - Early childhood care and pre-primary education
Target 3.a - Tobacco Control
Target 3.b - R&D of vaccines and medicines
Target 3.c - Health financing in developing countries
Target 3.a - Tobacco Control
Target 3.b - R&D of vaccines and medicines
Target 3.c - Health financing in developing countries
Target 3.d - Health risk reduction and management
Target 4.1 - Free, equitable and quality education
Target 4.2 - Early childhood care and pre-primary education
Target 4.3 - Technical, vocational and tertiary education
Target 4.4 - Relevant skills of youth and adults
Target 4.5 - Equal access to education
Target 4.6 - Adult literacy and numeracy
Target 4.7 - Promote sustainable development
Statistical Yearbook for Asia and the Pacific 2017 Philippines SDG Datasheet
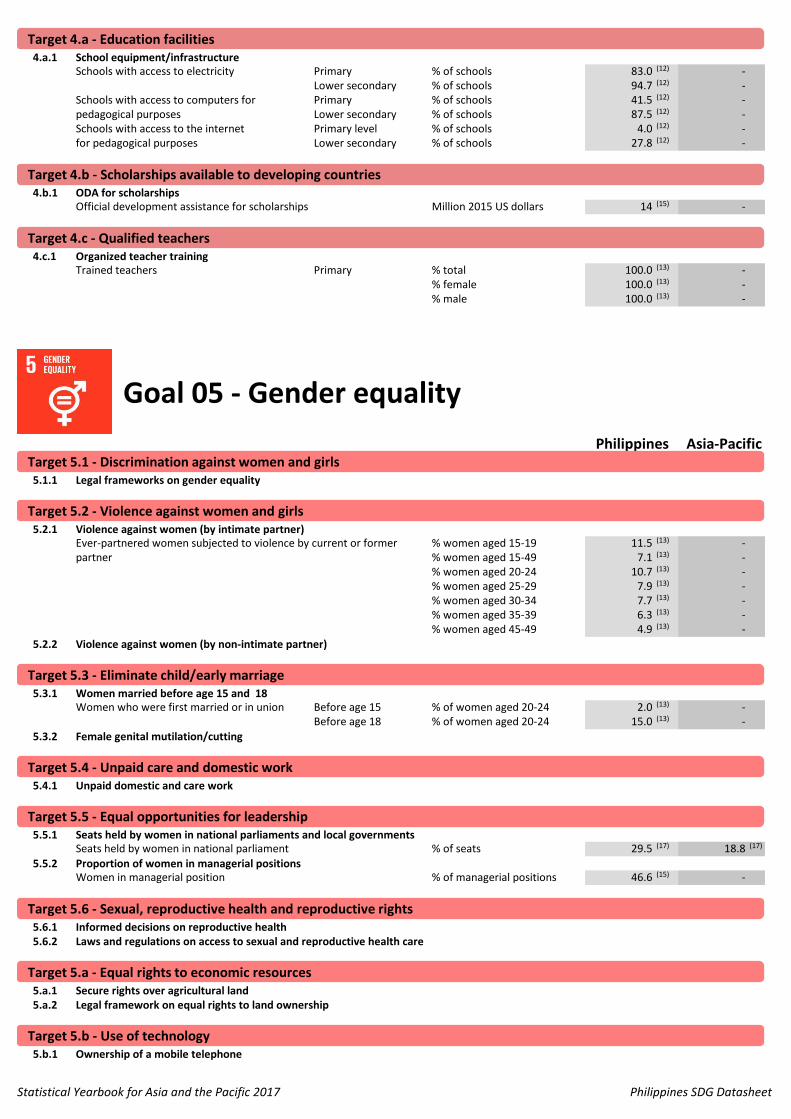
4.a.1 School equipment/infrastructureSchools with access to electricity Primary % of schools 83.0 (12) -
Lower secondary % of schools 94.7 (12) -Schools with access to computers for Primary % of schools 41.5 (12) -pedagogical purposes Lower secondary % of schools 87.5 (12) -Schools with access to the internet Primary level % of schools 4.0 (12) -for pedagogical purposes Lower secondary % of schools 27.8 (12) -
4.b.1 ODA for scholarshipsOfficial development assistance for scholarships Million 2015 US dollars 14 (15) -
4.c.1 Organized teacher trainingTrained teachers Primary % total 100.0 (13) -
% female 100.0 (13) -% male 100.0 (13) -
5.1.1 Legal frameworks on gender equality
5.2.1 Violence against women (by intimate partner)Ever-partnered women subjected to violence by current or former % women aged 15-19 11.5 (13) -partner % women aged 15-49 7.1 (13) -
% women aged 20-24 10.7 (13) -% women aged 25-29 7.9 (13) -% women aged 30-34 7.7 (13) -% women aged 35-39 6.3 (13) -% women aged 45-49 4.9 (13) -
5.2.2 Violence against women (by non-intimate partner)
5.3.1 Women married before age 15 and 18Women who were first married or in union Before age 15 % of women aged 20-24 2.0 (13) -
Before age 18 % of women aged 20-24 15.0 (13) -
5.3.2 Female genital mutilation/cutting
5.4.1 Unpaid domestic and care work
5.5.1 Seats held by women in national parliaments and local governmentsSeats held by women in national parliament % of seats 29.5 (17) 18.8 (17)
5.5.2 Proportion of women in managerial positionsWomen in managerial position % of managerial positions 46.6 (15) -
5.6.1 Informed decisions on reproductive health5.6.2 Laws and regulations on access to sexual and reproductive health care
5.a.1 Secure rights over agricultural land5.a.2 Legal framework on equal rights to land ownership
5.b.1 Ownership of a mobile telephone
Target 5.b - Use of technology
Target 5.2 - Violence against women and girls
Target 5.3 - Eliminate child/early marriage
Target 5.4 - Unpaid care and domestic work
Target 5.5 - Equal opportunities for leadership
Target 5.6 - Sexual, reproductive health and reproductive rights
Target 5.a - Equal rights to economic resources
Target 4.b - Scholarships available to developing countries
Target 4.c - Qualified teachers
Goal 05 - Gender equality
Philippines Asia-PacificTarget 5.1 - Discrimination against women and girls
Target 4.a - Education facilitiesTarget 4.a - Education facilities
Target 4.b - Scholarships available to developing countries
Target 4.c - Qualified teachers
Target 5.1 - Discrimination against women and girls
Target 5.2 - Violence against women and girls
Target 5.3 - Eliminate child/early marriage
Target 5.4 - Unpaid care and domestic work
Target 5.5 - Equal opportunities for leadership
Target 5.6 - Sexual, reproductive health and reproductive rights
Target 5.a - Equal rights to economic resources
Target 5.b - Use of technology
Statistical Yearbook for Asia and the Pacific 2017 Philippines SDG Datasheet
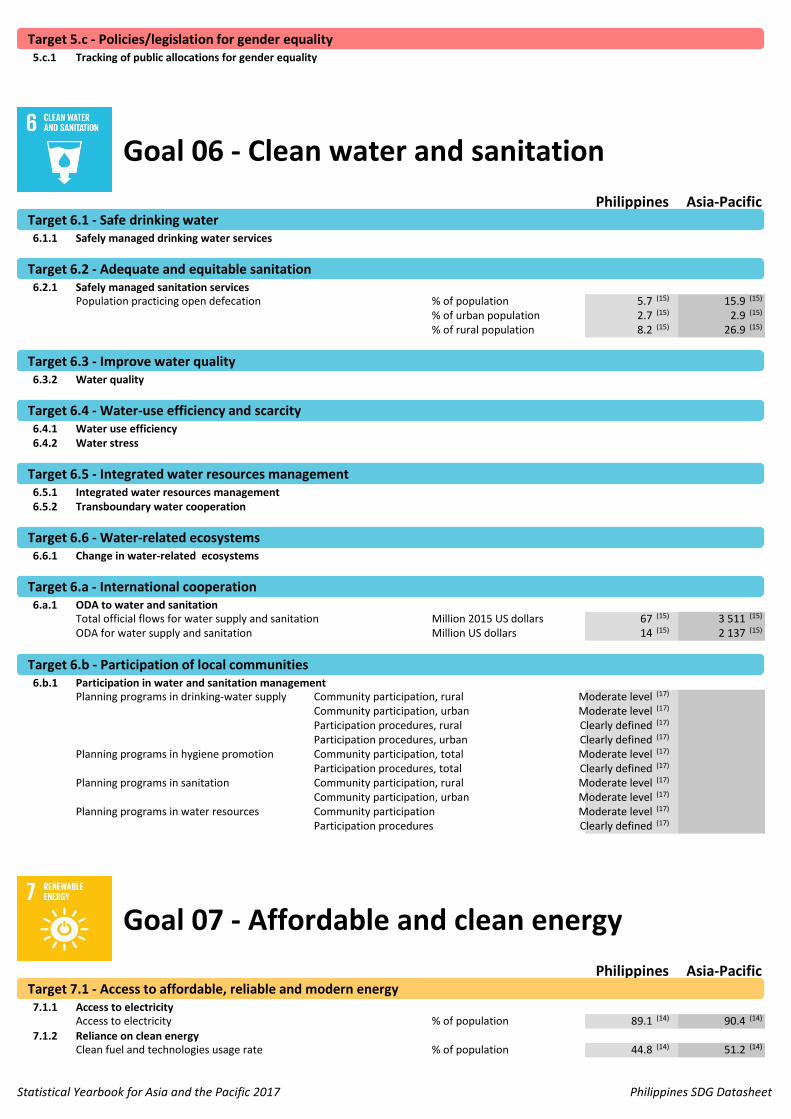
5.c.1 Tracking of public allocations for gender equality
6.1.1 Safely managed drinking water services
6.2.1 Safely managed sanitation servicesPopulation practicing open defecation % of population 5.7 (15) 15.9 (15)
% of urban population 2.7 (15) 2.9 (15)
% of rural population 8.2 (15) 26.9 (15)
6.3.2 Water quality
6.4.1 Water use efficiency6.4.2 Water stress
6.5.1 Integrated water resources management6.5.2 Transboundary water cooperation
6.6.1 Change in water-related ecosystems
6.a.1 ODA to water and sanitationTotal official flows for water supply and sanitation Million 2015 US dollars 67 (15) 3 511 (15)
ODA for water supply and sanitation Million US dollars 14 (15) 2 137 (15)
6.b.1 Participation in water and sanitation managementPlanning programs in drinking-water supply Community participation, rural Moderate level (17)
Community participation, urban Moderate level (17)
Participation procedures, rural Clearly defined (17)
Participation procedures, urban Clearly defined (17)
Planning programs in hygiene promotion Community participation, total Moderate level (17)
Participation procedures, total Clearly defined (17)
Planning programs in sanitation Community participation, rural Moderate level (17)
Community participation, urban Moderate level (17)
Planning programs in water resources Community participation Moderate level (17)
Participation procedures Clearly defined (17)
7.1.1 Access to electricityAccess to electricity % of population 89.1 (14) 90.4 (14)
7.1.2 Reliance on clean energyClean fuel and technologies usage rate % of population 44.8 (14) 51.2 (14)
Target 6.b - Participation of local communities
Goal 07 - Affordable and clean energy
Philippines Asia-PacificTarget 7.1 - Access to affordable, reliable and modern energy
Target 6.2 - Adequate and equitable sanitation
Target 6.3 - Improve water quality
Target 6.4 - Water-use efficiency and scarcity
Target 6.5 - Integrated water resources management
Target 6.6 - Water-related ecosystems
Target 6.a - International cooperation
Target 5.c - Policies/legislation for gender equality
Goal 06 - Clean water and sanitation
Philippines Asia-PacificTarget 6.1 - Safe drinking water
Target 5.c - Policies/legislation for gender equality
Target 6.1 - Safe drinking water
Target 6.2 - Adequate and equitable sanitation
Target 6.3 - Improve water quality
Target 6.4 - Water-use efficiency and scarcity
Target 6.5 - Integrated water resources management
Target 6.6 - Water-related ecosystems
Target 6.a - International cooperation
Target 6.b - Participation of local communities
Target 7.1 - Access to affordable, reliable and modern energy
Statistical Yearbook for Asia and the Pacific 2017 Philippines SDG Datasheet
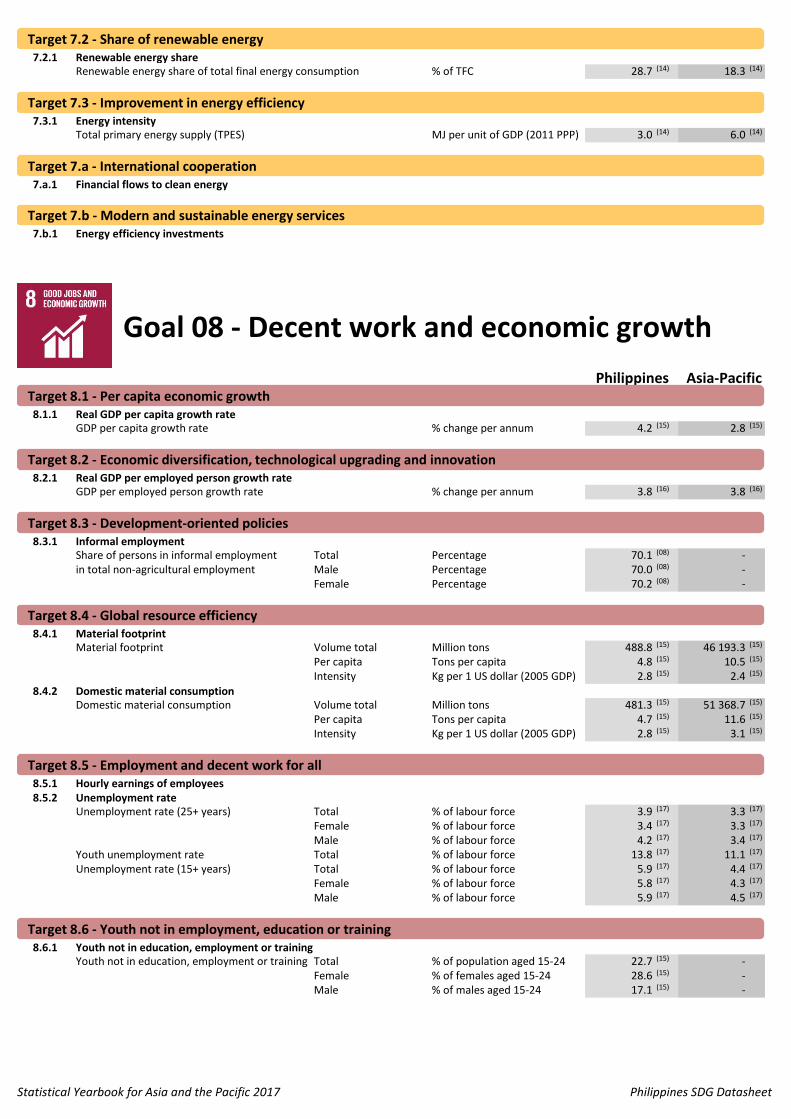
7.2.1 Renewable energy shareRenewable energy share of total final energy consumption % of TFC 28.7 (14) 18.3 (14)
7.3.1 Energy intensityTotal primary energy supply (TPES) MJ per unit of GDP (2011 PPP) 3.0 (14) 6.0 (14)
7.a.1 Financial flows to clean energy
7.b.1 Energy efficiency investments
8.1.1 Real GDP per capita growth rateGDP per capita growth rate % change per annum 4.2 (15) 2.8 (15)
8.2.1 Real GDP per employed person growth rateGDP per employed person growth rate % change per annum 3.8 (16) 3.8 (16)
8.3.1 Informal employmentShare of persons in informal employment Total Percentage 70.1 (08) -in total non-agricultural employment Male Percentage 70.0 (08) -
Female Percentage 70.2 (08) -
8.4.1 Material footprintMaterial footprint Volume total Million tons 488.8 (15) 46 193.3 (15)
Per capita Tons per capita 4.8 (15) 10.5 (15)
Intensity Kg per 1 US dollar (2005 GDP) 2.8 (15) 2.4 (15)
8.4.2 Domestic material consumptionDomestic material consumption Volume total Million tons 481.3 (15) 51 368.7 (15)
Per capita Tons per capita 4.7 (15) 11.6 (15)
Intensity Kg per 1 US dollar (2005 GDP) 2.8 (15) 3.1 (15)
8.5.1 Hourly earnings of employees8.5.2 Unemployment rate
Unemployment rate (25+ years) Total % of labour force 3.9 (17) 3.3 (17)
Female % of labour force 3.4 (17) 3.3 (17)
Male % of labour force 4.2 (17) 3.4 (17)
Youth unemployment rate Total % of labour force 13.8 (17) 11.1 (17)
Unemployment rate (15+ years) Total % of labour force 5.9 (17) 4.4 (17)
Female % of labour force 5.8 (17) 4.3 (17)
Male % of labour force 5.9 (17) 4.5 (17)
8.6.1 Youth not in education, employment or trainingYouth not in education, employment or training Total % of population aged 15-24 22.7 (15) -
Female % of females aged 15-24 28.6 (15) -Male % of males aged 15-24 17.1 (15) -
Target 8.1 - Per capita economic growth
Target 8.2 - Economic diversification, technological upgrading and innovation
Target 8.3 - Development-oriented policies
Target 8.4 - Global resource efficiency
Target 8.5 - Employment and decent work for all
Target 8.6 - Youth not in employment, education or training
Target 7.3 - Improvement in energy efficiency
Target 7.a - International cooperation
Target 7.b - Modern and sustainable energy services
Goal 08 - Decent work and economic growth
Philippines Asia-Pacific
Target 7.2 - Share of renewable energyTarget 7.2 - Share of renewable energy
Target 7.3 - Improvement in energy efficiency
Target 7.a - International cooperation
Target 7.b - Modern and sustainable energy services
Target 8.1 - Per capita economic growth
Target 8.2 - Economic diversification, technological upgrading and innovation
Target 8.3 - Development-oriented policies
Target 8.4 - Global resource efficiency
Target 8.5 - Employment and decent work for all
Target 8.6 - Youth not in employment, education or training
Statistical Yearbook for Asia and the Pacific 2017 Philippines SDG Datasheet

8.7.1 Child labourChildren involved in child labour Total % children aged 15-17 20.1 (11) -
Female % children aged 15-17 10.8 (11) -Male % children aged 15-17 28.9 (11) -
Children involved in child labour Total % children aged 5-14 6.3 (11) -Female % children aged 5-14 4.6 (11) -Male % children aged 5-14 7.9 (11) -
Children involved in child labour Total % children aged 5-17 9.4 (11) -Female % children aged 5-17 6.0 (11) -Male % children aged 5-17 12.6 (11) -
8.8.1 Occupational injuries8.8.2 Compliance of labour rights
8.9.1 Tourism direct GDPOutbound tourism expenditure % of GDP 4.3 (14) 0.9 (14)
8.9.2 Jobs in tourism industries
8.10.1 Commercial bank branches and automated teller machinesNumber of commercial bank branches Per 100 000 adults 8.8 (15) 13.3 (15)
Number of automated teller machines (ATMs) Per 100 000 adults 25.3 (15) 57.7 (15)
8.10.2 Adults with a bank accountAdults with an account at a bank % of population aged 15+ 37.1 (14) 66.0 (14)
8.a.1 Aid for TradeAid for trade Disbursements Million 2015 US dollars 345.1 (15) -
Commitments Million 2015 US dollars 2 648.9 (15) -
8.b.1 National strategy for youth employment
9.1.1 Population within 2 km of an all-season road9.1.2 Passenger and freight volumes
Air transport passengers carried Million people 32 (15) 1 363 (15)
Million passenger-km 51 554 (15) 2 389 580 (15)
Air transport freight Million ton-km 484 (15) 76 915 (15)
Tons 204 548 (15) 19 914 366 (15)
Railway freight Million ton-km 1 709 (15) 8 524 588 (15)
Road transport, passenger volume Million passenger-km 124 (15) 19 900 (15)
Road transport freight Million ton-km 62 194 (15) 10 157 542 (15)
Mail volume by air transport Million ton-km 5 (15) 2 729 (15)
9.2.1 Manufacturing value addedManufacturing Value added % of GDP 22.5 (16) 23.5 (16)
Per capita 2005 US dollars per capita 624.7 (16) -
9.2.2 Manufacturing employmentManufacturing employment Employment % of total employment 8.3 (15) -
9.3.1 Small-scale industries in total industry value added9.3.2 Small-scale industries with a loan or line of credit
Goal 09 - Industry, innovation and
infrastructurePhilippines Asia-Pacific
Target 9.1 - Quality, reliable, sustainable and resilient infrastructure
Target 9.2 - Inclusive and sustainable industrialization
Target 9.3 - Access to financial services
Target 8.7 - Child labour and forced labour
Target 8.8 - Safe and secure working environments
Target 8.9 - Sustainable tourism
Target 8.10 - Access to banking, insurance and financial services
Target 8.a - Aid for Trade
Target 8.b - Global strategy for youth employment
Target 8.7 - Child labour and forced labour
Target 8.8 - Safe and secure working environments
Target 8.9 - Sustainable tourism
Target 8.10 - Access to banking, insurance and financial services
Target 8.a - Aid for Trade
Target 8.b - Global strategy for youth employment
Target 9.1 - Quality, reliable, sustainable and resilient infrastructure
Target 9.2 - Inclusive and sustainable industrialization
Target 9.3 - Access to financial services
Statistical Yearbook for Asia and the Pacific 2017 Philippines SDG Datasheet
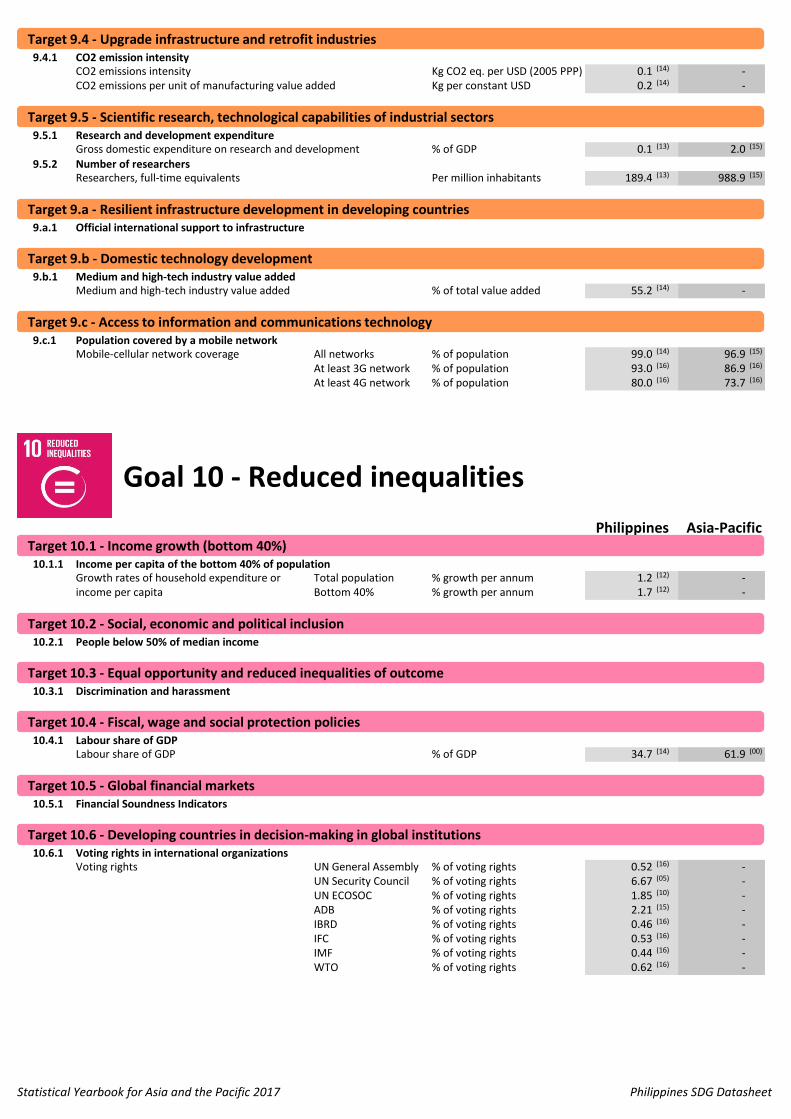
9.4.1 CO2 emission intensityCO2 emissions intensity Kg CO2 eq. per USD (2005 PPP) GDP 0.1 (14) -CO2 emissions per unit of manufacturing value added Kg per constant USD 0.2 (14) -
9.5.1 Research and development expenditureGross domestic expenditure on research and development % of GDP 0.1 (13) 2.0 (15)
9.5.2 Number of researchersResearchers, full-time equivalents Per million inhabitants 189.4 (13) 988.9 (15)
9.a.1 Official international support to infrastructure
9.b.1 Medium and high-tech industry value addedMedium and high-tech industry value added % of total value added 55.2 (14) -
9.c.1 Population covered by a mobile networkMobile-cellular network coverage All networks % of population 99.0 (14) 96.9 (15)
At least 3G network % of population 93.0 (16) 86.9 (16)
At least 4G network % of population 80.0 (16) 73.7 (16)
10.1.1 Income per capita of the bottom 40% of populationGrowth rates of household expenditure or Total population % growth per annum 1.2 (12) -income per capita Bottom 40% % growth per annum 1.7 (12) -
10.2.1 People below 50% of median income
10.3.1 Discrimination and harassment
10.4.1 Labour share of GDPLabour share of GDP % of GDP 34.7 (14) 61.9 (00)
10.5.1 Financial Soundness Indicators
10.6.1 Voting rights in international organizationsVoting rights UN General Assembly % of voting rights 0.52 (16) -
UN Security Council % of voting rights 6.67 (05) -UN ECOSOC % of voting rights 1.85 (10) -ADB % of voting rights 2.21 (15) -IBRD % of voting rights 0.46 (16) -IFC % of voting rights 0.53 (16) -IMF % of voting rights 0.44 (16) -WTO % of voting rights 0.62 (16) -
Target 10.5 - Global financial markets
Target 10.6 - Developing countries in decision-making in global institutions
Philippines Asia-PacificTarget 10.1 - Income growth (bottom 40%)
Target 10.2 - Social, economic and political inclusion
Target 10.3 - Equal opportunity and reduced inequalities of outcome
Target 10.4 - Fiscal, wage and social protection policies
Target 9.4 - Upgrade infrastructure and retrofit industries
Target 9.5 - Scientific research, technological capabilities of industrial sectors
Target 9.a - Resilient infrastructure development in developing countries
Target 9.b - Domestic technology development
Target 9.c - Access to information and communications technology
Goal 10 - Reduced inequalities
Target 9.4 - Upgrade infrastructure and retrofit industries
Target 9.5 - Scientific research, technological capabilities of industrial sectors
Target 9.a - Resilient infrastructure development in developing countries
Target 9.b - Domestic technology development
Target 9.c - Access to information and communications technology
Target 10.1 - Income growth (bottom 40%)
Target 10.2 - Social, economic and political inclusion
Target 10.3 - Equal opportunity and reduced inequalities of outcome
Target 10.4 - Fiscal, wage and social protection policies
Target 10.5 - Global financial markets
Target 10.6 - Developing countries in decision-making in global institutions
Statistical Yearbook for Asia and the Pacific 2017 Philippines SDG Datasheet
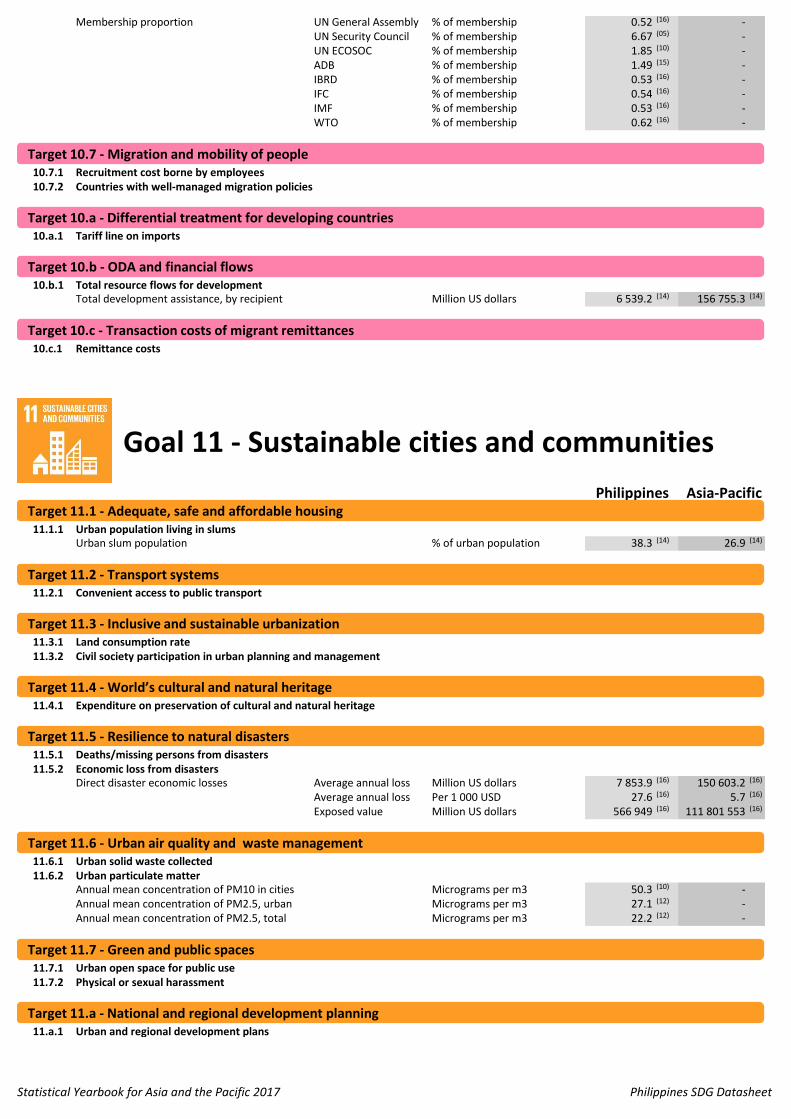
Membership proportion UN General Assembly % of membership 0.52 (16) -UN Security Council % of membership 6.67 (05) -UN ECOSOC % of membership 1.85 (10) -ADB % of membership 1.49 (15) -IBRD % of membership 0.53 (16) -IFC % of membership 0.54 (16) -IMF % of membership 0.53 (16) -WTO % of membership 0.62 (16) -
10.7.1 Recruitment cost borne by employees10.7.2 Countries with well-managed migration policies
10.a.1 Tariff line on imports
10.b.1 Total resource flows for developmentTotal development assistance, by recipient Million US dollars 6 539.2 (14) 156 755.3 (14)
10.c.1 Remittance costs
11.1.1 Urban population living in slumsUrban slum population % of urban population 38.3 (14) 26.9 (14)
11.2.1 Convenient access to public transport
11.3.1 Land consumption rate11.3.2 Civil society participation in urban planning and management
11.4.1 Expenditure on preservation of cultural and natural heritage
11.5.1 Deaths/missing persons from disasters11.5.2 Economic loss from disasters
Direct disaster economic losses Average annual loss Million US dollars 7 853.9 (16) 150 603.2 (16)
Average annual loss Per 1 000 USD 27.6 (16) 5.7 (16)
Exposed value Million US dollars 566 949 (16) 111 801 553 (16)
11.6.1 Urban solid waste collected11.6.2 Urban particulate matter
Annual mean concentration of PM10 in cities Micrograms per m3 50.3 (10) -Annual mean concentration of PM2.5, urban Micrograms per m3 27.1 (12) -Annual mean concentration of PM2.5, total Micrograms per m3 22.2 (12) -
11.7.1 Urban open space for public use11.7.2 Physical or sexual harassment
11.a.1 Urban and regional development plans
Target 11.4 - World’s cultural and natural heritage
Target 11.5 - Resilience to natural disasters
Target 11.6 - Urban air quality and waste management
Target 11.7 - Green and public spaces
Target 11.a - National and regional development planning
Goal 11 - Sustainable cities and communities
Philippines Asia-PacificTarget 11.1 - Adequate, safe and affordable housing
Target 11.2 - Transport systems
Target 11.3 - Inclusive and sustainable urbanization
Target 10.7 - Migration and mobility of people
Target 10.a - Differential treatment for developing countries
Target 10.b - ODA and financial flows
Target 10.c - Transaction costs of migrant remittances
Target 10.7 - Migration and mobility of people
Target 10.a - Differential treatment for developing countries
Target 10.b - ODA and financial flows
Target 10.c - Transaction costs of migrant remittances
Target 11.1 - Adequate, safe and affordable housing
Target 11.2 - Transport systems
Target 11.3 - Inclusive and sustainable urbanization
Target 11.4 - World’s cultural and natural heritage
Target 11.5 - Resilience to natural disasters
Target 11.6 - Urban air quality and waste management
Target 11.7 - Green and public spaces
Target 11.a - National and regional development planning
Statistical Yearbook for Asia and the Pacific 2017 Philippines SDG Datasheet

11.b.1 National disaster risk reduction strategy 11.b.2 Local disaster risk reduction strategy in line with national strategy
11.c.1 Financial support to LDCs for sustainable/resilient buildings
12.1.1 Sustainable consumption and production (SCP) national action plans
12.2.1 Material footprintMaterial Footprint total Volume total Million tons 488.8 (15) 46 193.3 (15)
Per capita Tons per capita 4.8 (15) 10.5 (15)
Intensity Kg per 1 US dollar (2005 GDP) 2.8 (15) 2.4 (15)
12.2.2 Domestic material consumptionDomestic material consumption Volume total Million tons 481.3 (15) 51 368.7 (15)
Per capita Tons per capita 4.7 (15) 11.6 (15)
Change per annum % change per annum 5.1 (15) 5.4 (15)
Intensity Kg per 1 US dollar (2005 GDP) 2.8 (15) 3.1 (15)
12.3.1 Global food loss index
12.4.1 International agreements on hazardous wasteHazardous waste, convention compliance Basel % of compliance 100.0 (15) -
Montreal % of compliance 100.0 (15) -Rotterdam % of compliance 62.7 (15) -Stockholm % of compliance 50.0 (15) -
12.4.2 Hazardous waste generated/treatedHazardous waste generation Kg per capita 20.7 (09) 44.9 (06)
12.5.1 National recycling rate
12.6.1 Companies publishing sustainability reports
12.7.1 Sustainable public procurement policies
12.8.1 Mainstreaming sustainable development in education
12.a.1 Financial support on research for sustainable consumption
12.b.1 Sustainable tourism strategies
12.c.1 Fossil-fuel subsidies
Target 12.a - Scientific and technological capacity
Target 12.b - Sustainable tourism
Target 12.c - Inefficient fossil-fuel subsidies
Target 12.3 - Food waste and food losses
Target 12.4 - Chemicals and all wastes
Target 12.5 - Waste prevention, reduction, recycling and reuse
Target 12.6 - Sustainability information reporting by companies
Target 12.7 - Public procurement practices that are sustainable
Target 12.8 - Information and awareness
Target 11.c - Sustainable and resilient buildings
Goal 12 - Responsible consumption and
productionPhilippines Asia-Pacific
Target 12.1 - Programmes on sustainable consumption and production
Target 12.2 - Sustainable use of natural resources
Target 11.b - Disaster risk managementTarget 11.b - Disaster risk management
Target 11.c - Sustainable and resilient buildings
Target 12.1 - Programmes on sustainable consumption and production
Target 12.2 - Sustainable use of natural resources
Target 12.3 - Food waste and food losses
Target 12.4 - Chemicals and all wastes
Target 12.5 - Waste prevention, reduction, recycling and reuse
Target 12.6 - Sustainability information reporting by companies
Target 12.7 - Public procurement practices that are sustainable
Target 12.8 - Information and awareness
Target 12.a - Scientific and technological capacity
Target 12.b - Sustainable tourism
Target 12.c - Inefficient fossil-fuel subsidies
Statistical Yearbook for Asia and the Pacific 2017 Philippines SDG Datasheet
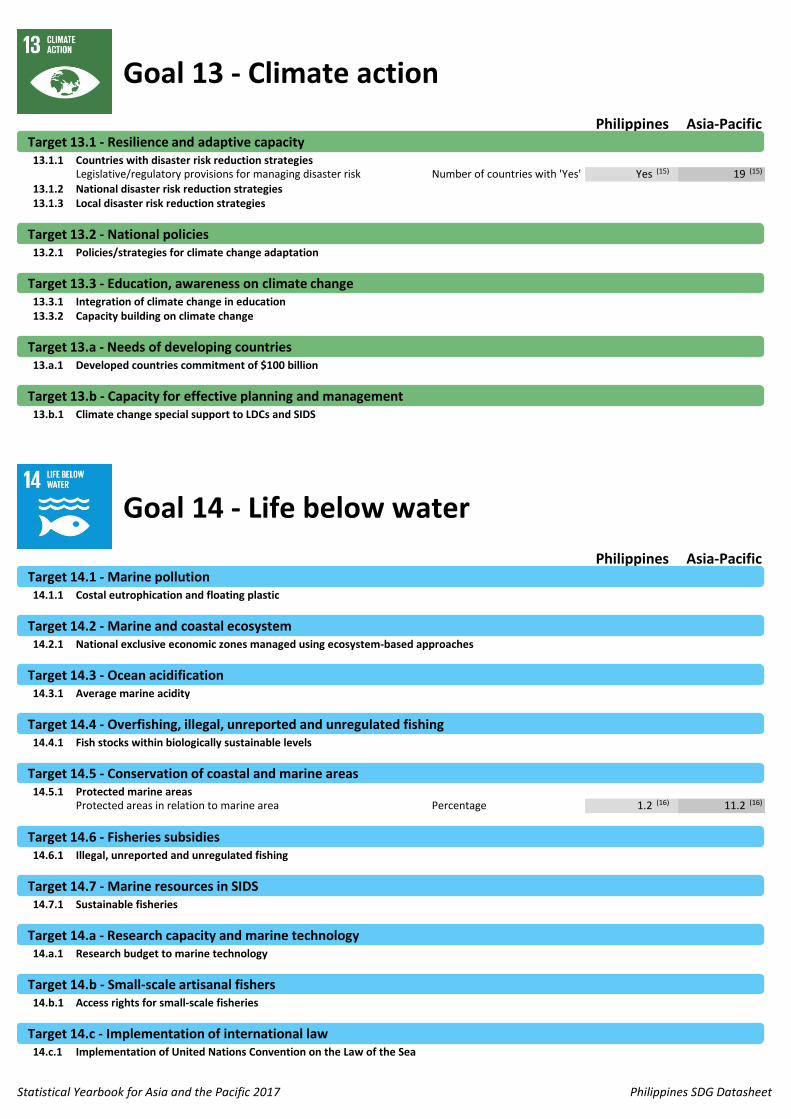
13.1.1 Countries with disaster risk reduction strategiesLegislative/regulatory provisions for managing disaster risk Number of countries with 'Yes' Yes (15) 19 (15)
13.1.2 National disaster risk reduction strategies13.1.3 Local disaster risk reduction strategies
13.2.1 Policies/strategies for climate change adaptation
13.3.1 Integration of climate change in education13.3.2 Capacity building on climate change
13.a.1 Developed countries commitment of $100 billion
13.b.1 Climate change special support to LDCs and SIDS
14.1.1 Costal eutrophication and floating plastic
14.2.1 National exclusive economic zones managed using ecosystem-based approaches
14.3.1 Average marine acidity
14.4.1 Fish stocks within biologically sustainable levels
14.5.1 Protected marine areasProtected areas in relation to marine area Percentage 1.2 (16) 11.2 (16)
14.6.1 Illegal, unreported and unregulated fishing
14.7.1 Sustainable fisheries
14.a.1 Research budget to marine technology
14.b.1 Access rights for small-scale fisheries
14.c.1 Implementation of United Nations Convention on the Law of the Sea
Target 14.5 - Conservation of coastal and marine areas
Target 14.6 - Fisheries subsidies
Target 14.7 - Marine resources in SIDS
Target 14.a - Research capacity and marine technology
Target 14.b - Small-scale artisanal fishers
Target 14.c - Implementation of international law
Philippines Asia-PacificTarget 14.1 - Marine pollution
Target 14.2 - Marine and coastal ecosystem
Target 14.3 - Ocean acidification
Target 14.4 - Overfishing, illegal, unreported and unregulated fishing
Target 13.1 - Resilience and adaptive capacity
Target 13.2 - National policies
Target 13.3 - Education, awareness on climate change
Target 13.a - Needs of developing countries
Target 13.b - Capacity for effective planning and management
Goal 14 - Life below water
Goal 13 - Climate action
Philippines Asia-PacificTarget 13.1 - Resilience and adaptive capacity
Target 13.2 - National policies
Target 13.3 - Education, awareness on climate change
Target 13.a - Needs of developing countries
Target 13.b - Capacity for effective planning and management
Target 14.1 - Marine pollution
Target 14.2 - Marine and coastal ecosystem
Target 14.3 - Ocean acidification
Target 14.4 - Overfishing, illegal, unreported and unregulated fishing
Target 14.5 - Conservation of coastal and marine areas
Target 14.6 - Fisheries subsidies
Target 14.7 - Marine resources in SIDS
Target 14.a - Research capacity and marine technology
Target 14.b - Small-scale artisanal fishers
Target 14.c - Implementation of international law
Statistical Yearbook for Asia and the Pacific 2017 Philippines SDG Datasheet
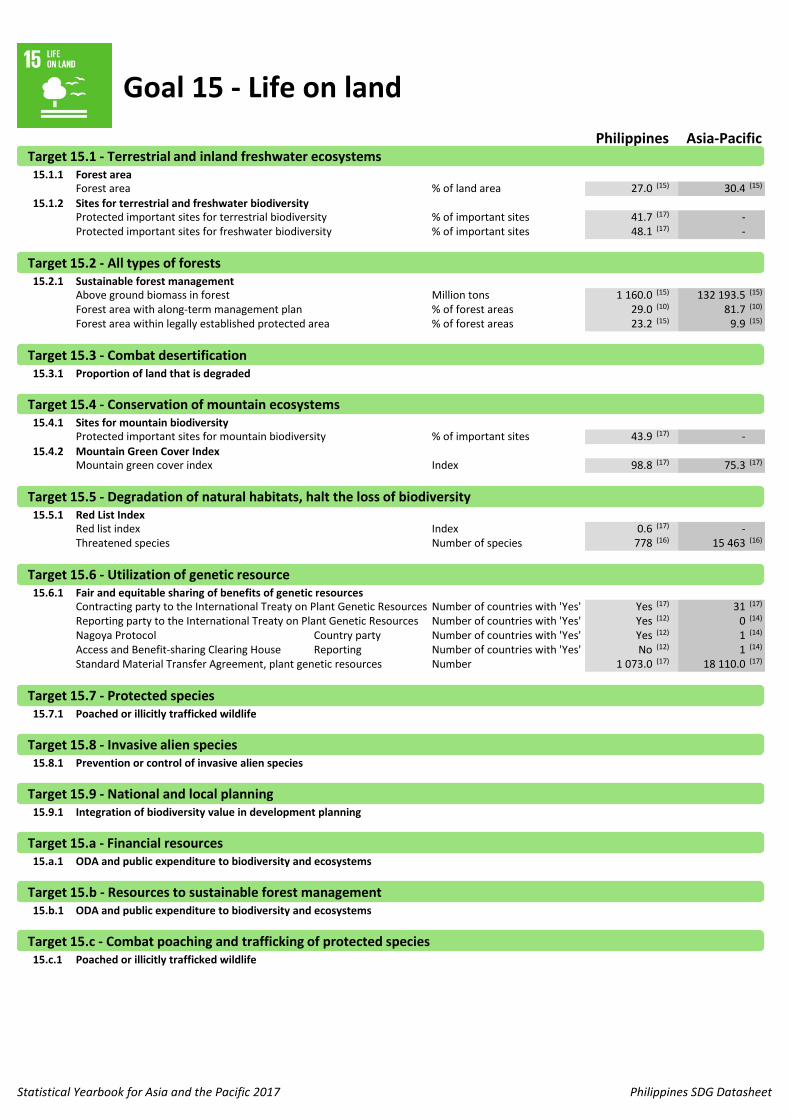
15.1.1 Forest areaForest area % of land area 27.0 (15) 30.4 (15)
15.1.2 Sites for terrestrial and freshwater biodiversityProtected important sites for terrestrial biodiversity % of important sites 41.7 (17) -Protected important sites for freshwater biodiversity % of important sites 48.1 (17) -
15.2.1 Sustainable forest managementAbove ground biomass in forest Million tons 1 160.0 (15) 132 193.5 (15)
Forest area with along-term management plan % of forest areas 29.0 (10) 81.7 (10)
Forest area within legally established protected area % of forest areas 23.2 (15) 9.9 (15)
15.3.1 Proportion of land that is degraded
15.4.1 Sites for mountain biodiversityProtected important sites for mountain biodiversity % of important sites 43.9 (17) -
15.4.2 Mountain Green Cover IndexMountain green cover index Index 98.8 (17) 75.3 (17)
15.5.1 Red List IndexRed list index Index 0.6 (17) -Threatened species Number of species 778 (16) 15 463 (16)
15.6.1 Fair and equitable sharing of benefits of genetic resourcesContracting party to the International Treaty on Plant Genetic Resources Number of countries with 'Yes' Yes (17) 31 (17)
Reporting party to the International Treaty on Plant Genetic Resources Number of countries with 'Yes' Yes (12) 0 (14)
Nagoya Protocol Country party Number of countries with 'Yes' Yes (12) 1 (14)
Access and Benefit-sharing Clearing House Reporting Number of countries with 'Yes' No (12) 1 (14)
Standard Material Transfer Agreement, plant genetic resources Number 1 073.0 (17) 18 110.0 (17)
15.7.1 Poached or illicitly trafficked wildlife
15.8.1 Prevention or control of invasive alien species
15.9.1 Integration of biodiversity value in development planning
15.a.1 ODA and public expenditure to biodiversity and ecosystems
15.b.1 ODA and public expenditure to biodiversity and ecosystems
15.c.1 Poached or illicitly trafficked wildlife
Target 15.a - Financial resources
Target 15.b - Resources to sustainable forest management
Target 15.c - Combat poaching and trafficking of protected species
Target 15.4 - Conservation of mountain ecosystems
Target 15.5 - Degradation of natural habitats, halt the loss of biodiversity
Target 15.6 - Utilization of genetic resource
Target 15.7 - Protected species
Target 15.8 - Invasive alien species
Target 15.9 - National and local planning
Goal 15 - Life on land
Philippines Asia-PacificTarget 15.1 - Terrestrial and inland freshwater ecosystems
Target 15.2 - All types of forests
Target 15.3 - Combat desertification
Target 15.1 - Terrestrial and inland freshwater ecosystems
Target 15.2 - All types of forests
Target 15.3 - Combat desertification
Target 15.4 - Conservation of mountain ecosystems
Target 15.5 - Degradation of natural habitats, halt the loss of biodiversity
Target 15.6 - Utilization of genetic resource
Target 15.7 - Protected species
Target 15.8 - Invasive alien species
Target 15.9 - National and local planning
Target 15.a - Financial resources
Target 15.b - Resources to sustainable forest management
Target 15.c - Combat poaching and trafficking of protected species
Statistical Yearbook for Asia and the Pacific 2017 Philippines SDG Datasheet
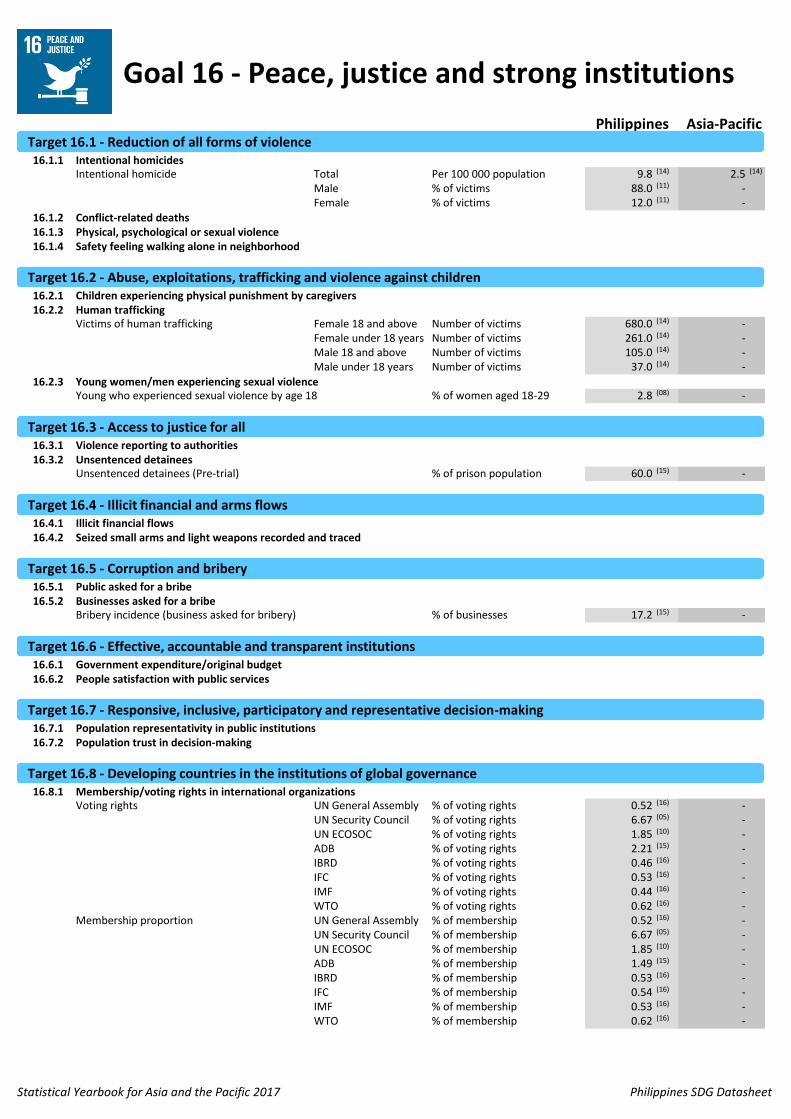
16.1.1 Intentional homicidesIntentional homicide Total Per 100 000 population 9.8 (14) 2.5 (14)
Male % of victims 88.0 (11) -Female % of victims 12.0 (11) -
16.1.2 Conflict-related deaths16.1.3 Physical, psychological or sexual violence16.1.4 Safety feeling walking alone in neighborhood
16.2.1 Children experiencing physical punishment by caregivers16.2.2 Human trafficking
Victims of human trafficking Female 18 and above Number of victims 680.0 (14) -Female under 18 years Number of victims 261.0 (14) -Male 18 and above Number of victims 105.0 (14) -Male under 18 years Number of victims 37.0 (14) -
16.2.3 Young women/men experiencing sexual violenceYoung who experienced sexual violence by age 18 % of women aged 18-29 2.8 (08) -
16.3.1 Violence reporting to authorities16.3.2 Unsentenced detainees
Unsentenced detainees (Pre-trial) % of prison population 60.0 (15) -
16.4.1 Illicit financial flows16.4.2 Seized small arms and light weapons recorded and traced
16.5.1 Public asked for a bribe16.5.2 Businesses asked for a bribe
Bribery incidence (business asked for bribery) % of businesses 17.2 (15) -
16.6.1 Government expenditure/original budget16.6.2 People satisfaction with public services
16.7.1 Population representativity in public institutions16.7.2 Population trust in decision-making
16.8.1 Membership/voting rights in international organizationsVoting rights UN General Assembly % of voting rights 0.52 (16) -
UN Security Council % of voting rights 6.67 (05) -UN ECOSOC % of voting rights 1.85 (10) -ADB % of voting rights 2.21 (15) -IBRD % of voting rights 0.46 (16) -IFC % of voting rights 0.53 (16) -IMF % of voting rights 0.44 (16) -WTO % of voting rights 0.62 (16) -
Membership proportion UN General Assembly % of membership 0.52 (16) -UN Security Council % of membership 6.67 (05) -UN ECOSOC % of membership 1.85 (10) -ADB % of membership 1.49 (15) -IBRD % of membership 0.53 (16) -IFC % of membership 0.54 (16) -IMF % of membership 0.53 (16) -WTO % of membership 0.62 (16) -
Target 16.7 - Responsive, inclusive, participatory and representative decision-making
Target 16.8 - Developing countries in the institutions of global governance
Target 16.1 - Reduction of all forms of violence
Target 16.2 - Abuse, exploitations, trafficking and violence against children
Target 16.3 - Access to justice for all
Target 16.4 - Illicit financial and arms flows
Target 16.5 - Corruption and bribery
Target 16.6 - Effective, accountable and transparent institutions
Goal 16 - Peace, justice and strong institutions
Philippines Asia-PacificTarget 16.1 - Reduction of all forms of violence
Target 16.2 - Abuse, exploitations, trafficking and violence against children
Target 16.3 - Access to justice for all
Target 16.4 - Illicit financial and arms flows
Target 16.5 - Corruption and bribery
Target 16.6 - Effective, accountable and transparent institutions
Target 16.7 - Responsive, inclusive, participatory and representative decision-making
Target 16.8 - Developing countries in the institutions of global governance
Statistical Yearbook for Asia and the Pacific 2017 Philippines SDG Datasheet
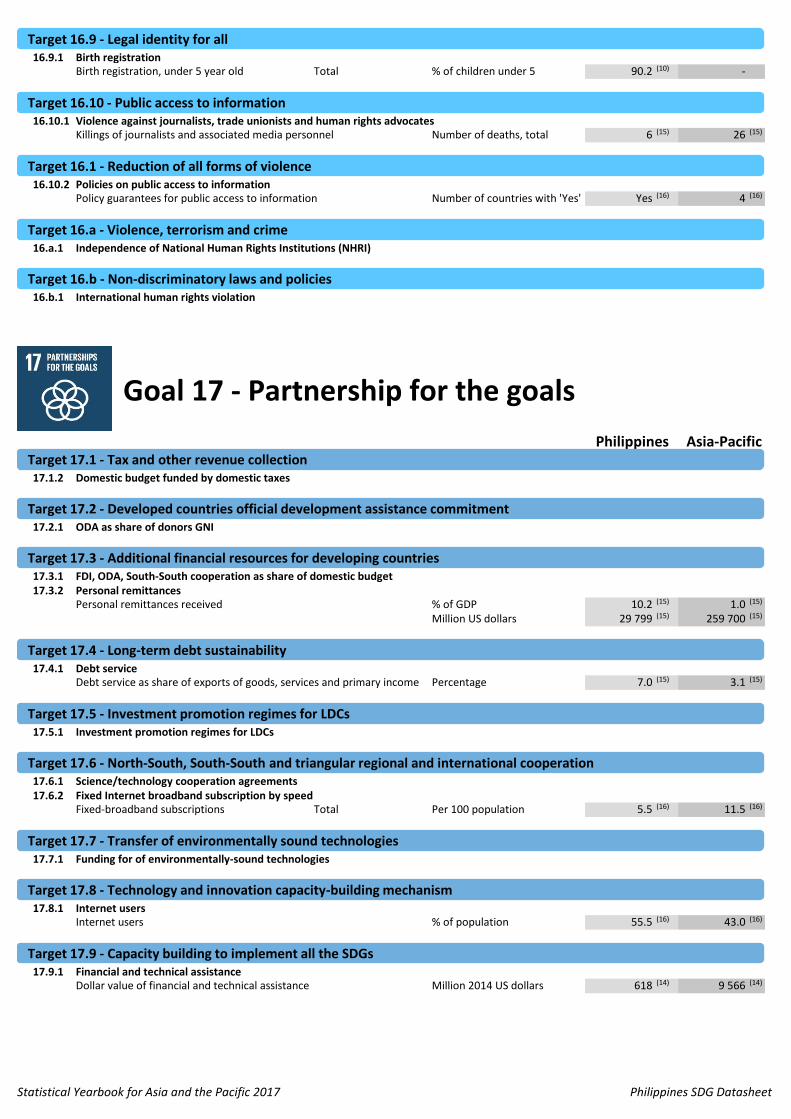
16.9.1 Birth registrationBirth registration, under 5 year old Total % of children under 5 90.2 (10) -
16.10.1 Violence against journalists, trade unionists and human rights advocatesKillings of journalists and associated media personnel Number of deaths, total 6 (15) 26 (15)
16.10.2 Policies on public access to informationPolicy guarantees for public access to information Number of countries with 'Yes' Yes (16) 4 (16)
16.a.1 Independence of National Human Rights Institutions (NHRI)
16.b.1 International human rights violation
17.1.2 Domestic budget funded by domestic taxes
17.2.1 ODA as share of donors GNI
17.3.1 FDI, ODA, South-South cooperation as share of domestic budget17.3.2 Personal remittances
Personal remittances received % of GDP 10.2 (15) 1.0 (15)
Million US dollars 29 799 (15) 259 700 (15)
17.4.1 Debt serviceDebt service as share of exports of goods, services and primary income Percentage 7.0 (15) 3.1 (15)
17.5.1 Investment promotion regimes for LDCs
17.6.1 Science/technology cooperation agreements17.6.2 Fixed Internet broadband subscription by speed
Fixed-broadband subscriptions Total Per 100 population 5.5 (16) 11.5 (16)
17.7.1 Funding for of environmentally-sound technologies
17.8.1 Internet usersInternet users % of population 55.5 (16) 43.0 (16)
17.9.1 Financial and technical assistanceDollar value of financial and technical assistance Million 2014 US dollars 618 (14) 9 566 (14)
Target 17.9 - Capacity building to implement all the SDGs
Target 17.3 - Additional financial resources for developing countries
Target 17.4 - Long-term debt sustainability
Target 17.5 - Investment promotion regimes for LDCs
Target 17.6 - North-South, South-South and triangular regional and international cooperation
Target 17.7 - Transfer of environmentally sound technologies
Target 17.8 - Technology and innovation capacity-building mechanism
Target 16.b - Non-discriminatory laws and policies
Goal 17 - Partnership for the goals
Philippines Asia-PacificTarget 17.1 - Tax and other revenue collection
Target 17.2 - Developed countries official development assistance commitment
Target 16.9 - Legal identity for all
Target 16.10 - Public access to information
Target 16.1 - Reduction of all forms of violence
Target 16.a - Violence, terrorism and crime
Target 16.9 - Legal identity for all
Target 16.10 - Public access to information
Target 16.1 - Reduction of all forms of violence
Target 16.a - Violence, terrorism and crime
Target 16.b - Non-discriminatory laws and policies
Target 17.1 - Tax and other revenue collection
Target 17.2 - Developed countries official development assistance commitment
Target 17.3 - Additional financial resources for developing countries
Target 17.4 - Long-term debt sustainability
Target 17.5 - Investment promotion regimes for LDCs
Target 17.6 - North-South, South-South and triangular regional and international cooperation
Target 17.7 - Transfer of environmentally sound technologies
Target 17.8 - Technology and innovation capacity-building mechanism
Target 17.9 - Capacity building to implement all the SDGs
Statistical Yearbook for Asia and the Pacific 2017 Philippines SDG Datasheet
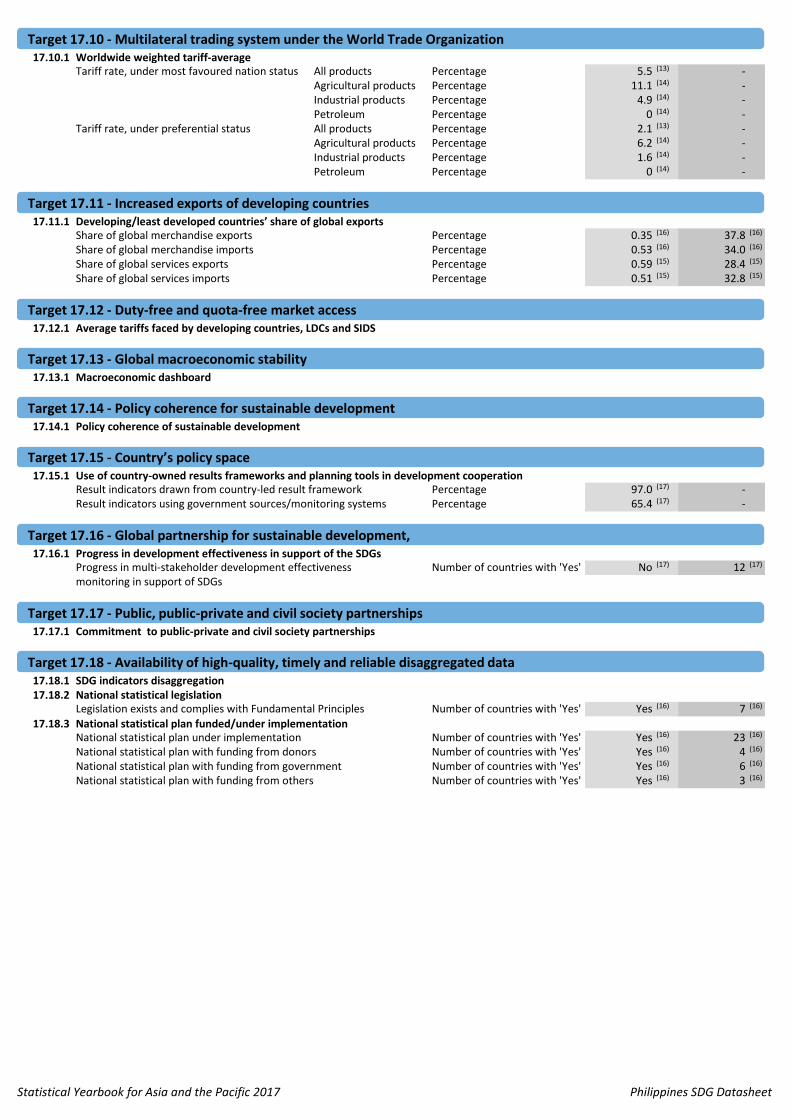
17.10.1 Worldwide weighted tariff-averageTariff rate, under most favoured nation status All products Percentage 5.5 (13) -
Agricultural products Percentage 11.1 (14) -Industrial products Percentage 4.9 (14) -Petroleum Percentage 0 (14) -
Tariff rate, under preferential status All products Percentage 2.1 (13) -Agricultural products Percentage 6.2 (14) -Industrial products Percentage 1.6 (14) -Petroleum Percentage 0 (14) -
17.11.1 Developing/least developed countries’ share of global exportsShare of global merchandise exports Percentage 0.35 (16) 37.8 (16)
Share of global merchandise imports Percentage 0.53 (16) 34.0 (16)
Share of global services exports Percentage 0.59 (15) 28.4 (15)
Share of global services imports Percentage 0.51 (15) 32.8 (15)
17.12.1 Average tariffs faced by developing countries, LDCs and SIDS
17.13.1 Macroeconomic dashboard
17.14.1 Policy coherence of sustainable development
17.15.1 Use of country-owned results frameworks and planning tools in development cooperationResult indicators drawn from country-led result framework Percentage 97.0 (17) -Result indicators using government sources/monitoring systems Percentage 65.4 (17) -
17.16.1 Progress in development effectiveness in support of the SDGsProgress in multi-stakeholder development effectiveness Number of countries with 'Yes' No (17) 12 (17)
monitoring in support of SDGs
17.17.1 Commitment to public-private and civil society partnerships
17.18.1 SDG indicators disaggregation17.18.2 National statistical legislation
Legislation exists and complies with Fundamental Principles Number of countries with 'Yes' Yes (16) 7 (16)
17.18.3 National statistical plan funded/under implementationNational statistical plan under implementation Number of countries with 'Yes' Yes (16) 23 (16)
National statistical plan with funding from donors Number of countries with 'Yes' Yes (16) 4 (16)
National statistical plan with funding from government Number of countries with 'Yes' Yes (16) 6 (16)
National statistical plan with funding from others Number of countries with 'Yes' Yes (16) 3 (16)
Target 17.15 - Country’s policy space
Target 17.16 - Global partnership for sustainable development,
Target 17.17 - Public, public-private and civil society partnerships
Target 17.18 - Availability of high-quality, timely and reliable disaggregated data
Target 17.10 - Multilateral trading system under the World Trade Organization
Target 17.11 - Increased exports of developing countries
Target 17.12 - Duty-free and quota-free market access
Target 17.13 - Global macroeconomic stability
Target 17.14 - Policy coherence for sustainable development
Target 17.10 - Multilateral trading system under the World Trade Organization
Target 17.11 - Increased exports of developing countries
Target 17.12 - Duty-free and quota-free market access
Target 17.13 - Global macroeconomic stability
Target 17.14 - Policy coherence for sustainable development
Target 17.15 - Country’s policy space
Target 17.16 - Global partnership for sustainable development,
Target 17.17 - Public, public-private and civil society partnerships
Target 17.18 - Availability of high-quality, timely and reliable disaggregated data
Statistical Yearbook for Asia and the Pacific 2017 Philippines SDG Datasheet
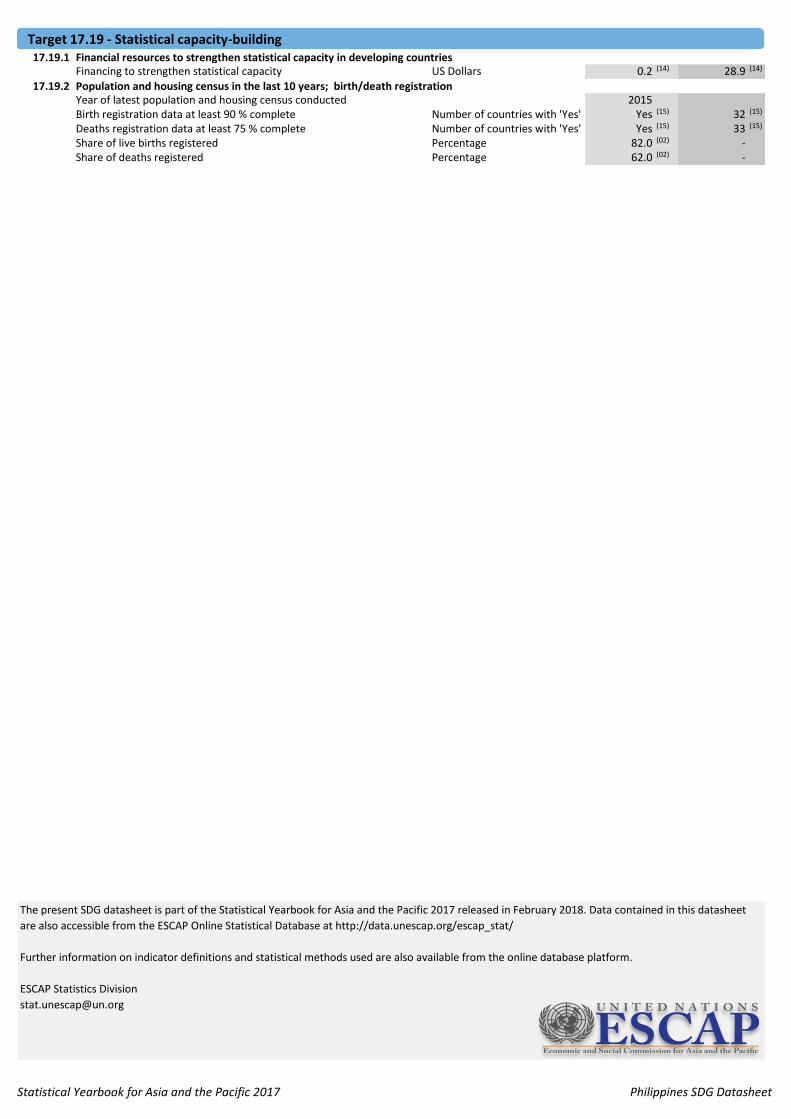
17.19.1 Financial resources to strengthen statistical capacity in developing countriesFinancing to strengthen statistical capacity US Dollars 0.2 (14) 28.9 (14)
17.19.2 Population and housing census in the last 10 years; birth/death registrationYear of latest population and housing census conducted 2015Birth registration data at least 90 % complete Number of countries with 'Yes' Yes (15) 32 (15)
Deaths registration data at least 75 % complete Number of countries with 'Yes' Yes (15) 33 (15)
Share of live births registered Percentage 82.0 (02) -Share of deaths registered Percentage 62.0 (02) -
Target 17.19 - Statistical capacity-building
The present SDG datasheet is part of the Statistical Yearbook for Asia and the Pacific 2017 released in February 2018. Data contained in this datasheet
are also accessible from the ESCAP Online Statistical Database at http://data.unescap.org/escap_stat/
Further information on indicator definitions and statistical methods used are also available from the online database platform.
ESCAP Statistics Division
Target 17.19 - Statistical capacity-building
Statistical Yearbook for Asia and the Pacific 2017 Philippines SDG Datasheet