Embed Size (px)
Citation preview

8/3/2019 Yearly Plan Maths F4 (1)
http://slidepdf.com/reader/full/yearly-plan-maths-f4-1 1/22
LEARNING AREA/WEEKSLEARNING OBJECTIVES LEARNING OUTCOME
Students will be able to:TEACHING AND LEARNING ACTIVITIESSTRATEGIES
1. STANDARD FORM
i. Understand and use the concept if significant figure.Round off positive numbers to a given number of significant figures when the numbers are:
a) Greater than 1
b) Less than 1Discuss the significance if zero in a number.
Rounded numbers are only approximates.
Limit to positive numbers only.
Teaching a ids
Mahjong paper
Pictures
Ccts
Working out mentally
Decision makingIdentifying relationship
ii. Perform operations of addition, substraction , multiplication and division, involving a few numbers and state the answer in specific significant figures.
Discuss the use of significant figures in everyday life and other areas.
Generally, rounding is done on the final answer.Moral values
Cooperation rational
Being systematic
ConscientiousSolve problems involving significant figures.Vocabulary
Significance
Significant figure
Relevant
Round off
Accuracyi. Understand and use the concept of standard form to solve problemsState positive numbers in standard form when the numbers are:
a) Greater than or equal to 10
b) Less than 1
Use everyday life situations such as in health, technology, industry,
Construction and business involving numbers in standard form.
Use the scientific calculator to explore numbers in standard form.
Another term for standard form is scientific notation.
Teaching aids
Flash card
Scientific calculator
1

8/3/2019 Yearly Plan Maths F4 (1)
http://slidepdf.com/reader/full/yearly-plan-maths-f4-1 2/22
Ccts
Working out mentally
Identifying relationship
ii. Convert numbers in standard form to single numbers.
Moral values
Cooperation, rational, being systematic
iii. Perform operations of addition, subtraction, multiplication and division, involving any two numbers and state the answers in standard form.
Include two numbers in standard form.Vocabulary
Standard form
Single number
iii. Scientific notationsolve problems involving numbers in standard form.
2. QUADRATIC EXPRESSIONS AND EQUATIONS
i. understand the concept of quadratic expression;identify quadratic expressions;
Discuss the characteristics of quadratic expressions of the form 0
2
=++ cbxax , where a, b and c are constants, a ≠ 0 and x is an unknown.Include the case when b = 0 and/or c = 0.Vocabulary
Quadratic expression
Constant
Constant factor
Unknown
Highest power
Expand
Coefficient
Term
form quadratic expressions by multiplying any two linear expressions;Emphasise that for the terms x2 and x, the coefficients are understood to be 1.
ii. form quadratic expressions based on specific situations;
Include everyday life situations.factorise quadratic expression;factorise quadratic expressions of the form cbxax ++2 , where b = 0 or c = 0;Discuss thevarious methods to obtain the desired product.Vocabulary
Factorise
Common factor
Perfect square
Cross method
Inspection
Common factor
Complete factorisation
factorise quadratic expressions of the form px2 −q, p and q are perfect squares;1 is also a perfect square.
2

8/3/2019 Yearly Plan Maths F4 (1)
http://slidepdf.com/reader/full/yearly-plan-maths-f4-1 3/22
factorise quadratic expressions of the form cbxax ++2 , where a, b and c not equal to zero;factorise quadratic expressions of the form cbxax ++
2 , where
a, b and c not equal to zero;
Factorisation methods that can be used are:
• cross method;
• inspection.
i. factorise quadratic expressions containing coefficients with common factorsunderstand the concept of quadratic equation;identify quadratic equation with one unknown;Discuss the characteristics of quadratic equations.Vocabulary
Quadratic equation
General form
Substitute
Root
Trial and error method
Solution
write quadratic equations in general form i.e. 02
=++ cbxax ;Moral values
Diligence
Rationality
Justice
form quadratic equations based on specific situations;Include everyday life situations.Ccts
Identifying relationship
Classifying
Catogerising
Drawing diagrams
Identify patterns
Problem solving
2.4 understand and use the concept of roots of quadratic equations to solve problems.
.i determine whether a given value is a root of a specific quadratic equation;determine the solutions for quadratic equations by:
a) trial and error method;
factorisation;Discuss the number of roots of a quadratic equation.
There are quadratic equations that cannot be solved by factorisation.Teaching aids
Cd courseware
solve problems involving quadratic equations.Use everyday life situations.
Check the rationality of the solution.
SETSunderstand the concept of set;sort given objects into groups;Use everyday life examples to introduce the concept of set.
The word set refers to any collection or group of objects.
Teaching aids
Flash cards
i . define sets by:
a) descriptions;
using set notation;The notation used for sets is braces, { }.
3

8/3/2019 Yearly Plan Maths F4 (1)
http://slidepdf.com/reader/full/yearly-plan-maths-f4-1 4/22
The same elements in a set need not be repeated.
Sets are usually denoted by capital letters.
The definition of sets has to be clear and precise so that the elements can be identified.Vocabulary
Set
Element
Description
Label
Set Notation
Denote
Venn diagram
Empty set
Equal set
identify whether a given object is an element of a set and use the symbol ∈ or ∉;The symbol ∈ (epsilon) is read “is an element of” or “is a member of”.
The symbol ∉ is read “is not an element of” or “is not a member of”.
Ccts
Classifying
Translating
Identifying relationships
represent sets by using Venn diagrams;Discuss the difference between the representation of elements and the number of elements in Venn diagrams.
Moral values
Paying attention
list the elements and state the number of elements of a set;Discuss why { 0 } and { ∅ } are not empty sets.
The notation n(A) denotes the number of elements in set A.
determine whether a set is an empty set;The symbol ∅ (phi) or { } denotes an empty set.
determine whether two sets are equal;An empty set is also called a null set.
understand and use the concept of subset, universal set and the complement of a set;determine whether a given set is a subset of a specific set and use the symbol
⊂ or ⊄ ;Begin with everyday life situations.
An empty set is a subset of any set.Every set is a subset of itself.
Vocabulary
Subset
Universal set
Complement of a set
.i represent subset using Venn diagram;
Teaching aids
Laptop
Diagramslist the subsets for a specific set;
illustrate the relationship between set and universal set using Venn diagram;Discuss the relationship between sets and universal sets.
The symbol ξ denotes a universal set.
4
8/3/2019 Yearly Plan Maths F4 (1)
http://slidepdf.com/reader/full/yearly-plan-maths-f4-1 5/22
Ccts
Translating
Categorizing
determine the complement of a given set;The symbol A′ denotes the complement of set A.Moral values
Being hard-working
.ii Being honestdetermine the relationship between set, subset, universal set and the complement of a set;
Include everyday life situations.
3.3 perform operations on sets:
• the intersection of sets;
i. the union of sets.determine the intersection of:
a) two sets;
b) three sets;
and use the symbol ∩ ;
Include everyday life situations.Moral values
Paying attention
Cooperation
Concentrationrepresent the intersection of sets using Venn diagram;Discuss cases when:
• A ∩ B = ∅
A ⊂ BTeaching aidsLaptop
Diagrams
Text book
iii. state the relationship between
b) A ∩ B and A ;
A ∩ B and B ;Vocabulary
Intersection
Union
Operation
iv. determine the complement of the intersection of sets;
v. solve problems involving the intersection of sets;
vi. Include everyday life situations.determine the union of:
c) two sets;
d) three sets;
and use the symbol ∪ ;Teaching aids
Laptop
Diagrams
Text book
vii. represent the union of sets using Venn diagram;
viii. state the relationship between
a) A ∪ B and A ;
b) A ∪ B and B ;
5

8/3/2019 Yearly Plan Maths F4 (1)
http://slidepdf.com/reader/full/yearly-plan-maths-f4-1 6/22
ix. determine the complement of the union of sets;
x. solve problems involving the union of sets;
xi. Include everyday life situations.determine the outcome of combined operations on sets;
solve problems involving combined operations on sets.Include everyday life situations.
MATHEMATICAL REASONINGunderstand the concept of statementdetermine whether a given sentence is a statement;Introduce this topic using everyday
life situations.
Statements consisting of:Ccts
Making general statement
determine whether a given statement is true or false;Focus on mathematical sentences.
• words only, e.g. “Five is greater than two.”;
• numbers and words, e.g. “5 is greater than 2.”;
• numbers and symbols, e.g. 5 > 2.
Moral values
Cooperation
Teaching aids
Multimediaconstruct true or false statement using given numbers and mathematical symbols;Discuss sentences consisting of:
• words only;
• numbers and words;
• numbers and mathematical symbols;
The following are not statements:
• “Is the place value of digit 9 in 1928 hundreds?”;
• 4n −5m + 2 s;
• “Add the two numbers.”;
• x + 2 = 8.
Vocabulary
Statement
True
FalseMathematical sentence
Mathematical statement
Mathematical symbol
i. understand the concept of quantifiers “all” and “some”;construct statements using the quantifier:
)a all;
some;Start with everyday life situations.
Quantifiers such as “every” and “any” can be introduced based on context.Ccts
Categorizing
Moral values
Social interaction
6

8/3/2019 Yearly Plan Maths F4 (1)
http://slidepdf.com/reader/full/yearly-plan-maths-f4-1 7/22
determine whether a statement that contains the quantifier “all” is true or false; Examples:
• All squares are four sided figures.
• Every square is a four sided figure.
Any square is a four sided figure.Vocabulary
Quantifier
AllEvery
Any
Some
Severaldetermine whether a statement can be generalised to cover all cases by using the quantifier “all”;Other quantifiers such as “several”, “one of” and “part
of” can be used based on context.One of
Part of
Negate
Contrary
Object
construct a true statement using the quantifier “all” or “some”, given an object and a property. Example:
Object: Trapezium.
Property: Two sides are parallel to each other.
Statement: All trapeziums have two parallel sides.
Object: Even numbers.
Property: Divisible by 4.
Statement: Some even numbers are divisible by 4.
Teaching aids
Multimediaperform operations involving the words “not” or “no”, “and” and “or” on statements;change the truth value of a given statement by placing the word
“not” into the original statement;Begin with everyday life situations.
The negation “no” can be used where appropriate.
The symbol “~” (tilde) denotes negation.
“~ p” denotes negation of p which means “not p” or “no p”.
The truth table for p and ~ p are as follows:
p~ p
True
False
False
True
Vocabulary
Negation
Not p
7

8/3/2019 Yearly Plan Maths F4 (1)
http://slidepdf.com/reader/full/yearly-plan-maths-f4-1 8/22
No p
Truth table
Truth value
And
Compound statement
Or
Teaching Aids
Multimedia
identify two statements from a compound statement that contains the word “and”;The truth values for “ p and q” are as follows:
pq
p and q
True
True
True
True
False
False
False
True
False
False
False
False
Ccts
Reasoning
Moral values
Confidence
.i form a compound statement by combining two given statements using the word “and”;
.ii identify two statement from a compound statement that contains the word “or” ;
.iii The truth values for “ p or q” are as follows:form a compound statement by combining two given statements using the word “or”;
8

8/3/2019 Yearly Plan Maths F4 (1)
http://slidepdf.com/reader/full/yearly-plan-maths-f4-1 9/22
pq
p or q
True
True
True
True
False
True
False
True
True
False
False
False
.iv determine the truth value of a compound statement which is the combination of two statements with the word “and”;
.v determine the truth value of a compound statement which is the combination of two statements with the word “or”.
understand the concept of implication;identify the antecedent and consequent of an implication “if p, then q”;Start with everyday life situations.
Implication “if p, then q” can be written as p ⇒q, and “ p if and only if q” can be written as p ⇔ q, which means p ⇒q and q ⇒ p.
Ccts
Identifying information
Moral values
Cooperationwrite two implications from a compound statement containing “if and only if”;Teaching aids
iii. Multimediaconstruct mathematical statements in the form of implication:
a) If p, then q;
p if and only if q;Vocabulary
Implication
Antecedent
Consequent
Conversedetermine the converse of a given implication;The converse of an implication is not necessarily true.
determine whether the converse of an implication is true or false. Example 1:
If x < 3, then
x < 5 (true).
Conversely:
If x < 5, then
9

8/3/2019 Yearly Plan Maths F4 (1)
http://slidepdf.com/reader/full/yearly-plan-maths-f4-1 10/22
x < 3 (false).
Example 2:
If PQR is a triangle, then the sum of the interior angles of PQR is 180°.(true)
Conversely:
If the sum of the interior angles of PQR is 180°, then PQR is a triangle.
(true)
understand the concept of argument;identify the premise and conclusion of a given simple argument;Start with everyday life situations.
Limit to arguments with true premises.
Ccts
Making justification
ii. Making conclusionmake a conclusion based on two given premises for:
a) Argument Form I;
b) Argument Form II;
Argument Form III;Names for argument forms, i.e. syllogism (Form I), modus ponens (Form II) and modus tollens (Form III), need not be introduced.
Moral values
Cooperation
complete an argument given a premise and the conclusion.Specify that these three forms of arguments are deductions based on two premises only.
Argument Form I Premise 1: All A are B.
Premise 2: C is A.
Conclusion: C is B.
Argument Form II :Premise 1: If p, then q.
Premise 2: p is true.
Conclusion: q is true.
Argument Form III :Premise 1: If p, then q.
Premise 2: Not q is true.
Conclusion: Not p is true.
10
8/3/2019 Yearly Plan Maths F4 (1)
http://slidepdf.com/reader/full/yearly-plan-maths-f4-1 11/22
Vocabulary
Argument
Premise
Conclusion
Teaching Aids
i. Multimediaunderstand and use the concept of deduction and induction to solve problems.determine whether a conclusion is made through:
a) reasoning by deduction;
reasoning by induction;Ccts
Justifying
Making conclusion
Moral values
ii. Cooperationmake a conclusion for a specific case based on a given general statement, by deduction;
iii. make a generalization based on the pattern of a numerical sequence, by induction;
Limit to cases where formulae can be induced.Teaching aids
Multimediause deduction and induction in problem solving.Specify that:
• making conclusion by deduction is definite;
making conclusion by induction is not necessarily definite.VocabularyReasoning
Deduction
Induction
Pattern
Special conclusion
General statement
General conclusion
Specific case
Numerical sequence
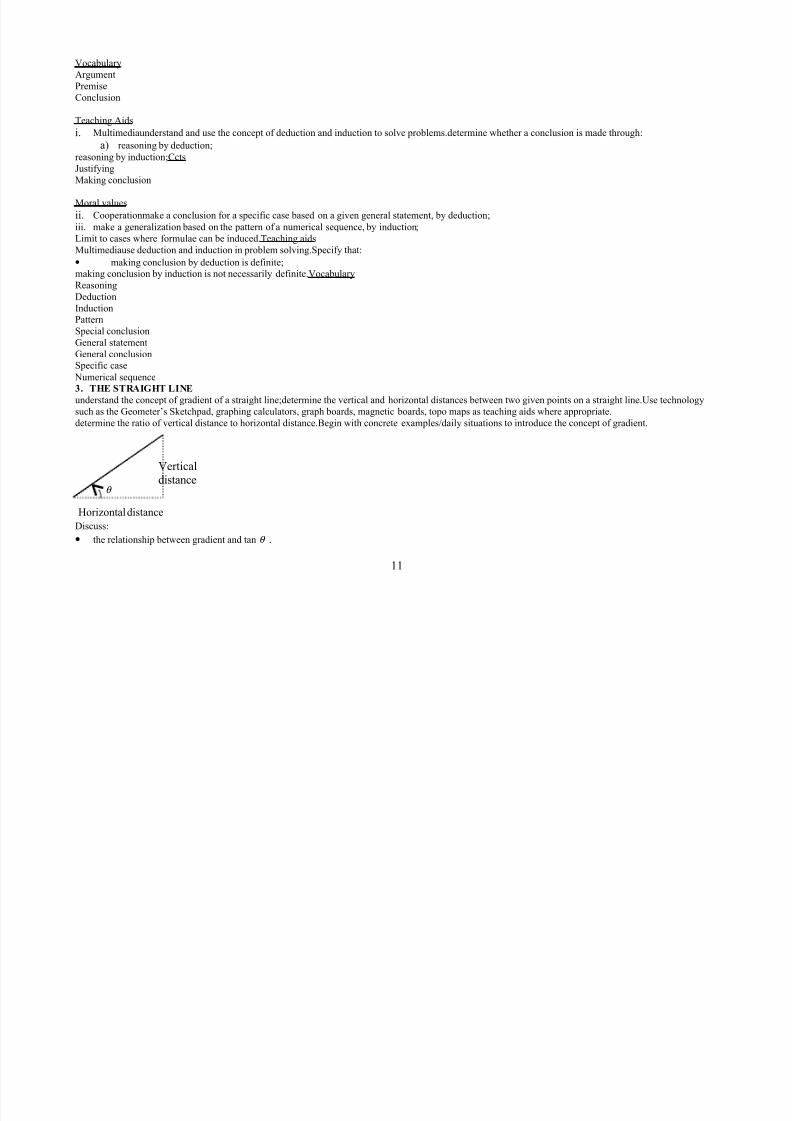
3. THE STRAIGHT LINE
understand the concept of gradient of a straight line;determine the vertical and horizontal distances between two given points on a straight line.Use technology
such as the Geometer’s Sketchpad, graphing calculators, graph boards, magnetic boards, topo maps as teaching aids where appropriate.determine the ratio of vertical distance to horizontal distance.Begin with concrete examples/daily situations to introduce the concept of gradient.
Discuss:
• the relationship between gradient and tan θ .
11
Verticaldistance
Horizontal distance
θ

8/3/2019 Yearly Plan Maths F4 (1)
http://slidepdf.com/reader/full/yearly-plan-maths-f4-1 12/22
• the steepness of the straight line with different values of gradient.
Carry out activities to find the ratio of vertical distance to horizontal distance for several pairs of points on a straight line to conclude that the ratio is constant.
understand the concept of gradient of a straight line in Cartesian coordinates;derive the formula for the gradient of a straight line;Discuss the value of gradient if
• P is chosen as ( x1, y1) and Q is ( x2, y2);
• P is chosen as ( x2, y2) and Q is ( x1, y1).
The gradient of a straight line passing through P ( x1, y1) and
Q( x2, y2) is:
12
12
x x
y ym
−
−
=
calculate the gradient of a straight line passing through two points;determine the relationship between the value of the gradient and the:
e) steepness,
f) direction of inclination,
of a straight line;
understand the concept of intercept;determine the x-intercept and the y-intercept of a straight line;Emphasise that the x-intercept and the y-intercept are not
written in the form of coordinates.
i. derive the formula for the gradient of a straight line in terms of the x-intercept and the y-intercept;
ii. perform calculations involving gradient, x-intercept and y-intercept;
5.1 understand and use equation of a straight line;
draw the graph given an equation of the form y = mx + c;Discuss the change in the form of the straight line if the values of m and c are changed.
Emphasise that the graph obtained is a straight line.
determine whether a given point lies on a specific straight line;Carry out activities using the graphing calculator, Geometer’s Sketchpad or other teaching aids.
If a point lies on a straight line, then the coordinates of the point satisfy the equation of the straight line.
write the equation of the straight line given the gradient and y-intercept;Verify that m is the gradient and c is the y-intercept of a straight line with equation y=mx+ c .
i. determine the gradient and y-intercept of the straight line which equation is of the form:
a. y = mx + c;
b. ax + by = c;
The equation
ax + by = c can be written in the form
ii. y = mx + c.find the equation of the straight line which:
12

8/3/2019 Yearly Plan Maths F4 (1)
http://slidepdf.com/reader/full/yearly-plan-maths-f4-1 13/22
a) is parallel to the x-axis;
b) is parallel to the y-axis;
c) passes through a given point and has a specific gradient;
d) passes through two given points;
iii. find the point of intersection of two straight lines by:
a) drawing the two straight lines;
solving simultaneous equations.Discuss and conclude that the point of intersection is the only point that satisfies both equations.
Use the graphing calculator and Geometer’s Sketchpad or other teaching aids to find the point of intersection.
understand and use the concept of parallel linesverify that two parallel lines have the same gradient and vice versa;Explore properties of parallel lines using the
graphing calculator and Geometer’s Sketchpad or other teaching aids.
i. determine from the given equations whether two straight lines are parallel;
ii. find the equation of the straight line which passes through a given point and is parallel to another straight line;
iii. solve problems involving equations of straight lines.
4. STATISTICS
understand the concept of class interval;complete the class interval for a set of data given one of the class intervals;Use data obtained from activities and other
sources such as research studies to introduce the concept of class interval.
i. determine:
c) the upper limit and lower limit;
d) the upper boundary and lower boundary of a class in a grouped data;
calculate the size of a class interval;Size of class interval
=[upper boundary–lower boundary]
ii. determine the class interval, given a set of data and the number of classes;
iii. determine a suitable class interval for a given set of data;
construct a frequency table for a given set of data.Discuss criteria for suitable class intervals.
6.1 understand and use the concept of mode and mean of grouped data;
determine the modal class from the frequency table of grouped data;calculate the midpoint of a class;Midpoint of class
=
2
1(lower limit + upper limit)
i. verify the formula for the mean of grouped data;
ii. calculate the mean from the frequency table of grouped data;
iii. discuss the effect of the size of class interval on the accuracy of the mean for a specific set of grouped data..
6.3 represent and interpret data in histograms with class intervals of the same size to solve problems;
draw a histogram based on the frequency table of a grouped data;Discuss the difference between histogram and bar chart.interpret information from a given
histogram;Use graphing calculator to explore the effect of different class interval on histogram.
i. solve problems involving histograms.
i. Include everyday life situations.represent and interpret data in frequency polygons to solve problems.draw the frequency polygon based on:
)a a histogram;
)b a frequency table;
13
8/3/2019 Yearly Plan Maths F4 (1)
http://slidepdf.com/reader/full/yearly-plan-maths-f4-1 14/22
When drawing a frequency polygon add a class with 0 frequency before the first class and after the last class.interpret information from a given frequency
polygon;
solve problems involving frequency polygon.Include everyday life situations.
understand the concept of cumulative frequency;construct the cumulative frequency table for:
ungrouped data;grouped data;draw the ogive for:
ungrouped data;
grouped data;When drawing ogive:use the upper boundaries;
add a class with zero frequency before the first class.understand and use the concept of measures of dispersion to solve problems.determine the range of a set of data.For grouped data:
Range = [midpoint of the last class – midpoint of the first class]Discuss the meaning of dispersion by comparing a few sets of data. Graphing calculator can be used for this purpose.
CctsInterpretingDescribing
Identifying informationdetermine:
the median;
the first quartile;the third quartile;
the interquartile range;from the ogive.Moral values
CooperationDevelop social skills
Mental & physical cleanliness
RationalitySystematicinterpret information from an ogive;
solve problems involving data representations and measures of dispersion.Carry out a project/research and analyse as well as interpret the data. Present the findings of the project/research.
Emphasise the importance of honesty and accuracy in managing statistical researchTeaching aids Courseware
Graphing calculator Statistical data
14

8/3/2019 Yearly Plan Maths F4 (1)
http://slidepdf.com/reader/full/yearly-plan-maths-f4-1 15/22
PROBABILITY
understand the concept of sample space;determine whether an outcome is a possible outcome of an experiment;Use concrete examples
such as throwing a die and tossing a coin.list all the possible outcomes of an experiment:
from activities; by reasoning;
determine the sample space of an experiment;write the sample space by using set notations
understand the concept of events.identify the elements of a sample space which satisfy given conditions;An impossible event is an
empty set.Discuss that an event is a subset of the sample space.
Discuss also impossible events for a sample space.list all the elements of a sample space which satisfy certain conditions using set notations;
determine whether an event is possible for a sample space.
Discuss that the sample space itself is an event.understand and use the concept of probability of an event to solve problems.find theratio of the number of times an event occurs to the number of trials;Probability is obtained from activities and appropriate data.
Carry out activities to introduce the concept of probability. The graphing calculator can be used to simulate such activities.find the probability of an event from a big enough number of trials;
calculate the expected number of times an event will occur, given the probability of the event and number of trials;Discuss situationwhich results in:
probability of event = 1.
probability of event = 0.solve problems involving probabilityEmphasise that the value of probability is between 0 and 1.
predict the occurrence of an outcome and make a decision based on known information.Predict possible events which might occur indaily situations.
CIRCLES IIIunderstand and use the concept of tangents to a circle.identify tangents to a circle;Develop concepts and abilities through activities
using technology such as the Geometer’s Sketchpad and graphing calculator.Teaching aids
CompassGeometry set
Gspmake inference that the tangent to a circle is a straight line perpendicular to the radius that passes through the contact point;
construct the tangent to a circle passing through a point:on the circumference of the circle;
15

8/3/2019 Yearly Plan Maths F4 (1)
http://slidepdf.com/reader/full/yearly-plan-maths-f4-1 16/22
outside the circle;Ccts
Making inference
Drawing diagramdetermine the properties related to two tangents to a circle from a given point outside the circle;Properties of angle insemicircles can be used. Examples of properties of two tangents to a circle:
AC = BC(ACO = (BCO
(AOC = (BOC(AOC and (BOC are congruent.Vocabulary
Tangent to a circle
CirclePerpendicular
RadiusCircumference
Semi circle
Congruent
solve problems involving tangents to a circle.Relate to Pythagoras theorem.
understand and use the properties of angle between tangent and chord to solve problems.identify the angle in the alternate segment
which is subtended by the chord through the contact point of the tangent;
Explore the property of angle in alternate segment using Geometer’s Sketchpad or other teaching aids.
VocabularyChords
Alternate segment
Major sector Subtended
16
A
B
O C
E
D
A B C

8/3/2019 Yearly Plan Maths F4 (1)
http://slidepdf.com/reader/full/yearly-plan-maths-f4-1 17/22
Moral values
Diligence
CooperationCourage
verify the relationship between the angle formed by the tangent and the chord with the angle in the alternate segment which issubtended by the chord;
( ABE = ( BDE( CBD = ( BEDCcts
Identifying information
Justify relationshipsProblem solvingperform calculations involving the angle in alternate segment
solve problems involving tangent to a circle and angle in alternate segment.understand and use the properties of common tangents to solve problems.determine the number of common tangents which can be
drawn to two circles which:
intersect at two points;intersect only at one point;
do not intersect;Emphasise that the lengths of common tangents are equal.Discuss the maximum number of common tangents for the three cases.Vocabulary
Common tangent
Ccts
Identifying informationJustify
RelationshipsProblem solving
determine the properties related to the common tangent to two circles which:intersect at two points;intersect only at one point;
do not intersect;Include daily situations.
Moral valuesDiligence
Cooperation
Couragesolve problems involving common tangents to two circles;Teaching aids
17

8/3/2019 Yearly Plan Maths F4 (1)
http://slidepdf.com/reader/full/yearly-plan-maths-f4-1 18/22
GspGraphmatica
solve problems involving tangents and common tangents.Include problems involving Pythagoras theorem.
TRIGONIMETRY IIunderstand and use the concept of the values of sin (, cos ( and tan ( (0( ( ( ( 360() to solve problems.identify the quadrants and angles
in the unit circle;The unit circle is the circle of radius 1 with its centre at the origin.Explain the meaning of unit circle.
CctsIdentifying information
Justify relationships
Making connectiondetermine:
the value of y-coordinate;the value of x-coordinate;
the ratio of y-coordinate to x-coordinate;
of several points on the circumference of the unit circle;
verify that, for an angle in quadrant I of the unit circle :
18
0
y
x
P (x,y)
y1
x Q

8/3/2019 Yearly Plan Maths F4 (1)
http://slidepdf.com/reader/full/yearly-plan-maths-f4-1 19/22
sin ( = y-coordinate ;cos( = x-coordinate.
µ §;Begin with definitions of sine, cosine and tangent of an acute angle.
µ §µ §
µ §determine the values of
sine;cosine;
tangent;
of an angle in quadrant I of the unit circle;determine the values of sin (;
cos (;tan (;
for 90( ( ( ( 360(;Explain that the concept
sin ( = y-coordinate ;cos( = x-coordinate;
µ §can be extended to angles in
quadrant II, III and IV.Vocabulary
Quadrant
Sine (Cosine (
Tan (determine whether the values of:
sine;cosine;tangent,
of an angle in a specific quadrant is positive or negative;Consider special angles such as 0(, 30(, 45(, 60(, 90(, 180(, 270(, 360(.determine the values of sine, cosine and tangent for special angles;Use the above triangles to find the values of sine, cosine and
tangent for 30(, 45(, 60(.determine the values of the angles in quadrant I which correspond to the values of the angles in other quadrants;Teaching can be expanded through activities such as reflection.
state the relationships between the values of:sine;
19
1√2
45o
1
60o
30o
1
2
√3
8/3/2019 Yearly Plan Maths F4 (1)
http://slidepdf.com/reader/full/yearly-plan-maths-f4-1 20/22
cosine; andtangent;
of angles in quadrant II, III and IV with their respective values of the corresponding angle in quadrant I;
Use the Geometer’s Sketchpad to explore the change in the values of sine, cosine and tangent relative to the change in angles.find the values of sine, cosine and tangent of the angles between 90( and 360(;Teaching aids
GspGraph paper
GraphmaticaGeometry setfind the angles between 0( and 360(, given the values of sine, cosine or tangent;
solve problems involving sine, cosine and tangent.Relate to daily situations.
9.2 draw and use the graphs of sine, cosine and tangent.draw the graphs of sine, cosine and tangent for angles between 0( and
360(;Use the graphing calculator and Geometer’s Sketchpad to explore the feature of the graphs of y = sin (, y = cos (, y = tan (.Ccts
Problem solving
Compare and contrastDrawing graphs
compare the graphs of sine, cosine and tangent for angles between 0( and 360(;Discuss the feature of the graphs of y = sin(, y = cos(, y = tan(.
Moral valuesCooperation
Honesty
DiligenceIntegritysolve problems involving graphs of sine, cosine and tangent.solve problems involving graphs of sine, cosine and tangent.
ANGLES OF ELEVATIONS AND DEPRESSION10.1 understand and use the concept of angle of elevation and angle of depressionto solve problems.identify:
the horizontal line;the angle of elevation;the angle of depression,
for a particular situation;Use daily situations to introduce the concept.CctsWorking out mentally
Compare and contrastIdentifying relationship
Decision making
Problem solvingRepresent a particular situation involving:
20
8/3/2019 Yearly Plan Maths F4 (1)
http://slidepdf.com/reader/full/yearly-plan-maths-f4-1 21/22
the angle of elevation;the angle of depression, using diagrams;Include two observations on the same horizontal plane.Vocabulary
Angle of elevation
Angle of depressionHorizontal line
Moral valuesRationality
Cooperation
Solve problems involving the angle of elevation and the angle of depression.Involve activities outside the classroom.Teaching aids:Models
Cd coursewareLINES AND PLANES IN 3-DIMENSIONS11.1 understand and use the concept of angle between lines and planes to solve
problemsidentify planes;Carry out activities using daily situations and 3-dimensional models.Ccts
Describing
InterpretingDrawing diagramsProblem solving
identify horizontal planes, vertical planes and inclined planes;Differentiate between 2-dimensional and 3-dimensional shapes. Involve planes found in natural surroundings.Moral values
Respect
Cooperationsketch a three dimensional shape and identify the specific planes;Approaches
ConstructivismExploratory
Cooperative learningidentify:lines that lies on a plane;
lines that intersect with a plane;VocabularyHorizontal plane
Vertical plane3-dimensional
Normal to a plane
Orthogonal projectionSpace diagonal
21

8/3/2019 Yearly Plan Maths F4 (1)
http://slidepdf.com/reader/full/yearly-plan-maths-f4-1 22/22
Angle between two planesidentify normals to a given plane;
determine the orthogonal projection of a line on a plane;
Begin with 3-dimensional models.draw and name the orthogonal projection of a line on a plane;Include lines in 3-dimensional shapes.determine the angle between a line and a plane;
solve problems involving the angle between a line and a plane.Use 3-dimensional models to give clearer pictures.11.2 understand and use the concept of angle between two planes to solve problems.
identify the line of intersection between two planes;draw a line on each plane which is perpendicular to the line of intersection of thetwo planes at a point on the line of intersection;
determine the angle between two planes on a model and a given diagram;
Use 3-dimensional models to give clearer pictures.solve problems involving lines and planes in 3-dimensional shapes.
22