Embed Size (px)
Citation preview
Yield Gap Analysis:Implications for Research and Policy
Kenneth G. CassmanHeuermann Professor of Agronomy, andDirector, NE Center for Energy Sciences
University of Nebraska—Lincolnwww.ncesr.unl.edu
Drier savanna
Moist savanna
Humid forest
Midaltitude savanna
What do these have in common?
• Ensuring global food security in face of climate change
• Land use and indirect land use change– Impact of climate change on agriculture and
vica versa• Competition between food and biofuel• Conservation of natural ecosystems and
biodiversity
EACH DEPENDS ON RATE OF GAIN IN CROP YIELDS ON EXISTING FARM LAND
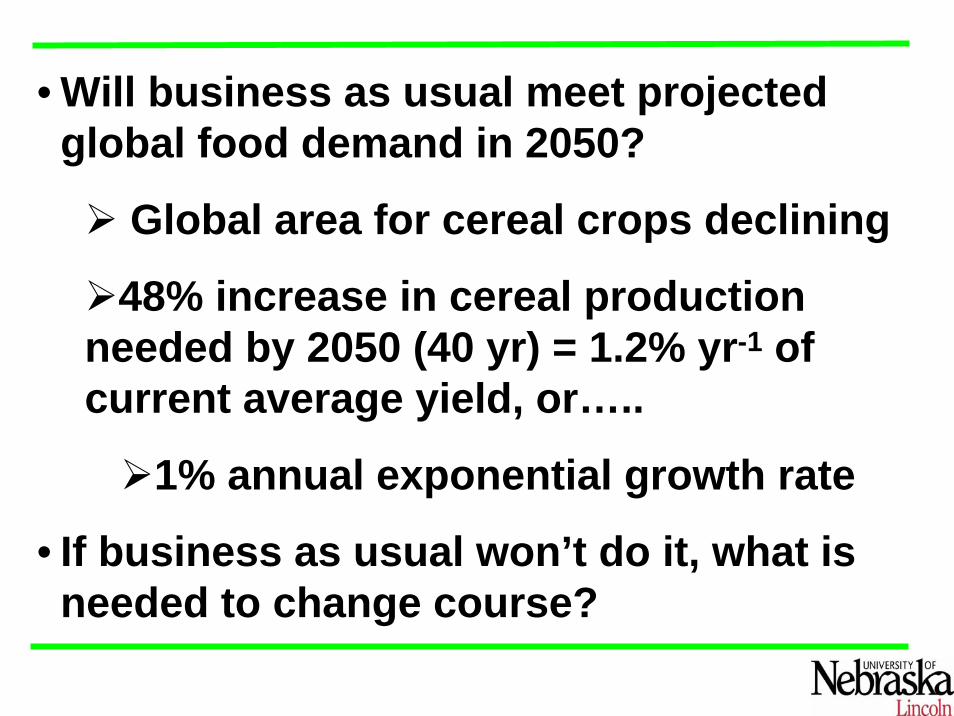
• Will business as usual meet projected global food demand in 2050?
Global area for cereal crops declining
48% increase in cereal production needed by 2050 (40 yr) = 1.2% yr-1 of current average yield, or…..
1% annual exponential growth rate
• If business as usual won’t do it, what is needed to change course?
Year1960 1970 1980 1990 2000 2010
Gra
in h
arve
sted
are
a (M
ha)
400
500
600
700
800
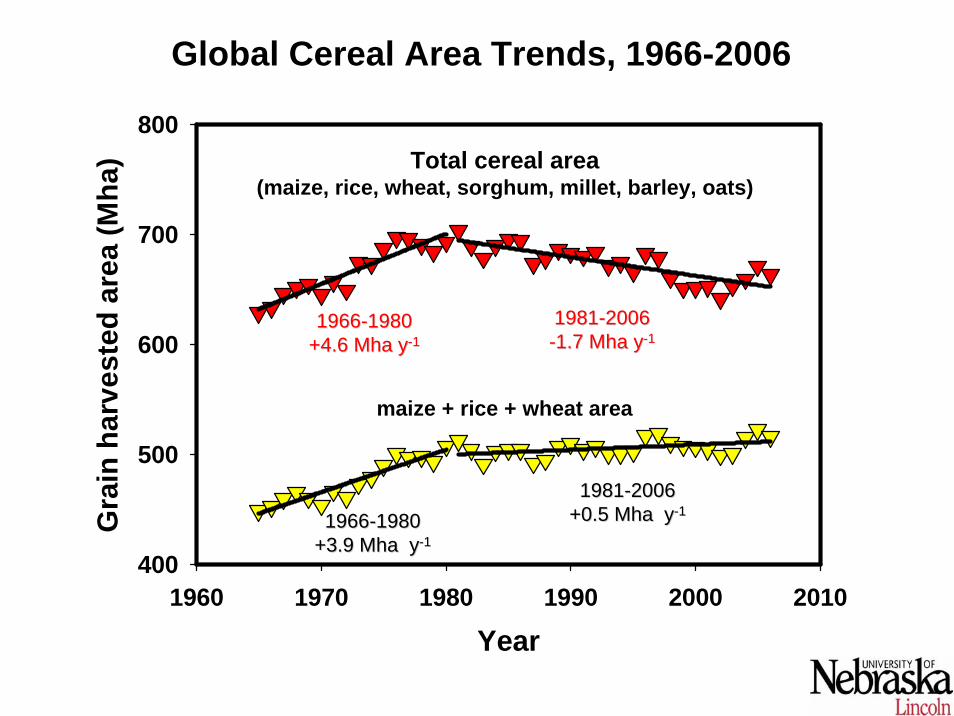
Global Cereal Area Trends, 1966-2006
Total cereal area(maize, rice, wheat, sorghum, millet, barley, oats)
19661966--19801980+4.6 +4.6 MhaMha yy--11
19811981--20062006--1.7 1.7 MhaMha yy--11
maize + rice + wheat area
19661966--19801980+3.9 +3.9 MhaMha yy--11
19811981--20062006+0.5 +0.5 MhaMha yy--11
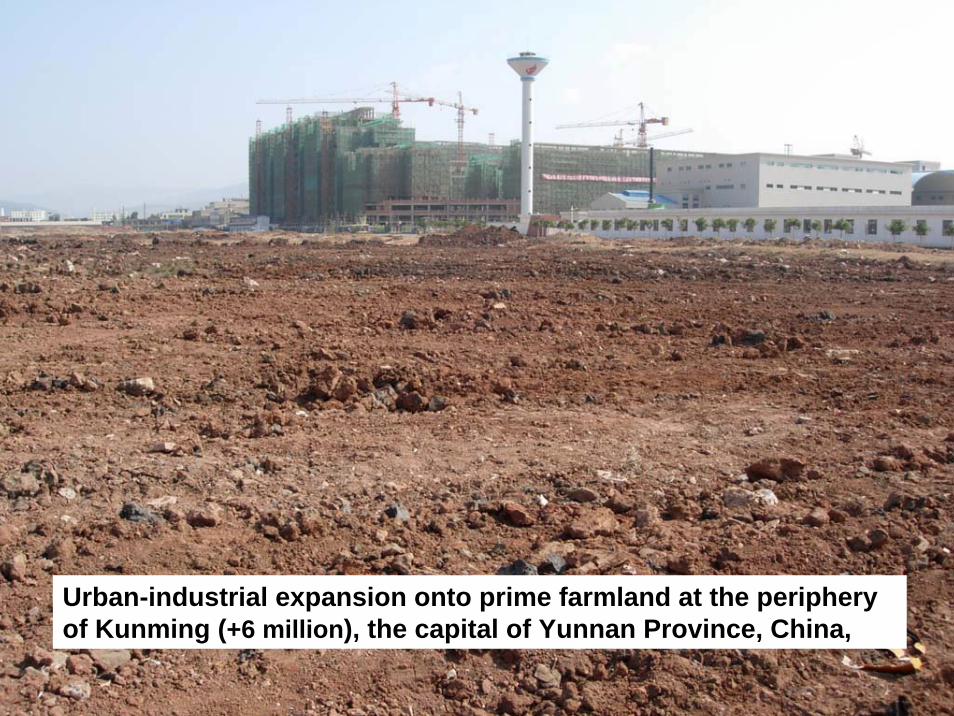
Urban-industrial expansion onto prime farmland at the periphery of Kunming (+6 million), the capital of Yunnan Province, China,
Year1966 1976 1986 1996 2006
Gra
in Y
ield
(kg
ha-1
)
1000
2000
3000
4000
5000
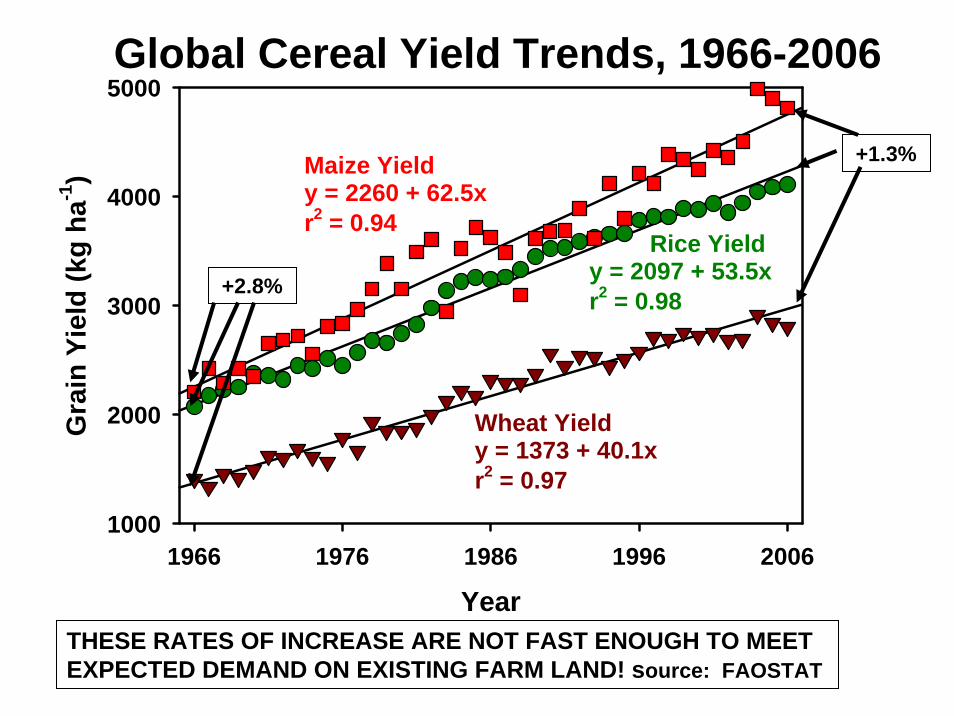
Maize Yieldy = 2260 + 62.5xr2 = 0.94
Rice Yieldy = 2097 + 53.5xr2 = 0.98
Wheat Yieldy = 1373 + 40.1xr2 = 0.97
Global Cereal Yield Trends, 1966-2006
THESE RATES OF INCREASE ARE NOT FAST ENOUGH TO MEET EXPECTED DEMAND ON EXISTING FARM LAND! source: FAOSTAT
+2.8%
+1.3%
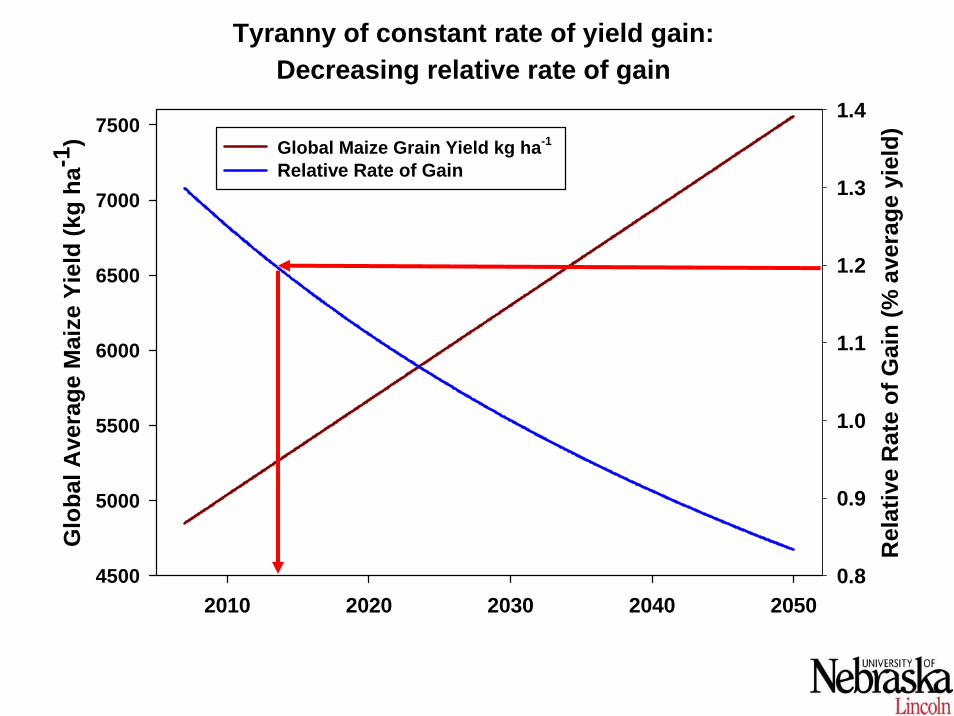
2010 2020 2030 2040 2050
Glo
bal A
vera
ge M
aize
Yie
ld (k
g ha
-1)
4500
5000
5500
6000
6500
7000
7500
Rel
ativ
e R
ate
of G
ain
(% a
vera
ge y
ield
)
0.8
0.9
1.0
1.1
1.2
1.3
1.4Global Maize Grain Yield kg ha-1 Relative Rate of Gain
Tyranny of constant rate of yield gain:Decreasing relative rate of gain
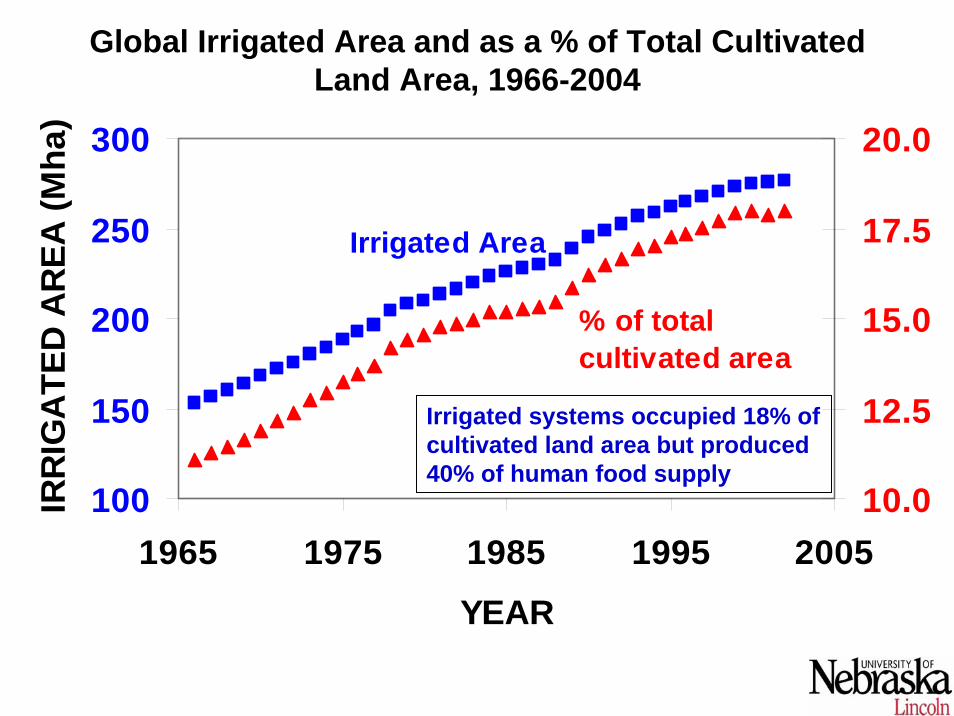
100
150
200
250
300
1965 1975 1985 1995 2005
YEAR
IRR
IGA
TED
AR
EA (M
ha)
10.0
12.5
15.0
17.5
20.0
Irrigated Area
% of total cultivated area
Global Irrigated Area and as a % of Total Cultivated Land Area, 1966-2004
Irrigated systems occupied 18% of cultivated land area but produced 40% of human food supply
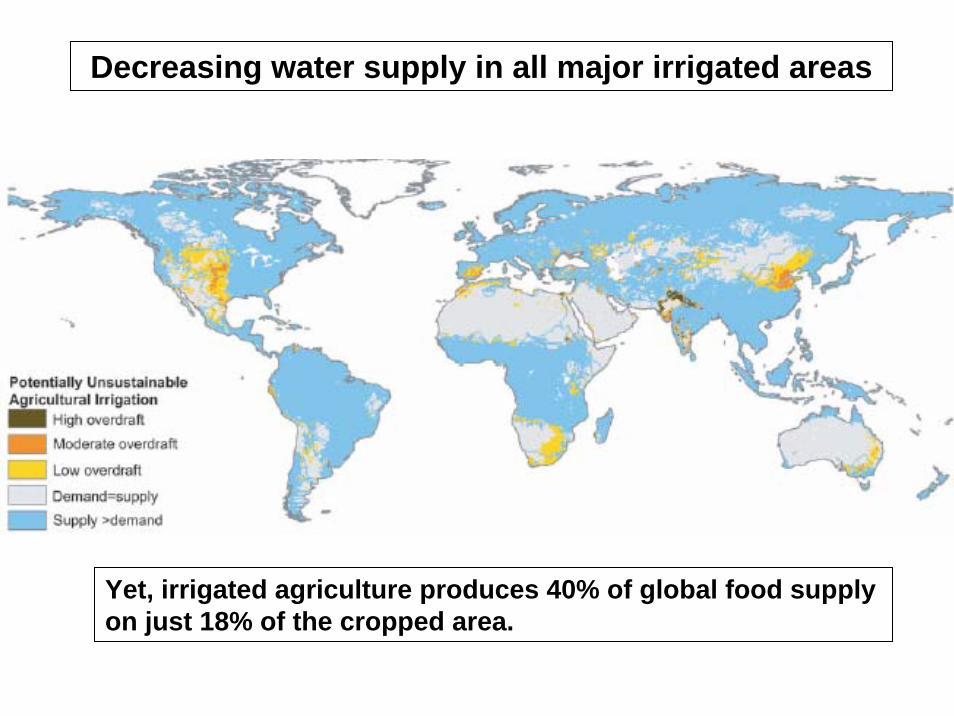
Decreasing water supply in all major irrigated areas
Yet, irrigated agriculture produces 40% of global food supply on just 18% of the cropped area.
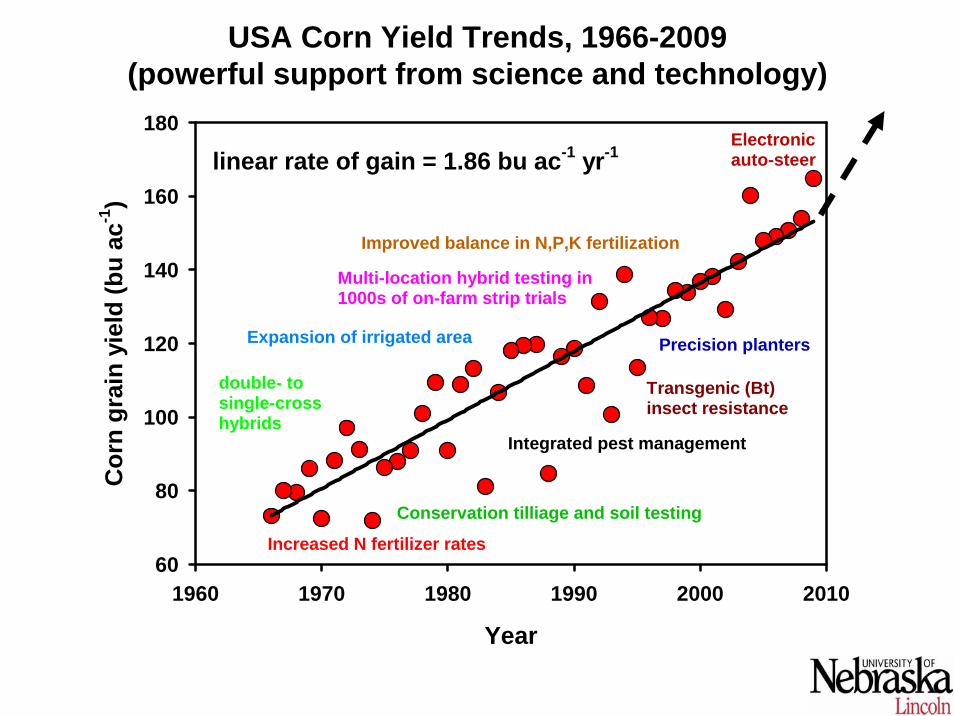
Year
1960 1970 1980 1990 2000 2010
Cor
n gr
ain
yiel
d (b
u ac
-1)
60
80
100
120
140
160
180
linear rate of gain = 1.86 bu ac-1 yr-1
double- to single-crosshybrids
Expansion of irrigated area
Conservation tilliage and soil testing
Increased N fertilizer rates
Improved balance in N,P,K fertilization
Precision planters
Transgenic (Bt)insect resistance
Electronicauto-steer
Multi-location hybrid testing in1000s of on-farm strip trials
Integrated pest management
USA Corn Yield Trends, 1966-2009(powerful support from science and technology)
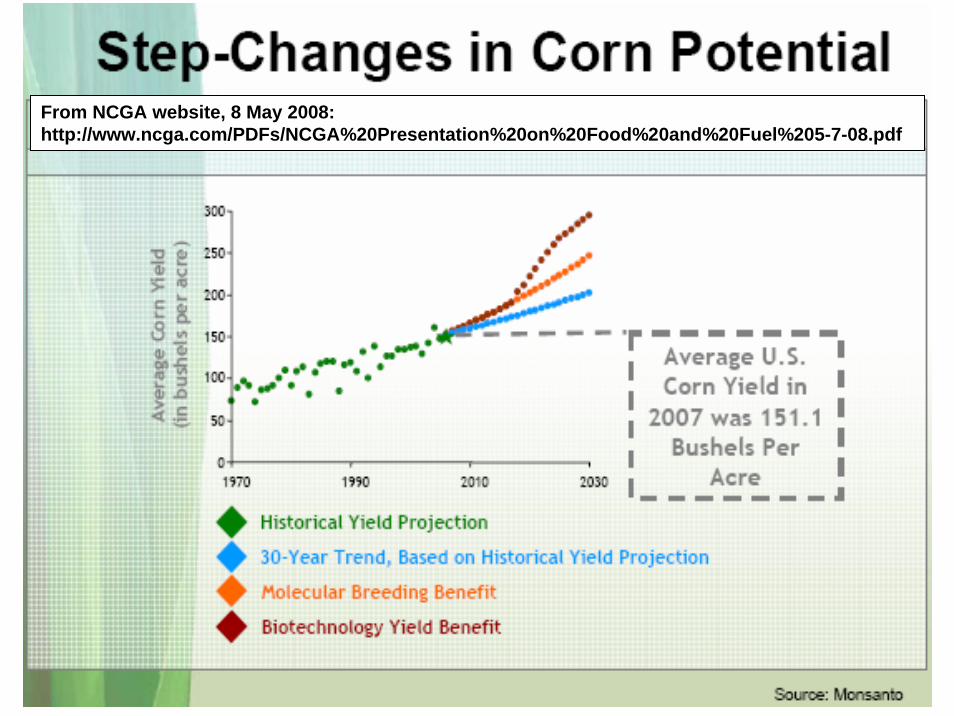
From NCGA website, 8 May 2008: http://www.ncga.com/PDFs/NCGA%20Presentation%20on%20Food%20and%20Fuel%205-7-08.pdf
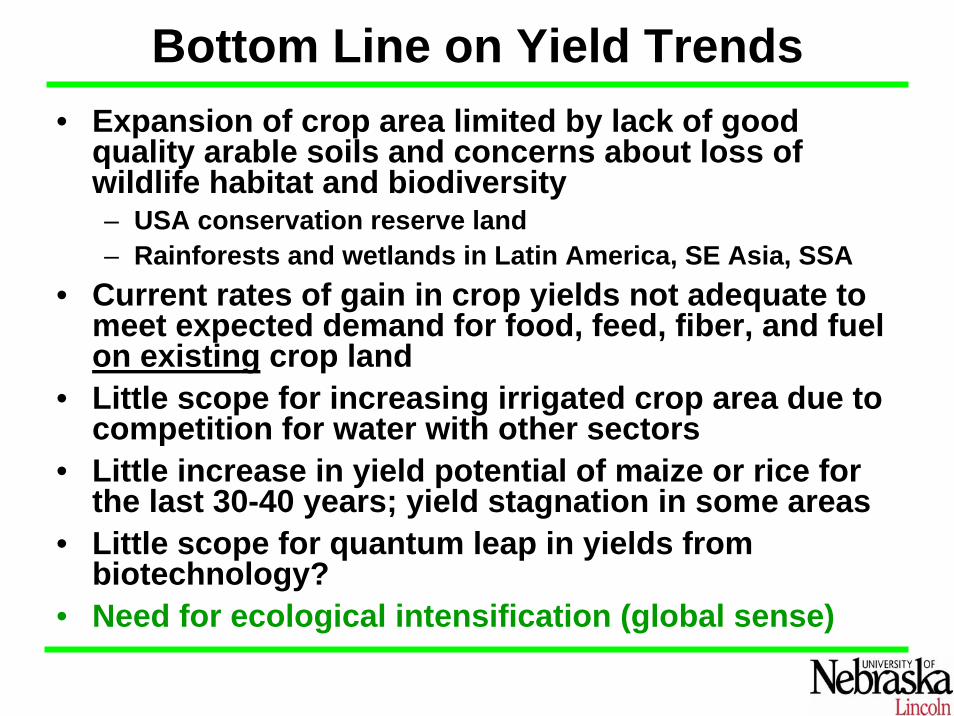
Bottom Line on Yield Trends• Expansion of crop area limited by lack of good
quality arable soils and concerns about loss of wildlife habitat and biodiversity– USA conservation reserve land– Rainforests and wetlands in Latin America, SE Asia, SSA
• Current rates of gain in crop yields not adequate to meet expected demand for food, feed, fiber, and fuel on existing crop land
• Little scope for increasing irrigated crop area due to competition for water with other sectors
• Little increase in yield potential of maize or rice for the last 30-40 years; yield stagnation in some areas
• Little scope for quantum leap in yields from biotechnology?
• Need for ecological intensification (global sense)
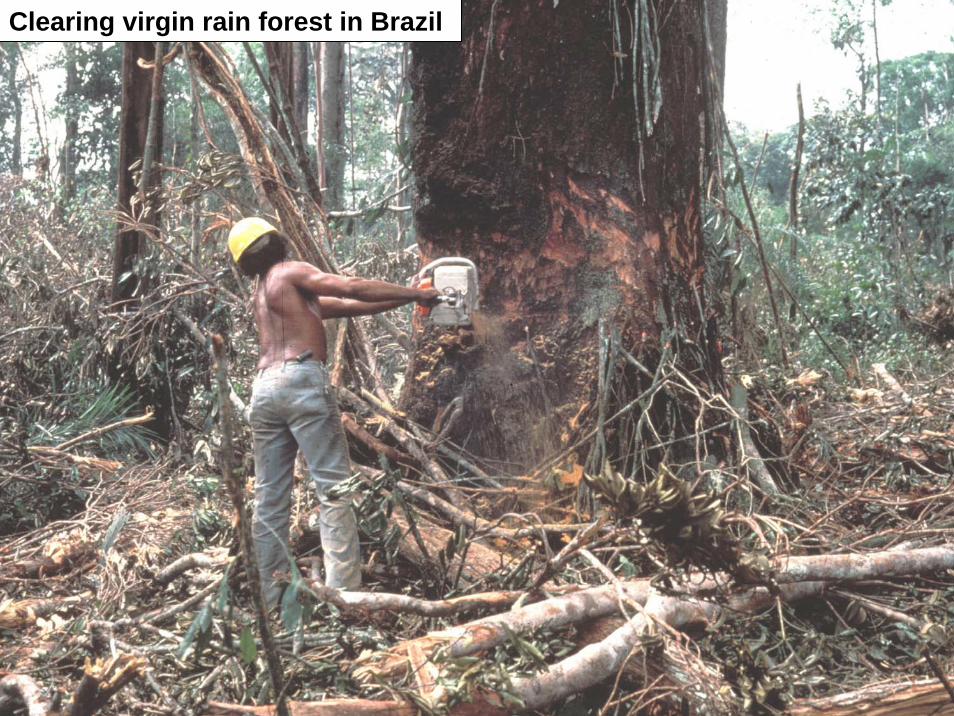
Clearing virgin rain forest in Brazil
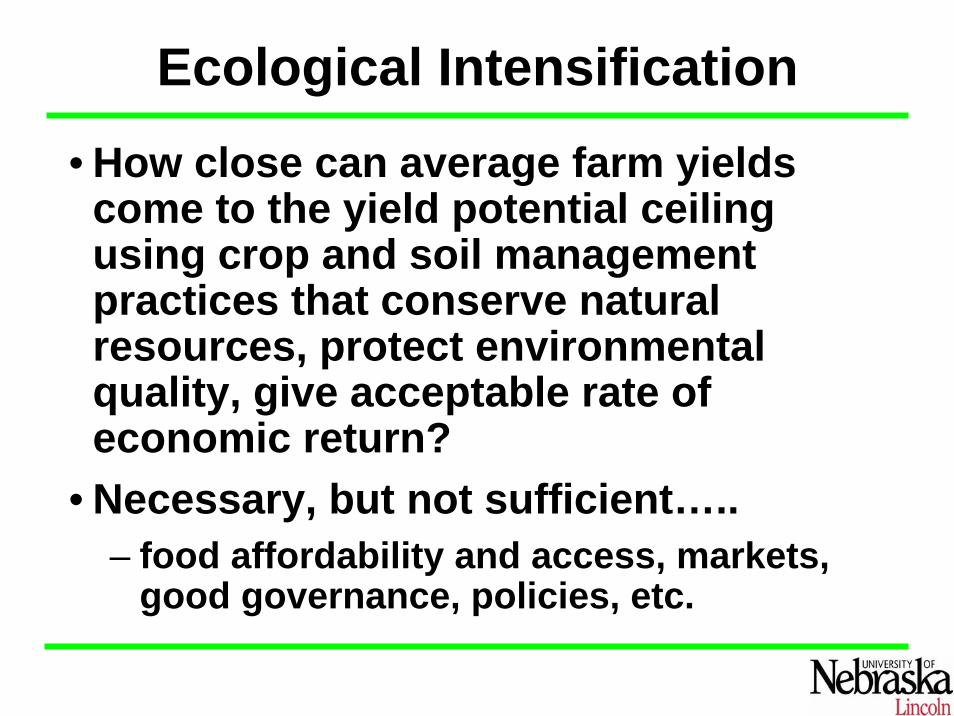
Ecological Intensification• How close can average farm yields
come to the yield potential ceiling using crop and soil management practices that conserve natural resources, protect environmental quality, give acceptable rate of economic return?
• Necessary, but not sufficient…..– food affordability and access, markets,
good governance, policies, etc.
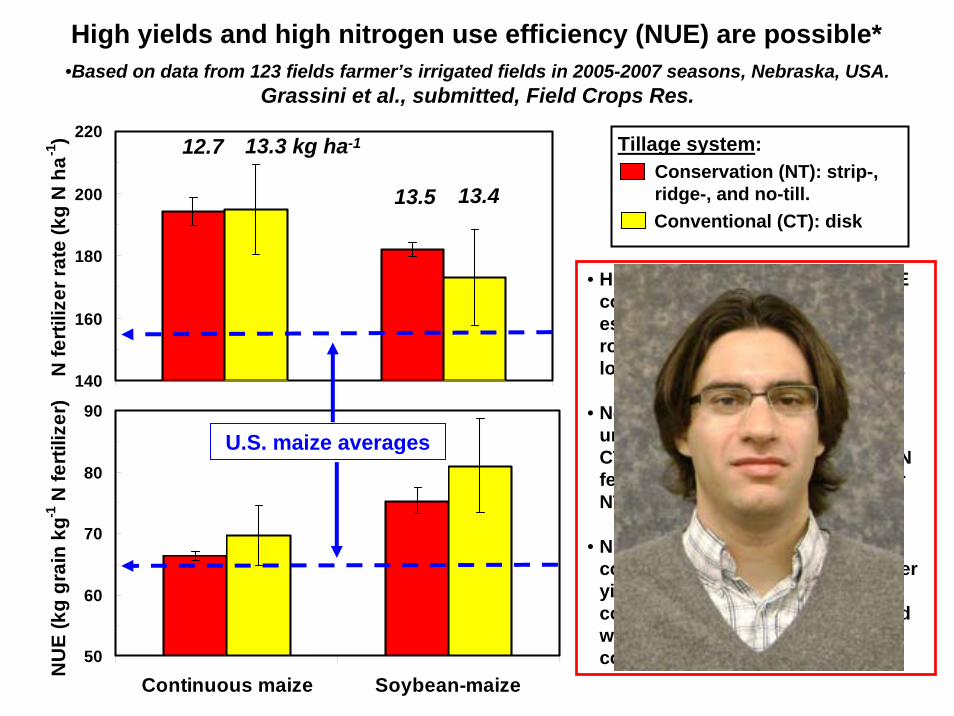
•Based on data from 123 fields farmer’s irrigated fields in 2005-2007 seasons, Nebraska, USA.Grassini et al., submitted, Field Crops Res.
High yields and high nitrogen use efficiency (NUE) are possible*
140
160
180
200
220
Continuous maize Soybean-maize
N fe
rtiliz
er ra
te (k
g N
ha-1
)
50
60
70
80
90
Continuous maize Soybean-maize
NU
E (k
g gr
ain
kg-1
N fe
rtiliz
er)
• Higher N rates but also higher NUE compared to U.S. averages, especially under soybean-corn rotation due to higher yields and lower N rate than continuous corn.
• No difference in N fertilizer rate under continuous corn with NT or CT; under soybean-corn rotation, N fertilizer tended to be higher under NT than CT.
• NUE tended to be higher under conventional tillage due to (i) higher yields at the same N rate under continuous corn and (ii) same yield with lower N rate under soybean-corn rotation.
Conventional (CT): disk
Conservation (NT): strip-, ridge-, and no-till.
Tillage system:12.7 13.3 kg ha-1
13.5 13.4
U.S. maize averages
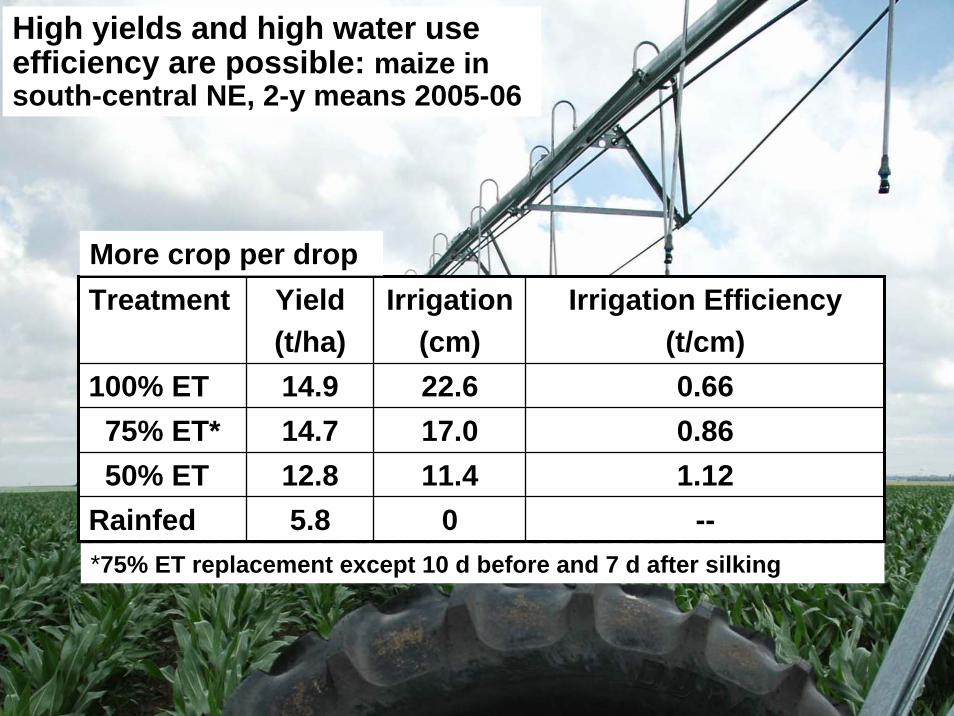
Treatment Yield(t/ha)
Irrigation(cm)
Irrigation Efficiency (t/cm)
100% ET 14.9 22.617.011.4
0
0.6675% ET* 14.7 0.8650% ET 12.8 1.12
Rainfed 5.8 --
More crop per drop
High yields and high water use efficiency are possible: maize in south-central NE, 2-y means 2005-06
*75% ET replacement except 10 d before and 7 d after silking

Ecological Intensification• How close can average farm yields
come to the yield potential ceiling using crop and soil management practices that conserve natural resources, protect environmental quality, give acceptable rate of economic return?
• Necessary, but not sufficient…..– food affordability and access, markets,
good governance, policies, etc.
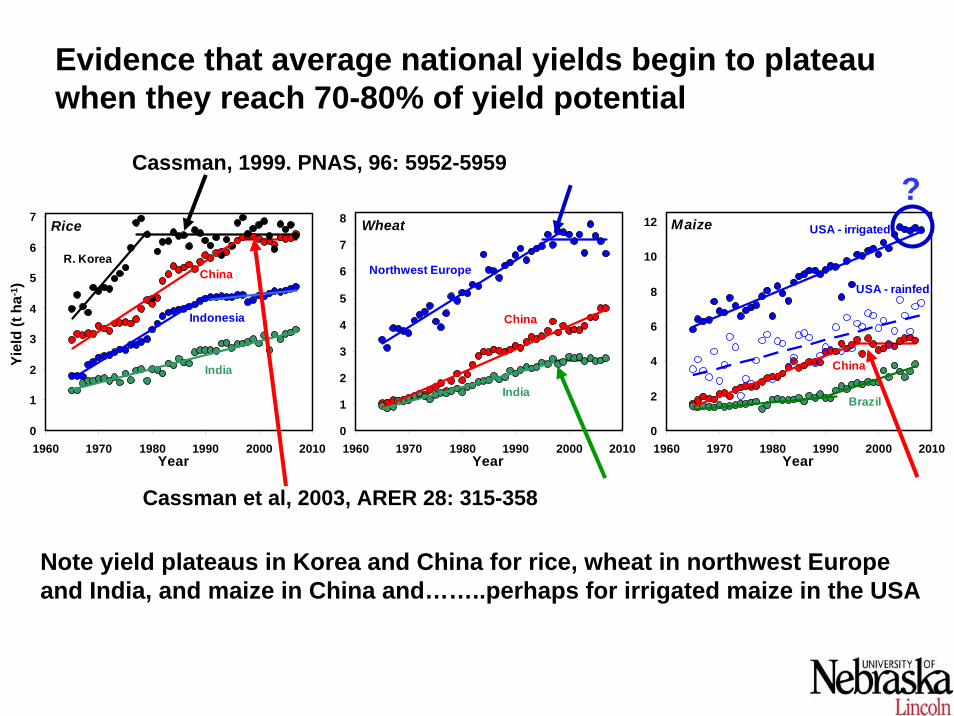
Maize
China
Brazil
USA - rainfed
USA - irrigated
0
2
4
6
8
10
12
1960 1970 1980 1990 2000 2010Year
Wheat
China
India
Northwest Europe
0
1
2
3
4
5
6
7
8
1960 1970 1980 1990 2000 2010Year
Rice
India
R. KoreaChina
Indonesia
0
1
2
3
4
5
6
7
1960 1970 1980 1990 2000 2010Year
Yiel
d (M
g ha
-1)
Yiel
d (t
ha-1
)
Evidence that average national yields begin to plateau when they reach 70-80% of yield potential
Note yield plateaus in Korea and China for rice, wheat in northwest Europe and India, and maize in China and……..perhaps for irrigated maize in the USA
Cassman, 1999. PNAS, 96: 5952-5959 ?
Cassman et al, 2003, ARER 28: 315-358
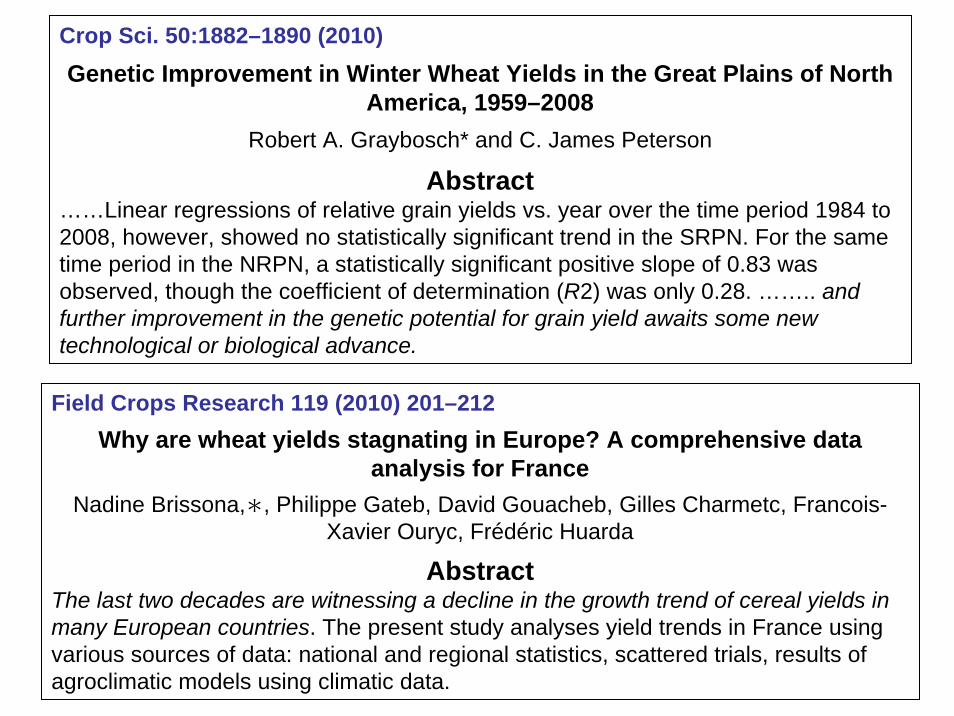
Crop Sci. 50:1882–1890 (2010)Genetic Improvement in Winter Wheat Yields in the Great Plains of North
America, 1959–2008Robert A. Graybosch* and C. James Peterson
Abstract……Linear regressions of relative grain yields vs. year over the time period 1984 to 2008, however, showed no statistically significant trend in the SRPN. For the same time period in the NRPN, a statistically significant positive slope of 0.83 was observed, though the coefficient of determination (R2) was only 0.28. …….. and further improvement in the genetic potential for grain yield awaits some new technological or biological advance.
Field Crops Research 119 (2010) 201–212Why are wheat yields stagnating in Europe? A comprehensive data
analysis for FranceNadine Brissona,∗, Philippe Gateb, David Gouacheb, Gilles Charmetc, Francois-
Xavier Ouryc, Frédéric Huarda
AbstractThe last two decades are witnessing a decline in the growth trend of cereal yields in many European countries. The present study analyses yield trends in France using various sources of data: national and regional statistics, scattered trials, results of agroclimatic models using climatic data.
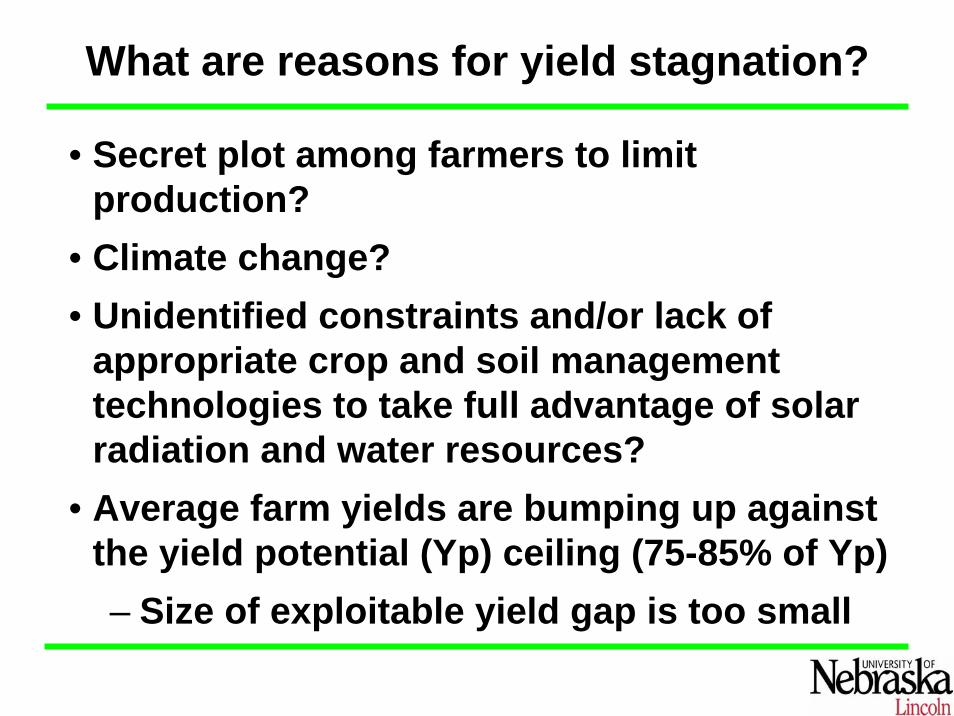
What are reasons for yield stagnation?
• Secret plot among farmers to limit production?
• Climate change?• Unidentified constraints and/or lack of
appropriate crop and soil management technologies to take full advantage of solar radiation and water resources?
• Average farm yields are bumping up against the yield potential (Yp) ceiling (75-85% of Yp)– Size of exploitable yield gap is too small
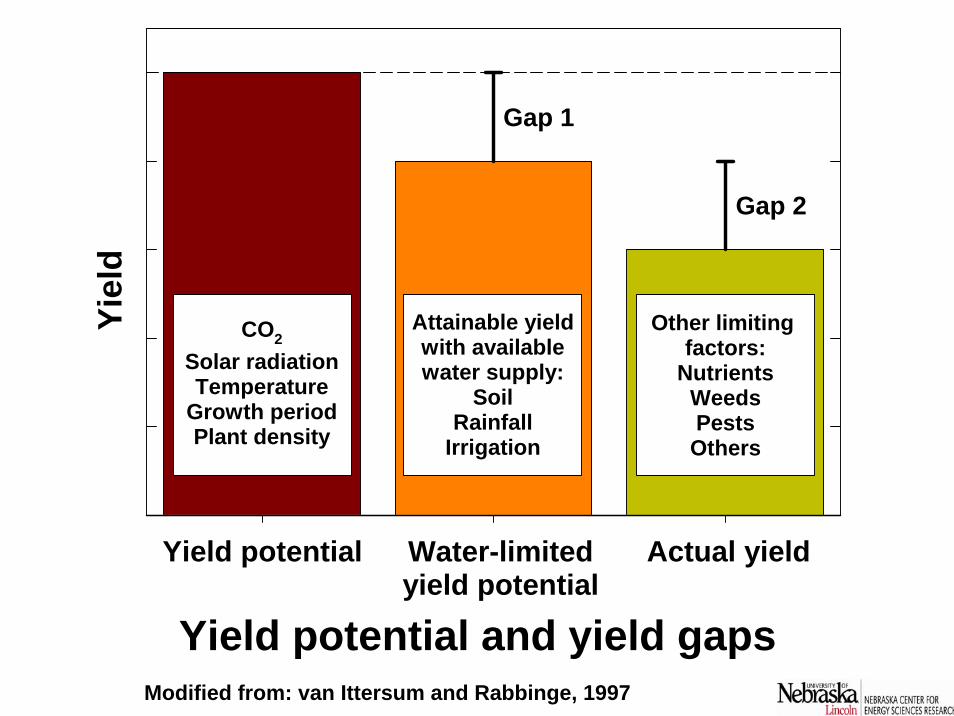
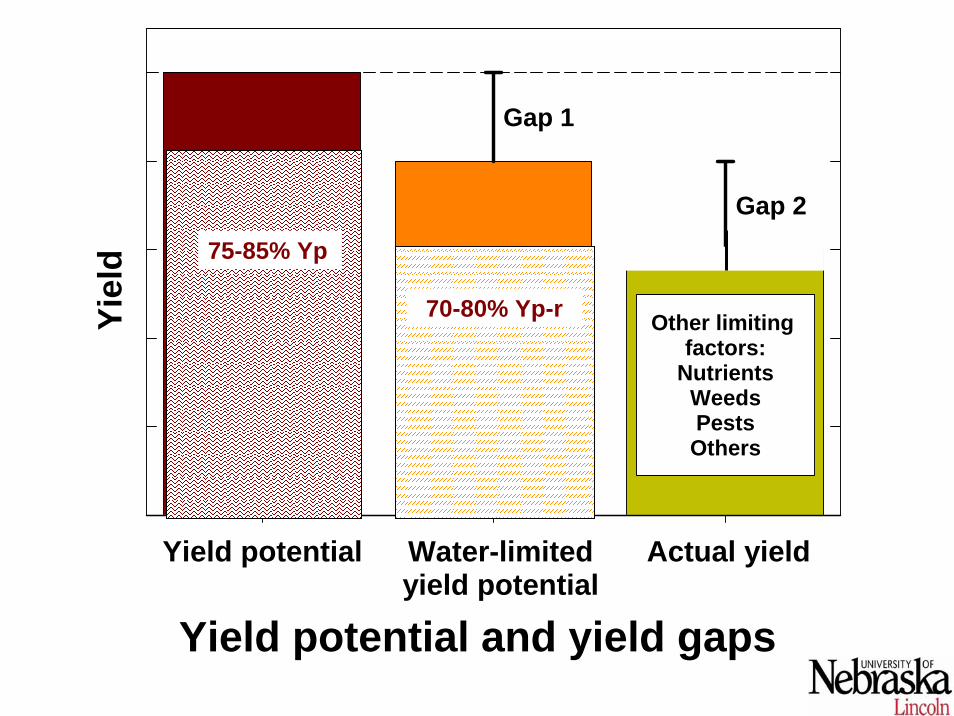
Yield potential and yield gaps
Yiel
dGap 1
Gap 2
Yield potential Water-limitedyield potential
Actual yield
Other limiting factors:
NutrientsWeedsPestsOthers
CO2Solar radiationTemperature
Growth periodPlant density
Attainable yieldwith availablewater supply:
SoilRainfall
Irrigation
Modified from: van Ittersum and Rabbinge, 1997
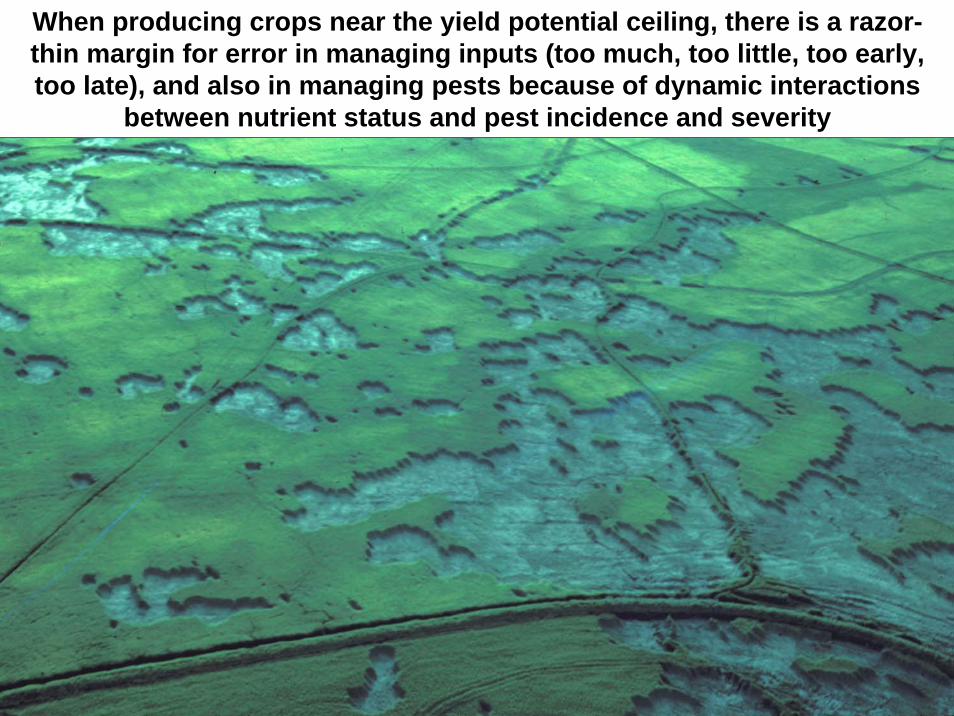
When producing crops near the yield potential ceiling, there is a razor-thin margin for error in managing inputs (too much, too little, too early, too late), and also in managing pests because of dynamic interactions
between nutrient status and pest incidence and severity
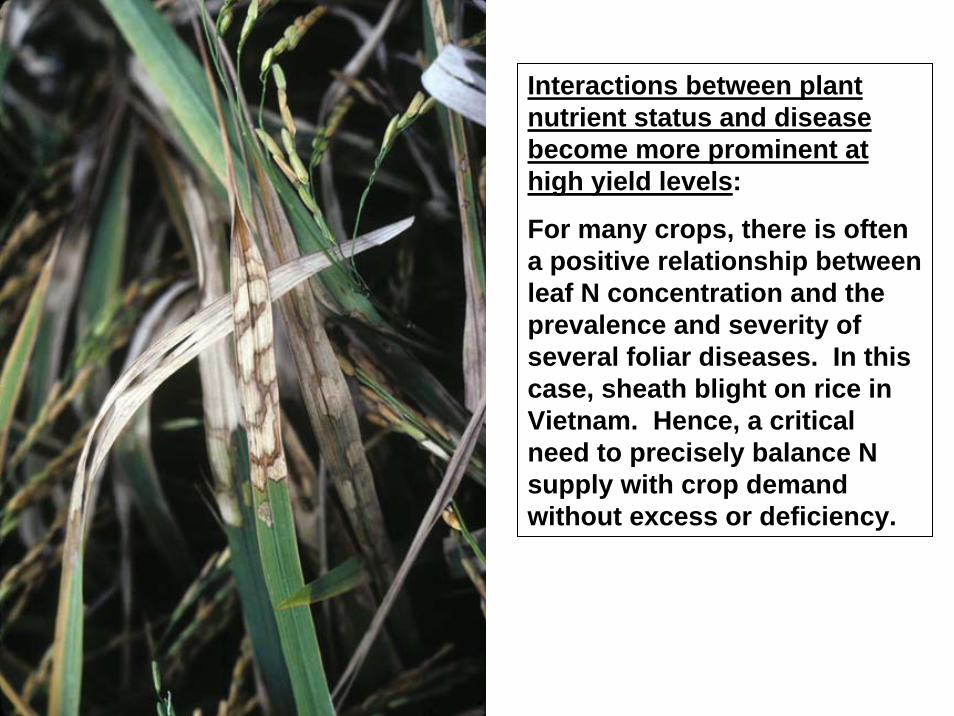
Interactions between plant nutrient status and disease become more prominent at high yield levels:
For many crops, there is often a positive relationship between leaf N concentration and the prevalence and severity of several foliar diseases. In this case, sheath blight on rice in Vietnam. Hence, a critical need to precisely balance N supply with crop demand without excess or deficiency.
Yield potential and yield gaps
Yiel
dGap 1
Gap 2
Yield potential Water-limitedyield potential
Actual yield
Other limiting factors:
NutrientsWeedsPestsOthers
CO2Solar radiationTemperature
Growth periodPlant density
Attainable yieldwith availablewater supply:
SoilRainfall
Irrigation
75-85% Yp
70-80% Yp-r
Developing a transparent, robust, reproducible protocol to estimate crop yield potential (Yp) in a given
field, region, state, or nation
PhD. Project---Justin van Wart
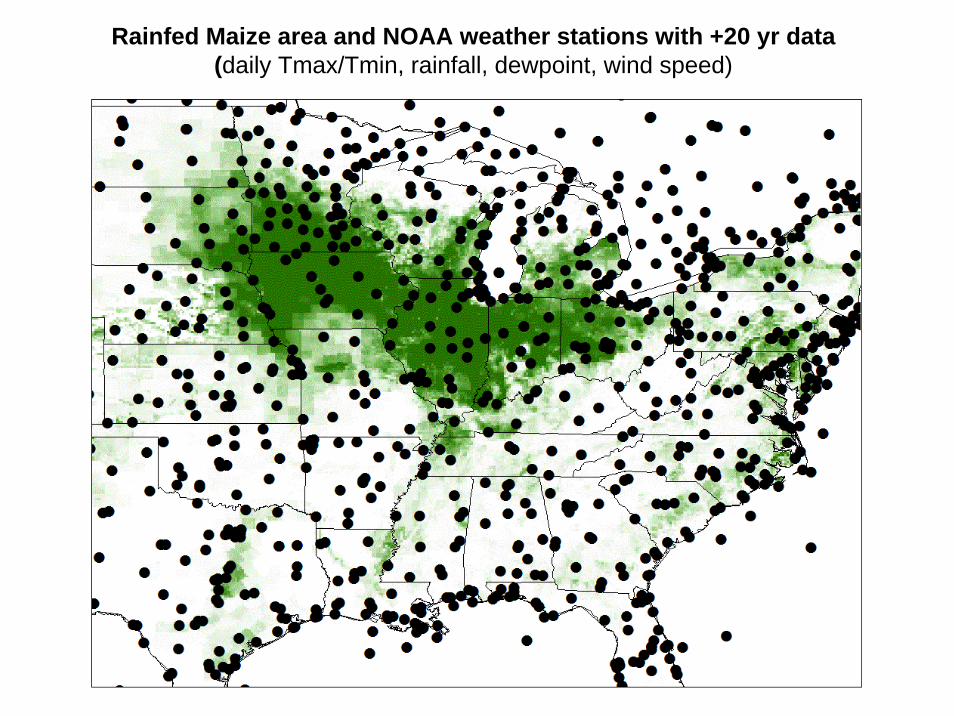
Rainfed Maize area and NOAA weather stations with +20 yr data (daily Tmax/Tmin, rainfall, dewpoint, wind speed)
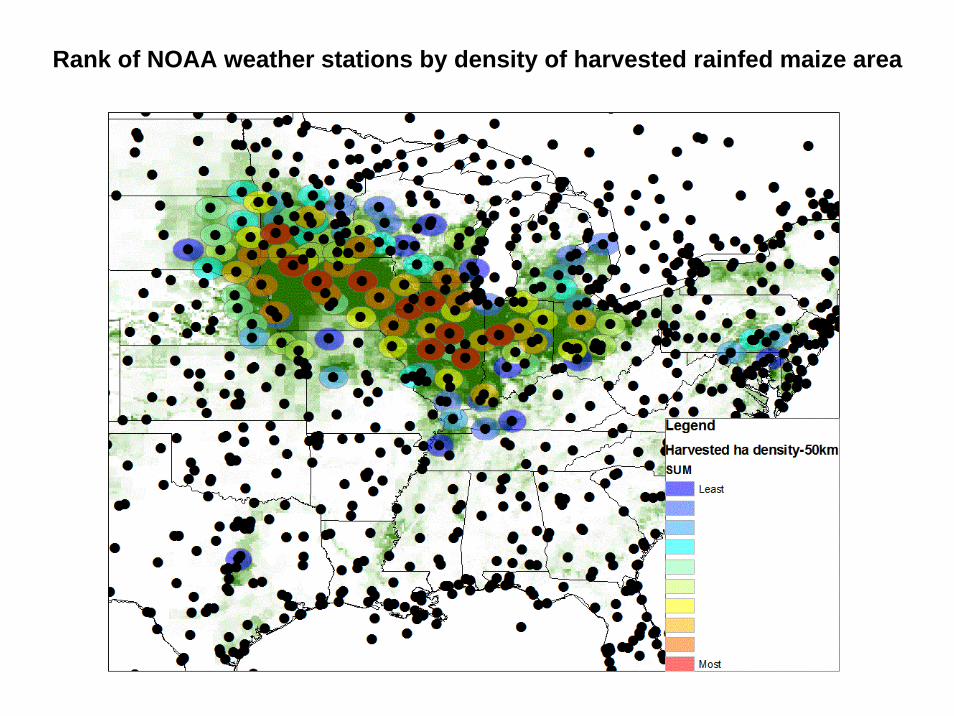
Rank of NOAA weather stations by density of harvested rainfed maize area
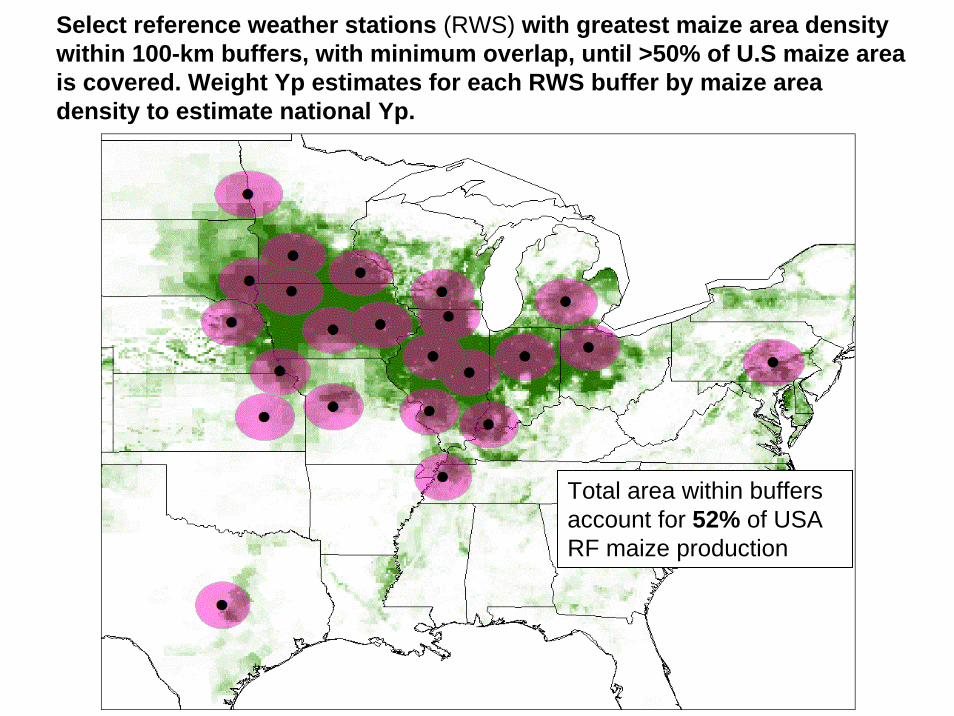
Select reference weather stations (RWS) with greatest maize area density within 100-km buffers, with minimum overlap, until >50% of U.S maize area is covered. Weight Yp estimates for each RWS buffer by maize area density to estimate national Yp.
Total area within buffers account for 52% of USA RF maize production
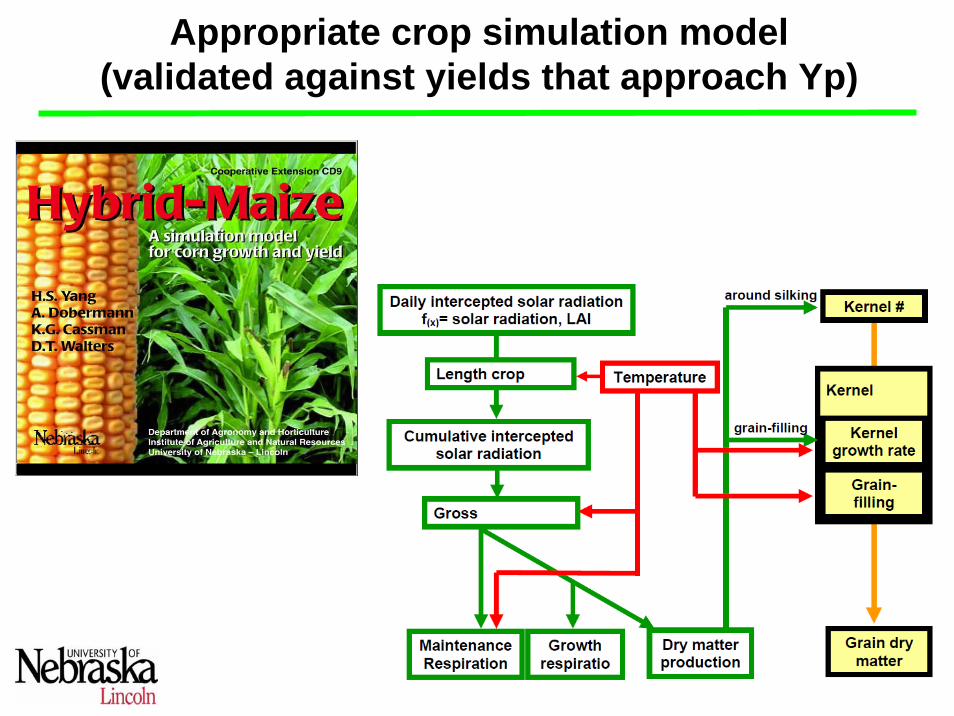
Appropriate crop simulation model(validated against yields that approach Yp)
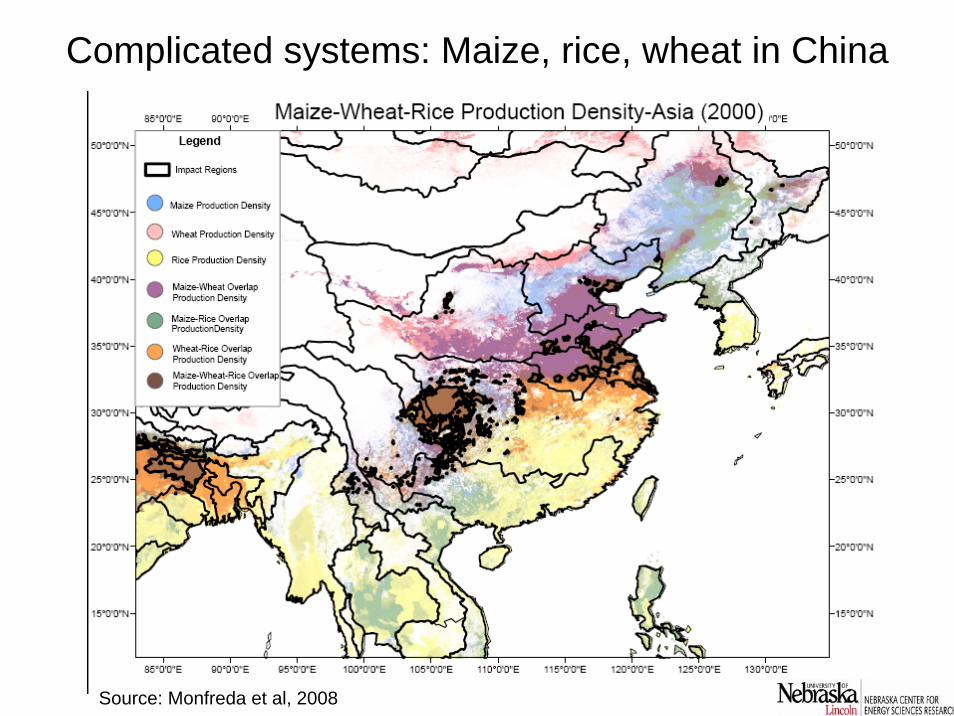
Complicated systems: Maize, rice, wheat in China
Source: Monfreda et al, 2008
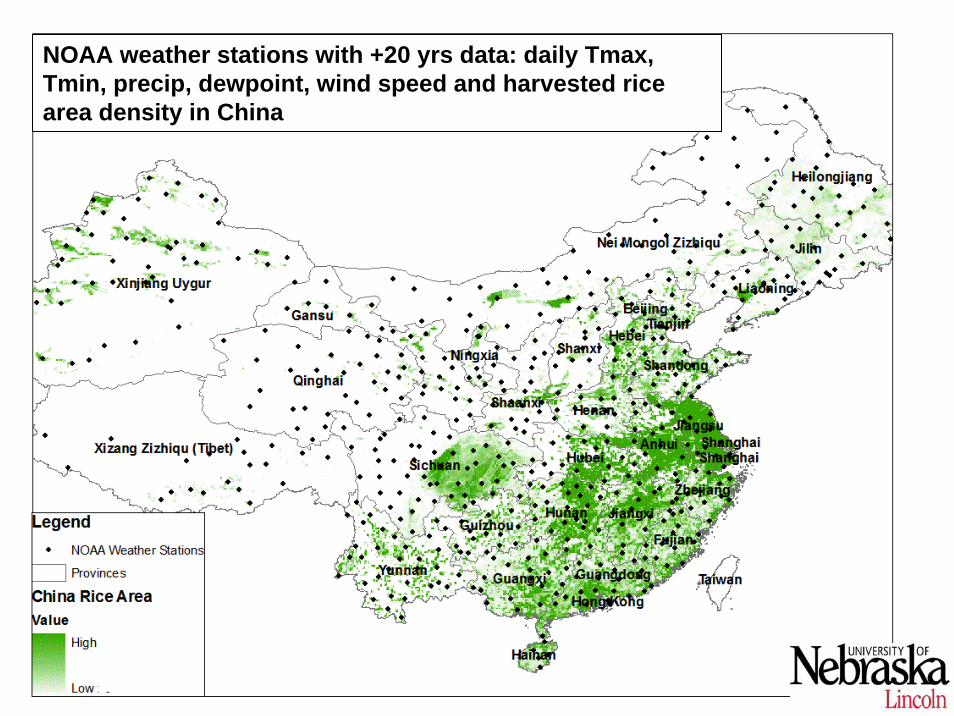
NOAA weather stations with +20 yrs data: daily Tmax, Tmin, precip, dewpoint, wind speed and harvested rice area density in China
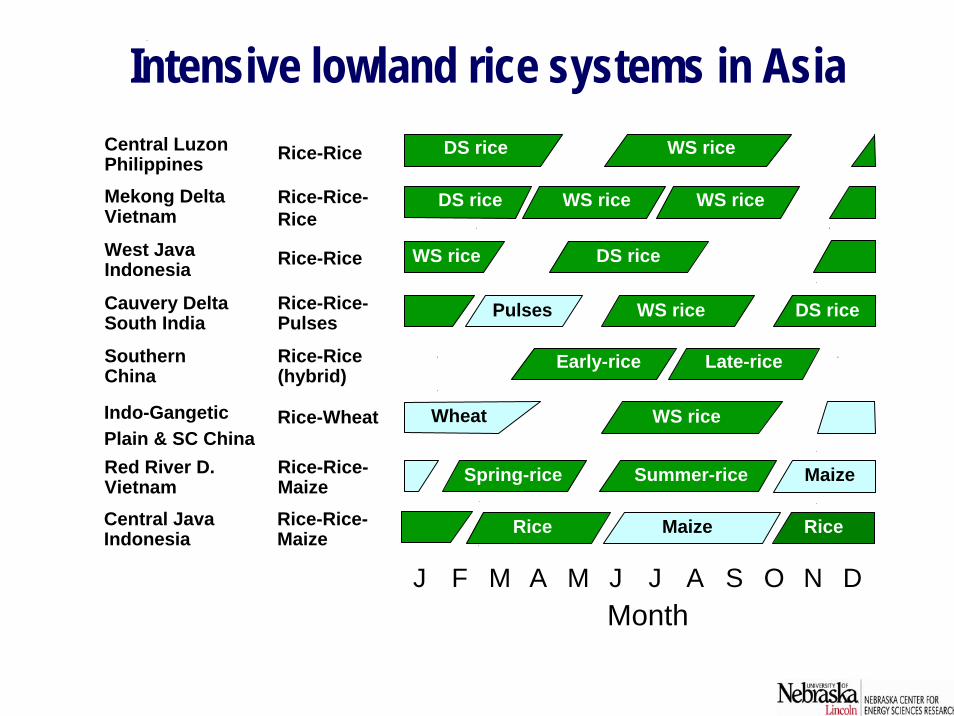
Intensive lowland rice systems in AsiaCentral LuzonPhilippines Rice-Rice
Mekong DeltaVietnam
Rice-Rice-Rice
West JavaIndonesia Rice-Rice
Red River D.Vietnam
Rice-Rice-Maize
SouthernChina
Rice-Rice(hybrid)
J F M A M J J A S O N DMonth
DS rice WS rice
DS rice WS rice
WS rice DS rice
Spring-rice Summer-rice Maize
Early-rice Late-rice
Cauvery DeltaSouth India
Rice-Rice-Pulses
Pulses WS rice DS rice
Indo-GangeticPlain & SC China
Rice-Wheat WS riceWheat
WS rice
Central JavaIndonesia
Rice-Rice-Maize Rice Maize Rice
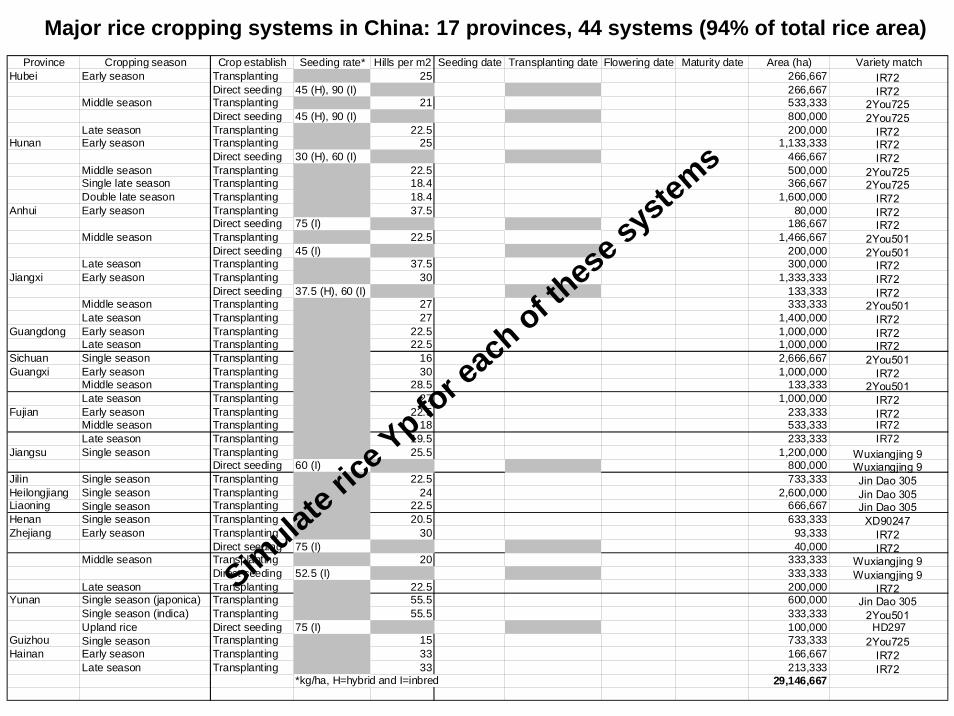
Province Cropping season Crop establish Seeding rate* Hills per m2 Seeding date Transplanting date Flowering date Maturity date Area (ha) Variety matchHubei Early season Transplanting 25 266,667 IR72
Direct seeding 45 (H), 90 (I) 266,667 IR72 Middle season Transplanting 21 533,333 2You725
Direct seeding 45 (H), 90 (I) 800,000 2You725 Late season Transplanting 22.5 200,000 IR72
Hunan Early season Transplanting 25 1,133,333 IR72 Direct seeding 30 (H), 60 (I) 466,667 IR72
Middle season Transplanting 22.5 500,000 2You725 Single late season Transplanting 18.4 366,667 2You725 Double late season Transplanting 18.4 1,600,000 IR72
Anhui Early season Transplanting 37.5 80,000 IR72 Direct seeding 75 (I) 186,667 IR72
Middle season Transplanting 22.5 1,466,667 2You501 Direct seeding 45 (I) 200,000 2You501
Late season Transplanting 37.5 300,000 IR72 Jiangxi Early season Transplanting 30 1,333,333 IR72
Direct seeding 37.5 (H), 60 (I) 133,333 IR72 Middle season Transplanting 27 333,333 2You501 Late season Transplanting 27 1,400,000 IR72
Guangdong Early season Transplanting 22.5 1,000,000 IR72 Late season Transplanting 22.5 1,000,000 IR72
Sichuan Single season Transplanting 16 2,666,667 2You501 Guangxi Early season Transplanting 30 1,000,000 IR72
Middle season Transplanting 28.5 133,333 2You501 Late season Transplanting 27 1,000,000 IR72
Fujian Early season Transplanting 22.5 233,333 IR72 Middle season Transplanting 18 533,333 IR72 Late season Transplanting 19.5 233,333 IR72
Jiangsu Single season Transplanting 25.5 1,200,000 Wuxiangjing 9 Direct seeding 60 (I) 800,000 Wuxiangjing 9
Jilin Single season Transplanting 22.5 733,333 Jin Dao 305 Heilongjiang Single season Transplanting 24 2,600,000 Jin Dao 305 Liaoning Single season Transplanting 22.5 666,667 Jin Dao 305 Henan Single season Transplanting 20.5 633,333 XD90247 Zhejiang Early season Transplanting 30 93,333 IR72
Direct seeding 75 (I) 40,000 IR72 Middle season Transplanting 20 333,333 Wuxiangjing 9
Direct seeding 52.5 (I) 333,333 Wuxiangjing 9 Late season Transplanting 22.5 200,000 IR72
Yunan Single season (japonica) Transplanting 55.5 600,000 Jin Dao 305 Single season (indica) Transplanting 55.5 333,333 2You501 Upland rice Direct seeding 75 (I) 100,000 HD297
Guizhou Single season Transplanting 15 733,333 2You725 Hainan Early season Transplanting 33 166,667 IR72
Late season Transplanting 33 213,333 IR72 *kg/ha, H=hybrid and I=inbred 29,146,667
Major rice cropping systems in China: 17 provinces, 44 systems (94% of total rice area)
Simulat
e rice
Yp for each
of these s
ystems
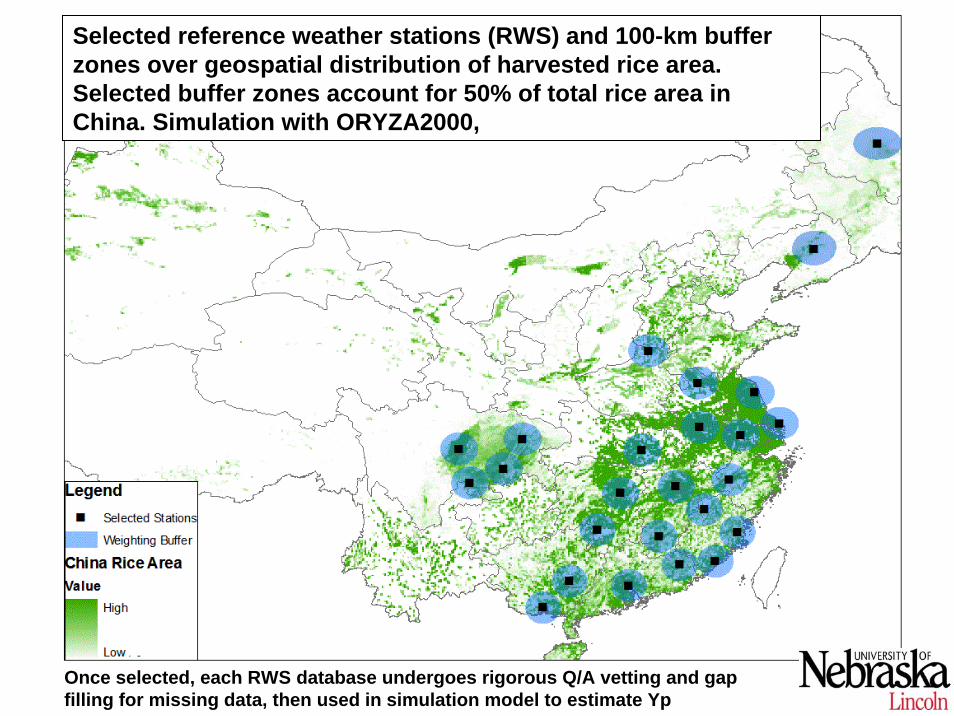
Selected reference weather stations (RWS) and 100-km buffer zones over geospatial distribution of harvested rice area. Selected buffer zones account for 50% of total rice area in China. Simulation with ORYZA2000,
Once selected, each RWS database undergoes rigorous Q/A vetting and gap filling for missing data, then used in simulation model to estimate Yp
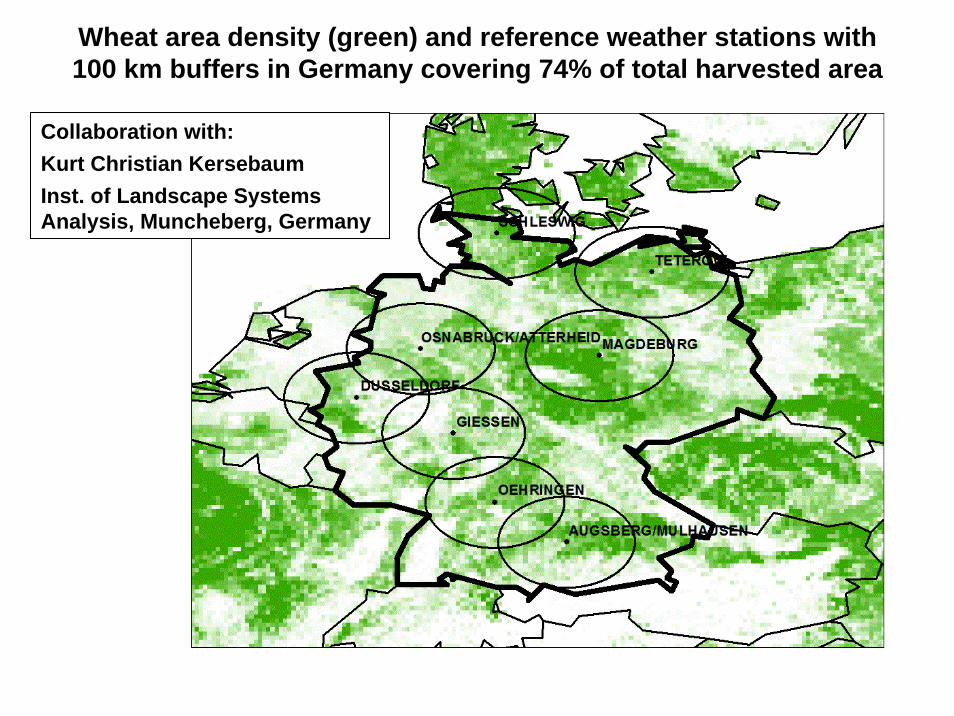
Collaboration with: Kurt Christian KersebaumInst. of Landscape Systems Analysis, Muncheberg, Germany
Wheat area density (green) and reference weather stations with 100 km buffers in Germany covering 74% of total harvested area
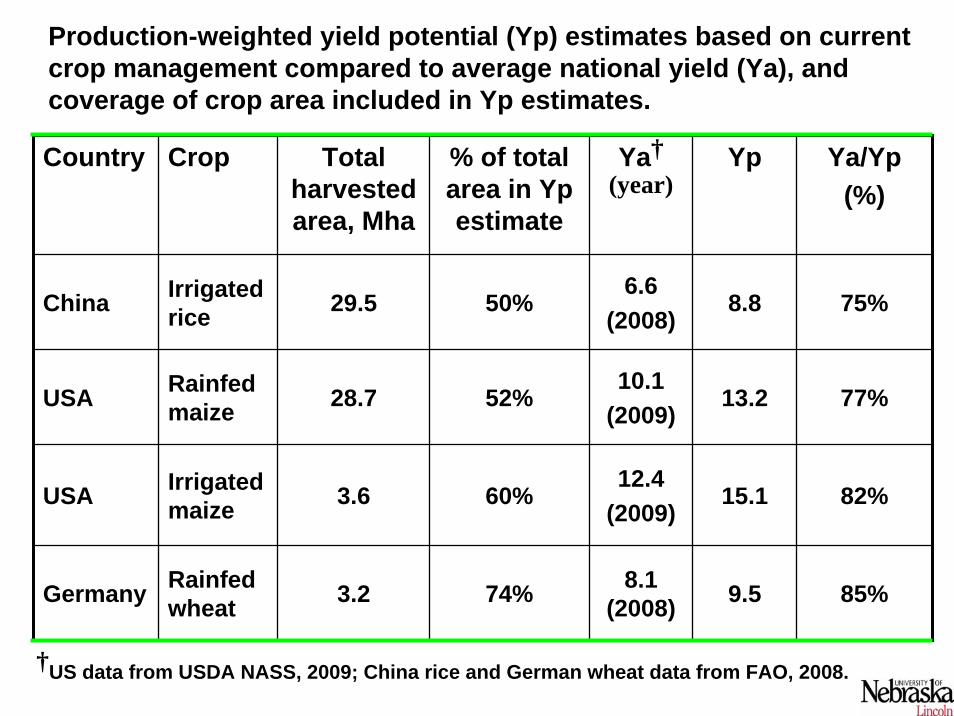
Country Crop Total harvested area, Mha
% of total area in Ypestimate
Ya†(year)
Yp
50%6.6
(2008)
10.1(2009)
12.4(2009)
8.1 (2008)
52%
8.8
13.2
15.160%
74% 9.5
Ya/Yp(%)
China Irrigated rice 29.5 75%
77%
82%
85%
USA Rainfedmaize 28.7
USA Irrigated maize 3.6
Germany Rainfedwheat 3.2
Production-weighted yield potential (Yp) estimates based on current crop management compared to average national yield (Ya), and coverage of crop area included in Yp estimates.
†US data from USDA NASS, 2009; China rice and German wheat data from FAO, 2008.
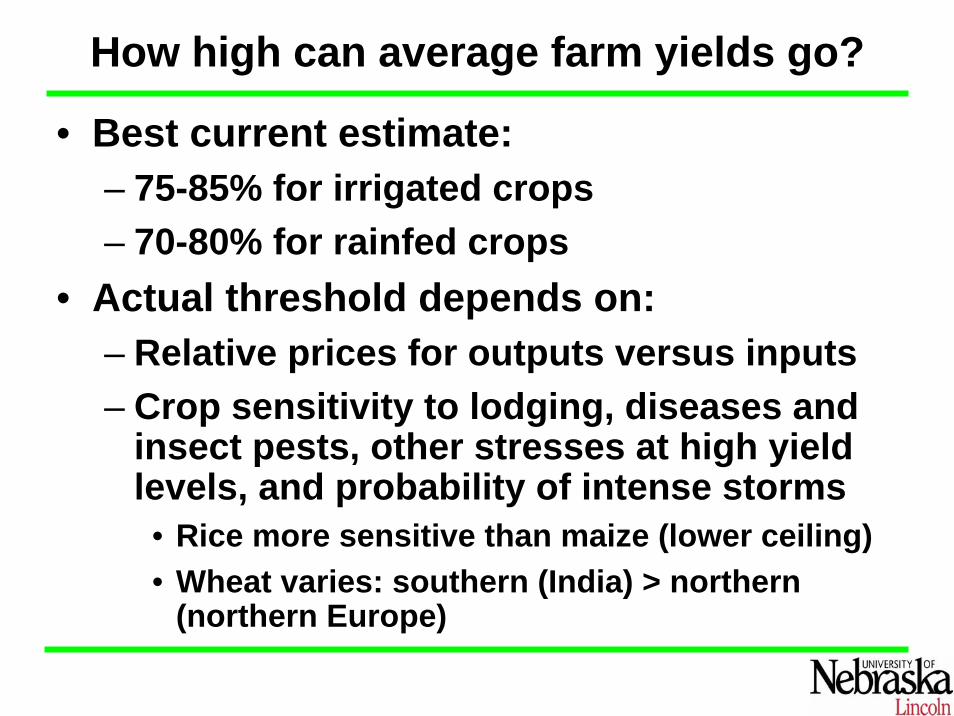
How high can average farm yields go?
• Best current estimate:– 75-85% for irrigated crops– 70-80% for rainfed crops
• Actual threshold depends on:– Relative prices for outputs versus inputs– Crop sensitivity to lodging, diseases and
insect pests, other stresses at high yield levels, and probability of intense storms
• Rice more sensitive than maize (lower ceiling)• Wheat varies: southern (India) > northern
(northern Europe)
Conclusions
• Crop yield potential (Yp) can be estimated using methods that are transparent, robust, and reproducible based on weather data, geospatial distribution of crop area, current crop management (plant date and maturity, plant population) and appropriate crop models
• Average farm yields begin to stagnate when they reach 70-85% of Yp
• Yield gap analysis depends on accurate estimate of Yp
Need for Yield Potential--Yield Gap Atlas
• Interpret historical yield trends and yield plateaus (predict yield plateaus?)
• Prioritize research to ensure global food security in the face of climate change– Identify areas with largest unexploited yield gaps,
identify constraints, close yield gaps through ecological intensification
• Estimate agricultural land requirements and indirect land use change (and associated GHG emissions) as influenced by policies– e.g. competition between food and biofuel