Embed Size (px)
Citation preview
Pennsylvania Association of Public Employee Retirement Systems
Protecting Public Employee Benefits | What Lies Beneath?
May 24, 2012
Yields vs. Returns | Assets vs. Liabilities
Presented by:
Sean F. McShea | President | [email protected]
500 Fifth Avenue, Suite 2520 New York, NY 10110
RYAN LABS ASSET MANAGEMENT www.ryanlabs.com
500 Fifth Ave., Ste.2520 New York, NY 10110 2
This page intentional left blank.
RYAN LABS ASSET MANAGEMENT www.ryanlabs.com
500 Fifth Ave., Ste.2520 New York, NY 10110 3
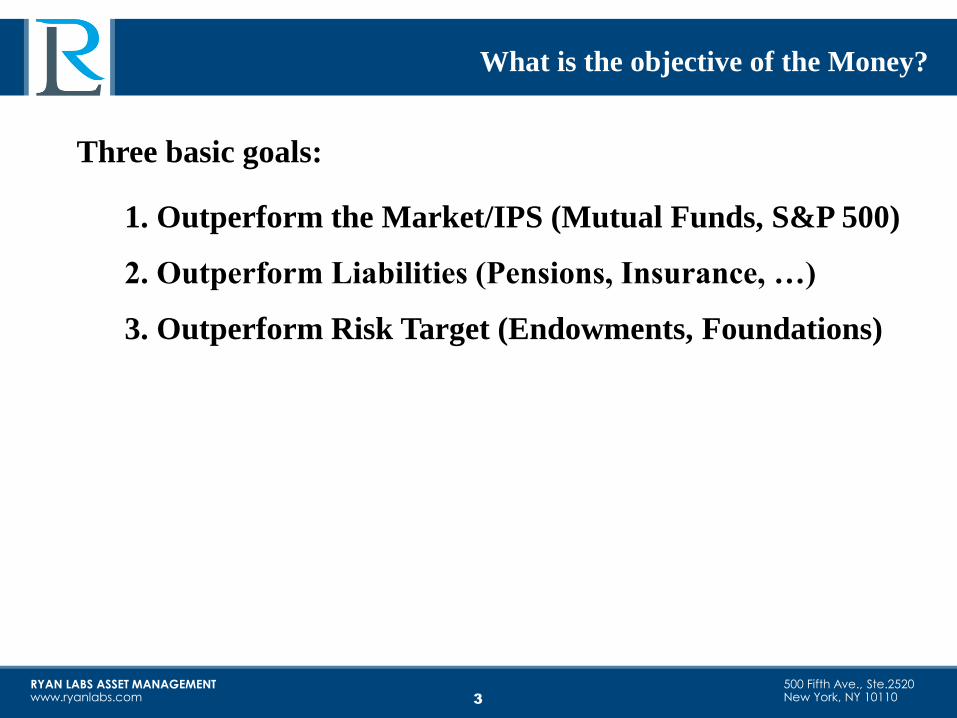
Three basic goals:
1) 1. Outperform the Market/IPS (Mutual Funds, S&P 500)
2) 2. Outperform Liabilities (Pensions, Insurance, …)
3) 3. Outperform Risk Target (Endowments, Foundations)
What is the objective of the Money?
RYAN LABS ASSET MANAGEMENT www.ryanlabs.com
500 Fifth Ave., Ste.2520 New York, NY 10110
Endowment
Pensions
Medical Liabilities
Construction
Projects
Defeasance
Programs
Self Insurance
General Accounts
Life
Workers
Compensation
Property &
Casualty
Health Care
Operating
Pensions
OPEB Medical
Lotteries
Prepaid Tuition
Defeasance Programs
Worker’s
Compensation
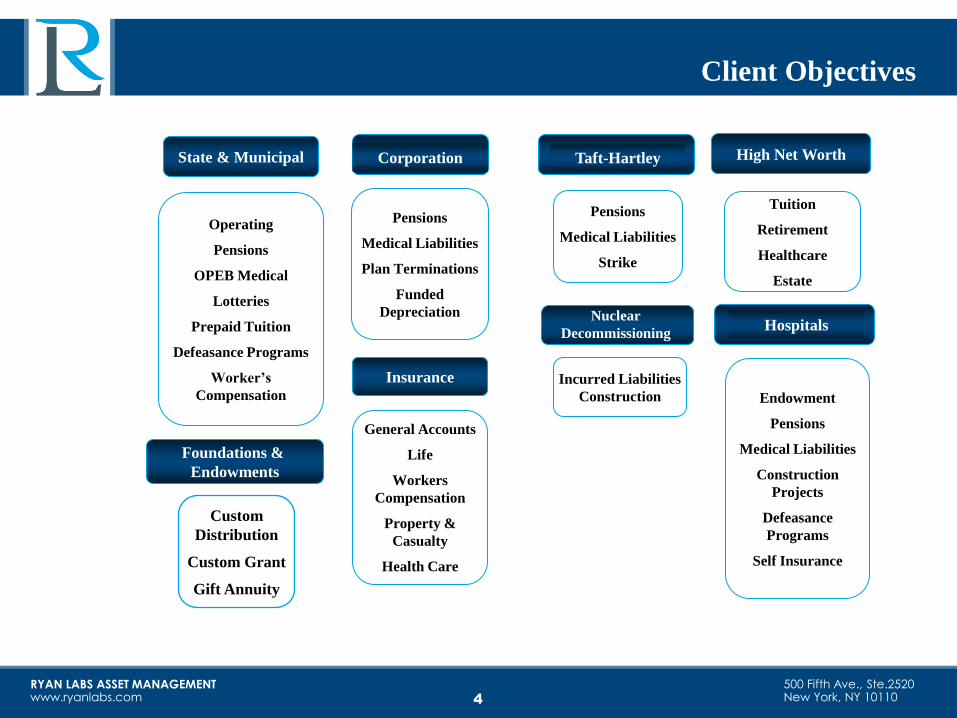
State & Municipal
Pensions
Medical Liabilities
Strike
Taft-Hartley
Hospitals
Insurance
Custom
Distribution
Custom Grant
Gift Annuity
Foundations &
Endowments
Pensions
Medical Liabilities
Plan Terminations
Funded
Depreciation
Corporation
Incurred Liabilities
Construction
Nuclear
Decommissioning
High Net Worth
Tuition
Retirement
Healthcare
Estate
Client Objectives
4
RYAN LABS ASSET MANAGEMENT www.ryanlabs.com
500 Fifth Ave., Ste.2520 New York, NY 10110 5
United States Retirement Infrastructure:
Defined Benefit (DB) Retirement Plans
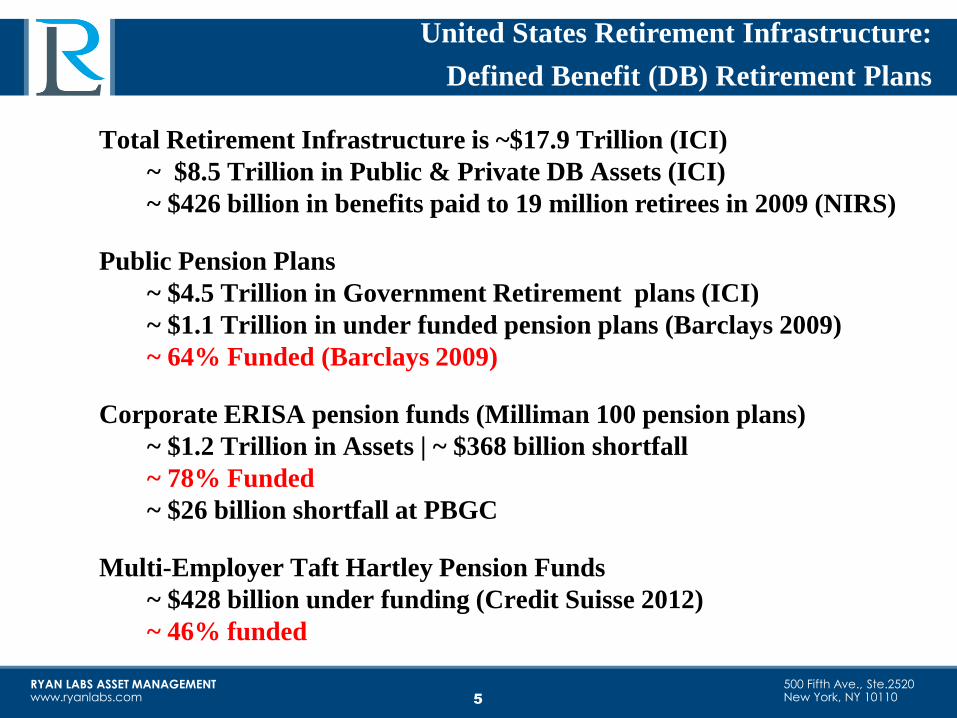
Total Retirement Infrastructure is ~$17.9 Trillion (ICI)
~ $8.5 Trillion in Public & Private DB Assets (ICI)
~ $426 billion in benefits paid to 19 million retirees in 2009 (NIRS)
Public Pension Plans
~ $4.5 Trillion in Government Retirement plans (ICI)
~ $1.1 Trillion in under funded pension plans (Barclays 2009)
~ 64% Funded (Barclays 2009)
Corporate ERISA pension funds (Milliman 100 pension plans)
~ $1.2 Trillion in Assets | ~ $368 billion shortfall
~ 78% Funded
~ $26 billion shortfall at PBGC
Multi-Employer Taft Hartley Pension Funds
~ $428 billion under funding (Credit Suisse 2012)
~ 46% funded
RYAN LABS ASSET MANAGEMENT www.ryanlabs.com
500 Fifth Ave., Ste.2520 New York, NY 10110 6
Society of Actuaries 2020 Forum:
Defined Benefit (DB) Vs. Defined Contribution (DC)
Concern:
Defined Contribution plans are less able than Defined Benefit Pension
Plans to provide lifetime income to retirees
Defined Benefit Plans will be strengthened by increased transparency
and updated modes and methods to contribution strategy, benefit
management and asset allocation
DC advocates want to set aside smaller amounts that is less risky to the
government employers
RYAN LABS ASSET MANAGEMENT www.ryanlabs.com
500 Fifth Ave., Ste.2520 New York, NY 10110
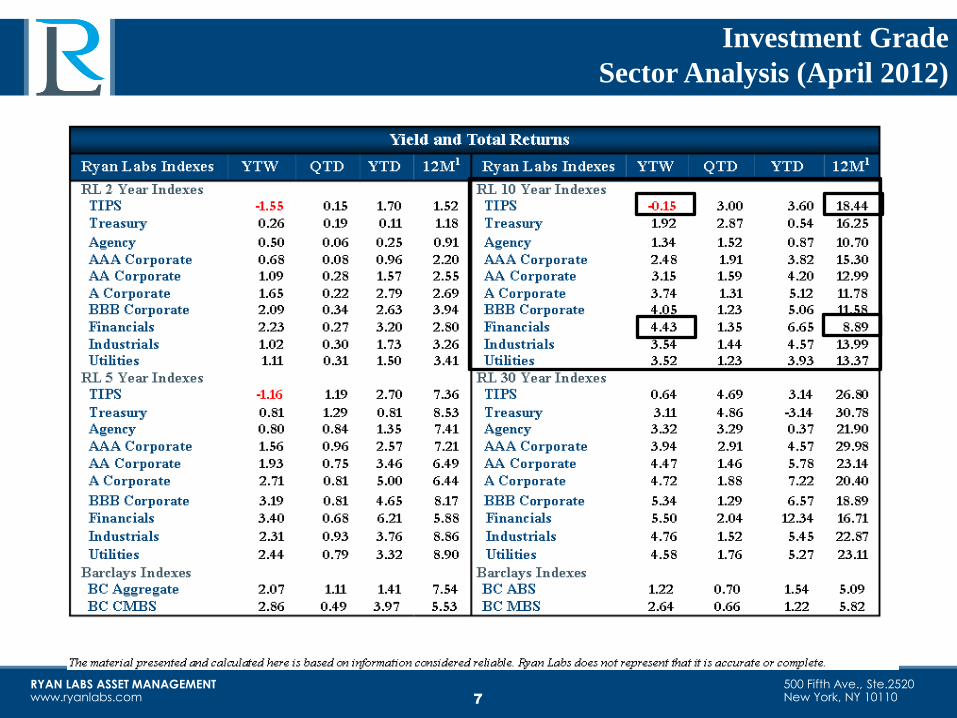
Investment Grade
Sector Analysis (April 2012)
7
RYAN LABS ASSET MANAGEMENT www.ryanlabs.com
500 Fifth Ave., Ste.2520 New York, NY 10110 8
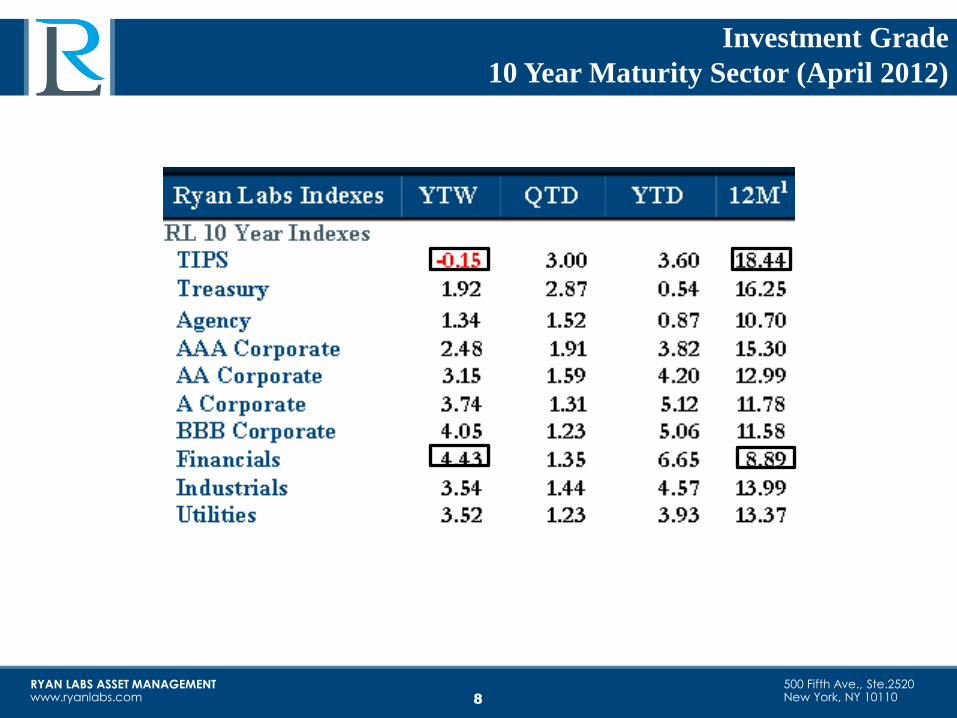
Investment Grade
10 Year Maturity Sector (April 2012)
RYAN LABS ASSET MANAGEMENT www.ryanlabs.com
500 Fifth Ave., Ste.2520 New York, NY 10110
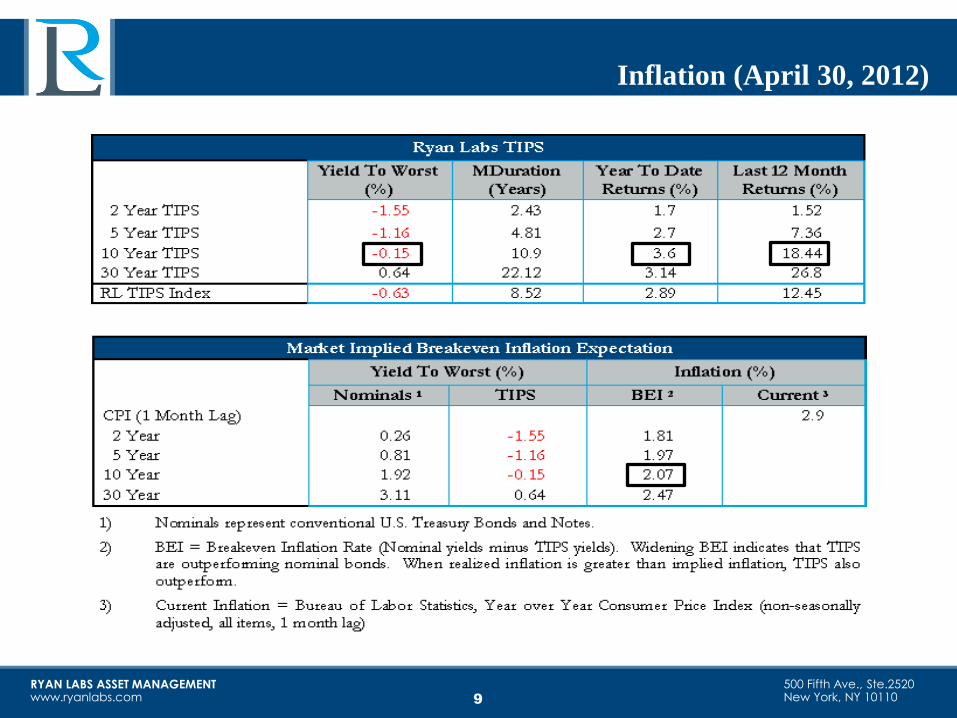
Inflation (April 30, 2012)
9
RYAN LABS ASSET MANAGEMENT www.ryanlabs.com
500 Fifth Ave., Ste.2520 New York, NY 10110 10
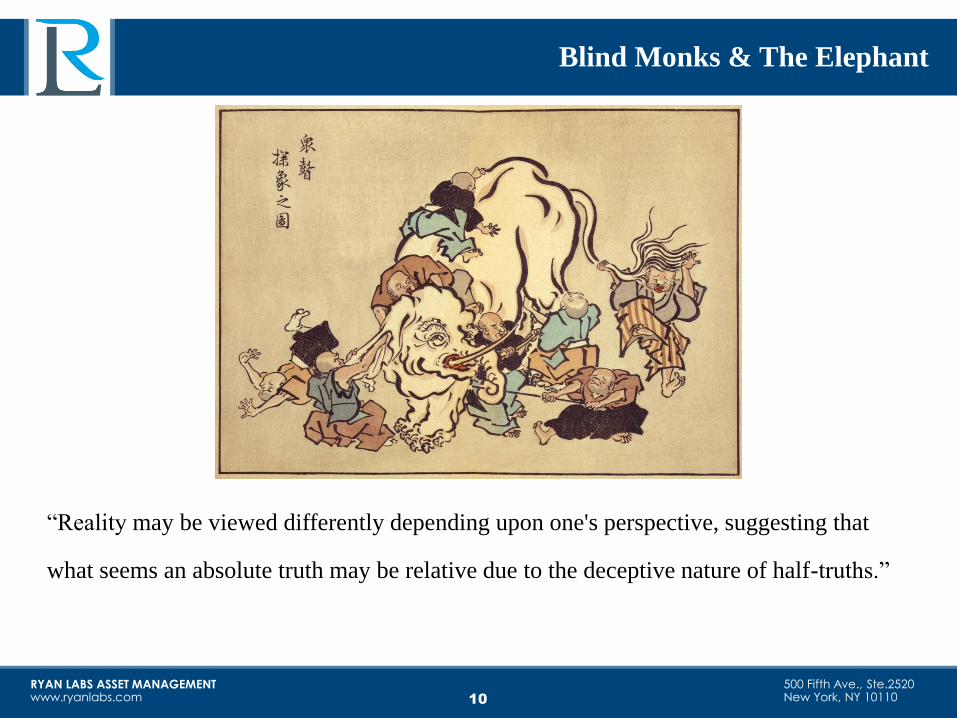
Blind Monks & The Elephant
“Reality may be viewed differently depending upon one's perspective, suggesting that
what seems an absolute truth may be relative due to the deceptive nature of half-truths.”
RYAN LABS ASSET MANAGEMENT www.ryanlabs.com
500 Fifth Ave., Ste.2520 New York, NY 10110
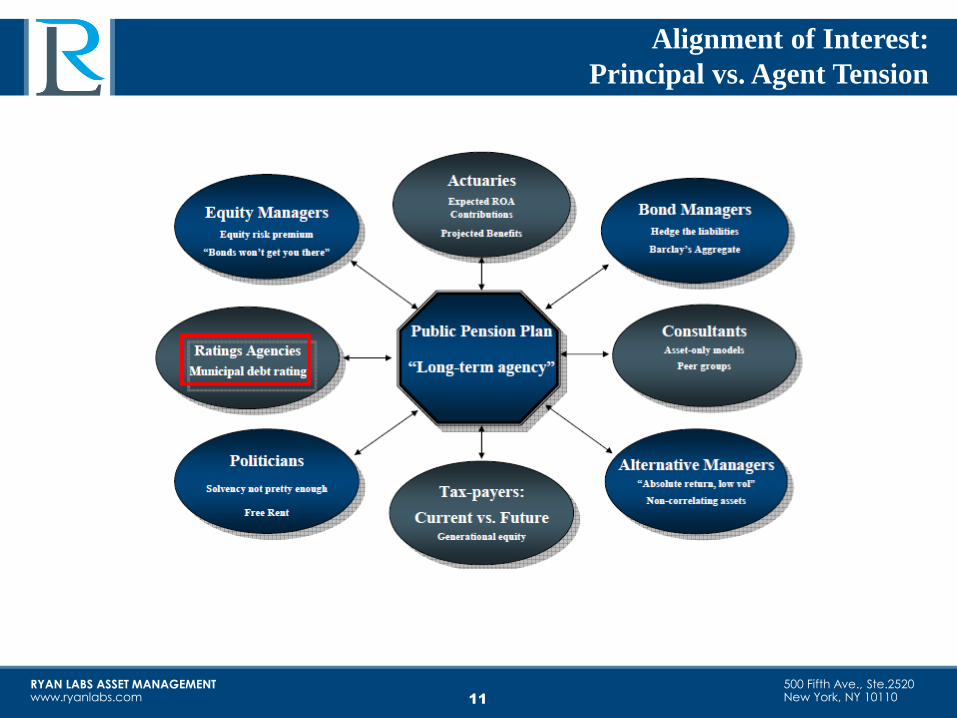
Alignment of Interest:
Principal vs. Agent Tension
11
RYAN LABS ASSET MANAGEMENT www.ryanlabs.com
500 Fifth Ave., Ste.2520 New York, NY 10110
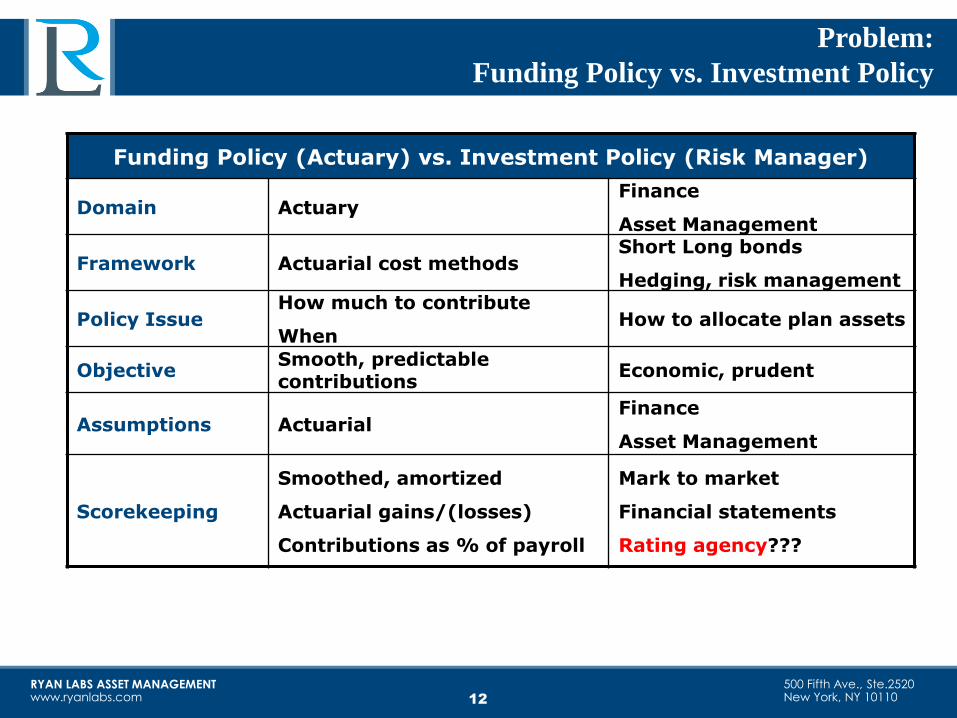
Problem:
Funding Policy vs. Investment Policy
Funding Policy (Actuary) vs. Investment Policy (Risk Manager)
Domain Actuary Finance
Asset Management
Framework Actuarial cost methods Short Long bonds
Hedging, risk management
Policy Issue How much to contribute
When How to allocate plan assets
Objective Smooth, predictable contributions
Economic, prudent
Assumptions Actuarial Finance
Asset Management
Scorekeeping
Smoothed, amortized
Actuarial gains/(losses)
Contributions as % of payroll
Mark to market
Financial statements
Rating agency???
12
RYAN LABS ASSET MANAGEMENT www.ryanlabs.com
500 Fifth Ave., Ste.2520 New York, NY 10110
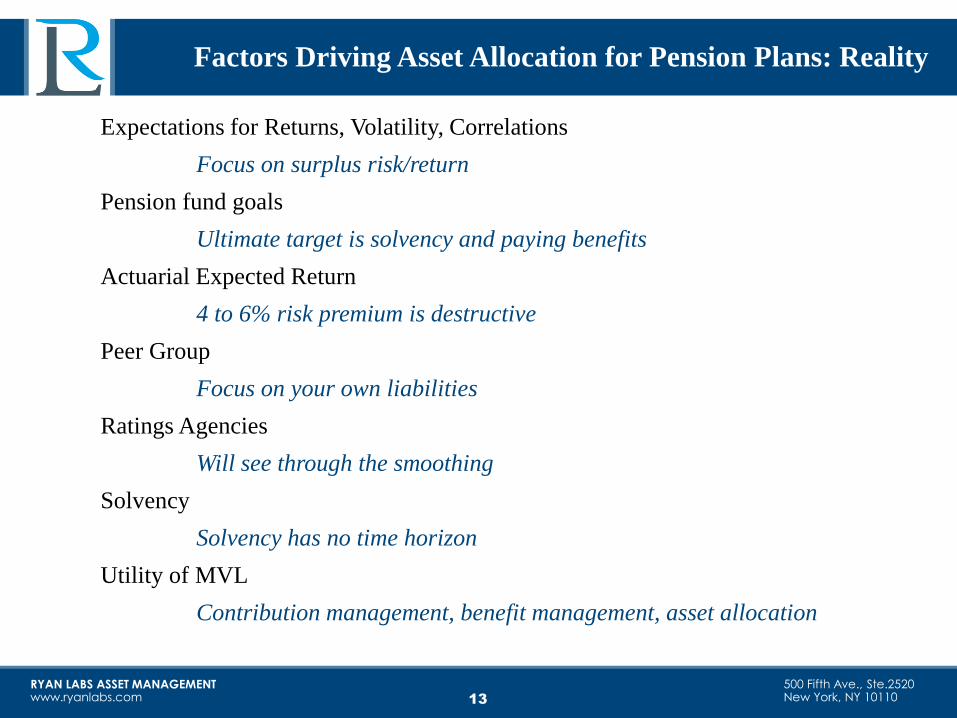
Expectations for Returns, Volatility, Correlations
Focus on surplus risk/return
Pension fund goals
Ultimate target is solvency and paying benefits
Actuarial Expected Return
4 to 6% risk premium is destructive
Peer Group
Focus on your own liabilities
Ratings Agencies
Will see through the smoothing
Solvency
Solvency has no time horizon
Utility of MVL
Contribution management, benefit management, asset allocation
Factors Driving Asset Allocation for Pension Plans: Reality
13
RYAN LABS ASSET MANAGEMENT www.ryanlabs.com
500 Fifth Ave., Ste.2520 New York, NY 10110
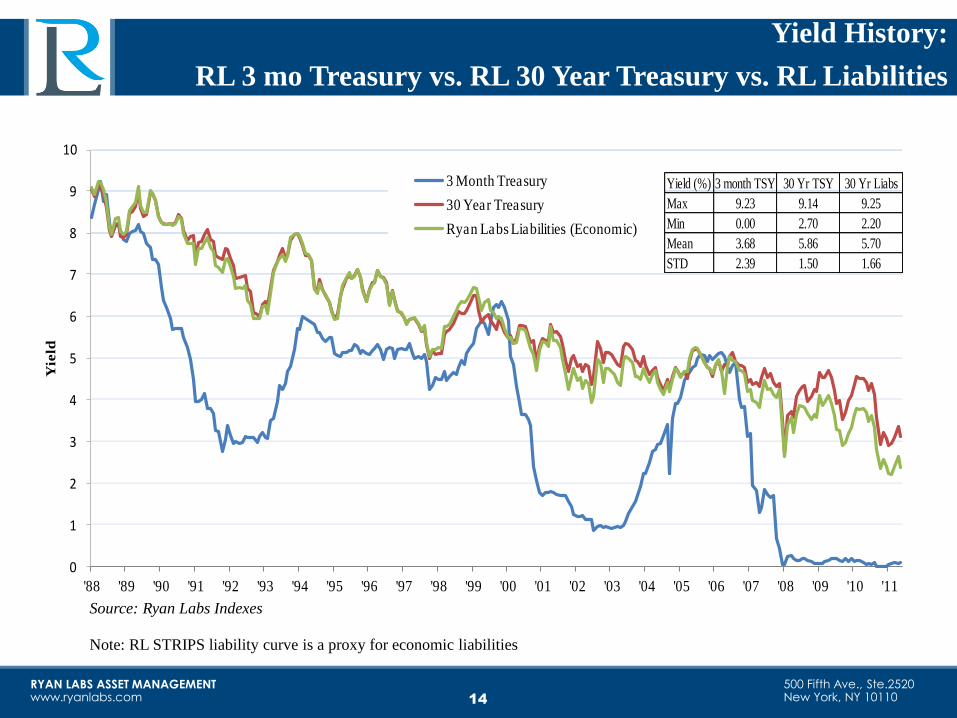
0
1
2
3
4
5
6
7
8
9
10
'88 '89 '90 '91 '92 '93 '94 '95 '96 '97 '98 '99 '00 '01 '02 '03 '04 '05 '06 '07 '08 '09 '10 '11
Yie
ld
3 Month Treasury
30 Year Treasury
Ryan Labs Liabilities (Economic)
Yield (%) 3 month TSY 30 Yr TSY 30 Yr Liabs
Max 9.23 9.14 9.25
Min 0.00 2.70 2.20
Mean 3.68 5.86 5.70
STD 2.39 1.50 1.66
14
Yield History:
RL 3 mo Treasury vs. RL 30 Year Treasury vs. RL Liabilities
Source: Ryan Labs Indexes
Note: RL STRIPS liability curve is a proxy for economic liabilities
RYAN LABS ASSET MANAGEMENT www.ryanlabs.com
500 Fifth Ave., Ste.2520 New York, NY 10110 15
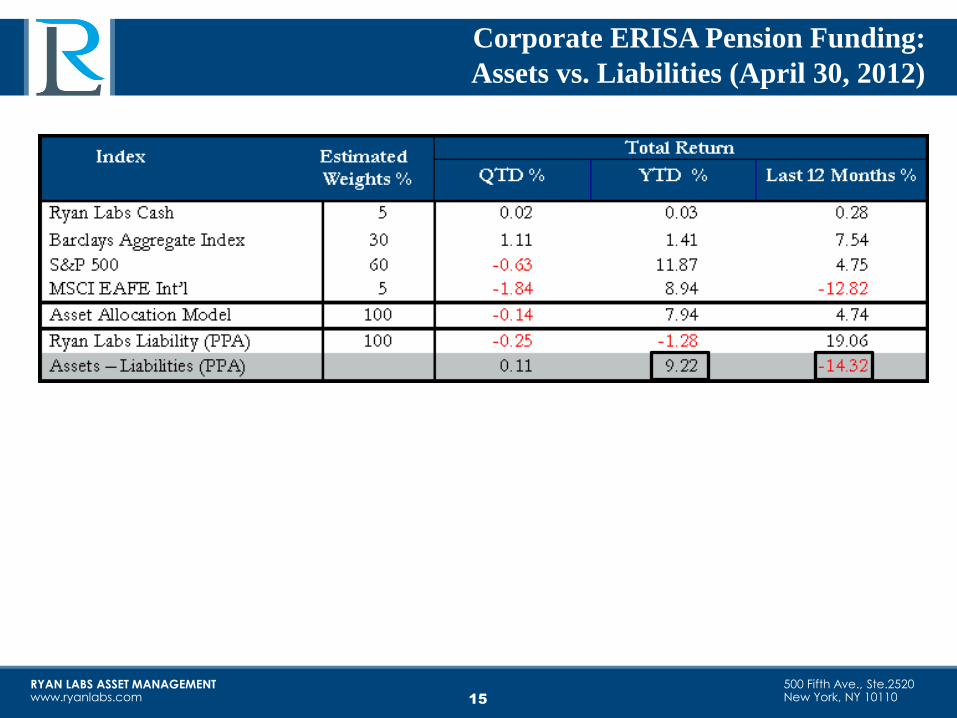
Corporate ERISA Pension Funding:
Assets vs. Liabilities (April 30, 2012)
RYAN LABS ASSET MANAGEMENT www.ryanlabs.com
500 Fifth Ave., Ste.2520 New York, NY 10110
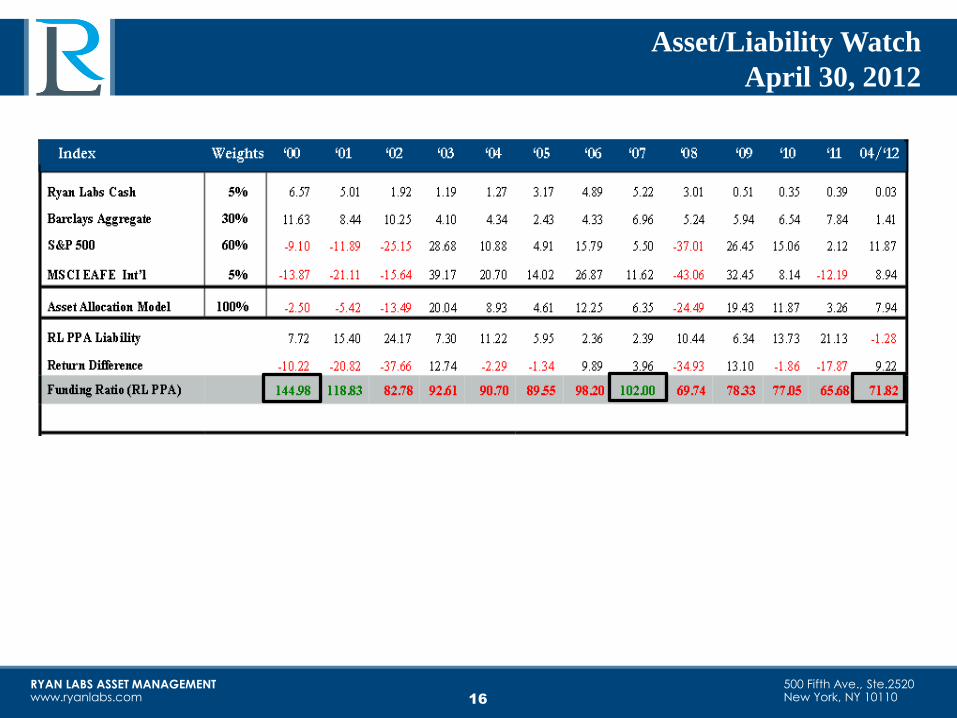
Asset/Liability Watch
April 30, 2012
16
RYAN LABS ASSET MANAGEMENT www.ryanlabs.com
500 Fifth Ave., Ste.2520 New York, NY 10110
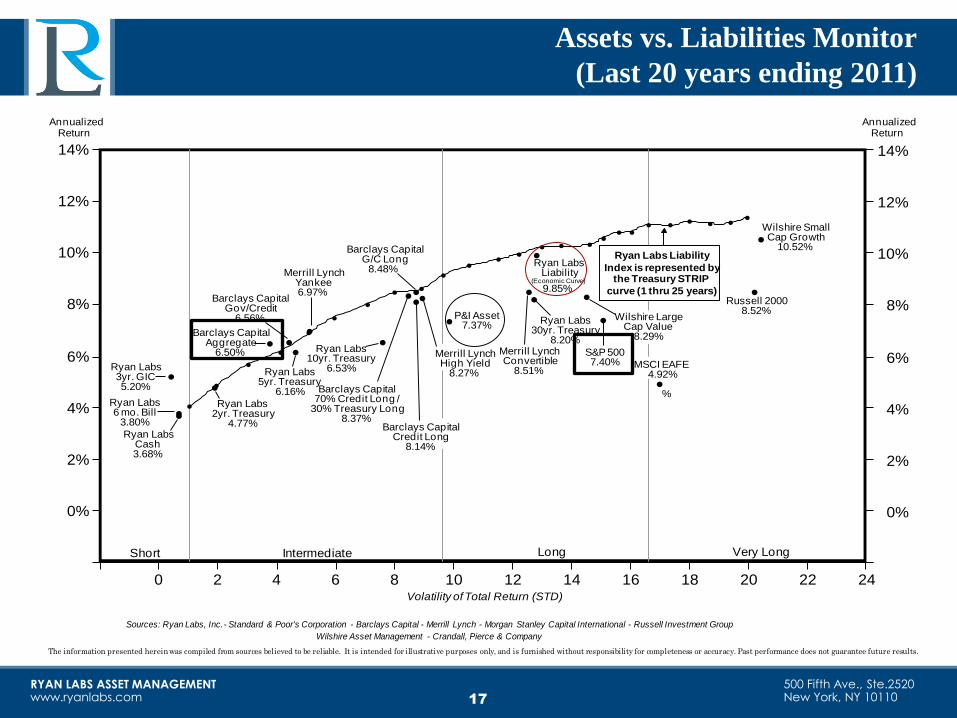
Assets vs. Liabilities Monitor
(Last 20 years ending 2011)
17
•
•
••
••
•• •
•• • • • • • •
• • • • • • • •
0%
2%
4%
6%
8%
10%
12%
14%
0%
2%
4%
6%
8%
10%
12%
14%
0 2 4 6 8 10 12 14 16 18 20 22 24Volatility of Total Return (STD)
AnnualizedReturn
AnnualizedReturn
Ryan Labs5yr. Treasury
6.16%
Short Intermediate Long Very Long
Ryan Labs2yr. Treasury
4.77%
Barclays CapitalAggregate
6.50%
Merrill LynchYankee6.97%
Ryan Labs10yr. Treasury
6.53%
Ryan Labs6 mo. Bill
3.80%
Wilshire SmallCap Growth
10.52%
Ryan Labs3yr. GIC5.20%
Russell 20008.52%
Ryan Labs30yr. Treasury
8.20%Merrill LynchConvertible
8.51%
P&I Asset7.37%
Merrill LynchHigh Yield
8.27%
Ryan Labs Liability
Index is represented bythe Treasury STRIP
curve (1 thru 25 years)
Wilshire LargeCap Value
8.29%
•
•••
• •••
•
•••••
••
•
••
•
•
•
Ryan LabsCash3.68%
Barclays CapitalGov/Credit
6.56%
S&P 5007.40%
Ryan LabsLiability
Barclays Capital70% Credit Long /
30% Treasury Long8.37%
(Economic Curve)
9.85%
Barclays CapitalG/C Long
8.48%
Barclays CapitalCredit Long
8.14%
MSCI EAFE4.92%
%
The information presented herein was compiled from sources believed to be reliable. It is intended for illustrative purposes only, and is furnished without responsibility for completeness or accuracy. Past performance does not guarantee future results.
Sources: Ryan Labs, Inc.- Standard & Poor's Corporation - Barclays Capital - Merrill Lynch - Morgan Stanley Capital International - Russell Investment Group
Wilshire Asset Management - Crandall, Pierce & Company
RYAN LABS ASSET MANAGEMENT www.ryanlabs.com
500 Fifth Ave., Ste.2520 New York, NY 10110 18
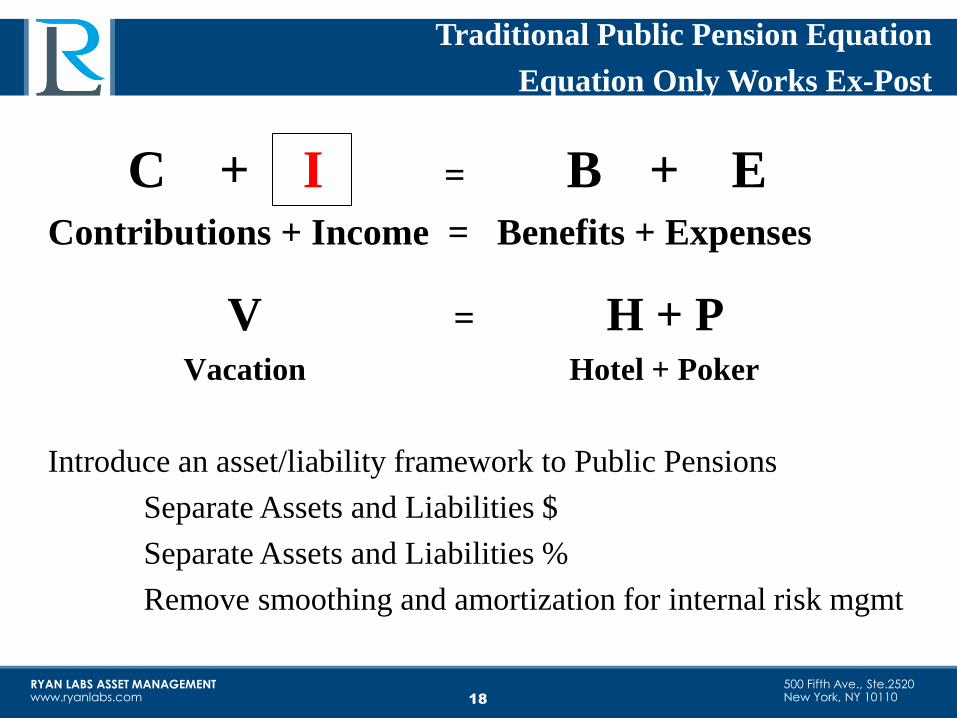
Traditional Public Pension Equation
Equation Only Works Ex-Post
C + I = B + E Contributions + Income = Benefits + Expenses
V = H + P Vacation Hotel + Poker
Introduce an asset/liability framework to Public Pensions
Separate Assets and Liabilities $
Separate Assets and Liabilities %
Remove smoothing and amortization for internal risk mgmt
management discussions
RYAN LABS ASSET MANAGEMENT www.ryanlabs.com
500 Fifth Ave., Ste.2520 New York, NY 10110 19
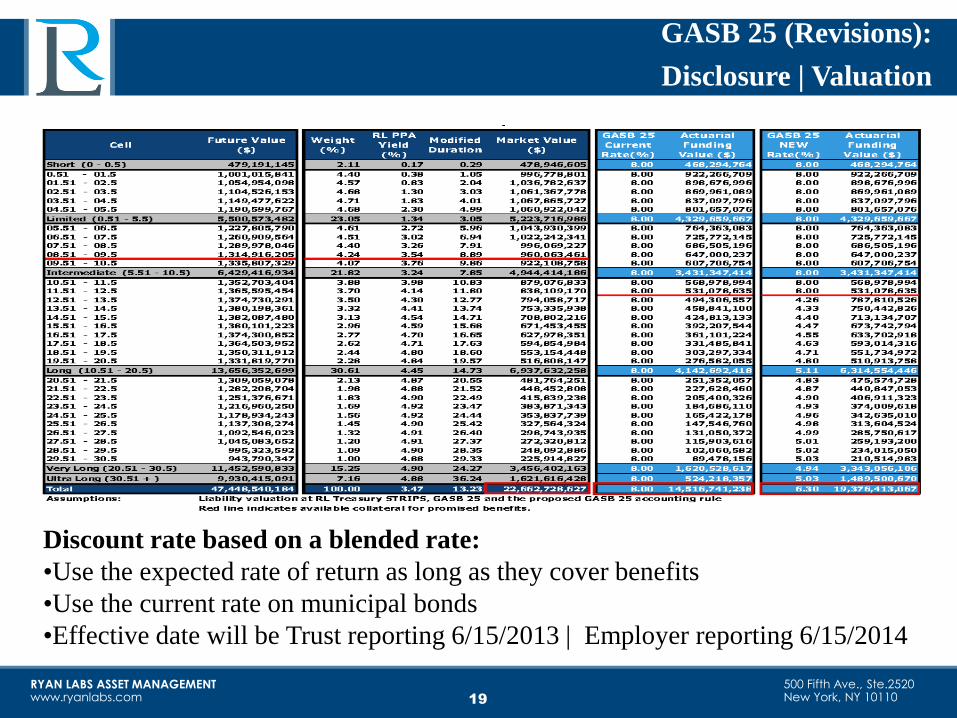
GASB 25 (Revisions):
Disclosure | Valuation
Discount rate based on a blended rate:
•Use the expected rate of return as long as they cover benefits
•Use the current rate on municipal bonds
•Effective date will be Trust reporting 6/15/2013 | Employer reporting 6/15/2014
RYAN LABS ASSET MANAGEMENT www.ryanlabs.com
500 Fifth Ave., Ste.2520 New York, NY 10110 20
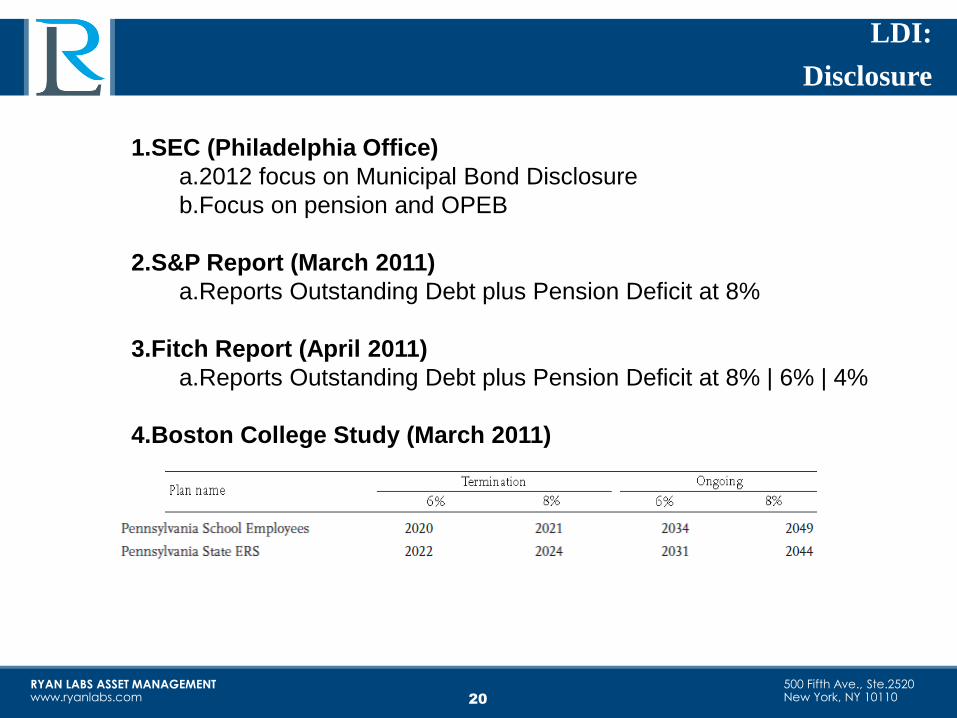
LDI:
Disclosure
1.SEC (Philadelphia Office)
a.2012 focus on Municipal Bond Disclosure
b.Focus on pension and OPEB
2.S&P Report (March 2011)
a.Reports Outstanding Debt plus Pension Deficit at 8%
3.Fitch Report (April 2011)
a.Reports Outstanding Debt plus Pension Deficit at 8% | 6% | 4%
4.Boston College Study (March 2011)
RYAN LABS ASSET MANAGEMENT www.ryanlabs.com
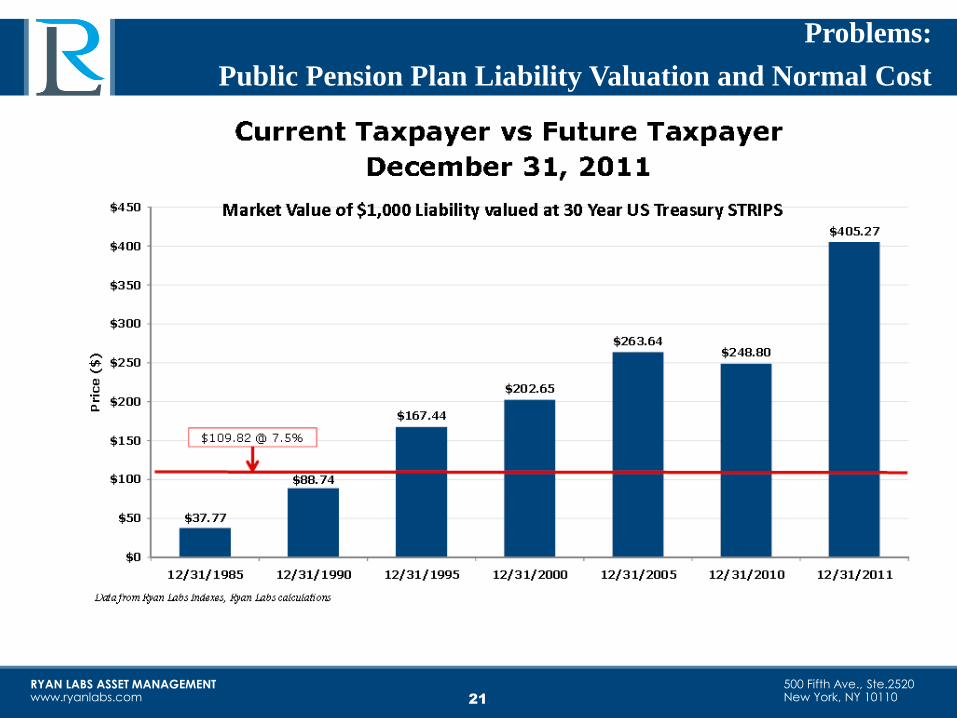
500 Fifth Ave., Ste.2520 New York, NY 10110 21
Problems:
Public Pension Plan Liability Valuation and Normal Cost
RYAN LABS ASSET MANAGEMENT www.ryanlabs.com
500 Fifth Ave., Ste.2520 New York, NY 10110 22
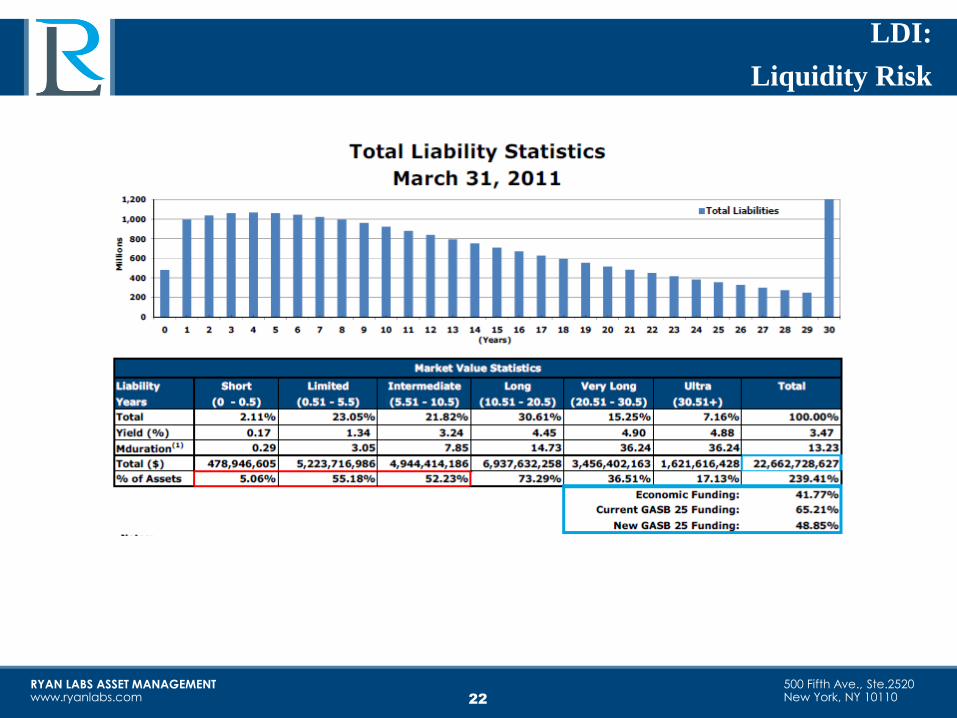
LDI:
Liquidity Risk
RYAN LABS ASSET MANAGEMENT www.ryanlabs.com
500 Fifth Ave., Ste.2520 New York, NY 10110 23
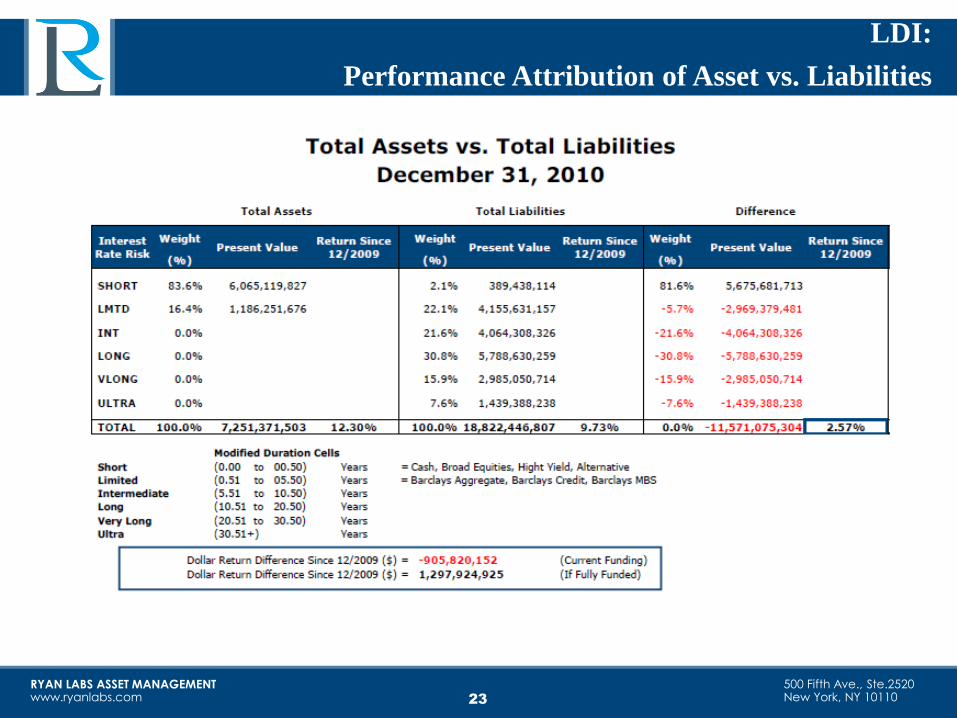
LDI:
Performance Attribution of Asset vs. Liabilities
Asset/Liabilities
RYAN LABS ASSET MANAGEMENT www.ryanlabs.com
500 Fifth Ave., Ste.2520 New York, NY 10110
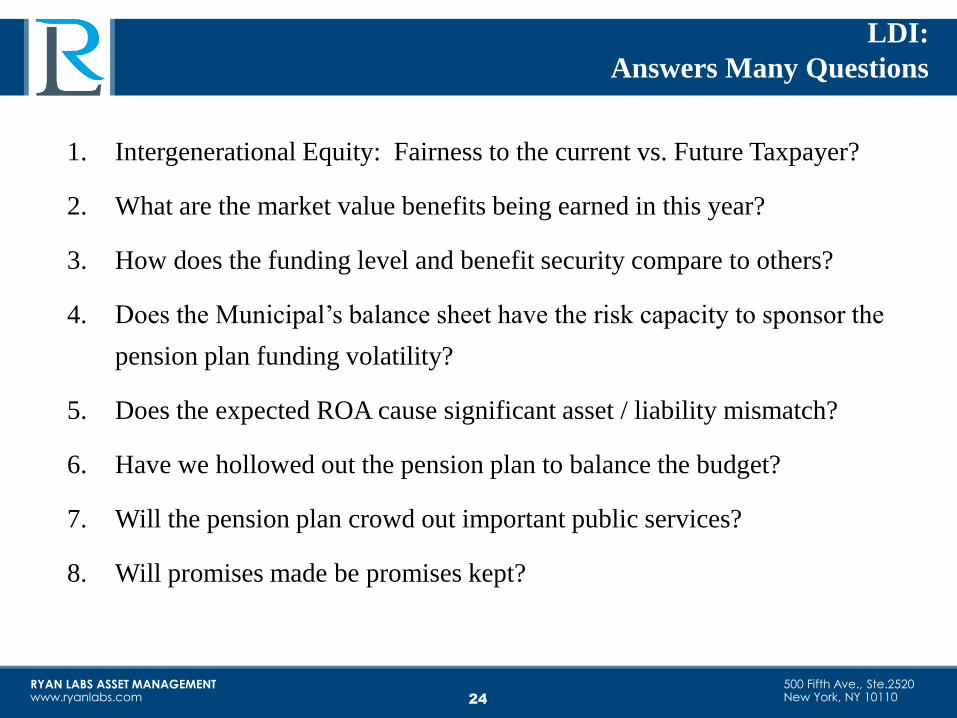
1. Intergenerational Equity: Fairness to the current vs. Future Taxpayer?
2. What are the market value benefits being earned in this year?
3. How does the funding level and benefit security compare to others?
4. Does the Municipal’s balance sheet have the risk capacity to sponsor the
pension plan funding volatility?
5. Does the expected ROA cause significant asset / liability mismatch?
6. Have we hollowed out the pension plan to balance the budget?
7. Will the pension plan crowd out important public services?
8. Will promises made be promises kept?
LDI:
Answers Many Questions
24
RYAN LABS ASSET MANAGEMENT www.ryanlabs.com
500 Fifth Ave., Ste.2520 New York, NY 10110
1. Mean Variance Models are asset only frameworks
2. MVL has utility for contributions, benefits, and asset allocation
3. Agency versus Pass-Through: Long-term agency is a half-truth
4. Solvency Vs Long Time horizons
5. Traditional methods do not provide sufficient data for risk management
6. Strong governance is necessary but not sufficient
7. Ratings agencies will change
Conclusion
25
RYAN LABS ASSET MANAGEMENT www.ryanlabs.com
500 Fifth Ave., Ste.2520 New York, NY 10110
Final Quotes:
Applicability of LDI to Public Pension
26
Quote One: In order for the interested parties to assist public pension plans,
we need to make sure that the asset side assumptions and liability side
assumptions are mutually consistent. NJIT Douglas Love, Ph.D. 2005
Quote Two: Although the primary purpose of pension funding in the private
sector is to provide collateral in case of bankruptcy, the primary purpose of
the public sector funding is to assure intergenerational equity (each
generation of taxpayers pay for public services it consumes
contemporaneously. Jeremy Gold, Ph.D. 2003
Quote Three: In order for public pension sponsor to assure that the meet
their retirement objective, a liability framework and custom liability index
should be implemented to capture the risk and reward of the enterprise.
Ryan Labs Asset Management 1991
RYAN LABS ASSET MANAGEMENT www.ryanlabs.com
500 Fifth Ave., Ste.2520 New York, NY 10110
Appendix
27
RYAN LABS ASSET MANAGEMENT www.ryanlabs.com
500 Fifth Ave., Ste.2520 New York, NY 10110
Problem: Traditional Mean Variance Model
28
Assumes normal distribution of returns in a fat tailed world
Only useful within VaR boundary | 2 standard deviations
Fails during highly correlated periods (1987, 1998, 2001, 2008, ...)
Brittle vis-a-vis black swan events
Academic exercise
RYAN LABS ASSET MANAGEMENT www.ryanlabs.com
500 Fifth Ave., Ste.2520 New York, NY 10110
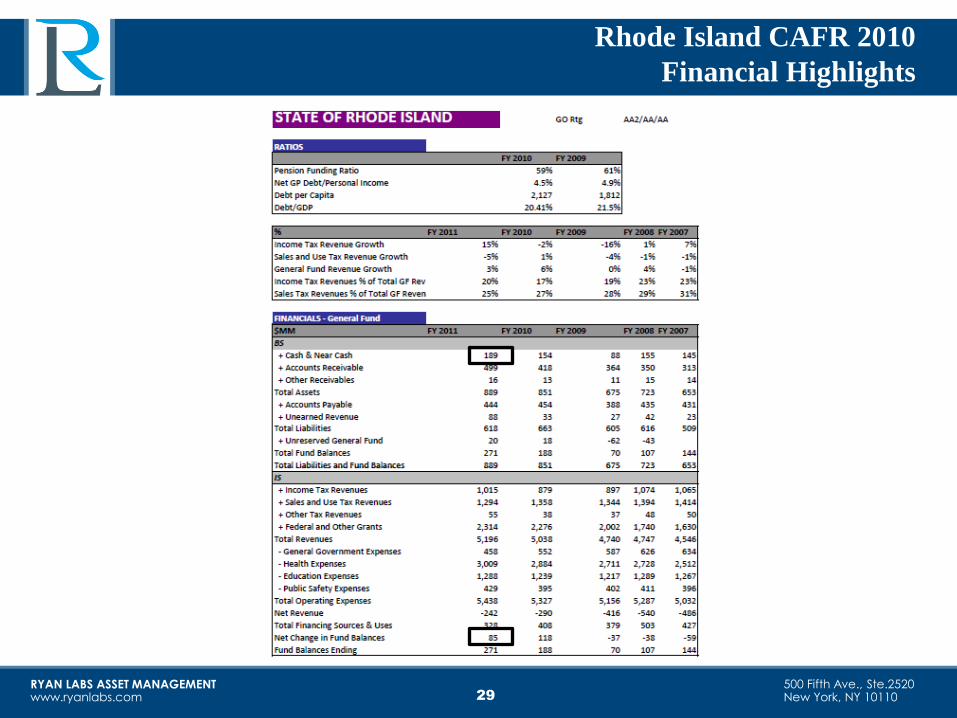
Rhode Island CAFR 2010
Financial Highlights
29
RYAN LABS ASSET MANAGEMENT www.ryanlabs.com
500 Fifth Ave., Ste.2520 New York, NY 10110
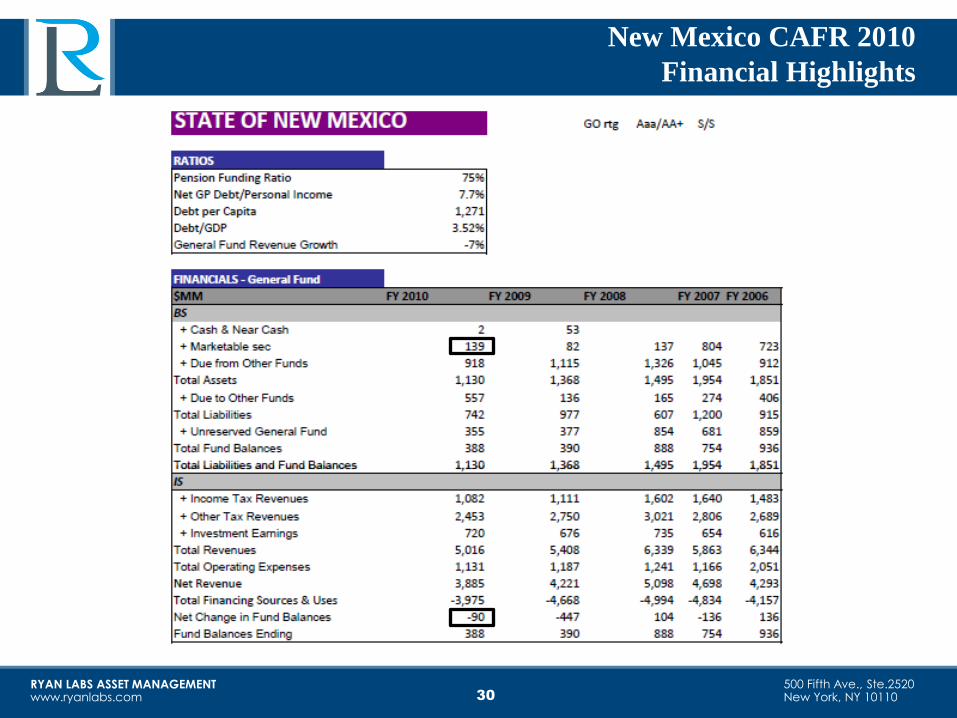
New Mexico CAFR 2010
Financial Highlights
30
RYAN LABS ASSET MANAGEMENT www.ryanlabs.com
500 Fifth Ave., Ste.2520 New York, NY 10110
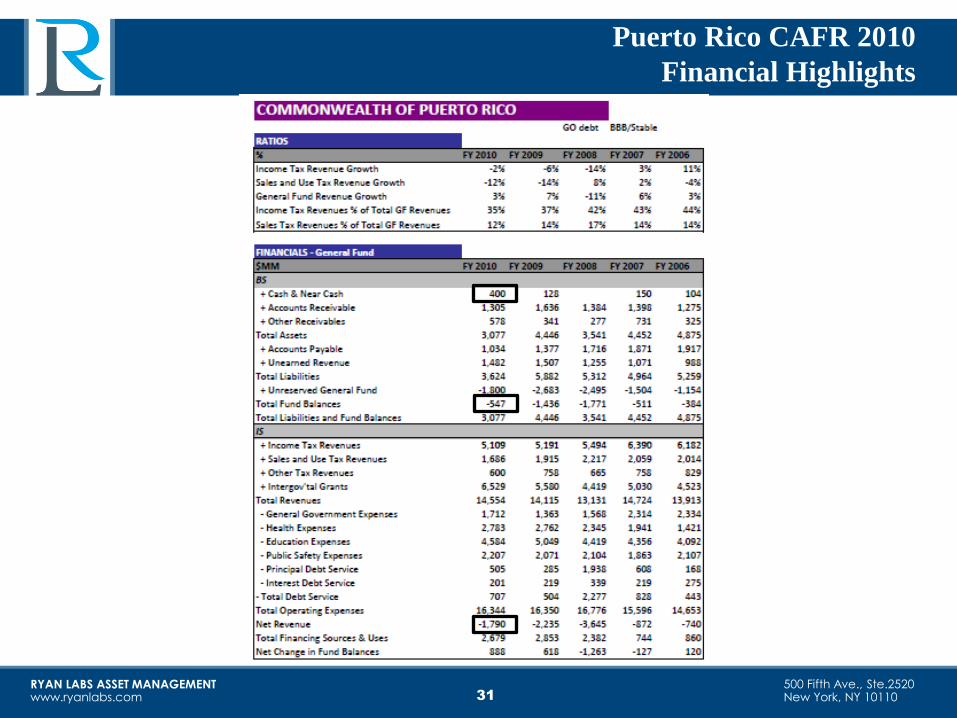
Puerto Rico CAFR 2010
Financial Highlights
31
RYAN LABS ASSET MANAGEMENT www.ryanlabs.com
500 Fifth Ave., Ste.2520 New York, NY 10110
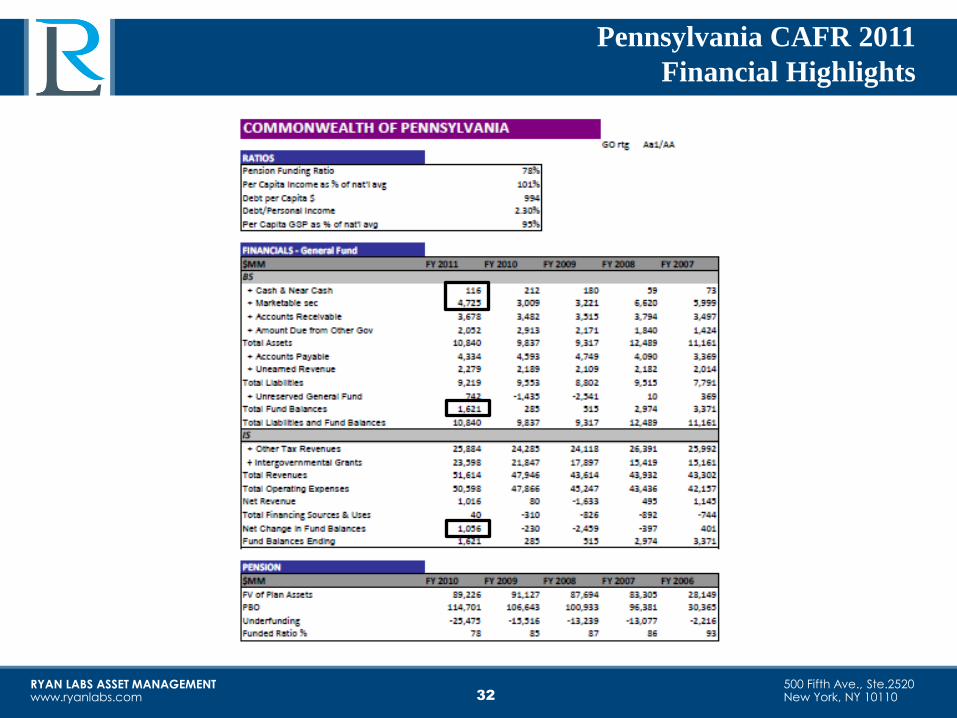
Pennsylvania CAFR 2011
Financial Highlights
32
RYAN LABS ASSET MANAGEMENT www.ryanlabs.com
500 Fifth Ave., Ste.2520 New York, NY 10110
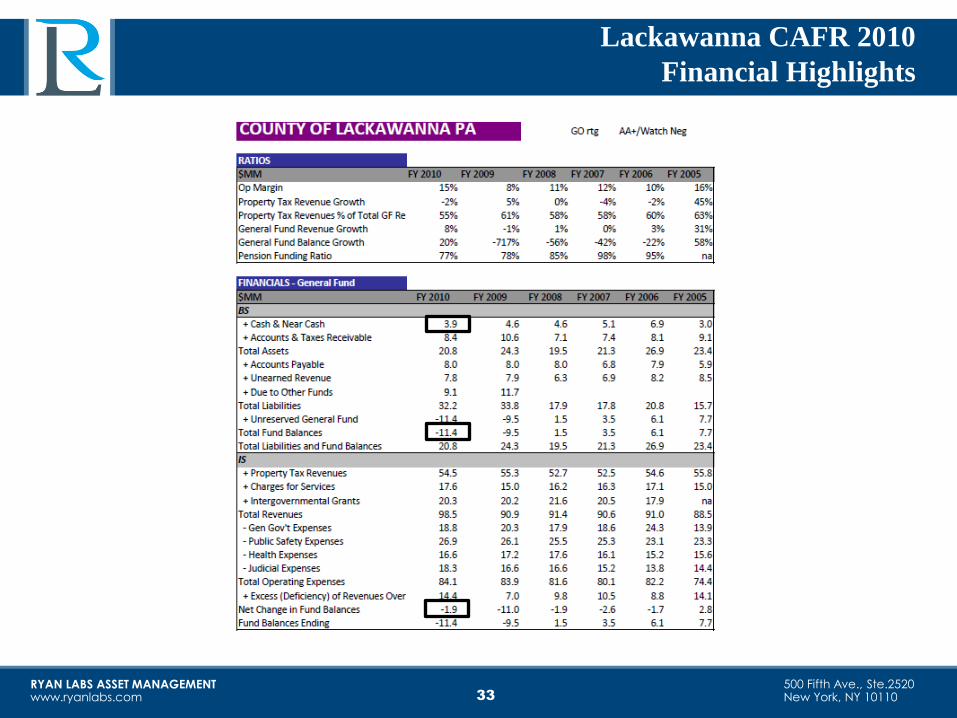
Lackawanna CAFR 2010
Financial Highlights
33
RYAN LABS ASSET MANAGEMENT www.ryanlabs.com
500 Fifth Ave., Ste.2520 New York, NY 10110
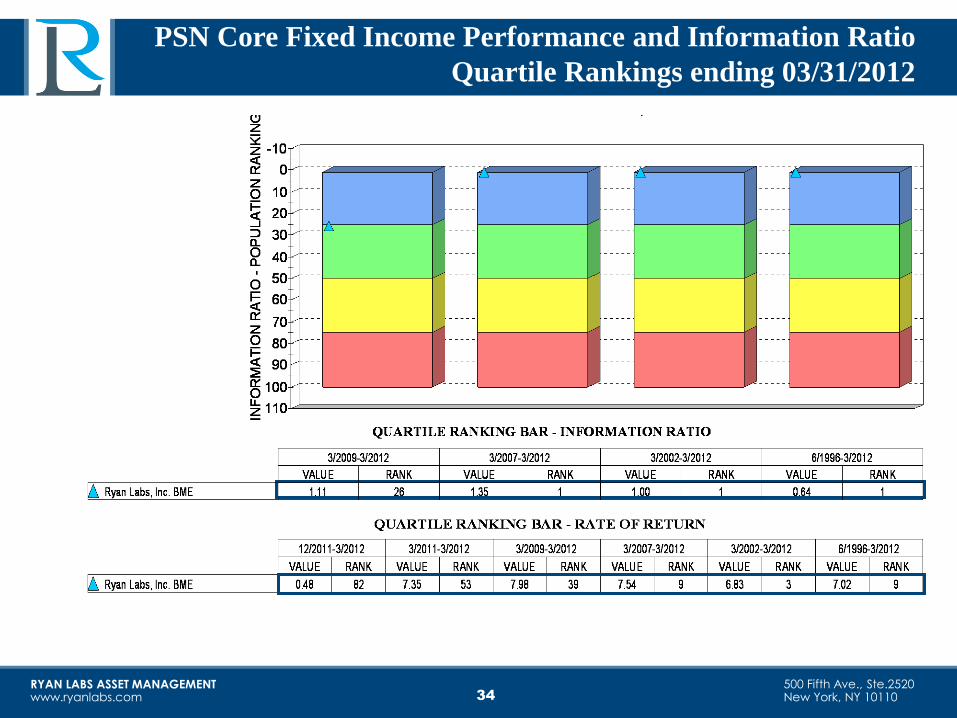
PSN Core Fixed Income Performance and Information Ratio
Quartile Rankings ending 03/31/2012
34
RYAN LABS ASSET MANAGEMENT www.ryanlabs.com
500 Fifth Ave., Ste.2520 New York, NY 10110
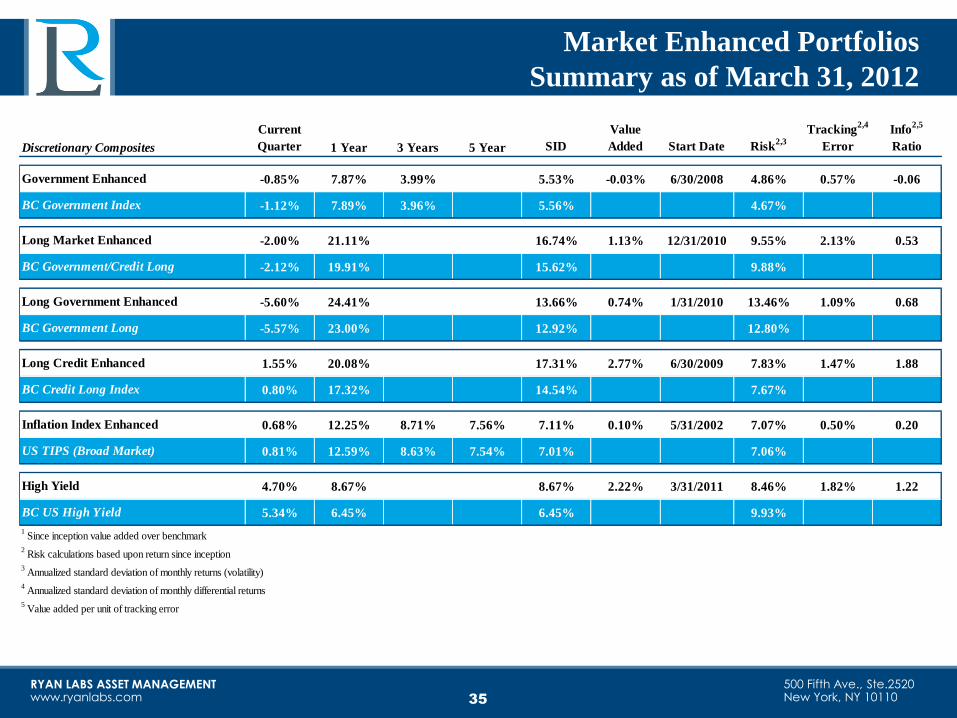
Market Enhanced Portfolios
Summary as of March 31, 2012
35
Discretionary Composites
Current
Quarter 1 Year 3 Years 5 Year SID
Value
Added Start Date Risk2,3
Tracking2,4
Error
Info2,5
Ratio3 12 36 60
-0.85% 7.87% 3.99% 5.53% -0.03% 6/30/2008 4.86% 0.57% -0.06
-1.12% 7.89% 3.96% 5.56% 4.67%
-2.00% 21.11% 16.74% 1.13% 12/31/2010 9.55% 2.13% 0.53
-2.12% 19.91% 15.62% 9.88%
-5.60% 24.41% 13.66% 0.74% 1/31/2010 13.46% 1.09% 0.68
-5.57% 23.00% 12.92% 12.80%
1.55% 20.08% 17.31% 2.77% 6/30/2009 7.83% 1.47% 1.88
0.80% 17.32% 14.54% 7.67%
0.68% 12.25% 8.71% 7.56% 7.11% 0.10% 5/31/2002 7.07% 0.50% 0.20
0.81% 12.59% 8.63% 7.54% 7.01% 7.06%
4.70% 8.67% 8.67% 2.22% 3/31/2011 8.46% 1.82% 1.22
BC US High Yield 5.34% 6.45% 6.45% 9.93%
1 Since inception value added over benchmark
2 Risk calculations based upon return since inception
3 Annualized standard deviation of monthly returns (volatility)
4 Annualized standard deviation of monthly differential returns
5 Value added per unit of tracking error
BC Credit Long Index
Government Enhanced
BC Government Index
Long Market Enhanced
BC Government/Credit Long
Long Government Enhanced
BC Government Long
Long Credit Enhanced
Inflation Index Enhanced
US TIPS (Broad Market)
High Yield
RYAN LABS ASSET MANAGEMENT www.ryanlabs.com
500 Fifth Ave., Ste.2520 New York, NY 10110
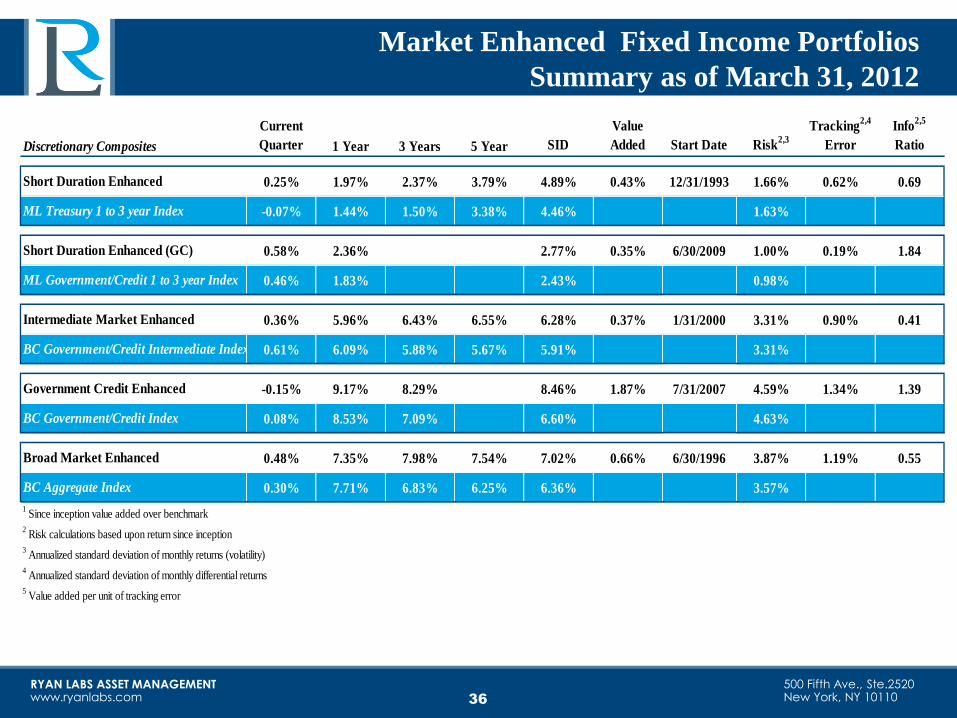
Market Enhanced Fixed Income Portfolios
Summary as of March 31, 2012
36
Discretionary Composites
Current
Quarter 1 Year 3 Years 5 Year SID
Value
Added Start Date Risk2,3
Tracking2,4
Error
Info2,5
Ratio
0.25% 1.97% 2.37% 3.79% 4.89% 0.43% 12/31/1993 1.66% 0.62% 0.69
-0.07% 1.44% 1.50% 3.38% 4.46% 1.63%
0.58% 2.36% 2.77% 0.35% 6/30/2009 1.00% 0.19% 1.84
0.46% 1.83% 2.43% 0.98%
0.36% 5.96% 6.43% 6.55% 6.28% 0.37% 1/31/2000 3.31% 0.90% 0.41
0.61% 6.09% 5.88% 5.67% 5.91% 3.31%
-0.15% 9.17% 8.29% 8.46% 1.87% 7/31/2007 4.59% 1.34% 1.39
0.08% 8.53% 7.09% 6.60% 4.63%
0.48% 7.35% 7.98% 7.54% 7.02% 0.66% 6/30/1996 3.87% 1.19% 0.55
0.30% 7.71% 6.83% 6.25% 6.36% 3.57%
1 Since inception value added over benchmark
2 Risk calculations based upon return since inception
3 Annualized standard deviation of monthly returns (volatility)
4 Annualized standard deviation of monthly differential returns
5 Value added per unit of tracking error
Past performance of the account is not indicative of future results. The performance above is gross of all fees and expenses for the stated period and assumes reinvestment of dividends and other earnings. Risk Return
characteristics are based on returns from inception of each account through present and do not reflect the deduction of advisory fees. An advisory fee reduces the investor’s return and any other expenses Ryan Labs may
incur managing the investment advisory account. The investment advisory fees are described in Part II of the Ryan Labs Form ADV. The investment advisory fee charged to each investor causes their return to be lower
than the gross returns presented above. For example, on a $100,000,000 investment, an investment advisory fee of $170,000 per year is deducted from the account. For example, an account with a compounded annual
total return of 10% would have increased by 159% over ten years. Assuming an annual advisory fee of 0.17%, this increase would be 155%. All returns are calculated net of transaction costs, and gross of taxes on
dividends and interest. Performance results are based on US dollar returns. Investment results may vary. No assurance can be given that the investment objective will be achieved, and an investor may lose money. Due
to current market volatility, current performance may be lower than that of the figures shown.
This material is intended for informational purposes only and does not constitute investment advice, a recommendation, or an offer or solicitation to purchase or sell any security or other instrument. The Account’s total
return will fluctuate over a wider range than money market investments due to greater sensitivity to (i) interest rates, (ii) market conditions, (iii) and maturities. Custom Liability Indices are comprised of high quality
government zero coupon bonds which reflect varying durations based on the client parameters. Indexes are unmanaged and are not subject to transaction charges or expenses. An investor may not invest directly in an
index.
Government Credit Enhanced
BC Aggregate Index
Broad Market Enhanced
BC Government/Credit Index
BC Government/Credit Intermediate Index
Intermediate Market Enhanced
ML Government/Credit 1 to 3 year Index
Short Duration Enhanced (GC)
ML Treasury 1 to 3 year Index
Short Duration Enhanced
RYAN LABS ASSET MANAGEMENT www.ryanlabs.com
500 Fifth Ave., Ste.2520 New York, NY 10110
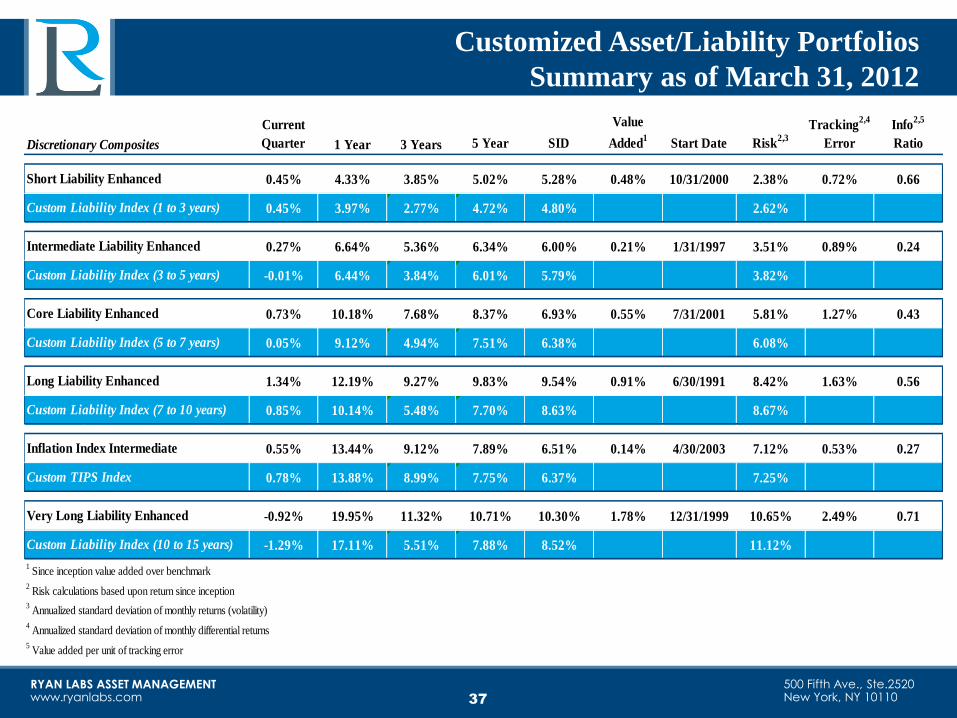
Customized Asset/Liability Portfolios
Summary as of March 31, 2012
37
Discretionary Composites
Current
Quarter 1 Year 3 Years 5 Year SID
Value
Added1
Start Date Risk2,3
Tracking2,4
Error
Info2,5
Ratio
0.45% 4.33% 3.85% 5.02% 5.28% 0.48% 10/31/2000 2.38% 0.72% 0.66
0.45% 3.97% 2.77% 4.72% 4.80% 2.62%
0.27% 6.64% 5.36% 6.34% 6.00% 0.21% 1/31/1997 3.51% 0.89% 0.24
-0.01% 6.44% 3.84% 6.01% 5.79% 3.82%
0.73% 10.18% 7.68% 8.37% 6.93% 0.55% 7/31/2001 5.81% 1.27% 0.43
0.05% 9.12% 4.94% 7.51% 6.38% 6.08%
1.34% 12.19% 9.27% 9.83% 9.54% 0.91% 6/30/1991 8.42% 1.63% 0.56
0.85% 10.14% 5.48% 7.70% 8.63% 8.67%
0.55% 13.44% 9.12% 7.89% 6.51% 0.14% 4/30/2003 7.12% 0.53% 0.27
0.78% 13.88% 8.99% 7.75% 6.37% 7.25%
-0.92% 19.95% 11.32% 10.71% 10.30% 1.78% 12/31/1999 10.65% 2.49% 0.71
-1.29% 17.11% 5.51% 7.88% 8.52% 11.12%
3 Annualized standard deviation of monthly returns (volatility)
4 Annualized standard deviation of monthly differential returns
5 Value added per unit of tracking error
1 Since inception value added over benchmark
2 Risk calculations based upon return since inception
Custom TIPS Index
Very Long Liability Enhanced
Custom Liability Index (10 to 15 years)
Custom Liability Index (7 to 10 years)
Inflation Index Intermediate
Core Liability Enhanced
Custom Liability Index (5 to 7 years)
Long Liability Enhanced
Custom Liability Index (3 to 5 years)
Short Liability Enhanced
Custom Liability Index (1 to 3 years)
Intermediate Liability Enhanced
RYAN LABS ASSET MANAGEMENT www.ryanlabs.com
500 Fifth Ave., Ste.2520 New York, NY 10110
Past performance of the account is not indicative of future results. The performance above is gross of all fees and expenses for the stated
period and assumes reinvestment of dividends and other earnings. Risk Return characteristics are based on returns from inception of the
account through the stated date and do not reflect the deduction of advisory fees. An advisory fee reduces the investor’s return and any
other expenses Ryan Labs may incur managing the investment advisory account. The investment advisory fees are described in Part II
of the Ryan Labs Form ADV. The investment advisory fee charged to each investor causes their return to be lower than the gross returns
presented above. For example, on a $100,000,000 investment, an investment advisory fee of $170,000 per year is deducted from the
account. For example, an account with a compounded annual total return of 10% would have increased by 159% over ten years.
Assuming an annual advisory fee of 0.17%, this increase would be 155%. All returns are calculated net of transaction costs, and gross of
taxes on dividends and interest. Performance results are based on US dollar returns.
Investment results may vary. No assurance can be given that the investment objective will be achieved, and an investor may lose money.
Due to current market volatility, current performance may be lower than that of the figures shown. This material is intended for
informational purposes only and does not constitute investment advice, a recommendation, or an offer or solicitation to purchase or sell
any security or other instrument. The Account’s total return will fluctuate over a wider range than money market investments due to
greater sensitivity to (i) interest rates, (ii) market conditions, (iii) and maturities. The Barclays Aggregate Index is comprised of
domestic investment grade fixed income securities with maturities of 1 to 30 years. Pursuant to the rules of the Index, the Index’s
portfolio must (i) have at least one year to final maturity, (ii) have at least $100 million par amount outstanding, (iii) be fixed rate, (iv) be
U.S. Dollar denominated and non-convertible, (v) and be publicly issued. Indexes are unmanaged and are not subject to transaction
charges or expenses. An investor may not invest directly in an index.
The term “modified duration” is derived from the duration of any security or series of securities and provides a measure of the risk with
which the sensitivity of bonds or bond portfolios to interest rate changes can be estimated. A 1% increase (or decrease) in the interest
rate accordingly produces a percentage fall (or rise) in the price in proportion to the modified duration. For example, assume that the
modified duration of a bond portfolio is 4.5 years and the theoretical YTW is 5.3%. If the interest rate drops by 1% to 4.3%, the portfolio
price increases by approximately 4.5%.
Performance Disclosures
38
RYAN LABS ASSET MANAGEMENT www.ryanlabs.com
500 Fifth Ave., Ste.2520 New York, NY 10110
Liability Disclosures
39


![cespiti [modalità compatibilità] - DataConsult Srlsv.dataconsultsrl.it/v78/newweb/manualistica/cespiti_SLIDES.pdf · Registrazione fatture e inserimenti dati pregressi MPRI –](https://img.pdfslide.net/doc/110x75/5c69095709d3f25c6a8c7161/cespiti-modalita-compatibilita-dataconsult-srlsv-registrazione-fatture.jpg)