Embed Size (px)
Citation preview

仁恒置地集团仁恒置地集团仁恒置地集团仁恒置地集团YANLORD LAND GROUP LIMITED
4Q and FY 2016 Results Presentation

Yanlord 4Q and FY 2016 Business
Review

3
Yanlord 4Q 2016 Business Review
• Healthy home buyer demand helped propel the Group’s pre-sale accumulation in FY 2016. Pre-
sales of properties and car parks rose approximately 15.1% year-on-year to RMB33.257 billion in
FY 2016 from RMB28.887 billion in FY 2015. Accumulated pre-sales pending recognition as at 31
December 2016 was RMB26.488 billion.
• In-line with the Group’s delivery schedule, 4Q 2016 revenue was lower at RMB9.902 billion,
however, the increased delivery of higher margin projects in 4Q 2016 helped propel the Group’s
gross profit up 62.3% to RMB4.206 billion. Gross profit margin for the period rose to 42.5% in 4Q
2016 compared with 25.3% in 4Q 2015.
• In-line with the significant growth in gross profits, profit attributable to owners of the Company in 4Q
2016 rose 26.3% to RMB1.549 billion. Net attributable profit margin similarly rose to 15.6% in 4Q
2016 from 12.0% in 4Q 2015.

4
Yanlord FY 2016 Business Review
• On the back of strong demand for its developments, the Group’s revenue jumped 54.8% to
RMB25.664 billion in FY 2016 from RMB16.581 billion in FY 2015. Owing to the increased delivery
of higher margin projects in FY 2016, the Group experienced a margin expansion with gross profit
margin rising to 31.2% from 27.5% in FY 2015.
• Underlined by the significant revenue growth, profit attributable to owners of the Company in FY
2016 leapt 83.7% to RMB2.697 billion from RMB1.469 billion in FY 2015. Fully diluted earnings per
share in FY 2016 rose 83.9% to 138.56 Renminbi cents from 75.36 Renminbi cents in FY 2015.
• Excluding the fair value gain on investment properties and net foreign exchange effect, profit
attributable to owners of the Company in FY 2016 leapt 109.0% to RMB2.292 billion from
RMB1.095 billion in FY 2015.

5
Yanlord 4Q and FY 2016 Business Review
• Robust sales collection help to maintain the Group’s net debt to total equity gearing ratio at a healthy
20.3% and raised cash and cash equivalents position to RMB17.583 billion as at 31 December 2016.
• To better enhance shareholder value and drive the Company’s long term development strategy, the
Board of Directors has proposed a higher first and final dividend of 4.35 Singapore cents
(approximately 20.86 Renminbi cents per ordinary share) which is approximately 186.2% higher than
the 1.52 Singapore cents paid out in FY 2015.
• Yanlord is confident about its performance for FY 2017, driven by continued sales of its
developments and larger proportion of pre-sales recognition in subsequent periods.

Key Financial Highlights
7
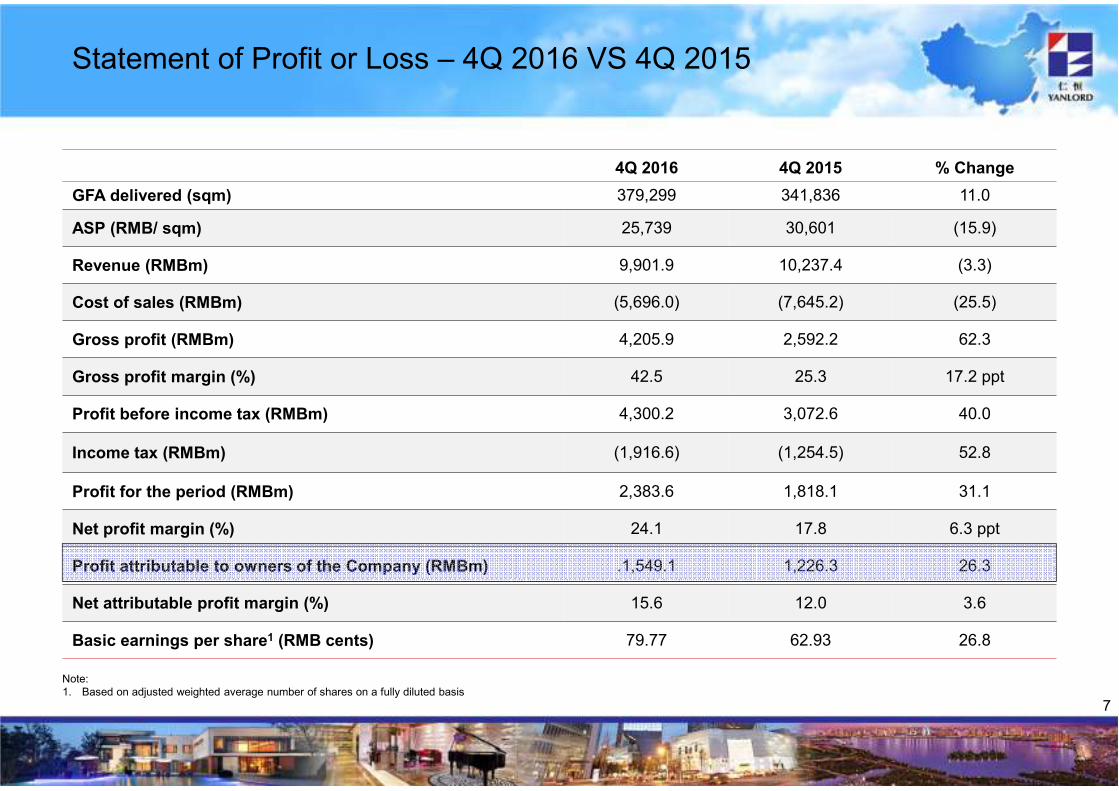
Statement of Profit or Loss – 4Q 2016 VS 4Q 2015
4Q 2016 4Q 2015 % Change
GFA delivered (sqm) 379,299 341,836 11.0
ASP (RMB/ sqm) 25,739 30,601 (15.9)
Revenue (RMBm) 9,901.9 10,237.4 (3.3)
Cost of sales (RMBm) (5,696.0) (7,645.2) (25.5)
Gross profit (RMBm) 4,205.9 2,592.2 62.3
Gross profit margin (%) 42.5 25.3 17.2 ppt
Profit before income tax (RMBm) 4,300.2 3,072.6 40.0
Income tax (RMBm) (1,916.6) (1,254.5) 52.8
Profit for the period (RMBm) 2,383.6 1,818.1 31.1
Net profit margin (%) 24.1 17.8 6.3 ppt
Profit attributable to owners of the Company (RMBm) .1,549.1 1,226.3 26.3
Net attributable profit margin (%) 15.6 12.0 3.6
Basic earnings per share1 (RMB cents) 79.77 62.93 26.8
Note:
1. Based on adjusted weighted average number of shares on a fully diluted basis

8
Statement of Profit or Loss – FY 2016 VS FY 2015
FY 2016 FY 2015 % Change
GFA delivered (sqm) 944,834 590,170 60.1
ASP (RMB/ sqm) 26,812 27,303 (1.8)
Revenue (RMBm) 25,664.4 16,581.4 54.8
Cost of sales (RMBm) (17,644.7) (12,026.2) 46.7
Gross profit (RMBm) 8,019.7 4,555.2 76.1
Gross profit margin (%) 31.2% 27.5% 3.7 ppt
Profit before income tax (RMBm) 7,472.2 4,317.1 73.1
Income tax (RMBm) (3,495.0) (1,946.7) 79.5
Profit for the period (RMBm) 3,977.2 2,370.4 67.8
Net profit margin (%) 15.5% 14.3% 1.2 ppt
Profit attributable to owners of the Company (RMBm) 2,697.4 1,468.5 83.7
Net attributable profit margin (%) 10.5% 8.9% 1.6 ppt
Basic earnings per share1 (RMB cents) 138.56 75.36 83.9
Note:
1. Based on adjusted weighted average number of shares on a fully diluted basis

9
Financials – Snapshot as at 31 December 2016
As at 31 Dec 16 As at 31 Dec 15 % Change
Current assets (RMBm) 70,610.5 60,156.9 17.4
Non-current assets (RMBm) 22,837.9 19,740.5 15.7
Total assets (RMBm) 93,448.4 79,897.4 17.0
Current liabilities (RMBm) 46,997.9 34,980.7 34.4
Non-current liabilities (RMBm) 16,440.9 14,382.3 14.3
Total equity (Incl. NCI) (RMBm) 30,009.6 30,534.5 (1.7)
Cash and cash equivalents (RMBm) 17,583.4 17,517.0 0.4
Short-term debt (RMBm) 8,983.1 4,097.4 119.2
Senior notes (RMBm) 1,916.3 6,268.3 79.3
Long-term debt (RMBm) 12,775.6 8,022.1 (69.4)
Net debt (RMBm) 6,091.6 870.8 59.3
10
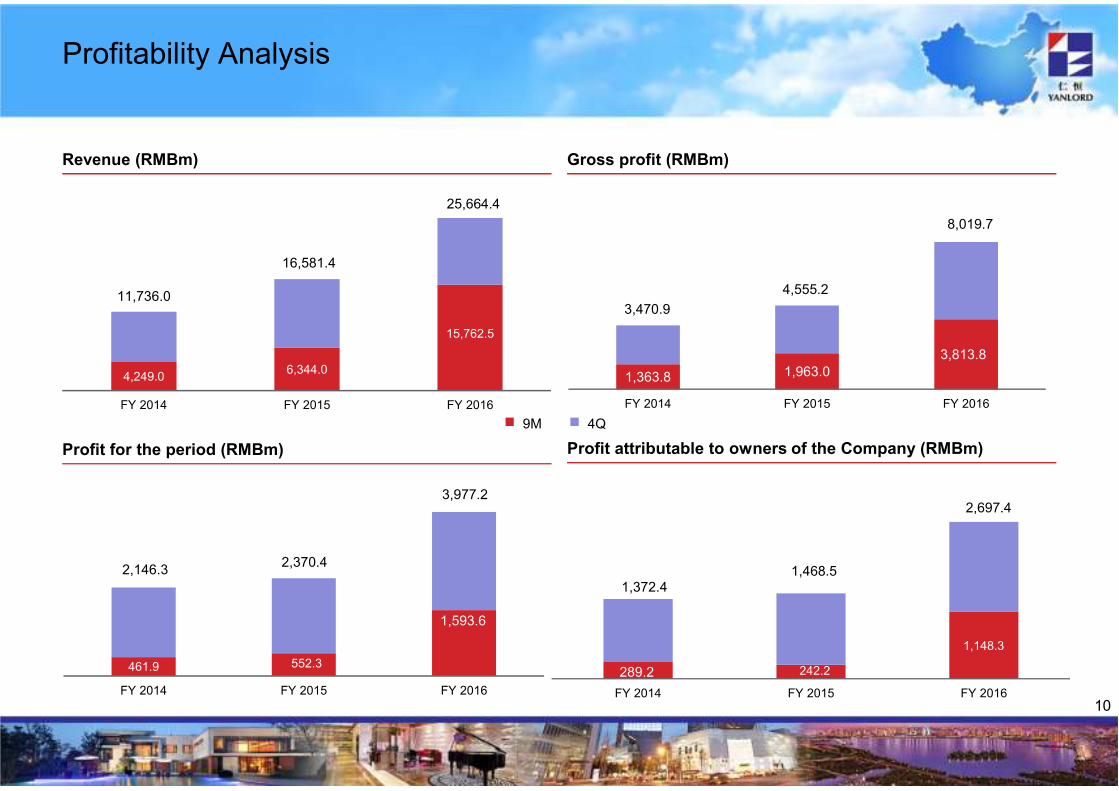
Profitability Analysis
Revenue (RMBm) Gross profit (RMBm)
Profit for the period (RMBm) Profit attributable to owners of the Company (RMBm)
4,249.06,344.0
15,762.5
11,736.0
16,581.4
FY 2014 FY 2015 FY 2016
1,363.8 1,963.0
3,813.8
3,470.9
FY 2014 FY 2015 FY 2016
4,555.2
461.9 552.3
2,146.3
FY 2014 FY 2015 FY 2016
2,370.4
289.2
1,372.4
FY 2014 FY 2015 FY 2016
1,468.5
242.2
9M 4Q
1,593.6
25,664.4
8,019.7
3,977.22,697.4
1,148.3
11
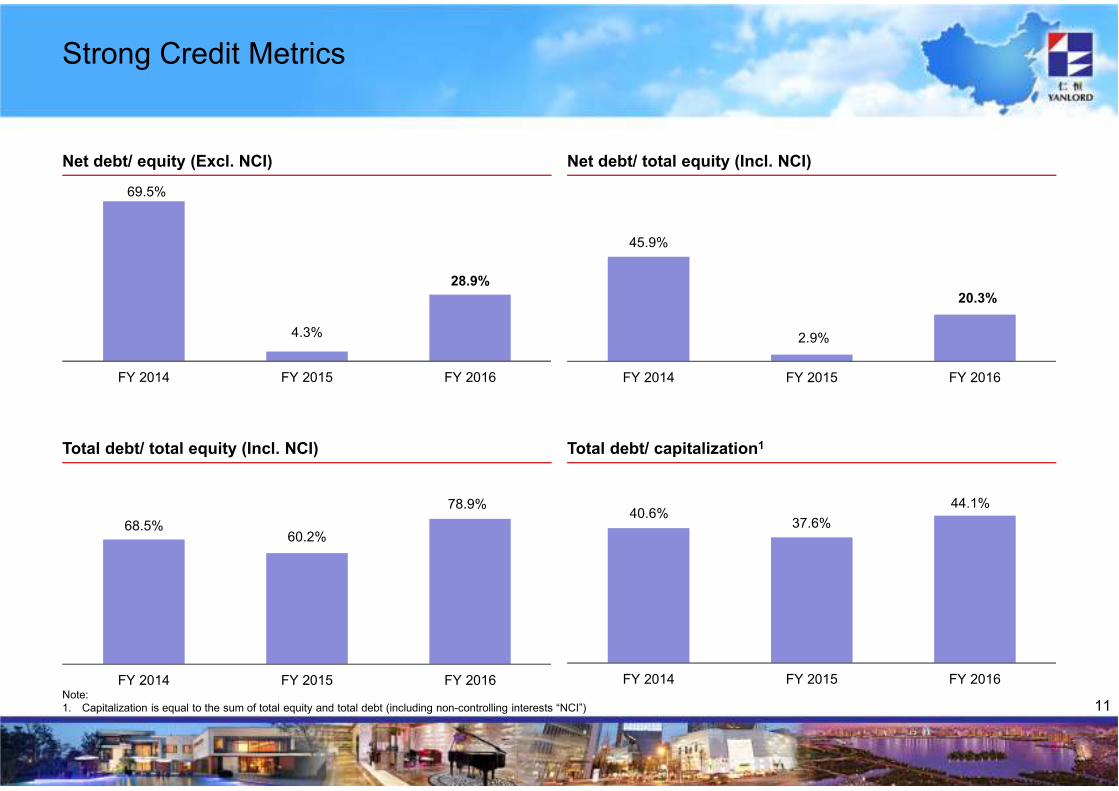
Strong Credit Metrics
Total debt/ capitalization1Total debt/ total equity (Incl. NCI)
Net debt/ equity (Excl. NCI) Net debt/ total equity (Incl. NCI)
69.5%
4.3%
28.9%
FY 2014 FY 2015 FY 2016
20.3%
45.9%
2.9%
FY 2014 FY 2015 FY 2016
68.5%
78.9%
60.2%
FY 2014 FY 2015 FY 2016
44.1%40.6%
37.6%
FY 2014 FY 2015 FY 2016Note:
1. Capitalization is equal to the sum of total equity and total debt (including non-controlling interests “NCI”)

Business and Operation
Overview

13
GFA/ Property Sale Contribution Analysis in FY 2016By city, project and ASP
Major projects delivered in FY 2016 GFA (sqm) ASP (RMB/ sqm) Property sales by project (%)
Nanjing Oasis New Island Gardens (Phase 1) 101,382 25,760 10.6
Nanjing Yanlord Yangtze Riverbay Town (Phase 4) 115,682 38,561 17.2
Shanghai Yanlord Eastern Gardens 97,126 43,026 16.1
Shanghai Yanlord Sunland Gardens (Phase 2) 29,832 47,901 5.8
Shanghai Yanlord Western Gardens 57,525 40,970 9.1
Tianjin Jinnan Land (Phase 1) 74,648 13,245 4.0
Tianjin Jinnan Land (Phase 2) 67,280 12,695 3.3
Zhuhai Yanlord Marina Peninsula Gardens (Phase 1) 116,537 17,088 7.7
Others 284,822 - 26.2
Property Sale Contribution by City GFA Contribution by City
13.5%
21.4%
2.4%
10.6%
16.9%
12.2%
23.0%
7.7%
33.3%
9.5%
9.3%
Chengdu Shanghai
Nanjing Suzhou
Tianjin Zhuhai
Shenzhen
7.7%
28.0%
8.6% 34.5%
2.4%
14
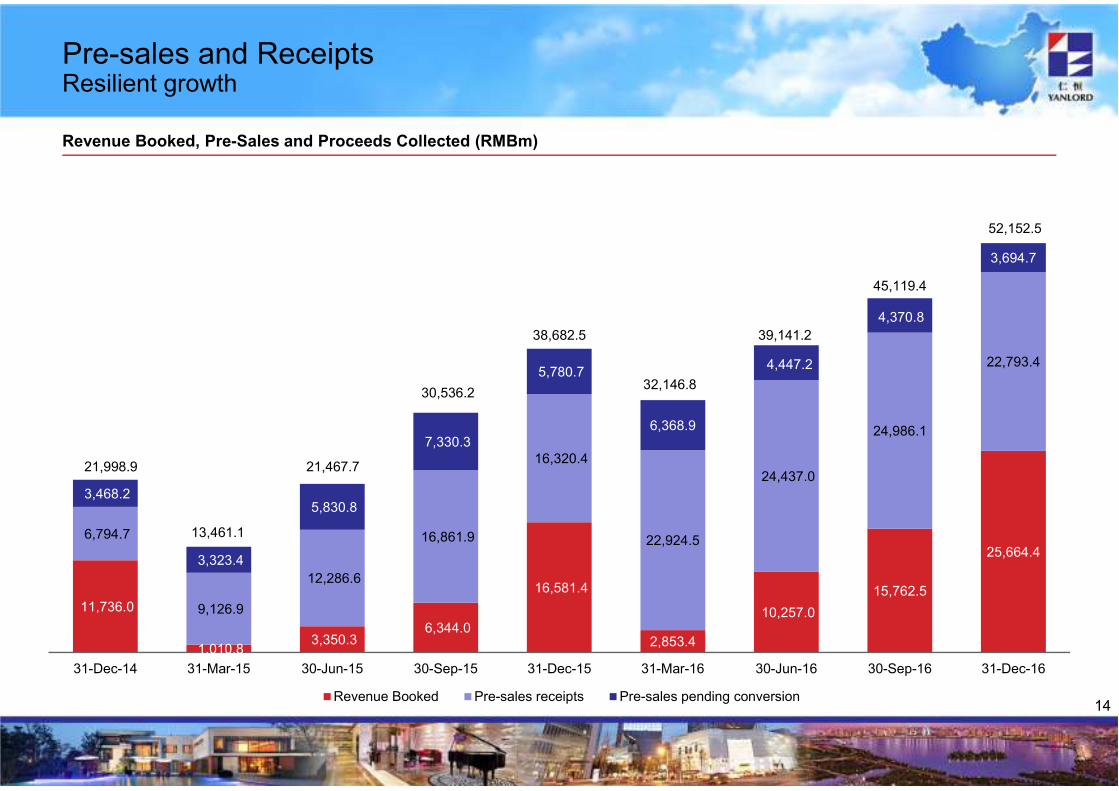
Pre-sales and ReceiptsResilient growth
Revenue Booked, Pre-Sales and Proceeds Collected (RMBm)
11,736.0
1,010.8 3,350.3
6,344.0
16,581.4
2,853.4
10,257.0
15,762.5
25,664.4
6,794.7
9,126.9
12,286.6
16,861.9
16,320.4
22,924.5
24,437.0
24,986.1
22,793.4
3,468.2
3,323.4
5,830.8
7,330.3
5,780.7
6,368.9
4,447.2
4,370.8
3,694.7
31-Dec-14 31-Mar-15 30-Jun-15 30-Sep-15 31-Dec-15 31-Mar-16 30-Jun-16 30-Sep-16 31-Dec-16
Revenue Booked Pre-sales receipts Pre-sales pending conversion
32,146.8
52,152.5
30,536.2
21,998.9
13,461.1
21,467.7
38,682.5 39,141.2
45,119.4
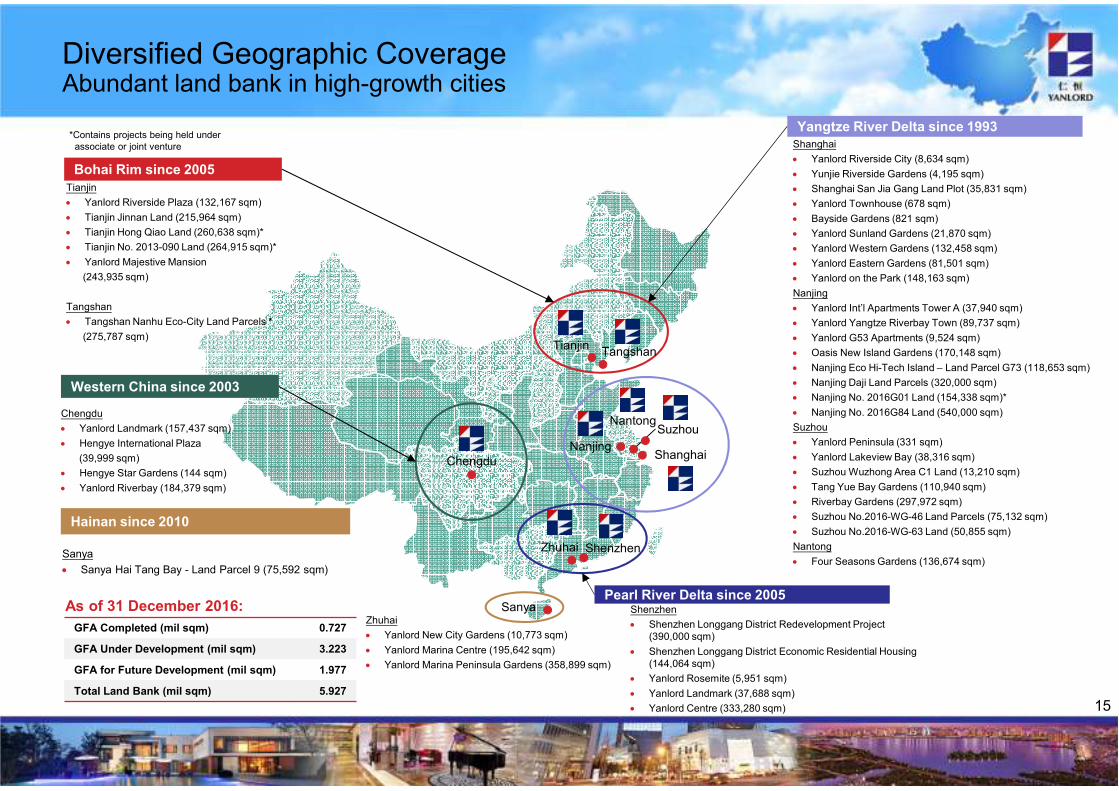
15
Diversified Geographic Coverage Abundant land bank in high-growth cities
Tianjin
Shanghai
Suzhou
Nanjing
Zhuhai
Chengdu
GFA Completed (mil sqm) 0.727
GFA Under Development (mil sqm) 3.223
GFA for Future Development (mil sqm) 1.977
Total Land Bank (mil sqm) 5.927
Bohai Rim since 2005
Tianjin
• Yanlord Riverside Plaza (132,167 sqm)
• Tianjin Jinnan Land (215,964 sqm)
• Tianjin Hong Qiao Land (260,638 sqm)*
• Tianjin No. 2013-090 Land (264,915 sqm)*
• Yanlord Majestive Mansion
(243,935 sqm)
Tangshan
• Tangshan Nanhu Eco-City Land Parcels *
(275,787 sqm)
Shanghai
• Yanlord Riverside City (8,634 sqm)
• Yunjie Riverside Gardens (4,195 sqm)
• Shanghai San Jia Gang Land Plot (35,831 sqm)
• Yanlord Townhouse (678 sqm)
• Bayside Gardens (821 sqm)
• Yanlord Sunland Gardens (21,870 sqm)
• Yanlord Western Gardens (132,458 sqm)
• Yanlord Eastern Gardens (81,501 sqm)
• Yanlord on the Park (148,163 sqm)
Nanjing
• Yanlord Int’l Apartments Tower A (37,940 sqm)
• Yanlord Yangtze Riverbay Town (89,737 sqm)
• Yanlord G53 Apartments (9,524 sqm)
• Oasis New Island Gardens (170,148 sqm)
• Nanjing Eco Hi-Tech Island – Land Parcel G73 (118,653 sqm)
• Nanjing Daji Land Parcels (320,000 sqm)
• Nanjing No. 2016G01 Land (154,338 sqm)*
• Nanjing No. 2016G84 Land (540,000 sqm)
Suzhou
• Yanlord Peninsula (331 sqm)
• Yanlord Lakeview Bay (38,316 sqm)
• Suzhou Wuzhong Area C1 Land (13,210 sqm)
• Tang Yue Bay Gardens (110,940 sqm)
• Riverbay Gardens (297,972 sqm)
• Suzhou No.2016-WG-46 Land Parcels (75,132 sqm)
• Suzhou No.2016-WG-63 Land (50,855 sqm)
Nantong
• Four Seasons Gardens (136,674 sqm)
Western China since 2003
Chengdu
• Yanlord Landmark (157,437 sqm)
• Hengye International Plaza
(39,999 sqm)
• Hengye Star Gardens (144 sqm)
• Yanlord Riverbay (184,379 sqm)
Pearl River Delta since 2005
Zhuhai
• Yanlord New City Gardens (10,773 sqm)
• Yanlord Marina Centre (195,642 sqm)
• Yanlord Marina Peninsula Gardens (358,899 sqm)
As of 31 December 2016:
Shenzhen
Yangtze River Delta since 1993
Hainan since 2010
Sanya
• Sanya Hai Tang Bay - Land Parcel 9 (75,592 sqm)
Sanya
*Contains projects being held under
associate or joint venture
Nantong
Tangshan
Shenzhen
• Shenzhen Longgang District Redevelopment Project
(390,000 sqm)
• Shenzhen Longgang District Economic Residential Housing
(144,064 sqm)
• Yanlord Rosemite (5,951 sqm)
• Yanlord Landmark (37,688 sqm)
• Yanlord Centre (333,280 sqm)

16
Development Strategies Growth of business across high-growth cities
• Increase the market share in cities where Yanlord already has established a superior brand name
• Expand into new cities within the 5 regions where Yanlord is currently in
• Existing land bank sustainable for development in each of these cities for approx. 5 years
• Future projects will be more diversified in terms of development type and geographical reach
Completed projects Projects under development Land bank: Future development
(726,650 sqm1) (3.223 million sqm) (1.977 million sqm)
Shanghai8.8%
Suzhou3.8%Zhuhai
4.0%
Chengdu35.0%
Tianjin20.5%
Shenzhen0.8%
Tangshan2
10.7%
Nanjing
16.4%
Shanghai10.4%
Suzhou17.3%
Zhuhai16.8%
Chengdu4.0%
Tianjin2
20.1%
Nanjing2
10.6%
Sanya2.3%
Nantong
4.2%
Shenzhen
14.3%
Shanghai1.8%
Nanjing49.5%
Shenzhen22.4%
Tianjin2
16.3%
Tangshan2
10.0%
Residential and Commercial 3,008,862 sqm
Investment 214,558 sqm
Residential and Commercial 289,478 sqm
Investment 427,804 sqm
Fixed Assets 9,368 sqm
Residential and Commercial 1,977,483 sqm
Investment -
Note:
1. The group has completed 7.457 million sqm out of which 726,650 sqm are GFA completed are retained as investment properties, fixed assets, or yet to be sold/ delivered to customers
2. Contains projects being held under associate or joint venture

17
New Launches of Property for Sale in 1Q 2017
We expect to launch the following new batches of existing projects in 1Q 2017:
• Nantong
– Four Seasons Gardens
• Shanghai
– Yanlord on the Park
– Yanlord Western Gardens
• Tianjin
– Tianjin Jinnan Land (Phase 3)
• Zhuhai
– Yanlord Marina Centre – Section B
– Yanlord Marina Peninsula Gardens (Phase 2)

18
Upcoming Project Launches- Yanlord On the Park (Shanghai)

19
Upcoming Project Launches- Yanlord Western Gardens (Shanghai)

20
Project Showcase- Yanlord Marina Centre – Section B (Zhuhai)

21
Project Showcase- Four Seasons Gardens (Nantong)
22
Disclaimer
This document contains information that is commercially sensitive, subject to professional privilege and is proprietary and confidential in
nature. Any professional privilege is not waived or lost by reason of mistaken delivery or transmission. If you receive a copy of this
document but are not an authorized recipient, you must not use, distribute, copy, disclose or take any action in reliance on this document
or its contents.
The information contained in this document has not been independently verified. No representation or warranty express or implied is
made as to, and no reliance should be placed on, the fairness, accuracy, completeness or correctness of such information or opinions
contained herein. The information contained in this document should be considered in the context of the circumstances prevailing at the
time and has not been, and will not be, updated to reflect material developments which may occur after the date of the presentation.
Neither Company nor any of its respective affiliates, advisers or representatives shall have any liability whatsoever (in negligence or
otherwise) for any loss howsoever arising from any use of this document or its contents or otherwise arising in connection with this
document.
The document may contain statements that reflect the Company’s beliefs and expectations about the future. These forward-looking
statements are based on a number of assumptions about the Company’s operations and factors beyond the Company’s control, and
accordingly, actual results may differ materially from these forward-looking statements. The Company does not undertake to revise
forward-looking statements to reflect future events or circumstances.