Embed Size (px)
Citation preview
1
© Emma Hitchings and Joanna Miles, 2018
FINANCIAL REMEDIES ON DIVORCE: THE NEED FOR
EVIDENCE-BASED REFORM
Emma Hitchings and Joanna Miles, University of Bristol and University of Cambridge
This briefing paper reports findings from a recent mixed-methods study of financial
settlements on divorce, drawing on data from a court file survey of c.400 cases with a
financial remedy order, interviews with 32 practitioners and focus group discussions
with District Judges. The aim of this part of the project (see previous research report by
Hitchings, Miles and Woodward, 2013, examining the process of settlement) has been
to help fill an evidence-gap identified by the Family Justice Review (2011) regarding
financial settlements law and practice. The need for empirical data in ‘everyday’ cases
is particularly necessary given the magnetic pull of the ‘big money’ cases that typically
fill the law reports and media reporting in this arena, which between them may
generate a rather distorted image of what this area of law means for ordinary families.
Introduction: the socio-economic context
The law of financial remedies on divorce raises deep questions about the nature of the
obligations created by marriage and their persistence after divorce. Considerable
media attention is garnered by high-profile, predominantly ‘big money’ cases,
especially those that entail joint lives provision – the so-called ‘meal ticket for life’
award. But, looking beyond the sensational media reporting of the predicaments of the
rich, what do the data tell us about the experiences of the general population?
Official statistics and nationally-representative survey data indicate that these
questions still arise in a highly gendered context in which the presence of children is
critical. Just under half of all divorces feature children of the family under the age of 16.
(ONS, Divorces in England and Wales: Children of Divorced Couples,
www.ons.gov.uk/peoplepopulationandcommunity/birthsdeathsandmarriages/divorce/da
tasets/divorcesinenglandandwaleschildrenofdivorcedcouples). Many women still have
less economic capacity than most men to deal alone with the economic shock of
divorce, not least thanks to the distribution of childcare and labour market participation.
2
© Emma Hitchings and Joanna Miles, 2018
The most common organisation of the English family economy, adopted by 1.8 million
families, is a full-time working father and part-time working mother. Around a quarter of
mothers with dependent children are economically inactive (i.e. are neither in work nor
seeking work); less than half of single mothers of children under 2 are in paid
employment. (ONS, Families and the Labour Market, England: 2017,
www.ons.gov.uk/releases/familiesandthelabourmarketengland2017).
Meanwhile, many fathers say that they want to get more involved in childcare, but
various cultural, psychological and economic barriers prevent their doing so (see
Equality and Human Rights Commission (2009). Working better: fathers, family and
work—contemporary perspectives. Research summary 41.
www.equalityhumanrights.com/en/publication-download/research-summary-41-
working-better-fathers-family-and-work-contemporary). And the latest ONS data show
that women on average still carry out 60% more unpaid work than men (ONS, Women
shoulder the responsibility of ‘unpaid work’,
www.ons.gov.uk/employmentandlabourmarket/peopleinwork/earningsandworkinghours
/articles/womenshouldertheresponsibilityofunpaidwork/2016-11-10.
Many women clearly incur a considerable ‘motherhood penalty’ – in reduced earning
capacity and savings/pension accumulation – the impact of which will be felt following
divorce. (For data overview, see Chartered Insurance Institute, Risk, exposure and
resilience to risk in Britain today: Women’s Risks in Life – an interim report (2017),
www.cii.co.uk/consumer/risks-in-life/).
It is therefore unsurprising that Fisher and Low, analysing longitudinal British
Household Panel Survey data, found that wives who later divorced had on average
contributed just 36% of the matrimonial household’s income during the marriage. They
also found that both the impact of divorce and recovery from it was on average
considerably worse for wives than for husbands, whose position – measured in terms
of equivalised household income – by contrast on average improved following divorce.
(‘Recovery from divorce: comparing high and low income couples’ (2016) 30
International Journal of Law, Policy and the Family 338; see further analysis in article
by Fisher and Low forthcoming in the Australian Journal of Family Law.)
3
© Emma Hitchings and Joanna Miles, 2018
Current discussion of reform of financial remedies law: the need for
evidence-based law reform
The last significant statutory reform of the substance of English financial remedies law
occurred in the mid-1980s, following a Law Commission discussion paper. This sought
to address concerns, raised from the late 1970s onwards, about the dissonance
between the reformed (ostensibly no-fault) divorce law introduced in 1969 and a
financial remedies law that nevertheless instructed judges to seek to make such
provision as would sustain minimal loss to the parties’ financial positions, as if the now-
dissolved marriage had continued. The amendments made in 1984 removed the
‘minimal loss’ principle (this instructed judges to seek to make such provision that
would sustain minimal loss to the parties’ financial positions as if the now-dissolved
marriage had continued), and introduced the clean break provisions (instructing judges
to consider whether they could make an award that would terminate any ongoing
financial ties between the parties) and the requirement to give first consideration to the
welfare of minor children of the family (see ss 25-25A, Matrimonial Causes Act 1973).
Critics of the law, including Baroness (then Ruth) Deech (e.g. ‘The Principles of
Maintenance’ (1977) 7 Family Law 229), were particularly concerned about the ‘lifelong
meal ticket’ that might be enjoyed by ‘alimony drones’ (to use the common parlance).
But as the Law Commission said in 1981, handicapped by the lack of empirical data in
the area: ‘[W]e have said only that the law is “widely thought to be capable” of
producing unjust and inequitable results; we have not said that it in fact does so.’ (Law
Com No. 112, 1981, para 7) Research later conducted by John Eekelaar and Mavis
Maclean examining pre-1984 outcomes showed that – thanks to the impact of benefit
rules (withdrawing benefit £ for £ of maintenance received) – maintenance paid to
female single parent-families ‘rarely had any impact on the total household income of
that family unless the woman was working full time’. Once child support payments
ceased on children’s reaching independence, older mothers found that ‘their earning
capacity had been devastatingly impaired by the interruption of their employment
pattern’. (Maintenance after Divorce (Clarendon Press, 1986) p 102)
Over thirty years on, financial remedies law is in the spotlight again, thanks to
Baroness Deech’s Divorce (Financial Provision) Bill 2017-19, the latest iteration of
which received its Second Reading in the House of Lords in May 2018. There is much
in current public discourse that finds echoes in those earlier debates. Notably,
4
© Emma Hitchings and Joanna Miles, 2018
complaints about the ‘lifelong meal ticket’ of ‘alimony drones’ that were central then are
recurring now: see ‘“Meal ticket for life” divorce deals must be stopped, urge law chiefs’
(The Times, 20 Nov 2017, p 17). Baroness Deech has expressed concern about what
she considers to be the indignity, ‘victim mentality’ and gender inequality perpetuated
by the provision of lifelong spousal support for ex-wives (see for example Hansard HL
Deb col 402, 11 May 2018, and on an earlier occasion, Hansard HL Deb col 1490, 27
June 2014).
Recent media and parliamentary debate has tended largely to focus on the atypical
(mostly very high-value) cases that attract media attention. This briefing paper seeks
contribute to current debate by examining what official statistics and recent research
tell us about the reality of financial provision on divorce for ordinary people in
‘everyday’ cases.
Any law reform should also be informed by the best available empirical data. Without
such an evidence-base, reform may both fail to achieve its principled objectives and
exacerbate existing problems. This briefing paper will outline data drawn from the
authors’ study of financial remedies cases concluded with a court order, with a view in
particular to addressing concerns associated with spousal support orders, including
those that may last for the remainder of the parties’ joint lives. We also briefly address
evidence from our study that contributes to an understanding of the apparent
geographical variation in outcomes, raised as a concern by the Law Commission (Law
Com No 343, 2014).
Key findings from this study:
The ‘clean break’ culture is prevalent
Spousal support orders are largely confined to cases involving dependent children of the family
Very few such orders are made in cases without children of the family (of any age)
There is geographical variation in courts’ use of spousal periodical payments
But this variation may be more a product of local wealth levels and housing costs than ideological difference.
5
© Emma Hitchings and Joanna Miles, 2018
The financial settlement study: data sources
The data discussed here come from three sources collected for the authors’ study of
financial settlements on divorce, the first two shortly before legal aid reforms were
implemented in 2013, the third shortly after the creation of the Regional Divorce
Centres:
(i) c. 400 court files from two time periods in 2010-11 and 2011-12, from
four courts around England;
(ii) interviews with 32 family solicitors and mediators with experience in
money cases in the areas in which those courts are situated; and
(iii) two focus group discussions conducted with District Judges from several
regions across England, extending beyond the court survey areas.
In evaluating these data, it is important to bear in mind that most couples (c.two-thirds:
MoJ Family Court Statistics Quarterly www.gov.uk/government/collections/family-court-
statistics-quarterly, table 13) obtain no court-ordered income, capital or pension
provision at all (by consent or otherwise). Little is known about that no-order
population, save what we can glean from the findings of studies such as Fisher and
Low’s. So data from our study can only cast light on the minority of divorcing couples
who do obtain a court order.
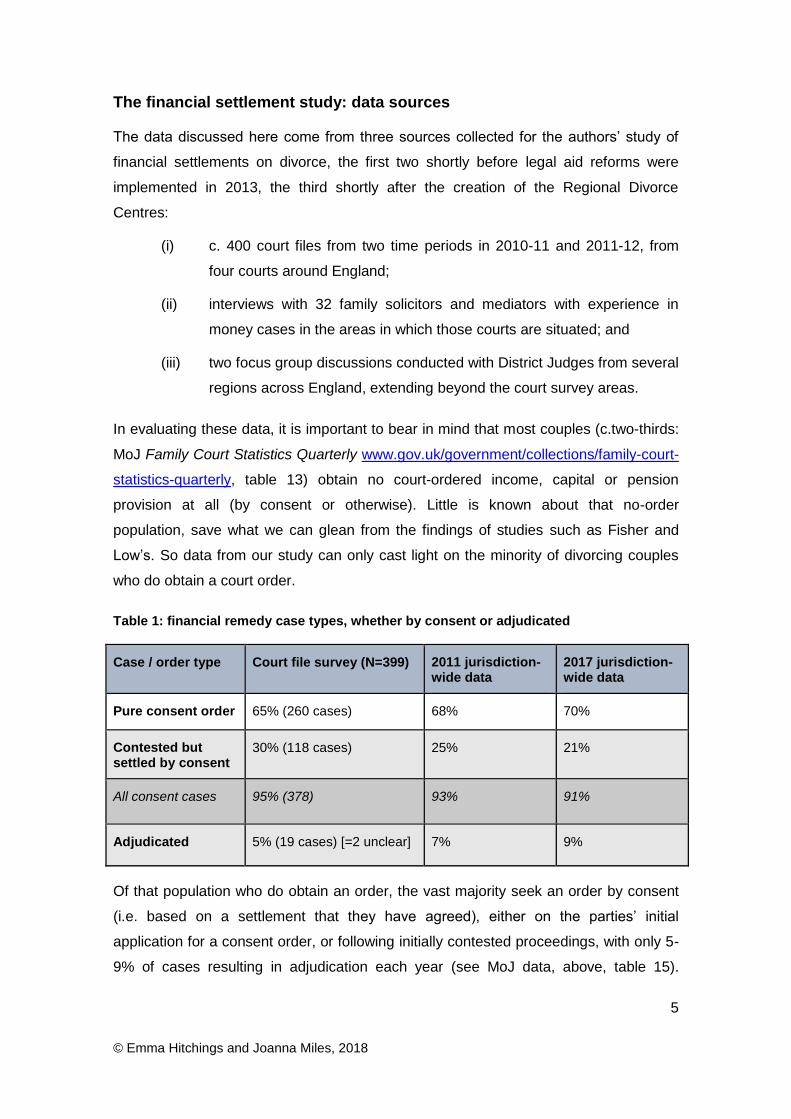
Table 1: financial remedy case types, whether by consent or adjudicated
Case / order type Court file survey (N=399) 2011 jurisdiction-wide data
2017 jurisdiction-wide data
Pure consent order 65% (260 cases) 68% 70%
Contested but settled by consent
30% (118 cases) 25% 21%
All consent cases 95% (378) 93% 91%
Adjudicated 5% (19 cases) [=2 unclear] 7% 9%
Of that population who do obtain an order, the vast majority seek an order by consent
(i.e. based on a settlement that they have agreed), either on the parties’ initial
application for a consent order, or following initially contested proceedings, with only 5-
9% of cases resulting in adjudication each year (see MoJ data, above, table 15).
6
© Emma Hitchings and Joanna Miles, 2018
Reflecting the jurisdiction-wide picture, the vast majority of orders in the court file
sample for this study were made by consent.
The financial settlement study’s court file survey population: a socio-
economic overview
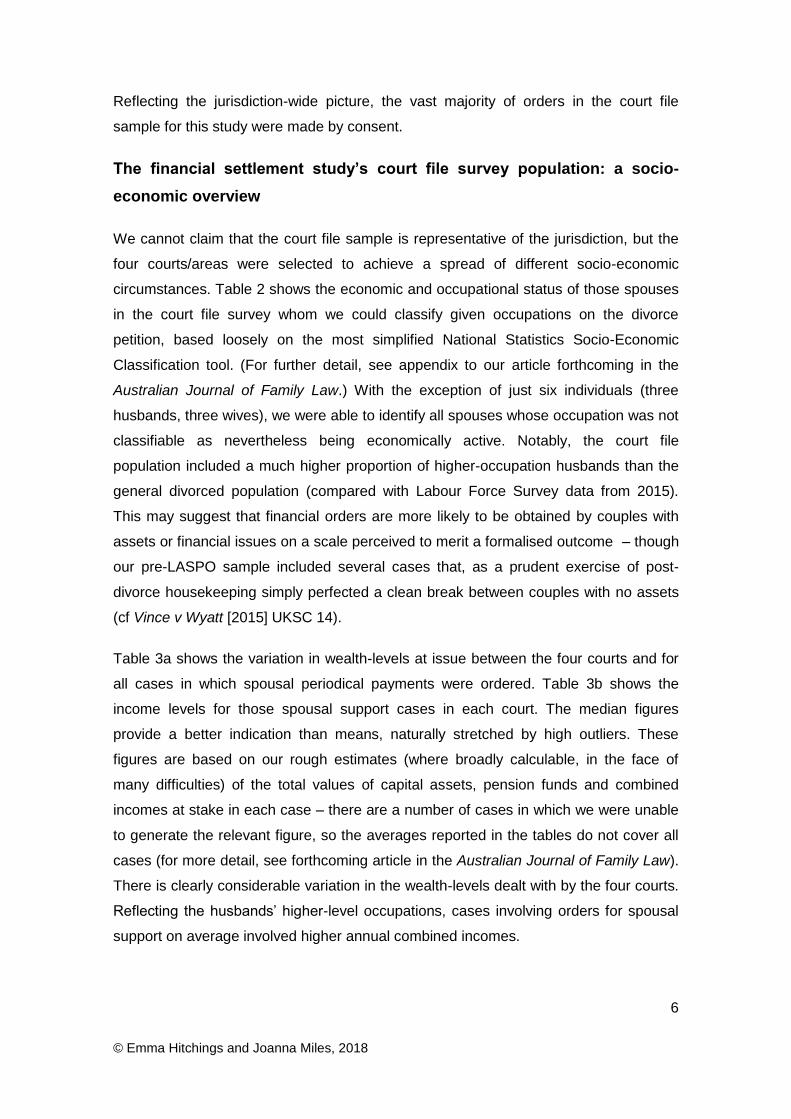
We cannot claim that the court file sample is representative of the jurisdiction, but the
four courts/areas were selected to achieve a spread of different socio-economic
circumstances. Table 2 shows the economic and occupational status of those spouses
in the court file survey whom we could classify given occupations on the divorce
petition, based loosely on the most simplified National Statistics Socio-Economic
Classification tool. (For further detail, see appendix to our article forthcoming in the
Australian Journal of Family Law.) With the exception of just six individuals (three
husbands, three wives), we were able to identify all spouses whose occupation was not
classifiable as nevertheless being economically active. Notably, the court file
population included a much higher proportion of higher-occupation husbands than the
general divorced population (compared with Labour Force Survey data from 2015).
This may suggest that financial orders are more likely to be obtained by couples with
assets or financial issues on a scale perceived to merit a formalised outcome – though
our pre-LASPO sample included several cases that, as a prudent exercise of post-
divorce housekeeping simply perfected a clean break between couples with no assets
(cf Vince v Wyatt [2015] UKSC 14).
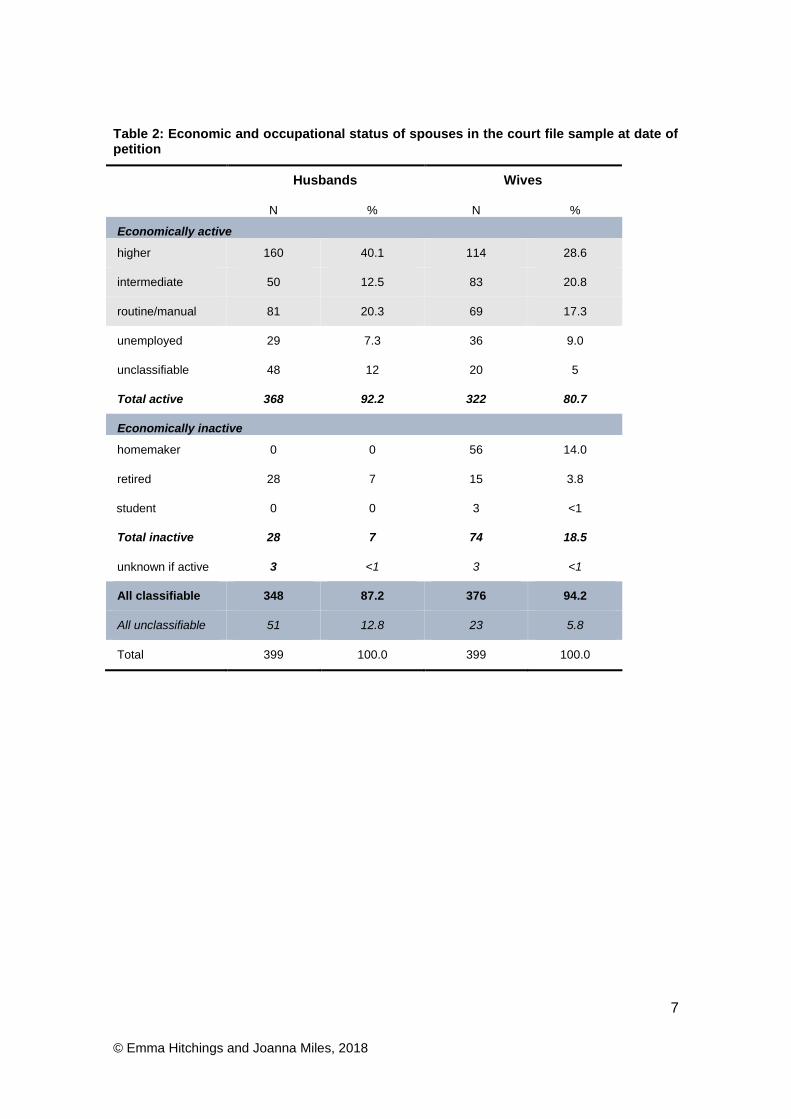
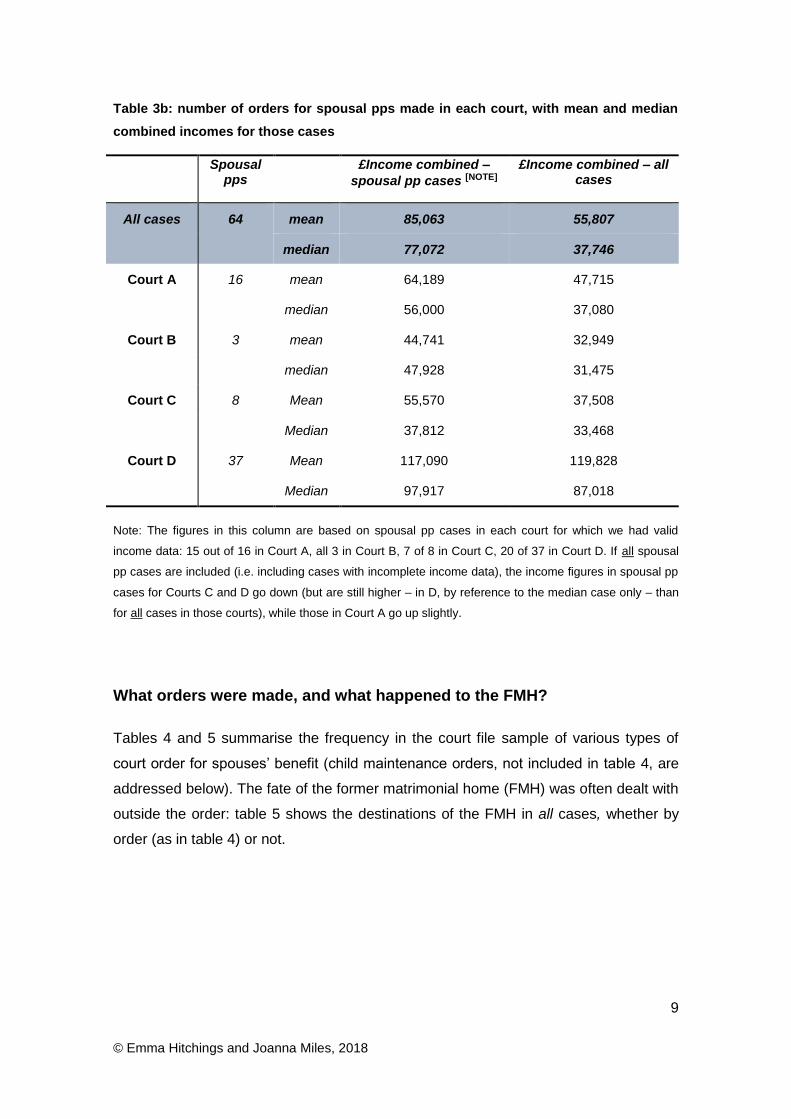
Table 3a shows the variation in wealth-levels at issue between the four courts and for
all cases in which spousal periodical payments were ordered. Table 3b shows the
income levels for those spousal support cases in each court. The median figures
provide a better indication than means, naturally stretched by high outliers. These
figures are based on our rough estimates (where broadly calculable, in the face of
many difficulties) of the total values of capital assets, pension funds and combined
incomes at stake in each case – there are a number of cases in which we were unable
to generate the relevant figure, so the averages reported in the tables do not cover all
cases (for more detail, see forthcoming article in the Australian Journal of Family Law).
There is clearly considerable variation in the wealth-levels dealt with by the four courts.
Reflecting the husbands’ higher-level occupations, cases involving orders for spousal
support on average involved higher annual combined incomes.
7
© Emma Hitchings and Joanna Miles, 2018
Table 2: Economic and occupational status of spouses in the court file sample at date of petition
Husbands Wives
N % N %
Economically active
higher 160 40.1 114 28.6
intermediate 50 12.5 83 20.8
routine/manual 81 20.3 69 17.3
unemployed 29 7.3 36 9.0
unclassifiable 48 12 20 5
Total active 368 92.2 322 80.7
Economically inactive
homemaker 0 0 56 14.0
retired 28 7 15 3.8
student 0 0 3 <1
Total inactive 28 7 74 18.5
unknown if active 3 <1 3 <1
All classifiable 348 87.2 376 94.2
All unclassifiable 51 12.8 23 5.8
Total 399 100.0 399 100.0
8
© Emma Hitchings and Joanna Miles, 2018
Table 3a: combined wealth values by category, for all cases, by court for all cases, and
for all spousal pp cases in the sample
£Non-pension £Pension £Income
All courts, all cases
mean 583,035 192,834 55,807
median 117,080 72,437 37,746
Court A mean 209,090 185,913 47,715
median 113,326 59,875 37,080
Court B mean 112,023 112,737 32,949
median 63,304 44,500 31,475
Court C mean 174,019 119,438 37,508
median 72,166 61,146 33,468
Court D mean 1,863,976 331,817 119,828
median 549,443 127,737 87,018
All spousal pp cases
[note]
mean 721,970 260,113 84,299
median 293,300 112,502 78,642
Note Numbers here are inflated by one very high capital value case (>£10M), without which the means
would be c.£560K, £237K, and £82K and medians £281K, £103K, £79K.
9
© Emma Hitchings and Joanna Miles, 2018
Table 3b: number of orders for spousal pps made in each court, with mean and median
combined incomes for those cases
Spousal pps
£Income combined –
spousal pp cases [NOTE]
£Income combined – all cases
All cases 64 mean 85,063 55,807
median 77,072 37,746
Court A 16 mean 64,189 47,715
median 56,000 37,080
Court B 3 mean 44,741 32,949
median 47,928 31,475
Court C 8 Mean 55,570 37,508
Median 37,812 33,468
Court D 37 Mean 117,090 119,828
Median 97,917 87,018
Note: The figures in this column are based on spousal pp cases in each court for which we had valid
income data: 15 out of 16 in Court A, all 3 in Court B, 7 of 8 in Court C, 20 of 37 in Court D. If all spousal
pp cases are included (i.e. including cases with incomplete income data), the income figures in spousal pp
cases for Courts C and D go down (but are still higher – in D, by reference to the median case only – than
for all cases in those courts), while those in Court A go up slightly.
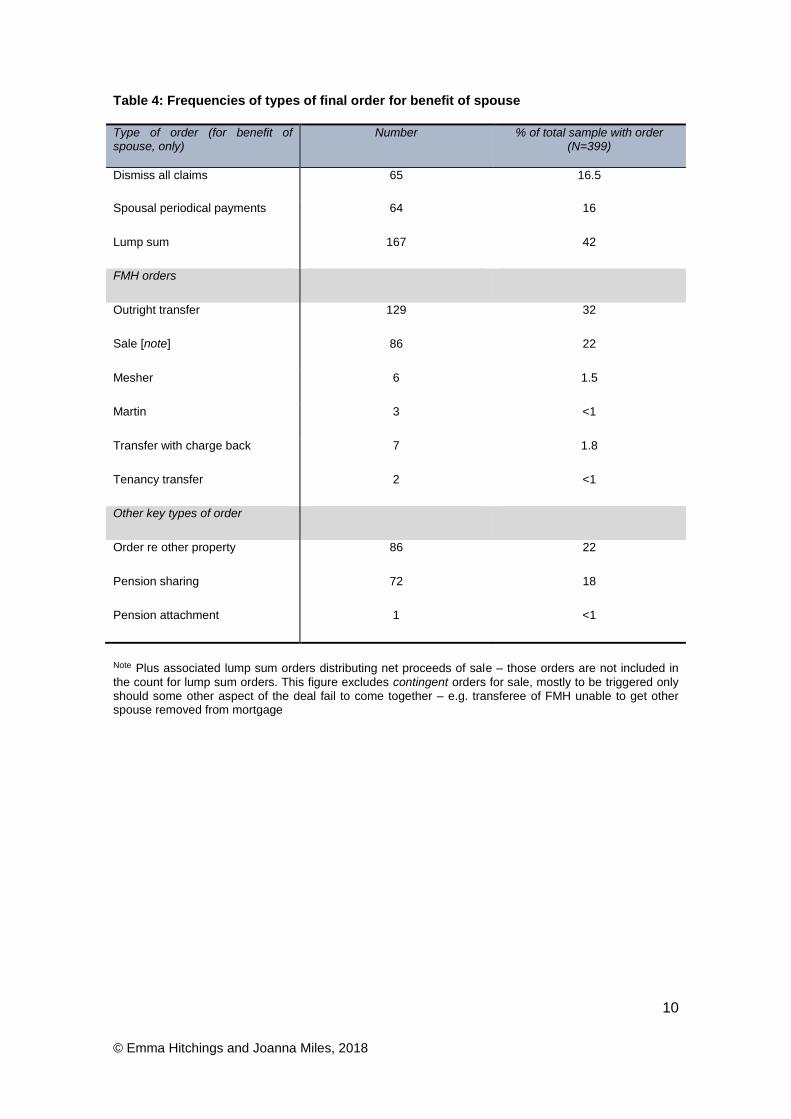
What orders were made, and what happened to the FMH?
Tables 4 and 5 summarise the frequency in the court file sample of various types of
court order for spouses’ benefit (child maintenance orders, not included in table 4, are
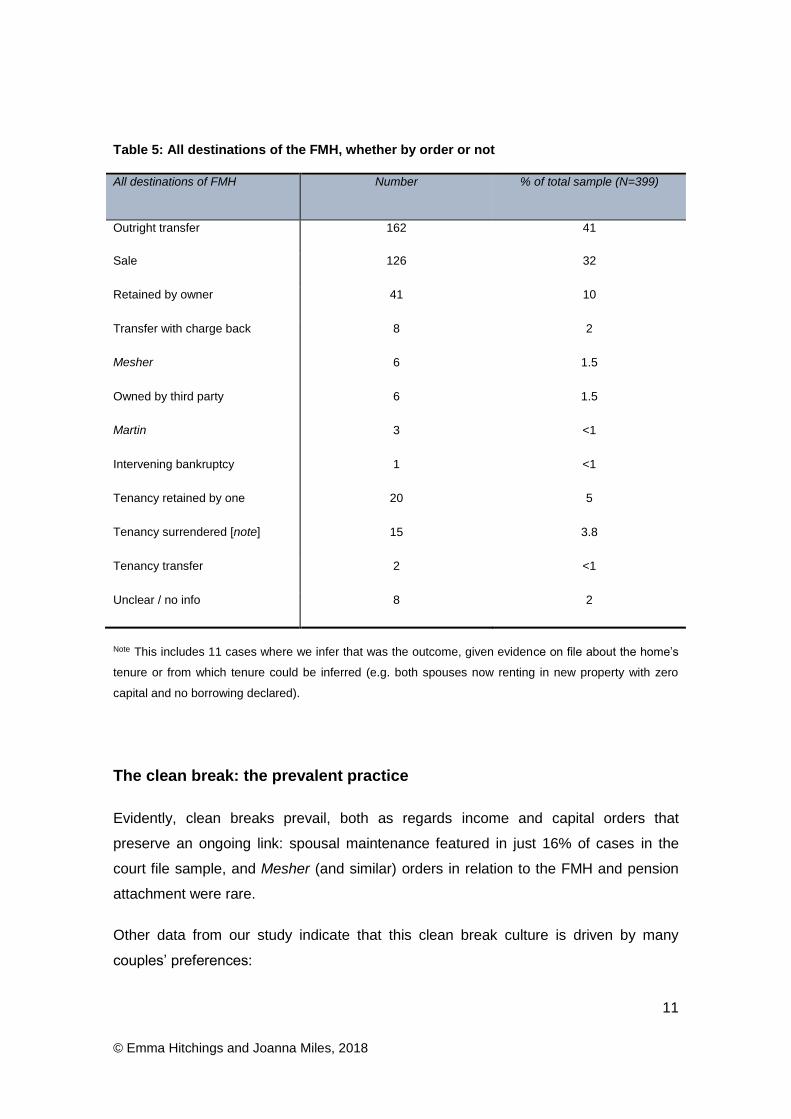
addressed below). The fate of the former matrimonial home (FMH) was often dealt with
outside the order: table 5 shows the destinations of the FMH in all cases, whether by
order (as in table 4) or not.
10
© Emma Hitchings and Joanna Miles, 2018
Table 4: Frequencies of types of final order for benefit of spouse
Type of order (for benefit of spouse, only)
Number % of total sample with order (N=399)
Dismiss all claims 65 16.5
Spousal periodical payments 64 16
Lump sum 167 42
FMH orders
Outright transfer 129 32
Sale [note] 86 22
Mesher 6 1.5
Martin 3 <1
Transfer with charge back 7 1.8
Tenancy transfer 2 <1
Other key types of order
Order re other property 86 22
Pension sharing 72 18
Pension attachment 1 <1
Note Plus associated lump sum orders distributing net proceeds of sale – those orders are not included in
the count for lump sum orders. This figure excludes contingent orders for sale, mostly to be triggered only should some other aspect of the deal fail to come together – e.g. transferee of FMH unable to get other spouse removed from mortgage
11
© Emma Hitchings and Joanna Miles, 2018
Table 5: All destinations of the FMH, whether by order or not
All destinations of FMH Number % of total sample (N=399)
Outright transfer 162 41
Sale 126 32
Retained by owner 41 10
Transfer with charge back 8 2
Mesher 6 1.5
Owned by third party 6 1.5
Martin 3 <1
Intervening bankruptcy 1 <1
Tenancy retained by one 20 5
Tenancy surrendered [note] 15 3.8
Tenancy transfer 2 <1
Unclear / no info 8 2
Note This includes 11 cases where we infer that was the outcome, given evidence on file about the home’s
tenure or from which tenure could be inferred (e.g. both spouses now renting in new property with zero
capital and no borrowing declared).
The clean break: the prevalent practice
Evidently, clean breaks prevail, both as regards income and capital orders that
preserve an ongoing link: spousal maintenance featured in just 16% of cases in the
court file sample, and Mesher (and similar) orders in relation to the FMH and pension
attachment were rare.
Other data from our study indicate that this clean break culture is driven by many
couples’ preferences:
12
© Emma Hitchings and Joanna Miles, 2018
[M]arried couples almost always want a clean break of some form or another –
even if it’s a clean break as to capital and income. (Mediator 1)
[C]lients like clean breaks. They don’t want to have any more bother with the
other party, and even if a clean break isn’t - you know, the safeguarding aspect of
it, the nominal in case something should go wrong, they don’t want the link and I
don’t think they’ve got the stomach for going back to court again if something
does go wrong. (Solicitor/mediator 27)
A self-sufficiency focus was also evident from some judges’ responses to the case
study (involving a primary carer wife of three children) presented to the focus groups:
Judge 11: [I]n my court we would always consider, always consider in every case
whether a clean break is appropriate. That’s the starting point.
Judge 14: I’m encouraging her [the wife in the case study discussed in the focus
groups] towards self-sufficiency because I think that’s the principle we’ve got to
adopt. So I’m saying to her that the transition from married to separated life is not
a permanent meal ticket and you’ve really got to expect to try and achieve self-
sufficiency as soon as you practically can and I like to get them on the road to
that.
But the clean break norm may under-protect economically vulnerable wives. An
example discussed by a solicitor interviewee involved a husband (the interviewee’s
client) on a low six-figure income and a wife caring full-time for four young children. The
clean break outcome gave the wife a little over half of the non-pension capital so she
could re-house mortgage-free, standard child maintenance, but no pension share or
spousal periodical payments:
What they agreed was a very good deal for him, actually in my view. I did say to
him, if I was acting for the wife, I wouldn’t be advising this. She’s got a clean
break which, with 4 small children and no income, I thought wouldn’t even get
past the court, and I said to him and warned him, ‘you know, your danger is this
isn’t going to get past’. It did. She did get a significant proportion of the capital
upfront to be able to re-house herself.… I think, from her position, she wanted to
get out of the matrimonial home and get herself a new property. … I thought it
[the outcome] worked very well for him because he got the deal he wanted. The
wife might not think so. [Interviewer: In a few years’ time?] Absolutely, when her
money’s run out and she’s got no income and 4 small children. … (Solicitor 14)
13
© Emma Hitchings and Joanna Miles, 2018
This outcome typifies the so-called ‘present bias’ of many wives / mothers, such that
they focus on immediate needs (particularly of their children) not their own longer-term
positions (see Arthur et al, Settling Up: making financial arrangements after separation
(NatCen, 2002); Perry et al, How parents cope financially on marriage breakdown
(Joseph Rowntree Foundation, 2000)). Meanwhile, husbands are commonly very
attached to their pensions:
Judge 9: Yeah, I mean my experience in a case like [the one presented for
discussion in the focus group], the wives will always be going for the house and
the husbands will be hanging on to their pensions for dear life and so the sort of
… the common scenario is still wife trying to keep the house, whether she can
afford it or not and very often you’re getting wives saying, you know, borrowing
money off their parents.
As that quotation from the focus groups indicates, clean break outcomes may only be
sustainable with the financial or “in-kind” aid of relatives (especially parents) or new
partners. This is reflected in Fisher and Low’s analysis of general population data,
showing that wives’ post-divorce recovery is typically driven not by increased labour
market attachment or income-transfers from the ex-husband, but by the support of new
partners or (at least while children were dependent) the state (e.g. Hayley Fisher and
Hamish Low, ‘Who Wins, Who Loses and Who Recovers from Divorce?’, in J Miles and
R Probert (eds), Sharing Lives, Dividing Assets (Hart Publishing, 2009) and their
(2016) article, above).
Our interview data also indicate that outcomes may sometimes be shaped by the
parties’ relative psychological strength:
He was an alpha male and she [worked part-time] and looked after the children. I
think she probably just saw her role … I think she was just grateful actually to
have met some of her aims. And even despite me very positively talking about
what she could achieve and hope to achieve, I don’t think she really thought it
was worth the effort.…[S]o I think it’s very much the husband’s determination not
to concede anything very easily and wore her down. Ultimately she got the
outcome she wanted but it was also the outcome he wanted to give her. So I
never lost sight of that fact. (Solicitor 25)
This raises questions about the approval of such outcomes in consent order
applications. But hard-pressed judges processing large numbers of applications with
14
© Emma Hitchings and Joanna Miles, 2018
only the information provided by Form D81 (unless they request more, as they
occasionally do – we identified just eight examples in the court files of cases that
suggested unease about a clean break) may prefer to give weight to party autonomy.
However, our evidence indicates that a clean break does not necessarily mean we
have two self-supporting parties. The wife (as it typically is) may instead simply be
reliant on others, or have no obvious adequate alternative means of support.
The minority with spousal support: it’s (almost) all about the kids
So what of the minority of cases with orders for spousal support? Official court data
have since 2006 reported spousal and child periodical payment orders in one figure for
“periodical payments” (see HMCTS Family Court Statistics Quarterly), so court file
surveys are needed to distinguish them.
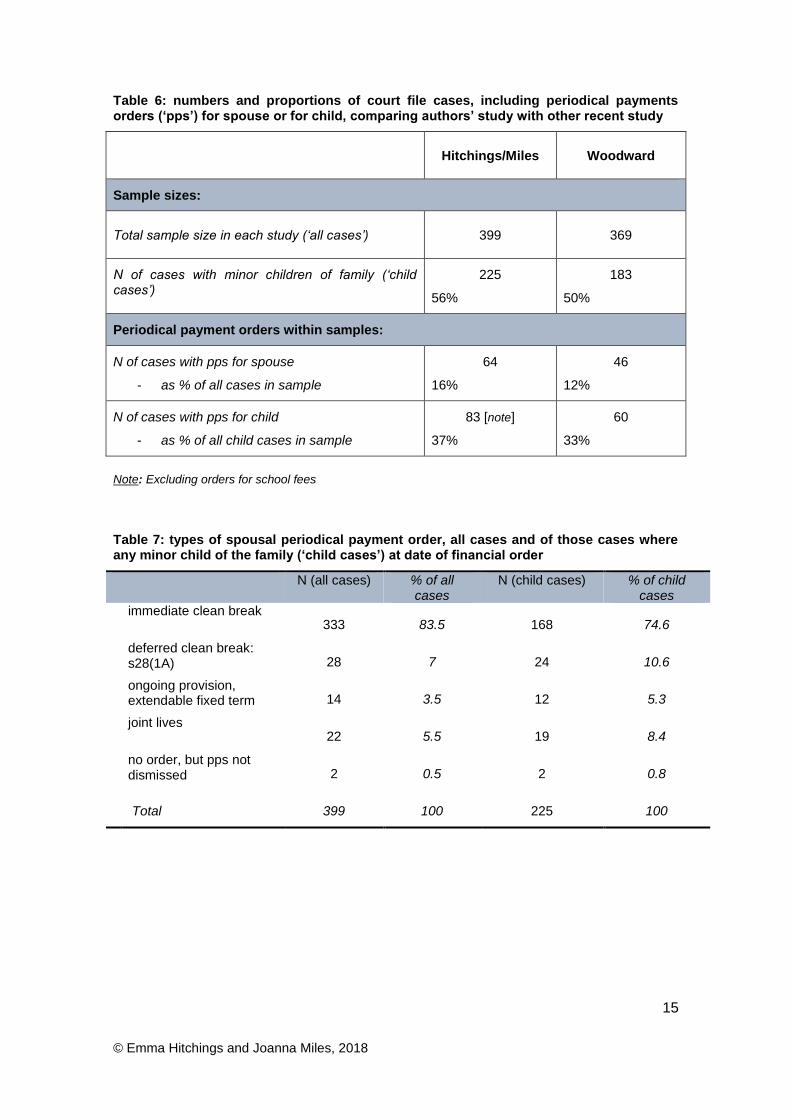
Our findings were similar to Hilary Woodward with Mark Sefton’s (Pensions on Divorce,
Cardiff University, 2014: www.nuffieldfoundation.org/pensions-divorce, hereafter
‘Woodward’). Table 6 sets out the frequency and rate in the two studies of spousal and
child periodical payments orders (excluding school fees orders); two other cases in our
study, not included in the table, involved orders for older children. Adding those cases
where we found positive evidence of child maintenance transfers outside the order
(e.g. under a calculation made by the statutory agency or privately agreed payments),
we found child maintenance in around two-thirds of the 225 cases involving a minor
child of the family. (For more detail, see our paper ‘Child maintenance: the
arrangements of a financially-engaged population of divorcing parents’, forthcoming;
we cannot, for the most part, definitely say that no child maintenance was being paid in
the cases where we found no evidence of it.)
As for spousal support orders, Table 6 shows the frequency of different types of order
found in the Hitchings/Miles study. The husband was the sole payer in all bar two
cases (those two involving mutual orders, with purely nominal obligations for the
wives). Over 80% (52) of the husband payors were in higher-level occupations. A third
(21) of the recipient-wives were housewives at the petition (in turn, representing over a
third of all housewife cases), while the other two-thirds (42) were economically active in
some way (13% of all economically active wives).
15
© Emma Hitchings and Joanna Miles, 2018
Table 6: numbers and proportions of court file cases, including periodical payments orders (‘pps’) for spouse or for child, comparing authors’ study with other recent study
Hitchings/Miles Woodward
Sample sizes:
Total sample size in each study (‘all cases’) 399 369
N of cases with minor children of family (‘child cases’)
225
56%
183
50%
Periodical payment orders within samples:
N of cases with pps for spouse
- as % of all cases in sample
64
16%
46
12%
N of cases with pps for child
- as % of all child cases in sample
83 [note]
37%
60
33%
Note: Excluding orders for school fees
Table 7: types of spousal periodical payment order, all cases and of those cases where any minor child of the family (‘child cases’) at date of financial order
N (all cases) % of all cases
N (child cases) % of child cases
immediate clean break 333 83.5 168 74.6
deferred clean break: s28(1A) 28 7 24 10.6
ongoing provision, extendable fixed term 14 3.5 12 5.3
joint lives 22 5.5 19 8.4
no order, but pps not dismissed 2 0.5 2 0.8
Total 399 100 225 100
16
© Emma Hitchings and Joanna Miles, 2018
Joint lives orders were rare (just 22 cases of the 399), constituting only a third of all 64
spousal support orders in the sample. The median duration of non-joint lives orders
(roughly calculated by us in relation to the likely first terminating event other than
death/remarriage etc) was nine years. But the most striking finding (replicating the
finding of Eekelaar and Maclean in 1986) is how the spousal support payments were
actually (almost) all about children:
- spousal support was almost always confined to cases with children of the
family;
- the duration of payments in about three-quarters of the non-joint lives orders
was linked to the youngest child achieving a milestone (age or education
stage), though over half of these orders (and a third of all spousal support
orders) were nominal only, providing just a safety net.
- only nine of the 64 spousal periodical payment orders did not involve minor
children of the family:
o two of these nine were no-child cases (out of a pool of 84 cases with
either no child at all or no child of the family); these were both non-
extendable fixed term orders, one providing short-term, transitional
support after a short marriage, the other supporting an older wife
following a 20+ year marriage; and
o in the remaining seven cases, spousal support was ordered where the
children were all independent following marriages of 20+ years, during
which we may suppose that the wife had been the primary carer (that
information was not available on file). That there are only seven such
cases (out of a pool of 90 cases with all-adult children of the family) may
make us wonder whether at least some of these other women might be
struggling economically, compared to their ex-husbands, if their earning
capacity had earlier been compromised by childcare.
The focus group judges were alive to the challenges that wives looking after children
post-divorce might encounter in trying to become financially independent.
Judge 11: I’m a working mother and I see that I can do it and yes you do put in
place childcare arrangements, you … if you can afford to. I’ve been lucky I have
been able to, so you can actually do it, but will this lady [in the case study] be
17
© Emma Hitchings and Joanna Miles, 2018
able to do it, that’s the question. … Would she be able to do it with three young
children, no support from the husband because they’re getting divorced and we
would have to consider how realistically she will be able to do that and if we do
look at her situation and children are aged seven, four and two it’s going to be
very difficult for us to push her to self-sufficiency.
Judges were also conscious that wives’ own efforts to improve their economic position
through paid employment would, over time, interact with the withdrawal of benefits and
tax credits once the children left their household in a way that might leave them no
better off overall, and possibly worse off, after the benefits-loss:
Judge 5: Yeah, but she’s not going to increase her earnings, is she? She’s just
going to be able to compensate for the loss of benefits that occurs as her children
leave home.
And the judges were conscious of the implications of Universal Credit (UC), which
alters the situation considerably: where spousal support might hitherto have been one
of an array of income sources (alongside earnings and tax credits) available to cover
the needs of the primary carer’s household, spousal (but not child) support receipts are
included in UC means-testing, reducing UC £ for £ (and see broader concerns raised
by Gingerbread, Where next on Universal Credit? www.gingerbread.org.uk/policy-
campaigns/welfare-reform/where-next-universal-credit/).
What about the geography?
The variation in wealth-level data reported in Table 3a above partly correlates with
variation in use of clean breaks, evident from Table 3b: Court D had both the lowest
clean break rate (at 61%) and the wealthiest client base; Court B had 97% clean
breaks and the least wealthy clients. Concerns have been expressed (not least by the
Law Commission) about apparent geographical variation in financial remedy case
outcomes. But our data suggest that a good part of the difference may simply reflect
the different resources available. Participants in both judicial focus groups did feel that
there was a predisposition against clean breaks and towards longer-term spousal
support in one region. But they also felt that economic variation in incomes and
housing costs were significant, whatever ideological preferences might be in play:
18
© Emma Hitchings and Joanna Miles, 2018
Judge 7: [T]he idea that there’s a north/south divide on this is actually less
important than the idea that there’s an “amount of money” divide. … With
[Region 3] housing costs that doesn’t take you very far. And you’re much more
likely to allow the maintenance to run on much longer in that sort of case, than
whereas if you’re presumably in [location 5A], where you’re in a different world.
And there’s a good deal of myth making about, you know, everybody’s fact-
specific; everybody’s looking at the facts that they particularly deal with, and we
in [Region 3] … are dealing with a lot of cases where fact-specific reasons, you
need to ... delay a clean break.
Where living costs are lower, child support payments might be adequate to meet that
household’s needs (along with other sources of income, including benefits and tax
credits – many of those dependent on the children’s presence), so that spousal support
is not required to help make ends meet:
Judge 7: The thing is this: that child support is going to be enough for most
people up to a certain level. And it’s only when you get above that level that you
really start looking at spousal seriously. I think one of the reasons for regional
variation here is exactly that. The myth is that everybody up north terminates
spousal support immediately. And if it’s true, it’s because they get enough from
child maintenance not to need spousal support.
By contrast, where living (especially housing) costs are higher, primary carers, past
and present, might need more support from the ex-spouse to sustain an acceptable
standard of living.
19
© Emma Hitchings and Joanna Miles, 2018
Concluding thoughts
Evidence-based policy and law-making that seeks to identify and understand the lived
realities of ‘everyday’ couples who have experienced divorce are indispensable.
Despite all the media attention attracted by cases in which joint lives awards are made
the ‘meal ticket for life’ award is, in practice, rare. But, as Moylan LJ affirmed in
Waggott v Waggott [2018] EWCA Civ 727, at [156], that does not mean that spousal
support, even joint lives support, has no role in mitigating the (typically gendered)
economic disparity exposed on divorce: in some cases it is an important tool for helping
to achieve a fair economic outcome. The option of spousal periodical payments may
also provide an important bargaining tool to help secure fairer clean break settlements.
Our findings suggest a close link between spousal support and children. So it may be
concerning that these orders were made in only a minority of those cases, especially
once the children are adult. Our court file data can only provide a snapshot of the
parties’ positions on divorce – we cannot know what were the longer-term outcomes for
the individuals in our survey, in particular how many ex-wives alleviated any continuing
economic disadvantage by repartnering. However, as forty years ago, the greater
problem may not be over-generosity to ex-wives, but the enduring, disproportionate
economic impact of divorce on women. This is clear from the longitudinal survey data
(which in turn is unsurprising given the labour market data) and, quite possibly, also
from the fact that two-thirds of divorcing spouses are not invoking the court’s
jurisdiction at all.
Some might argue that the solution lies in increased female labour market participation
and equal pay. Further work is undoubtedly needed to enable more equal sharing of
paid and unpaid labour within marriage and other relationships. But it is not clear that
couples can or should be required to arrange their lives that way. And it is certainly not
clear that the law of financial remedies should be reformed in order drastically to curtail
the support it offers long before that more equal society has arrived.
Rather than being ‘undignified’, or reflective of or reinforcing a ‘victim mentality’,
receiving the benefit of orders that acknowledge the economic impact of how a couple
have chosen – or have been required by circumstance – to raise their children protects
the dignity of the primary carer, more fairly distributing between the parties the full
economic impacts, positive and negative, of their marital partnership.
20
© Emma Hitchings and Joanna Miles, 2018
Acknowledgements
This briefing paper is based on a longer piece to be published later this year in a special issue
of the Australian Journal of Family Law (2018) vol 31(2) examining various facets of Anglo-
Australian financial remedies law – available on Lexis, and a short article appearing in Family
Law in summer 2018. A further long article on the use of rules and discretion, also forthcoming,
explores the issue of geographical variation in orders in greater depth.
The empirical data drawn on in this article were collected during research funded by the Nuffield
Foundation, an endowed charitable trust that aims to improve social well-being in the widest
sense. It funds research and innovation in education and social policy and also works to build
capacity in education, science and social science research. The views expressed in this article
are those of the authors and not necessarily those of the Foundation. Thanks to: the Nuffield
Foundation team, to Hilary Woodward, Mark Sefton and Stevie Martin for their research
assistance during the project, to our project Advisory Group for their counsel, to John Eekelaar,
Rosemary Hunter, and Mavis Maclean for reading drafts of articles on which this briefing paper
is based, to Steve McKay for analysis of Labour Force Survey data, to the President of the
Family Division for his authorisation of and support for the project, to the staff of HMCTS who
supported our court file survey work, and to those practitioners whom we interviewed and
judges who participated in our focus groups.
Email address for correspondence: [email protected]