Embed Size (px)
Citation preview

PROFILE & PERFORMANCE OF THE NSW LOCAL GOVERNMENT SECTOR
YOUR COUNCILJUNE 2015

CONTENTSMeasuring Council Performance 1
Minister’s Foreword 1
Chief Executive’s Message 2
Introduction 3Why measure and report on local council performance? 3
A report in transition 3
What is driving changes to this publication? 4
What progress has been made to develop new performance measurement
indicators? 5
How have councils been classified and grouped for comparative purposes? 6
Data Sources 6
Important Note 7
The State of Local Government in NSW 8NSW Local Government at a glance 9
How is the NSW Local Government Sector Performing Financially? 11Overall Operating Result 11
Operating Performance Ratio 12
Unrestricted Current Ratio (UCR) 13
Own Source Revenue Ratio 13
Rates & Annual Charges Outstanding Ratio 14
Debt Service Cover Ratio 15
Debt Service Ratio 15
Cash Expense Ratio 15
Revenue and Expenditure 16
Rating Revenue 18
Financial Performance 19
Services Provided by Your Council 20Key Service Types 20
Expenditure on Services 21
Managing Community Assets 23Estimated Cost to Bring Assets to a Satisfactory Standard (BTS) 24
Asset Maintenance Expenditure 25
Building and Infrastructure Renewal Ratio 26
Infrastructure Backlog Ratio 27
Local Infrastructure Renewal Scheme (LIRS) 29
Achieving Community Outcomes 31Planning & Development 31
Stronger Community Leadership 33Financial Reporting 33
Audit Opinion 34
Code of Conduct Complaints 35
Access to Services 37

Measuring Council PerformanceMINISTER’SFOREWORD
The NSW Government and the local government sector are working together to strengthen local government in NSW. To have a strong future, we need strong councils providing the services and infrastructure communities need.
This work includes building a stronger set of local government performance indicators to provide NSW communities with a clear and balanced picture of how effectively and efficiently councils meet local needs.
Building a robust performance measurement framework for the local government sector is a large and important task that is being undertaken in stages.
To date, councils have told us that they support this work and that there is real value in using a consistent set of meaningful performance indicators to promote good practice and drive improvement in key areas.
The NSW Government is pleased to make the information about performance of councils available to their local community.
Ultimately this will empower communities and councils to work together to make the best possible decisions for their future in providing services and infrastructure.
THE HON PAUL TOOLE MPMINISTER FOR LOCAL GOVERNMENT
1
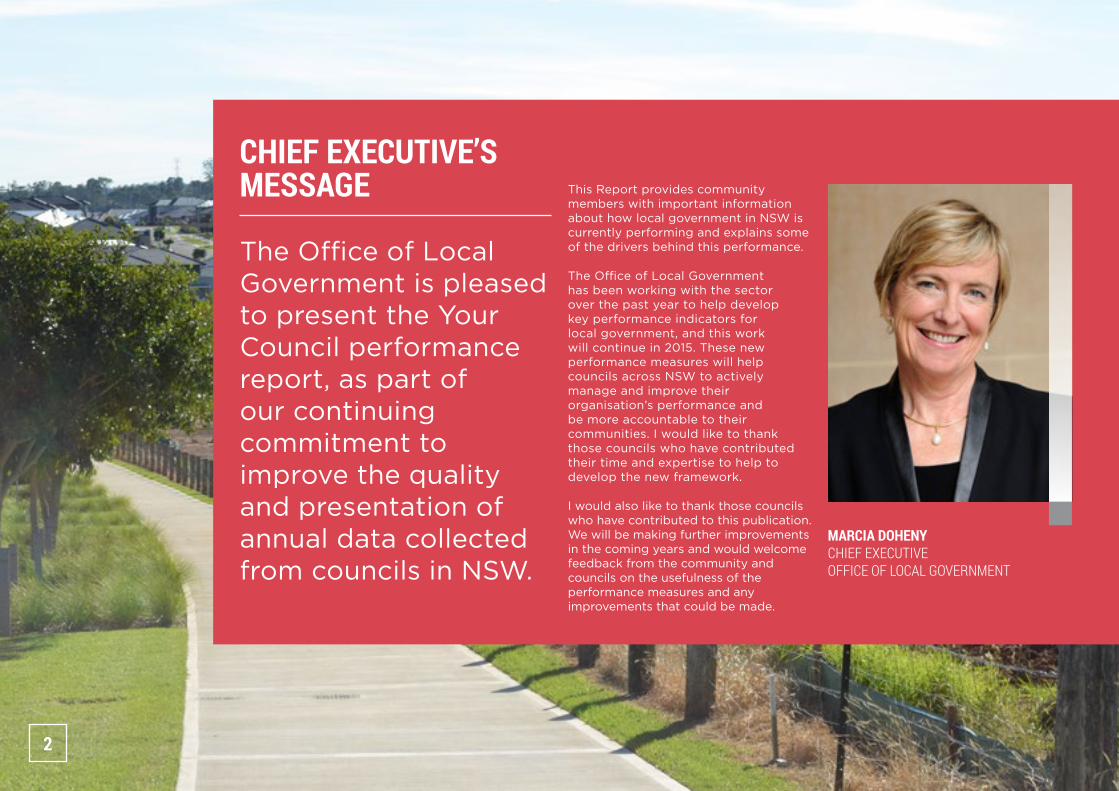
CHIEF EXECUTIVE’S MESSAGE
The Office of Local Government is pleased to present the Your Council performance report, as part of our continuing commitment to improve the quality and presentation of annual data collected from councils in NSW.
This Report provides community members with important information about how local government in NSW is currently performing and explains some of the drivers behind this performance.
The Office of Local Government has been working with the sector over the past year to help develop key performance indicators for local government, and this work will continue in 2015. These new performance measures will help councils across NSW to actively manage and improve their organisation’s performance and be more accountable to their communities. I would like to thank those councils who have contributed their time and expertise to help to develop the new framework.
I would also like to thank those councils who have contributed to this publication. We will be making further improvements in the coming years and would welcome feedback from the community and councils on the usefulness of the performance measures and any improvements that could be made.
MARCIA DOHENYCHIEF EXECUTIVEOFFICE OF LOCAL GOVERNMENT
2

IntroductionWHY MEASURE AND REPORT ON LOCAL COUNCIL PERFORMANCE?
Councils provide a wide range of services and manage many assets that people in local communities rely upon.
Communities need to have a clear, concise and meaningful picture of their council’s performance across key areas to understand how effectively their council is working to look after public assets and deliver local services.
This report provides information in one place about local councils across NSW to help local communities, the local government sector and government regulators understand how well local government in NSW is performing as a whole, and how well individual councils are performing over time and in comparison to similar councils.
In particular, it provides the basis for communities to ask their councils questions about important performance areas such as community leadership, financial sustainability, asset maintenance and service delivery.
A REPORT IN TRANSITIONThis first ‘Your Council’ Report, (formally The Comparatives Publication on NSW Local Government) is an important tool as we start to build a picture of local government in NSW. This is the 24th year of collecting performance data from councils.
Work is continuing to develop the best possible indicators of council performance across key areas. The data reported will continue to evolve in future editions.
3

Changes are being driven by local government reform currently occurring to help make local councils more effective and sustainable in the long term.
This work was triggered through a collaborative NSW Local Government project, Destination 2036, through which councils and the NSW Government agreed on a number of key actions, including the development of a new Local Government Performance Measurement Framework.
WHAT IS DRIVING CHANGES TO THIS PUBLICATION?
Since that time, the Independent Local Government Review Panel and Local Government Acts Taskforce have consulted widely with councils and the community and have provided reports with recommendations for reform to the NSW Government. These reports are publicly available on the Office of Local Government (the Office) website at www.olg.nsw.gov.au.
These reports, as well as an earlier NSW Auditor General’s report of 2012, have highlighted the need for a core set of financial and non-financial indicators to provide a better picture of councils’ overall performance to improve public accountability.
4

WHAT PROGRESS HAS BEEN MADE TO DEVELOP NEW PERFORMANCE MEASUREMENT INDICATORS?
The Office is continuing to work with local government to develop key performance indicators under a new Local Government Performance Measurement Framework.
The indicators will help communities to measure important aspects of a council’s performance in the four key areas of:
Consultation feedback on a discussion paper, Strengthening Councils and Communities: Building a New Framework for Measuring Performance in Local Government, released between November 2013 and January 2014, has indicated strong support from the sector to develop a performance measurement system around these four key areas.
FINANCIAL SUSTAINABILITY
COMMUNITY LEADERSHIP
ASSET MANAGEMENT
SERVICE DELIVERY
In particular, councils indicated support for a system that aligns with Integrated Planning and Reporting, provides trend data and meaningful comparison with like councils to help drive improvement, is flexible enough to take local differences and needs into account, and that minimises the overall reporting burden.
Four working groups of council and other experts have developed measures under the key areas of the framework. A fifth working group examined whether and how the NSW Government could coordinate a State-wide community satisfaction survey to feed into the Framework. A working paper will be released for feedback in relation to the performance management framework and indicators.
Consultation feedback is continuing to inform this work. A Strategic Steering Group, made up of senior local government and other representatives, is also providing input on the measures, including whether they provide a balanced picture of council performance that is meaningful and useful to local communities.
The end result will be a core, consistent set of key performance indicators to show a balanced picture of the financial and governance health of councils, how well they deliver functions and services and the management of assets across NSW.
The focus of this work is on using readily obtainable data. Future phases of work may need to occur to refine the Framework, fill data gaps and consider issues such as comparison groupings and benchmarking.
5

HOW HAVE COUNCILS BEEN CLASSIFIED AND GROUPED FOR COMPARATIVE PURPOSES?
Councils have been compared, where relevant, with the ‘group average’. Council groups (referred to as OLG Groups) are based on the Australian Classification of Local Governments (ACLG) and are determined according to their socio-economic characteristics and their capacity to deliver a range of services to the community. ^
It should be noted that the groupings are based on broad demographic variables. There are often large differences between councils in the same group, as a result this information should not be used as a basis for individual council policy changes.
The Office and the local government sector recognise that the current OLG groupings of councils may need to be revised as part of the performance measurement work being undertaken and the outcomes of the current local government reform process.
DATA SOURCESData for this publication has been sourced from councils’ financial statements and grants returns as well as a number of agencies including the Australian Bureau of Statistics (ABS), Department of Planning and Environment, State Libraries and NSW Office of Water.
From time to time, this data may be amended and updated, eg ABS population projections. These population projections are used in calculating the population change and the per capita results in a range of indicators. These figures may be subsequently amended by the ABS in future years. Where possible, the population results in our publications are amended.
The accuracy of this publication is largely dependent upon the accuracy and completeness of data returns lodged by councils. The Office does not separately audit the data but we do conduct extensive testing for validity and reasonableness and some data is from councils’ audited financial statements.
^ NSW councils have been compiled into 11 groups instead of 22 categories, because several of the ACLG categories contain either none or only one or two NSW councils.
6

IMPORTANT NOTE
The key performance measures in this report, when used on their own, do not give a full picture of a council’s performance. Although they show differences between councils across the selected activity areas, they do not explain why these differences have arisen. Conclusions should not be drawn without further qualitative assessment.
When assessing or comparing the performance of councils, it is important to remember that local circumstances can influence how well a council provides its services. There are often good reasons why it is harder or more costly to provide certain services in some local government areas than in others, or why a different mix of services may be delivered. Each council makes is own decision about whether to provide a lower or higher level of services depending on local needs and priorities.
The figures are indicators only and conclusions should not be drawn without qualitative assessments being made. Members of the community are encouraged to contact their council if they would like any further details or explanations regarding individual results.
DO YOU HAVE ANY FEEDBACK?If you have any feedback on this report, the framework or suggestions for suitable key performance indicators for future inclusion, please email the Office at [email protected].
7
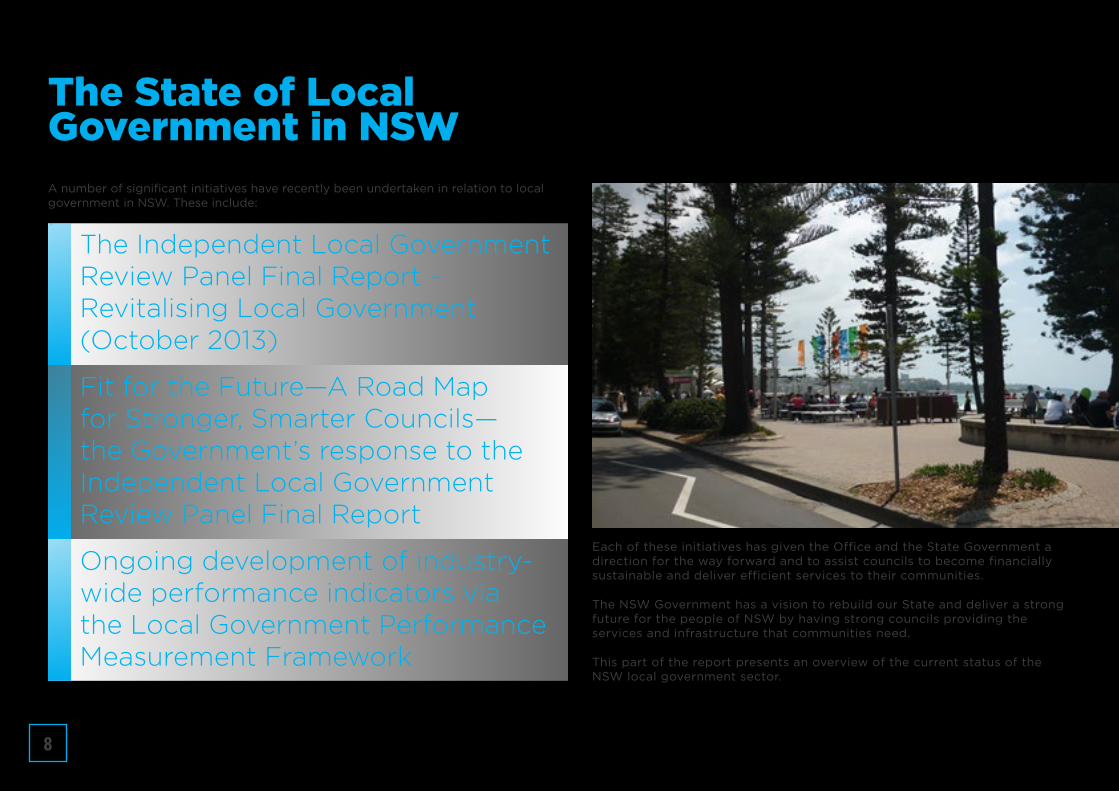
A number of significant initiatives have recently been undertaken in relation to local government in NSW. These include:
The Independent Local Government Review Panel Final Report – Revitalising Local Government (October 2013)
Fit for the Future—A Road Map for Stronger, Smarter Councils—the Government’s response to the Independent Local Government Review Panel Final Report
Ongoing development of industry-wide performance indicators via the Local Government Performance Measurement Framework
Each of these initiatives has given the Office and the State Government a direction for the way forward and to assist councils to become financially sustainable and deliver efficient services to their communities.
The NSW Government has a vision to rebuild our State and deliver a strong future for the people of NSW by having strong councils providing the services and infrastructure that communities need.
This part of the report presents an overview of the current status of the NSW local government sector.
The State of Local Government in NSW
8
NSW LOCAL GOVERNMENT AT A GLANCE
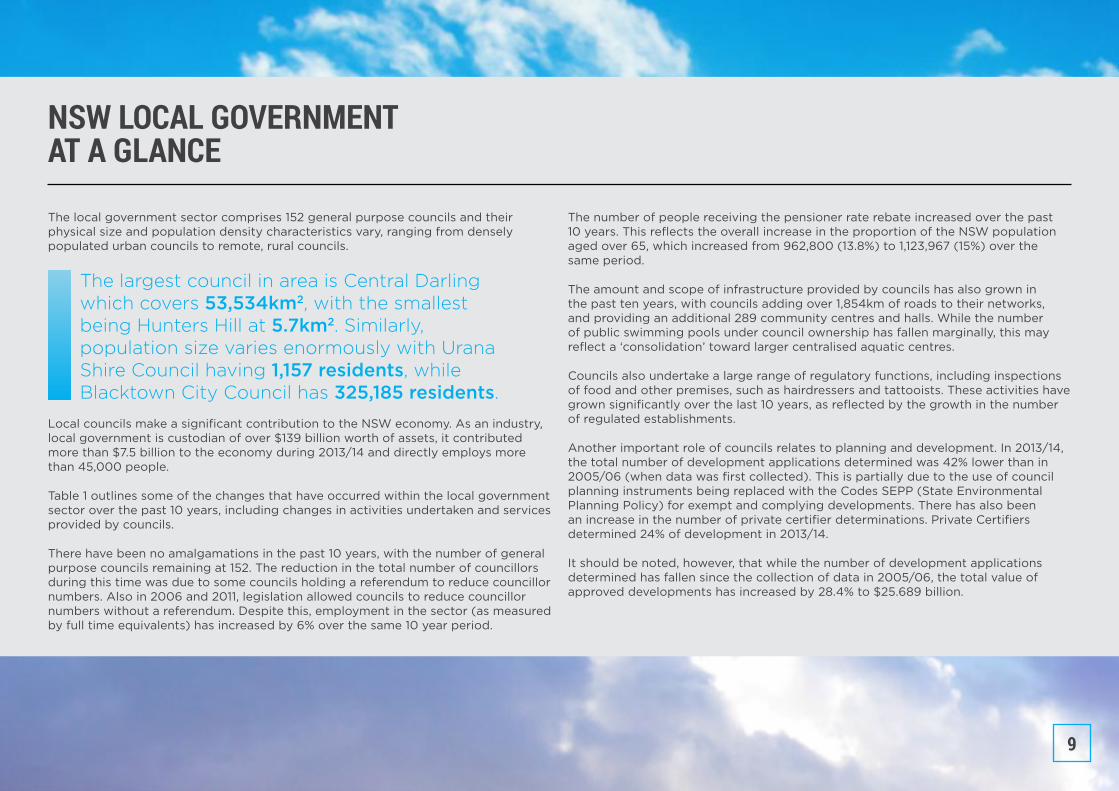
The local government sector comprises 152 general purpose councils and their physical size and population density characteristics vary, ranging from densely populated urban councils to remote, rural councils.
The largest council in area is Central Darling which covers 53,534km2, with the smallest being Hunters Hill at 5.7km2. Similarly, population size varies enormously with Urana Shire Council having 1,157 residents, while Blacktown City Council has 325,185 residents.
Local councils make a significant contribution to the NSW economy. As an industry, local government is custodian of over $139 billion worth of assets, it contributed more than $7.5 billion to the economy during 2013/14 and directly employs more than 45,000 people.
Table 1 outlines some of the changes that have occurred within the local government sector over the past 10 years, including changes in activities undertaken and services provided by councils.
There have been no amalgamations in the past 10 years, with the number of general purpose councils remaining at 152. The reduction in the total number of councillors during this time was due to some councils holding a referendum to reduce councillor numbers. Also in 2006 and 2011, legislation allowed councils to reduce councillor numbers without a referendum. Despite this, employment in the sector (as measured by full time equivalents) has increased by 6% over the same 10 year period.
The number of people receiving the pensioner rate rebate increased over the past 10 years. This reflects the overall increase in the proportion of the NSW population aged over 65, which increased from 962,800 (13.8%) to 1,123,967 (15%) over the same period.
The amount and scope of infrastructure provided by councils has also grown in the past ten years, with councils adding over 1,854km of roads to their networks, and providing an additional 289 community centres and halls. While the number of public swimming pools under council ownership has fallen marginally, this may reflect a ‘consolidation’ toward larger centralised aquatic centres.
Councils also undertake a large range of regulatory functions, including inspections of food and other premises, such as hairdressers and tattooists. These activities have grown significantly over the last 10 years, as reflected by the growth in the number of regulated establishments.
Another important role of councils relates to planning and development. In 2013/14, the total number of development applications determined was 42% lower than in 2005/06 (when data was first collected). This is partially due to the use of council planning instruments being replaced with the Codes SEPP (State Environmental Planning Policy) for exempt and complying developments. There has also been an increase in the number of private certifier determinations. Private Certifiers determined 24% of development in 2013/14.
It should be noted, however, that while the number of development applications determined has fallen since the collection of data in 2005/06, the total value of approved developments has increased by 28.4% to $25.689 billion.
9

TABLE 1NSW LOCAL GOVERNMENTINDICATORS OF CHANGE
6,650,735
152
1,567*
42,219
451,454
154,663
485
1,498
163,782
105,225##
$20 B##
39,503
582
951.61
921.57
7,053,753
152
1,525#
44,588
457,412
129,047
468
1,606
165,052
71,550
$17.03 B
42,566
597
1,338.72
1,187.67
7,410,399
152
1,480**
44,846
475,431
150,696
464
1,787
165,636
60,791
$25.69 B
45,103
586
1,518.18
1,359.57
11.42%
0.00%
-5.55%
6.22%
5.31%
-2.57%
-4.33%
19.29%
1.13%
-42.23%
28.44%
14.18%
0.78%
59.54%
47.53%
NSW Population
Number of Councils
Number of Councillors
Equivalent Full Time Staff
Number of Pensioner Rebates
Open Space (ha)
Public Pools
Community Centres & Public Halls
Length of Roads (km)
Number of DAs determined
Value of DAs determined
Number of Food Premises requiring inspection
Levee Banks Maintained (km)
Average Council Revenue Per Capita ($)
Average Council Expenses Per Capita ($)
2004/05 2009/10 2013/14 % of Change 2004/05 to 2013/14
* Following 2004 election# Following 2008 election
** Following 2012 election## 2005/06
10
How is the NSW Local Government Sector Performing Financially?
OVERALL OPERATING RESULT
The Office monitors councils’ financial performance against a range of indicators each year. These results had formed a large component of previous Comparative Information reports prepared by the Office.
Local Government entities are required by legislation to prepare annual audited financial statements. The financial statements must be independently audited and an audit opinion expressed on each report.
In 2012, the Office engaged NSW Treasury Corporation (TCorp) to undertake a financial sustainability review of all general purpose councils in NSW.
TCorp noted that, to address the expected continued deterioration in their financial position, councils will require extensive consultation processes with the community to consider a combination of revenue increases, expenditure reductions and service level reviews. Most councils have, during 2013/14, continued to actively address these issues by focusing on financial sustainability and improving their results.
The benchmarks adopted do not necessarily represent a pass or fail in respect of any particular area, and it is acknowledged that councils have significant differences in their size and population density.
Trends in results against the benchmarks are important, as well as the overall performance against all the benchmarks. It is also important to note that not one benchmark fits all. Detailed information regarding the benchmarks, quantitative measurement and definitions can be found on the Data Page of the website.
In response to the Independent Local Government Review Panel recommendations, the Office has developed criteria and certain benchmarks for a Fit for the Future council. These have been based on the work of TCorp and the Independent Panel and have been reviewed by the Independent Pricing an Regulatory Tribunal (IPART).
The Fit for the Future criteria and benchmarks align, in most instances, with the indicators presented in this report.
11
OPERATING PERFORMANCE RATIO
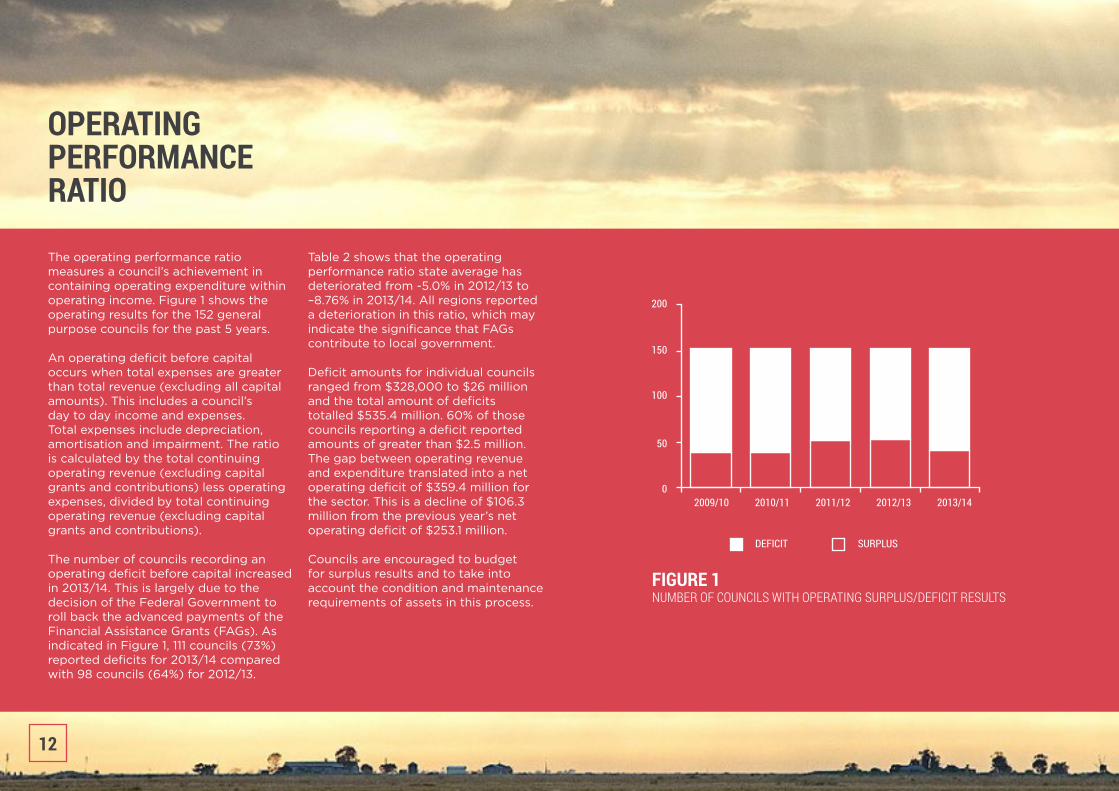
The operating performance ratio measures a council’s achievement in containing operating expenditure within operating income. Figure 1 shows the operating results for the 152 general purpose councils for the past 5 years.
An operating deficit before capital occurs when total expenses are greater than total revenue (excluding all capital amounts). This includes a council’s day to day income and expenses. Total expenses include depreciation, amortisation and impairment. The ratio is calculated by the total continuing operating revenue (excluding capital grants and contributions) less operating expenses, divided by total continuing operating revenue (excluding capital grants and contributions).
The number of councils recording an operating deficit before capital increased in 2013/14. This is largely due to the decision of the Federal Government to roll back the advanced payments of the Financial Assistance Grants (FAGs). As indicated in Figure 1, 111 councils (73%) reported deficits for 2013/14 compared with 98 councils (64%) for 2012/13.
Table 2 shows that the operating performance ratio state average has deteriorated from -5.0% in 2012/13 to –8.76% in 2013/14. All regions reported a deterioration in this ratio, which may indicate the significance that FAGs contribute to local government.
Deficit amounts for individual councils ranged from $328,000 to $26 million and the total amount of deficits totalled $535.4 million. 60% of those councils reporting a deficit reported amounts of greater than $2.5 million. The gap between operating revenue and expenditure translated into a net operating deficit of $359.4 million for the sector. This is a decline of $106.3 million from the previous year’s net operating deficit of $253.1 million.
Councils are encouraged to budget for surplus results and to take into account the condition and maintenance requirements of assets in this process.
FIGURE 1NUMBER OF COUNCILS WITH OPERATING SURPLUS/DEFICIT RESULTS
12

UNRESTRICTED CURRENT RATIO (UCR)
OWN SOURCE REVENUE RATIO
The unrestricted current ratio measures the adequacy of working capital and the ability of a council to satisfy its obligations in the short term. It does not include externally restricted activities such as water, sewer or specific grants and contributions. UCR is calculated by current assets less all external restrictions divided by current liabilities less specific purpose liabilities.
An UCR of 4.45 means that council has $4.45 in unrestricted current assets to meet each $1.00 of unrestricted current liabilities. A ratio of less than 1.5 is considered unsatisfactory and could indicate, along with other financial indicators, that the council may face some financial risk.
The State average has decreased from 4.0 in 2012/13 to 3.6 in 2013/14, with only the metropolitan councils improving slightly in 2013/14. UCRs ranged from 0.05 to 15.79.
Own source revenue ratio measures financial flexibility. It indicates the degree of reliance on external funding sources such as operating and capital grants and contributions received by councils. A council has improved financial flexibility with a higher level of own source revenue.
This ratio has seen an increase from 2013/14, with all regions improving. Own source revenue ranged from 29.8% to 92.9%, with 84% of councils reporting greater than 60% of own source revenue. This significant change can largely be attributed to the reduction in amount of FAGs received by councils in 2013/14, rather than an increase in own source revenue.
Own source revenue is calculated by total continuing operating revenue less all grants and contributions divided by total operating revenue including all grants and contributions.
-8.76
9.79
70
3.61
4.29
82.69
6.25
Operating Performance (%)
Cash Expenditure (months)
Own Source Revenue (%)
Unrestricted Current Ratio
Debt Service Ratio (%)
Debt Service Cover Ratio
Rates & Annual Charges Outstanding (%)
-0.88
8.24
83
3.35
2.04
272.13
3.40
-12.92
10.91
65
4.16
3.69
13.79
7.27
-5.31
9.30
74
3.53
5.37
2.70
4.67
-15.19
10.63
55
4.47
1.96
111.87
10.28
-7.85
10.10
74
2.75
8.46
3.58
5.49
>0%
>3.0
>60%
>1.5:1
>0 - <20%
>2.0
<5% Metro <10% Rural
State Average Metropolitan* Large Rural*Metropolitan Fringe*
Rural*Regional Town/City*
BenchmarkTABLE 2AVERAGE FINANCIAL RESULTS 2013/14
13
RATES & ANNUAL CHARGES OUTSTANDING RATIO
This ratio assesses the impact of uncollected rates and annual charges on liquidity and the efficiency of councils’ debt recovery. Some councils may have agreements in place to assist ratepayers in an attempt to reduce the debt owed to council. The ratio measures rates and annual charges outstanding against the total amount of rates and charges levied by council.
Councils’ outstanding rates and annual charges ratio ranged from 0.63% to 19.2%. The average for all outstanding rates and annual charges was 6.5%. The benchmark for outstanding rates is <5% for city and coastal councils and <10% for rural areas.
The actual amount of rates and charges outstanding in the state has increased by 15% since 2009/10, although the total amount outstanding in 2013/14 reduced to $285 million compared $296 million in 2012/13.
Possible reasons for the increase in rates outstanding in recent years could be due to the prevailing economic climate, as well as the effectiveness of councils’ debt recovery procedures and policies. Severe drought conditions within NSW over the past 10 years may have influenced the results. Councils should have a debt recovery policy and a hardship policy in place and should ensure that any outstanding amounts are actively pursued, in the context of the policies.
14

DEBT SERVICE COVER RATIO
DEBT SERVICE RATIO
CASH EXPENSE RATIO
The ratio measures the availability of operating cash to service debt including interest, principal and lease payments. Research commissioned by the Independent Local Government Review Panel found that generally NSW councils have comparatively low levels of debt. Councils have approximately twice as many financial assets as they do outstanding borrowings.
It appears that some councils may have a debt free policy, as well as significant capacity to repay additional debt, yet continue to report infrastructure backlogs. Nineteen councils reported they have no debt.
The ratio is calculated by operating results before capital, excluding interest, depreciation, impairment and amortisation divided by the principal repayments and interest costs.
The benchmark for this ratio is greater than 2.0. The higher the ratio, the greater the capacity for a council to take on and service additional debt. Metropolitan and Rural councils have the greatest capacity to repay additional debt, with the results for these councils well above the benchmark and the State average of 82.69.
Debt service ratio indicates the amount of general income that is used to repay debt and interest charges. This ratio forms part of councils’ Fit for the Future assessment. Prudent and active debt management is a key part of a council’s approach to both funding and managing infrastructure and services over the long term. Debt usage can also assist in smoothing funding costs and promoting intergenerational equity.
The repayment of debt costs ranged from 0% to 25% of councils’ income. The benchmark is greater than 0% and less than 20%. All groups of councils reported results at the lower end of the benchmark, which indicates that most councils may be using debt to address infrastructure backlog. Metropolitan, Large Rural and Rural councils are below the state average result of 4.29%.
The debt service ratio is calculated by cost of debt service (interest and principal repayment) divided by total continuing operating revenue (excluding capital grants and contributions).
This ratio indicates the number of months a council can continue paying for immediate expenses without additional cash inflow.
The State average has improved in 2013/14 from 5.4 to 9.8 months. Metropolitan Fringe councils reported the greatest improvement from 3.1 in 2012/13 to 9.3 in 2013/14. The calculation of this ratio in 2013/14 included term deposits, which had been excluded previously and may be a contributing factor in the improvement.
The ratio is calculated by current year’s cash and cash equivalent (including term deposits) divided by the cash flow payments of operating and financing activities.
15

REVENUE AND EXPENDITURECouncils’ total revenue including capital grants and contributions for 2013/14 was $11.250 billion (operating revenue was $9.715 billion) and total expenditure was $10.075 billion.
Employee costs are the greatest expense to councils and include wages, salaries, leave entitlements, superannuation, workers compensation, fringe benefits and payroll tax.
Materials and contracts is also a large expense item for councils. Materials and contracts consist of raw materials, contractor and consultancy costs, audit services and legal fees.
Depreciation is a non cash expense that converts the capital cost of an asset
126,433
5,526
117,634
2,896
6,270
8,811
9,343
-532
Total Assets
Total Liabilities
Total Net Infrastructure Assets
Borrowings
Cash & Investments
Total Revenue (excl capital grants and contributions)
Total Expenditure
Operating Results (before capital grants and contributions)
129,789
5,732
120,392
2,967
6,777
9,340
9,607
-267
134,272
6,037
124,065
3,218
7,425
9,653
9,905
-252
139,636
6,293
128,790
3,342
7,726
9,715
10,075
-359
2010/11($M) 2011/12 2012/13 2013/14
into an operational expense. It reduces the value of assets as a result of wear and tear, age or obsolescence. Assets must be replaced or renewed at the end of their useful life.
The 22% of expenditure on depreciation indicates the assumed amount of asset usage that has occurred during the year in the process of providing services.
TABLE 3NSW LOCAL GOVERNMENT, KEY AGGREGATE FINANCIAL RESULTS 2010/11 – 2013/14
The major source of revenue for councils is rates and annual charges. This includes residential, business, farming and mining rates, along with any special rates charged by councils. Annual charges include domestic waste, other waste charges, water, sewer and stormwater management.
User charges and fees include activities such as water usage, drainage, parking fees, caravan parks, leisure centres, child and aged care services, building and regulatory services and private works.
16

FIGURE 2 REVENUE SOURCES FOR 2013-14
FIGURE 3EXPENDITURE FOR
2013/14
FIGURE 4RATING REVENUE 2013/14
17
RATING REVENUE
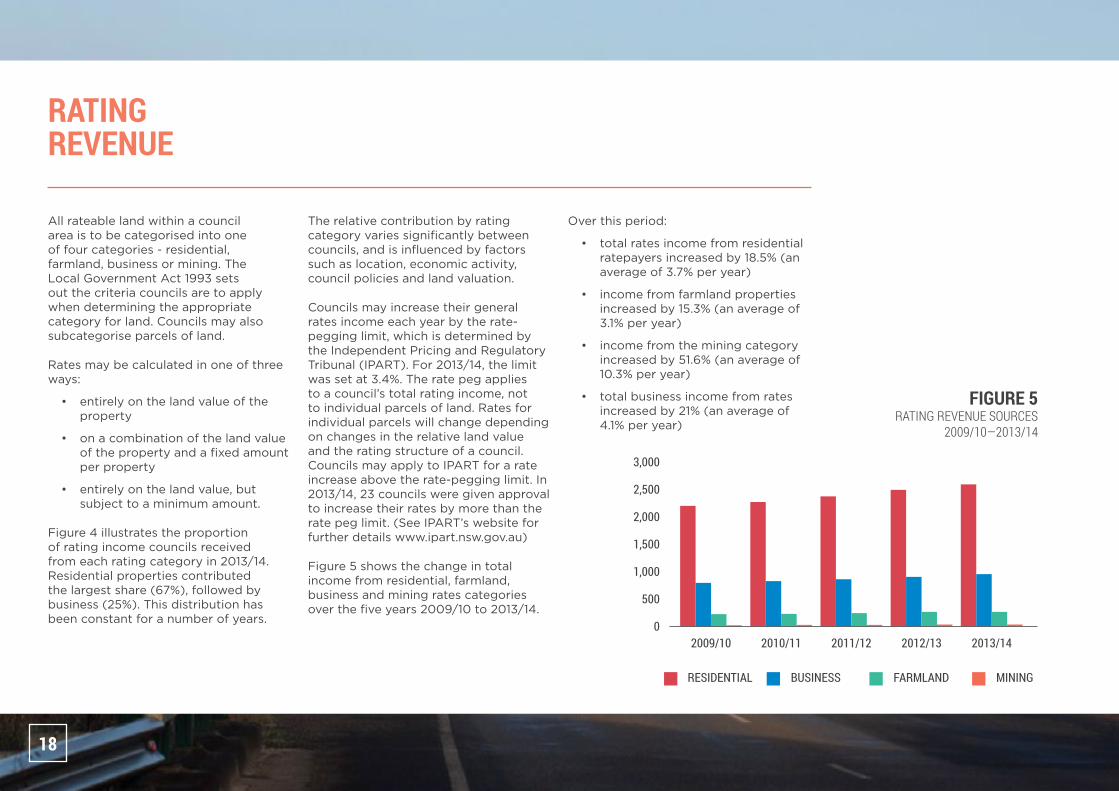
All rateable land within a council area is to be categorised into one of four categories - residential, farmland, business or mining. The Local Government Act 1993 sets out the criteria councils are to apply when determining the appropriate category for land. Councils may also subcategorise parcels of land.
Rates may be calculated in one of three ways:
• entirely on the land value of the property
• on a combination of the land value of the property and a fixed amount per property
• entirely on the land value, but subject to a minimum amount.
Figure 4 illustrates the proportion of rating income councils received from each rating category in 2013/14. Residential properties contributed the largest share (67%), followed by business (25%). This distribution has been constant for a number of years.
The relative contribution by rating category varies significantly between councils, and is influenced by factors such as location, economic activity, council policies and land valuation.
Councils may increase their general rates income each year by the rate-pegging limit, which is determined by the Independent Pricing and Regulatory Tribunal (IPART). For 2013/14, the limit was set at 3.4%. The rate peg applies to a council’s total rating income, not to individual parcels of land. Rates for individual parcels will change depending on changes in the relative land value and the rating structure of a council. Councils may apply to IPART for a rate increase above the rate-pegging limit. In 2013/14, 23 councils were given approval to increase their rates by more than the rate peg limit. (See IPART’s website for further details www.ipart.nsw.gov.au)
Figure 5 shows the change in total income from residential, farmland, business and mining rates categories over the five years 2009/10 to 2013/14.
Over this period:
• total rates income from residential ratepayers increased by 18.5% (an average of 3.7% per year)
• income from farmland properties increased by 15.3% (an average of 3.1% per year)
• income from the mining category increased by 51.6% (an average of 10.3% per year)
• total business income from rates increased by 21% (an average of 4.1% per year)
FIGURE 5RATING REVENUE SOURCES
2009/10—2013/14
18

FINANCIAL PERFORMANCE
Table 4 shows an aggregate financial performance result for the NSW local government sector for 2013/14.
The table shows a reduction of $375M from 2012/13 in the amount of operating grants and contributions paid, as well as a reduction of $42M in interest revenue. These results have been influenced by the interest rates in the current economic climate, as well as the winding back of the FAGs payments.
Impairment expenses were also reduced by $11M, possibly due to the reduction in the number of natural disasters occurring in 2013/14.
5,466
1,965
356
648
1,183
1,535
91
6
11,250
3,724
225
2,473
2,183
2
0
71
1
1,396
10,075
1,175
-359
REVENUE
Rates and annual charges
User charges and fees
Interest and investment revenue
Other revenues
Grants & contributions provided for operating purposes
Grants & contributions provided for capital purposes
OTHER INCOME
Net gain from the disposal of assets
Net share of interests in joint ventures & associates using the equity method
Total income from continuing operations
EXPENSES FROM CONTINUING OPERATIONS
Employee benefits and on-costs
Borrowing costs
Materials and contracts
Depreciation and amortisation
Impairment
Interest and investment losses
Net loss from the disposal of assets
Net share of interests in joint ventures & associates using the equity method
Other expenses
TOTAL EXPENSES FROM CONTINUING OPERATIONS
OPERATING RESULTS FROM CONTINUING OPERATIONS
NET OPERATING RESULT FOR THE YEAR BEFORE CAPITAL GRANTS AND CONTRIBUTIONS
284
120
-42
46
-375
149
30
-1
211
129
9
6
21
-11
0
-30
0
46
170
41
-107
($M)Income from continuing operations Diff from 2013/14 - 2012/13 ($M)
TABLE 4WHOLE OF SECTOR FINANCIAL
PERFORMANCE 2013/14
19

Table 5 describes the key service types provided by councils. A number of factors affect the delivery and efficiency of each service, while local policies also determine the level of services provided. Some of the factors determining the cost and range of these services include:
• the population mix
• the availability of funding
• socio-economic factors
• the number and range of services provided
• council’s cost allocation practices
• council policies
• short term programs
Councils provide a variety of services to residents, ratepayers and visitors to their area. Some of these services are provided on a user pays basis, while others are funded through a council’s rating income and grants. Ultimately, the decision to provide a particular service and the level of this service is at the discretion of each council in consultation with the community.
Services Provided by Your Council
KEY SERVICE TYPES
SERVICE TYPE DESCRIPTION OF SERVICE
Governance & Administration
Council’s role as a democratic government, including elections, members’ fees and expenses, meetings of councils and policy making committees, area representation and public disclosure and compliance, corporate support and other support services, engineering works and any council policy compliance.
Public Order, Safety & Health
Fire services, fire protection, emergency services, beach control, enforcement of local government regulations and animal control.
Environment
Noxious plants and insect/vermin control, environmental protection, solid waste management, street cleaning, drainage and stormwater management.
Community Services, Education & Housing
Administration and education, social protection (welfare), aged, disabled and children’s services, public cemeteries and conveniences, street lighting, town planning and other community amenities.
Water & Sewer The provision of water and sewer services.
Recreation & Culture
Libraries, museums, art galleries, community centres, halls and performing arts, sporting grounds and venues, swimming pools, parks and gardens and other sporting and recreation facilities.
Roads, Bridges & Footpaths
The provision of roads, bridges and footpaths.
Other ServicesServices such as caravan parks, economic activities, agriculture, building control, aerodromes and communication.TABLE 5
KEY SERVICES
20

EXPENDITURE ON SERVICES
Figure 6 provides an indication of the average relative breakdown of expenditure for NSW councils by service type.
On average, governance and administration represents the largest component at 17%, followed by roads, bridges and footpaths 16%, the environment 16% and recreation and culture 16%.
Some care needs to be exercised when drawing conclusions about these results. While water and sewer represents 10% of average expenditure, only 65% of councils provide these services. No metropolitan councils provide water and sewer and in some regional and rural areas, the services are provided by county councils. In addition, depending on councils’ costing methods, the governance and administration category includes a range of indirect costs, such as payroll associated with providing other services.
In some cases, councils have made deliberate decisions to provide lower or higher levels of services, according to local needs.
These limitations do not, however, invalidate comparisons. Communities have the right to see how their councils compare with others and how efficiency, economy and resource allocation varies from council to council. Such comparisons provide communities and councils with the opportunity to question why such differences exist.
Ultimately, councils should know, and should be able to demonstrate to their community, that they are providing services effectively, efficiently and that such services meet their community’s needs.
FIGURE 6EXPENDITURE BY SERVICES 2013/14
21
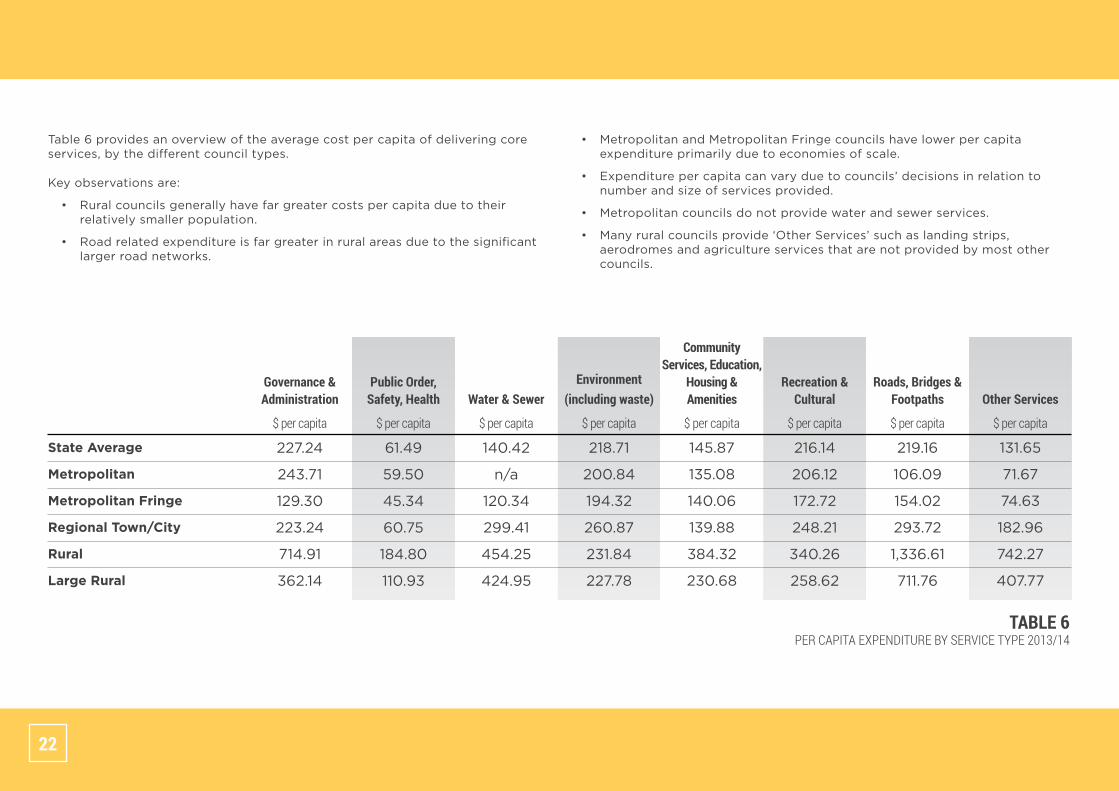
Table 6 provides an overview of the average cost per capita of delivering core services, by the different council types.
Key observations are:
• Rural councils generally have far greater costs per capita due to their relatively smaller population.
• Road related expenditure is far greater in rural areas due to the significant larger road networks.
61.49
59.50
45.34
60.75
184.80
110.93
State Average
Metropolitan
Metropolitan Fringe
Regional Town/City
Rural
Large Rural
140.42
n/a
120.34
299.41
454.25
424.95
227.24
243.71
129.30
223.24
714.91
362.14
216.14
206.12
172.72
248.21
340.26
258.62
218.71
200.84
194.32
260.87
231.84
227.78
219.16
106.09
154.02
293.72
1,336.61
711.76
145.87
135.08
140.06
139.88
384.32
230.68
131.65
71.67
74.63
182.96
742.27
407.77
Public Order, Safety, Health
$ per capita
Water & Sewer
$ per capita
Governance & Administration
$ per capita
Recreation & Cultural
$ per capita
Environment (including waste)
$ per capita
Roads, Bridges & Footpaths
$ per capita
Community Services, Education,
Housing & Amenities
$ per capita
Other Services
$ per capita
TABLE 6PER CAPITA EXPENDITURE BY SERVICE TYPE 2013/14
• Metropolitan and Metropolitan Fringe councils have lower per capita expenditure primarily due to economies of scale.
• Expenditure per capita can vary due to councils’ decisions in relation to number and size of services provided.
• Metropolitan councils do not provide water and sewer services.
• Many rural councils provide ‘Other Services’ such as landing strips, aerodromes and agriculture services that are not provided by most other councils.
22

NSW councils own and control assets with a total value of over $139 billion. These assets include cash, investments, infrastructure, plant and equipment, receivables, inventory and intangible assets. As indicated in Figure 7, the largest component of councils’ asset base is infrastructure, with a net value of over $83 billion. Roads and related assets (eg bridges and footpaths) make up more than 50% of infrastructure assets.
Strong and sustainable communities that optimise the use of public resources is what the residents and rate payers of NSW are looking for. As a result, the management of these assets, and in particular infrastructure assets is an extremely important component of a council’s function.
During 2012/13, the Office undertook a detailed review of the infrastructure backlog of NSW councils, their infrastructure management processes, practices, future infrastructure requirements and funding strategies.
In terms of infrastructure management processes and practices, the audit found there has been an increased focus and commitment to infrastructure management by councils over recent years and as a result, there is improving confidence in the information being reported by councils.
Managing Community Assets
The audit found that many councils across the State are managing their infrastructure well, with the remainder substantially on their way to implementing required asset management processes and practices in accordance with their community strategic plan, four year delivery plan and annual operational plan. Councils prepare and review the resourcing strategy which contains asset management plans, long term financial plan and the workforce management plan. It is anticipated that these documents will progressively be enhanced following each review.
The recent focus on councils’ financial sustainability has meant that councils have better information upon which to manage their infrastructure backlog.
FIGURE 7COUNCIL ASSETS 2013/14
23
ESTIMATED COST TO BRING ASSETS TO A SATISFACTORY STANDARD (BTS)
The improved information and greater focus on asset management has been reflected in a reduction in the estimated cost to bring assets to a satisfactory standard (referred to as the ‘infrastructure backlog’).
The total infrastructure backlog has fallen from approximately $7.4 billion as at 30 June 2012 to $5.5 billion as at 30 June 2014.
85 councils reduced their backlog amounts from the level reported in 2012/13. Backlog amounts ranged from $45,000 to $319 million.
Two councils did not report any backlog , with both reporting they have reduced their backlog to zero and one council’s backlog remained the same. Conversely, 66 councils reported an increase in their backlog.
Each year the Office reviews significant changes’ in councils backlog estimates.
Councils are encouraged to continue to undertake community consultation in setting the level of service required for each class of asset when determining their budget.
24
ASSET MAINTENANCE EXPENDITURE
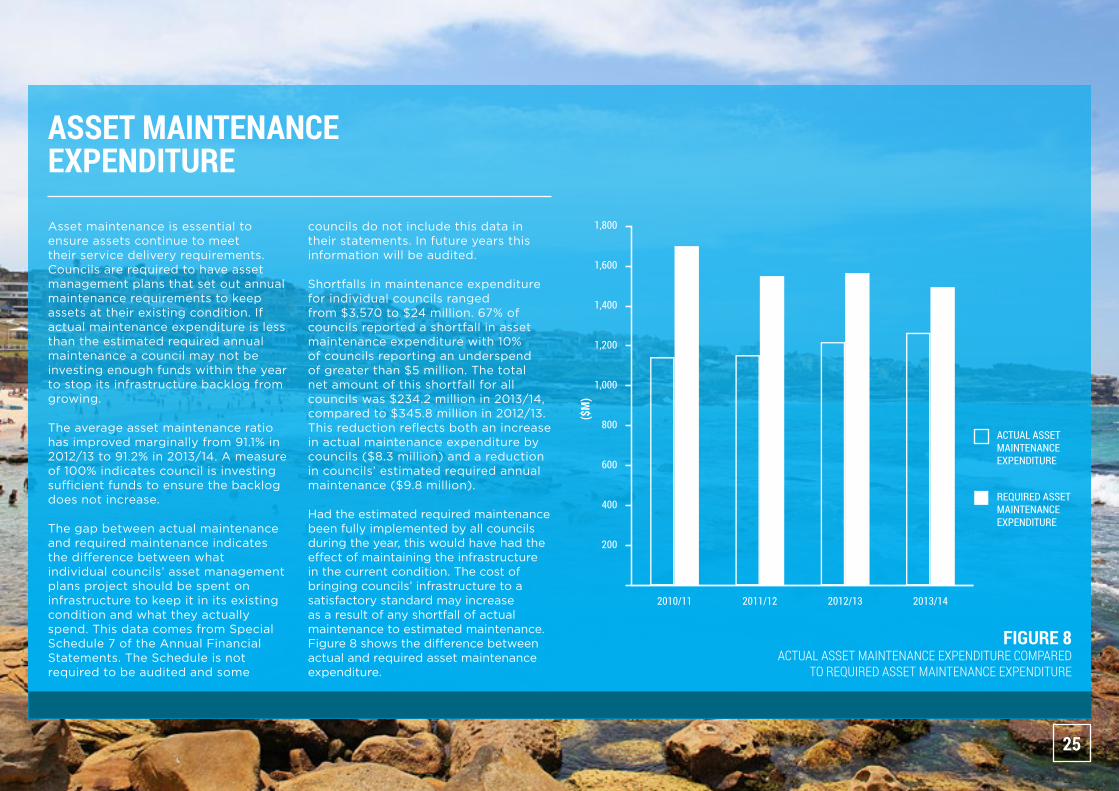
Asset maintenance is essential to ensure assets continue to meet their service delivery requirements. Councils are required to have asset management plans that set out annual maintenance requirements to keep assets at their existing condition. If actual maintenance expenditure is less than the estimated required annual maintenance a council may not be investing enough funds within the year to stop its infrastructure backlog from growing.
The average asset maintenance ratio has improved marginally from 91.1% in 2012/13 to 91.2% in 2013/14. A measure of 100% indicates council is investing sufficient funds to ensure the backlog does not increase.
The gap between actual maintenance and required maintenance indicates the difference between what individual councils’ asset management plans project should be spent on infrastructure to keep it in its existing condition and what they actually spend. This data comes from Special Schedule 7 of the Annual Financial Statements. The Schedule is not required to be audited and some
councils do not include this data in their statements. In future years this information will be audited.
Shortfalls in maintenance expenditure for individual councils ranged from $3,570 to $24 million. 67% of councils reported a shortfall in asset maintenance expenditure with 10% of councils reporting an underspend of greater than $5 million. The total net amount of this shortfall for all councils was $234.2 million in 2013/14, compared to $345.8 million in 2012/13. This reduction reflects both an increase in actual maintenance expenditure by councils ($8.3 million) and a reduction in councils’ estimated required annual maintenance ($9.8 million).
Had the estimated required maintenance been fully implemented by all councils during the year, this would have had the effect of maintaining the infrastructure in the current condition. The cost of bringing councils’ infrastructure to a satisfactory standard may increase as a result of any shortfall of actual maintenance to estimated maintenance. Figure 8 shows the difference between actual and required asset maintenance expenditure.
FIGURE 8ACTUAL ASSET MAINTENANCE EXPENDITURE COMPARED
TO REQUIRED ASSET MAINTENANCE EXPENDITURE
($M
)
25

BUILDING AND INFRASTRUCTURE RENEWAL RATIO
The building and infrastructure renewal ratio assesses the rate at which assets are being renewed against the rate at which they are depreciating. Renewal is defined as the replacement of existing assets to equivalent capacity or performance capability, as opposed to the acquisition of new assets. A result of greater than 100 is considered satisfactory. It is calculated by the amount of asset renewal divided by the amount of depreciation.
The State average improved to 87% in 2013/14, with 47 (31%) councils reporting a result of 100% or greater.
While results below the benchmark generally indicate that councils need to increase funding on infrastructure renewal to maintain assets, renewal of assets depends on the types of services and level of services to be provided in the future, as well as the age and condition of the asset. Consequently the renewal expenditure may vary from year to year. This ratio needs to be considered in conjunction with other financial indicators in determining a council’s financial position and sustainability.
26
$36.04m
$739.61
$9.848m
$8.316m
$1.532m
8.7
91.2
87.0
Total Cost to bring to satisfactory condition (backlog)
Backlog per capita
Total Required Annual Maintenance
Total Actual Annual Maintenance
Difference between required and actual maintenance
Infrastructure Backlog (%)
Asset Maintenance (%)
Building & Infrastructure Renewal (%)
$32.420m
$314.24
$11.894m
$10.325m
$1.57m
6.5
91.8
93.9
$10.886m
$3,616.08
$2.729m
$2.952m
$136,917
7.8
97.2
113.4
$48.676m
$357.60
$20.053m
$18.955m
$1.098m
5.4
101.5
83.7
$26.547m
$2,675.28
$5.193m
$4.441m
$751,942
12.4
91.4
82.8
$63.455m
$1,137.13
$15.489m
$12.001m
$3.488m
7.6
83.6
69.9
NSW Average Metropolitan RuralMetropolitan Fringe
Large RuralRegional Town/City
TABLE 7INFRASTRUCTURE RESULTS 2013/14
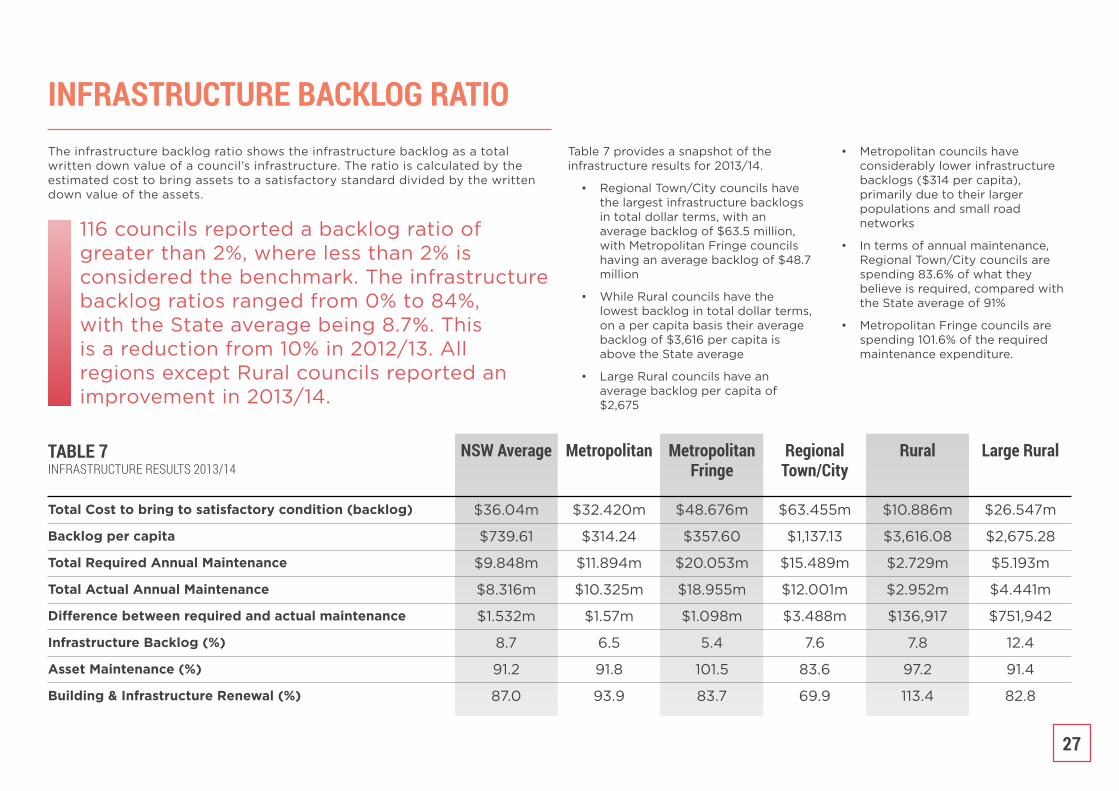
INFRASTRUCTURE BACKLOG RATIOThe infrastructure backlog ratio shows the infrastructure backlog as a total written down value of a council’s infrastructure. The ratio is calculated by the estimated cost to bring assets to a satisfactory standard divided by the written down value of the assets.
Table 7 provides a snapshot of the infrastructure results for 2013/14.
• Regional Town/City councils have the largest infrastructure backlogs in total dollar terms, with an average backlog of $63.5 million, with Metropolitan Fringe councils having an average backlog of $48.7 million
• While Rural councils have the lowest backlog in total dollar terms, on a per capita basis their average backlog of $3,616 per capita is above the State average
• Large Rural councils have an average backlog per capita of $2,675
• Metropolitan councils have considerably lower infrastructure backlogs ($314 per capita), primarily due to their larger populations and small road networks
• In terms of annual maintenance, Regional Town/City councils are spending 83.6% of what they believe is required, compared with the State average of 91%
• Metropolitan Fringe councils are spending 101.6% of the required maintenance expenditure.
116 councils reported a backlog ratio of greater than 2%, where less than 2% is considered the benchmark. The infrastructure backlog ratios ranged from 0% to 84%, with the State average being 8.7%. This is a reduction from 10% in 2012/13. All regions except Rural councils reported an improvement in 2013/14.
27

TABLE 8WHOLE OF SECTOR FINANCIAL
POSITION 2013/14
Table 8 shows the aggregate financial position result for the NSW local government sector for 2013/14. There has been an increase in net assets of $5M from 2012/13.
1,7964,1361,03719238
4087,607
1,8539870
128,7901,1091054
131,970139,576
1,2092991,2482,756
203,044473
3,537
6,293
133,283
Cash and cash equivalents
Investments
Receivables
Inventories
Other
Non-current assets classified as held for sale
Total Current Assets
NON-CURRENT ASSETS
Investments
Receivables
Inventories
Infrastructure, property, plant and equipment
Investment property
Intangible assets
Other
Total Non-current Assets
Total Assets
CURRENT LIABILITIES
Payables
Borrowings
Provisions
Total Current Liabilities
NON-CURRENT LIABILITIES
Payables
Borrowings
Provisions
Total Non-current Liabilities
Total Liabilities
Net Assets
-632641104-11-25244321
297-75-3
4,724957-1
4,9855,305
91103
104
-911546152
256
5,049
($M)Current Assets Diff from 2013/14 - 2012/13 ($M)
28

LOCAL INFRASTRUCTURE RENEWAL SCHEME (LIRS)
Investment in infrastructure has the capacity to stimulate and enhance the productivity of the economy in both the short and long term. It is an investment that has a multiplier effect throughout the economy, generating lasting economic, social and environmental benefits.
Traditionally, the focus on infrastructure asset management was the provision of new assets such as roads, water and sewerage networks, airports, entertainment centres and the like. However, it is becoming more and more apparent that it is no longer sustainable to
focus on meeting infrastructure needs through investment in the creation of new assets alone, without recognising the long-term lifecycle costs associated with the ongoing operation, maintenance and renewal of existing assets. As indicated, councils are struggling to keep up with maintenance and renewal of their assets to a level that is satisfactory to their community.
The Local Infrastructure Renewal Scheme (LIRS) provides councils with a subsidy in interest costs to make it affordable to take out major bank loans to assist councils with legitimate infrastructure backlogs to help meet the cost of financing renewals. LIRS is an important program for encouraging councils to manage and maintain local infrastructure.
This investment in debt funding has been proven to be far less expensive than paying for the long-term recurring maintenance requirements of deteriorating assets. Borrowings under LIRS can be for a maximum term of ten years.
LIRS is a key part of the Government’s commitment to address the infrastructure backlog faced by local governments, with the NSW Government committing $120 million to the scheme. Local infrastructure is an important component of ensuring that NSW has strong and sustainable local communities.
The funding for the 166 successful applications in Rounds 1, 2 and 3 will provide local communities with safer roads, bridges and footpaths, better
community halls and libraries, parks, sports fields and water and sewer facilities. This has unlocked more than $800 million worth of investment.
The program has had a significant positive impact on regional and rural communities as it allows councils across the State to address their infrastructure backlog projects and provide much needed facilities to their communities.
Figure 10 shows the distribution of the 166 projects funded to date in terms of the percentage of projects in the different regions. 65% of the projects are within regional and rural council areas.
29

FIGURE 9PROJECTS UNDERTAKEN
WITH LIRS FUNDINGFIGURE 10
FUNDING OF LIRS
30

Each year this report focuses on trends and developments in key areas of local service delivery. Previously we have focused on waste and library services. This year’s report focusses on planning and development activities.
The NSW Department of Planning & Environment compiled the 2013/14 Local Development Performance Monitoring Report (http://www.datareporting.planning.nsw.gov.au) providing comprehensive statistics about development in NSW, including annual information on the volume, value and type of development and council processing times. It is compiled using data supplied by local councils.
Achieving Community Outcomes
According to the report, in 2013/14, both the total number of development activity including Development Applications (DAs)# and complying development certificates (CDCs)^ increased by 12% compared with 2012/13 and the total value of approved developments increased by 17% to $28.69 billion worth of development.
The number of CDCs were the highest on record. CDCs now account for 29% of all development approvals (24,770 approvals).
The majority of developments approved were valued under $1 million; 96% of DAs and 99% of CDCs. 56% of all approved development in NSW was in the Sydney region, with a total value of $22 billion.
Overall residential development increased. Under the State Environmental Planning Policy (Affordable Rental Housing) 2009, approximately 2,000 new secondary dwellings (granny flats) DAs and CDCs were approved. Single new dwelling value increased by 18% to $6.054, billion however new multi-unit development value decreased by 11% to $3.804 billion.
Infrastructure development value decreased significantly by 40% to $194m, as did tourism development.
PLANNING & DEVELOPMENT
Development Activity
^ Complying development is a form of planning ap-proval that can be issued by an accredited certifier or a council in the form of a complying development certificate (CDC). This certificate combines approval for use of the land and building construction.
# Development Application is an application for consent from a consent authority, eg council, to undertake works /development as is required by the Environmental Planning and Assessment Act 1979.
31

The average gross times for determining DAs was 70 days. More than half of all NSW councils (59%) had a median gross processing time for DAs of 40 days or less and 78% of councils achieved median net determination times of 40 days or less. Average gross time taken by councils to process CDCs (based on 142 councils) was 18 days.
Based on the type of development in NSW, the average gross determining days for DAs are as follows:
• Residential - 65 days
• Commercial / retail / office - 74 days
• Infrastructure - 94 days
• Community facility - 96 days
• Industrial - 105 days
• Subdivisions - 121 days
• Tourist development - 157 days
• Mixed use development - 159 days
In 2013, the NSW Government allocated $30 million to the ePlanning program which involves the digitisation of planning services – transforming paper-based and face-to-face transactions to an online environment. In July 2014, a new ePlanning tool was launched to improve service delivery and transparency in the NSW planning system.
The new tools and services have been designed to make it easier for property owners, industry professionals and the community to interact with the planning system. The ePlanning program aims to make planning available online anywhere, at any time; helping industry, councils and the community to save time and money.
The ePlanning program is available at www.planning.nsw.gov.au/eplanning and is part of the NSW Government’s strategy to make data openly available.
The average gross time for all determinations varied as follows:
• Council staff - 62 days
• Councillors - 170 days
• Regional panels - 33 days
• Independent panels - 164 days
Council staff made 73% of all DA and CDC determinations. Private certifiers determined 24% of development and Councillors determined 2% of development. Joint regional planning panels and independent panels determined just 1% of developments.
Councils determined 18.5% of CDCs and private certifiers determined 81.5%. Private certifiers now issue the majority of construction certificates, CDCs and occupation certificates.
The number of council staff involved in DA processing across NSW was 1,021 in 2013-14. On average 60 DAs were determined by each full time council staff, however 12 councils recorded an average number of development determinations per full time staff of more than 100.
Determination Times ePlanning
32
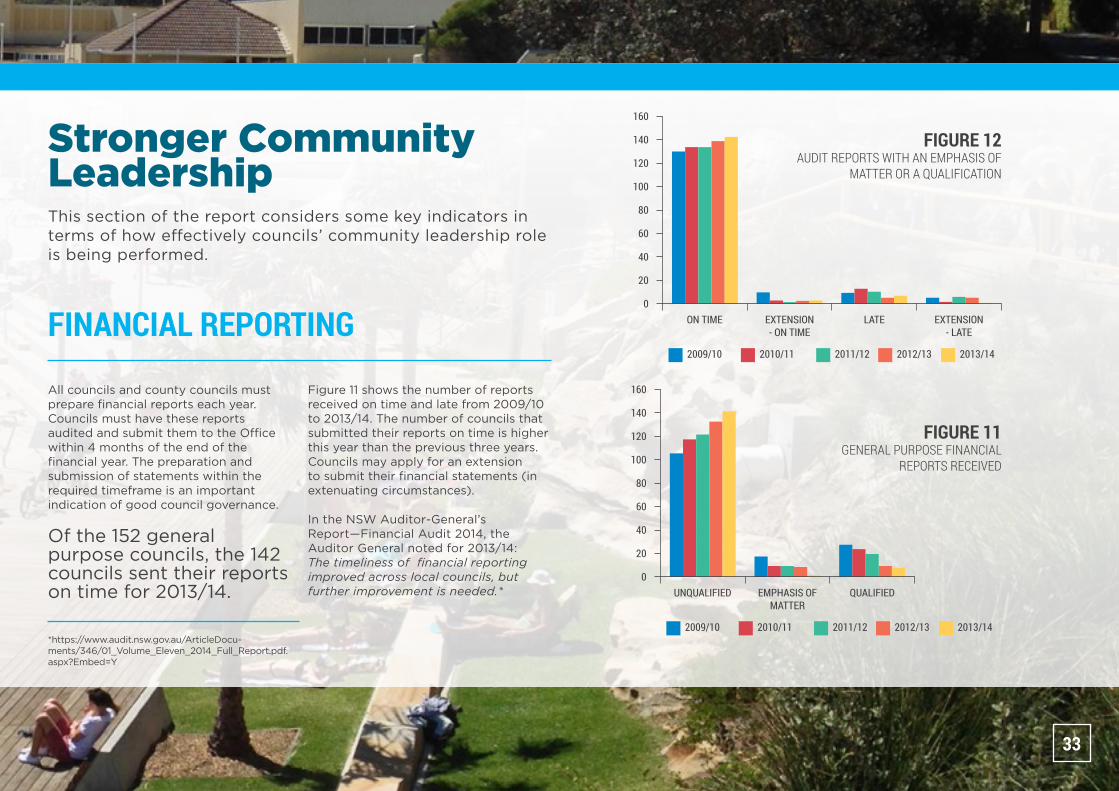
This section of the report considers some key indicators in terms of how effectively councils’ community leadership role is being performed.
Stronger Community Leadership
All councils and county councils must prepare financial reports each year. Councils must have these reports audited and submit them to the Office within 4 months of the end of the financial year. The preparation and submission of statements within the required timeframe is an important indication of good council governance.
Of the 152 general purpose councils, the 142 councils sent their reports on time for 2013/14.
FINANCIAL REPORTING
Figure 11 shows the number of reports received on time and late from 2009/10 to 2013/14. The number of councils that submitted their reports on time is higher this year than the previous three years. Councils may apply for an extension to submit their financial statements (in extenuating circumstances).
In the NSW Auditor-General’s Report—Financial Audit 2014, the Auditor General noted for 2013/14: The timeliness of financial reporting improved across local councils, but further improvement is needed.*
*https://www.audit.nsw.gov.au/ArticleDocu-ments/346/01_Volume_Eleven_2014_Full_Report.pdf.aspx?Embed=Y
FIGURE 12AUDIT REPORTS WITH AN EMPHASIS OF
MATTER OR A QUALIFICATION
FIGURE 11GENERAL PURPOSE FINANCIAL
REPORTS RECEIVED
33
A financial report audit provides reasonable assurance that in all material respect, the financial report has been prepared in accordance with the financial reporting framework. Following the audit, the Auditor provides an opinion on the audit.
This opinion can be unmodified, that is an unqualified report, which is also known as a clean opinion. The Auditor may however, provide a modified opinion. The modified opinion may be an emphasis of matter where a significant issue has been disclosed and needs to be drawn to the attention of the report user. A qualified opinion is when the auditor concludes that the financial report contains a material misstatement or the Auditor had been unable to obtain sufficient audit evidence.
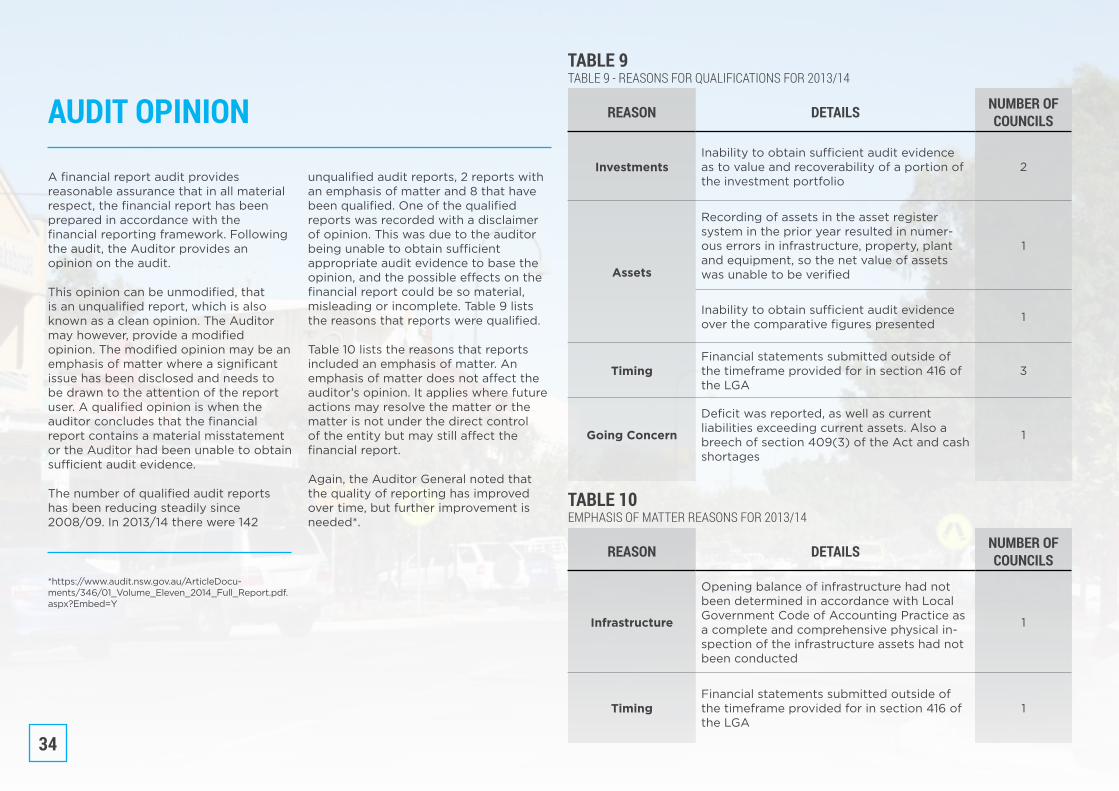
The number of qualified audit reports has been reducing steadily since 2008/09. In 2013/14 there were 142
AUDIT OPINION
unqualified audit reports, 2 reports with an emphasis of matter and 8 that have been qualified. One of the qualified reports was recorded with a disclaimer of opinion. This was due to the auditor being unable to obtain sufficient appropriate audit evidence to base the opinion, and the possible effects on the financial report could be so material, misleading or incomplete. Table 9 lists the reasons that reports were qualified.
Table 10 lists the reasons that reports included an emphasis of matter. An emphasis of matter does not affect the auditor’s opinion. It applies where future actions may resolve the matter or the matter is not under the direct control of the entity but may still affect the financial report.
Again, the Auditor General noted that the quality of reporting has improved over time, but further improvement is needed*.
*https://www.audit.nsw.gov.au/ArticleDocu-ments/346/01_Volume_Eleven_2014_Full_Report.pdf.aspx?Embed=Y
TABLE 9TABLE 9 - REASONS FOR QUALIFICATIONS FOR 2013/14
REASON DETAILS NUMBER OF COUNCILS
InvestmentsInability to obtain sufficient audit evidence as to value and recoverability of a portion of the investment portfolio
2
Assets
Recording of assets in the asset register system in the prior year resulted in numer-ous errors in infrastructure, property, plant and equipment, so the net value of assets was unable to be verified
1
Inability to obtain sufficient audit evidence over the comparative figures presented 1
TimingFinancial statements submitted outside of the timeframe provided for in section 416 of the LGA
3
Going Concern
Deficit was reported, as well as current liabilities exceeding current assets. Also a breech of section 409(3) of the Act and cash shortages
1
TABLE 10EMPHASIS OF MATTER REASONS FOR 2013/14
REASON DETAILS NUMBER OF COUNCILS
Infrastructure
Opening balance of infrastructure had not been determined in accordance with Local Government Code of Accounting Practice as a complete and comprehensive physical in-spection of the infrastructure assets had not been conducted
1
TimingFinancial statements submitted outside of the timeframe provided for in section 416 of the LGA
1
34

The Model Code of Conduct sets the minimum requirements of conduct for council officials in carrying out their functions and assists them to:
• understand the standards of conduct that are expected of them
• enable them to fulfill their statutory duty to act honestly and exercise a reasonable degree of care and diligence
• act in a way that enhances public confidence in the integrity of local government
• provide local communities with a valuable insight into the performance of the governing bodies of their councils
• drive organisational and individual improvement through community awareness and media reports
• Over 50% of councils received at least one code of conduct complaint
• 66% of all complaints were made to 24 councils
• The 20 councils with the greatest costs contribute to 69% of the costs incurred by all councils
• Where an investigation identified a breach, most were found to be a breach of the general conduct provisions
• Most recommendations made by a conduct reviewer or conduct review committee required the subject person to apologise to any person or organisation affected by the breach or be counselled for their conduct
• The Code of Conduct reporting period was 1 September 2013 to 31 August 2014 and includes County Councils.
2014 2013 Difference
Total number of complaints 322 296 9%
Number of councils that received a complaint 88 76 16%
Number of complaints finalised in reporting period 291 311 -6%
Total cost of dealing with complaints $1,177,702 $745,988 58%
TABLE 11CODE OF CONDUCT STATISTICS 2012/13—2013/14
The numbers of code of conduct complaints received by a council about its councillors or the General Manager is often an indicator of the internal health of the organisation. Code of conduct complaints are often symptomatic of political infighting or interpersonal conflict.
The reporting of complaints statistics is an important accountability mechanism that provides local communities with a valuable insight into the performance of their councils. The reports also assists the Office to evaluate councils’ implementation of the new Model Code framework and whether the framework has achieved its policy objectives.
CODE OF CONDUCT COMPLAINTS
What is the code of conduct? Key PointsWhat can code of conduct complaints tell us?
35
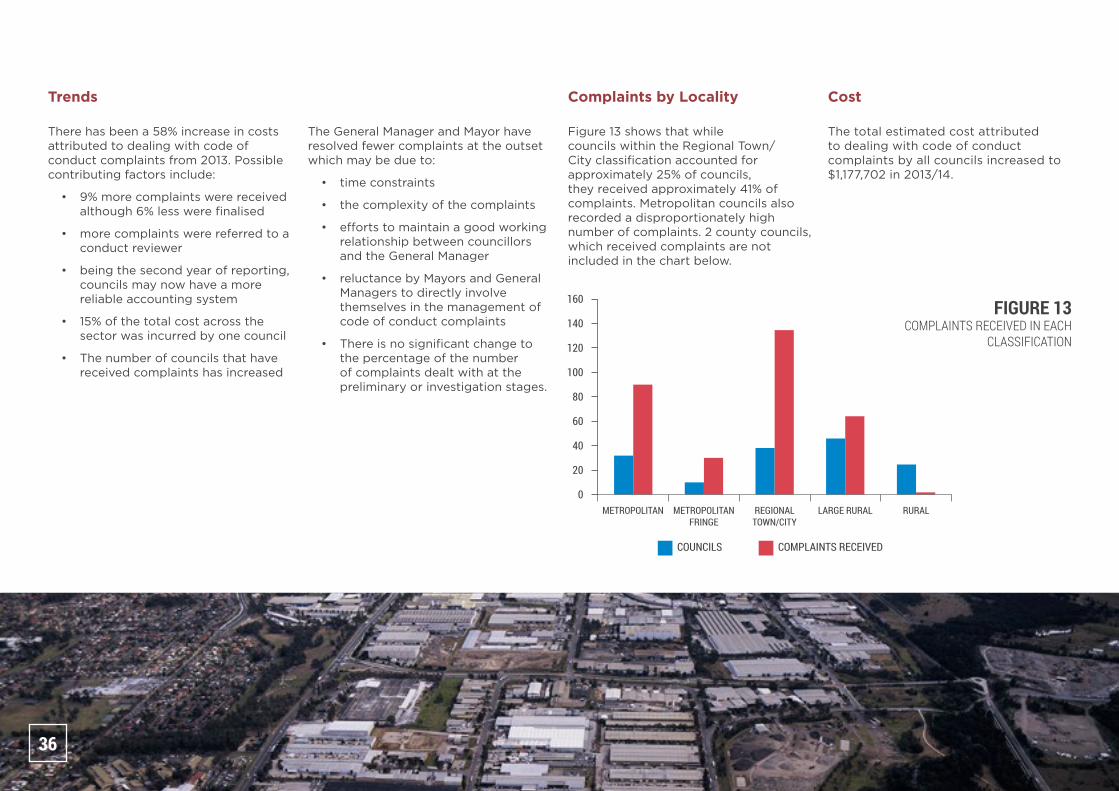
There has been a 58% increase in costs attributed to dealing with code of conduct complaints from 2013. Possible contributing factors include:
• 9% more complaints were received although 6% less were finalised
• more complaints were referred to a conduct reviewer
• being the second year of reporting, councils may now have a more reliable accounting system
• 15% of the total cost across the sector was incurred by one council
• The number of councils that have received complaints has increased
The total estimated cost attributed to dealing with code of conduct complaints by all councils increased to $1,177,702 in 2013/14.
Figure 13 shows that while councils within the Regional Town/City classification accounted for approximately 25% of councils, they received approximately 41% of complaints. Metropolitan councils also recorded a disproportionately high number of complaints. 2 county councils, which received complaints are not included in the chart below.
Trends CostComplaints by Locality
The General Manager and Mayor have resolved fewer complaints at the outset which may be due to:
• time constraints
• the complexity of the complaints
• efforts to maintain a good working relationship between councillors and the General Manager
• reluctance by Mayors and General Managers to directly involve themselves in the management of code of conduct complaints
• There is no significant change to the percentage of the number of complaints dealt with at the preliminary or investigation stages.
FIGURE 13COMPLAINTS RECEIVED IN EACH
CLASSIFICATION
36

The Office of Local Government Locations
DISCLAIMER
Office Hours Alternate Media Publications
Nowra Office
Levels 1 & 2 5 O’Keefe Avenue NOWRA NSW 2541
Locked Bag 3015NOWRA NSW 2541
Phone 02 4428 4100Fax 02 4428 4199
Monday to Friday8.30am to 5.00pm
(Special arrangements may be made if these hours are unsuitable)
All offices are wheelchair accessible.
While every effort has been made to ensure the accuracy of the information in this publication, the Office of Local Government expressly disclaims any liability to any person in respect of anything done or not done as a result of the contents of the publication or the data provided.
© NSW Office of Local Government 2015
ISSN 1038-9504
Produced by the Office of Local Government
Special arrangements can be made for our publications to be provided in large print or an alternative media format. If you need this service, please contact our Operations Group on 02 9289 4000.
Sydney Office
Level 9,6 – 10 O’Connell Street SYDNEY NSW 2000
PO Box R1772ROYAL EXCHANGE NSW 1225
Phone 02 9289 4000Fax 02 9289 4099
ACCESS TO SERVICES