Embed Size (px)
Citation preview

Confidential
Your HD Machine:
Opportunities to ensure better outcomes
Jeffrey J Sands MD MMM
Associate Medical Director Devices
Renal Therapies Group

Confidential 2
Agenda
• Sodium balance– Dialysis prescription– Delivery, SVS
• Bicarbonate– Prescription– Relationship with cardiac events
• Dialysis adequacy– Variation– OLC

Confidential 3
Topic 1: Na balance
What is the most commonly prescribed
dialysate Na?
a. 136
b. 137
c. 138
d. 139
e. 140

Confidential
What is the most common patient predialysis
Na?
a. 134-135
b. 136-137
c. 138-139
d. 140-141
e. 142-143
4

Confidential
What percentage of patients have Na gradient
(dialysate Na – patient Na) ≥5 mEQ/L?
a. 0-5%
b. 6-10%
c. 11-15%
d. 16-20%
e. ≥21%
5

Confidential 6
Dialysate Sodium Distribution# of Patients = 77,616 (July, 2011)
0.7 0.3
74.5
5.80.9
16.2
0.2 0.7 0.0 0.2 0.60
10
20
30
40
50
60
70
80
130-135 136 137 138 139 140 141 142 143 144 ≥145
Dialysate Sodium
%
Prescribed dialysate Na (mEq/L)
• 137: 74.5% of patients
• 140: 16.2% of patients
• ≥141: 1.7% of patients• ≤136: 1.0% of patients
Note: Proton Only

Confidential 7
Serum Sodium Distribution# of Patients = 82,775 (July, 2011)
2.31.3
1.92.8
4.4
6.5
8.8
11.3
13.1 13.5
12.0
9.2
6.4
3.6
1.8 1.4
0
2
4
6
8
10
12
14
16
120-130
131 132 133 134 135 136 137 138 139 140 141 142 143 144 ≥145
Serum Sodium
%
Patient predialysis Na (mEq/L)
• 136-137: 20.1% of patients
• 138-139: 26.6% of patients
• 140-141: 21.2% of patients
• ≥142: 13.2% of patients• ≤135: 19.2% of patients
Note: Proton Only

Confidential 8
Sodium Gradient Distribution# of Patients = 77,616 (July, 2011)
10.6
7.6
10.1
12.1 12.311.5
9.8
7.7
5.8
4.0
8.6
0
2
4
6
8
10
12
14
≤-5 -4 -3 -2 -1 0 1 2 3 4 ≥5
Sodium Gradient
%
Dialysis Na gradient (mEq/L)
• -1 to -4: 42.6% patients
• 1 to 2: 17.5% patients
• 3 to 4: 10.8% patients
• ≥ 5: 8.6% patients
• ≤ -5: 10.8% patients
Note: Proton Only

Confidential 9
F Gotch, 2009
Patient
Dialysate
132
142
137
Na loading and weight gain
• Constant positive dialysate Na gradient of + 5 mEq/L
will add ~8.7 gms NaCl to the patient
• Significant increase in intradialytic weight gain
– ~0.6 L extracellular fluid volume expansion1
– ~70 mL2 to 1201 mL per mEq/L Na gradient
135
140
145
0 50 100 150 200 250
Dialysis time min
So
diu
m C
on
cen
trat
e m
Eq
/L
CdiNa CptNa CspNa
~ 8.7 gm NaCl added
Projected
1. Keen M, et al. Int J Artif Organs 30: 971-979, 20072. Mendoza JM et al. Nephrol Dial Transplant 0:1–6 2011
Confidential 10
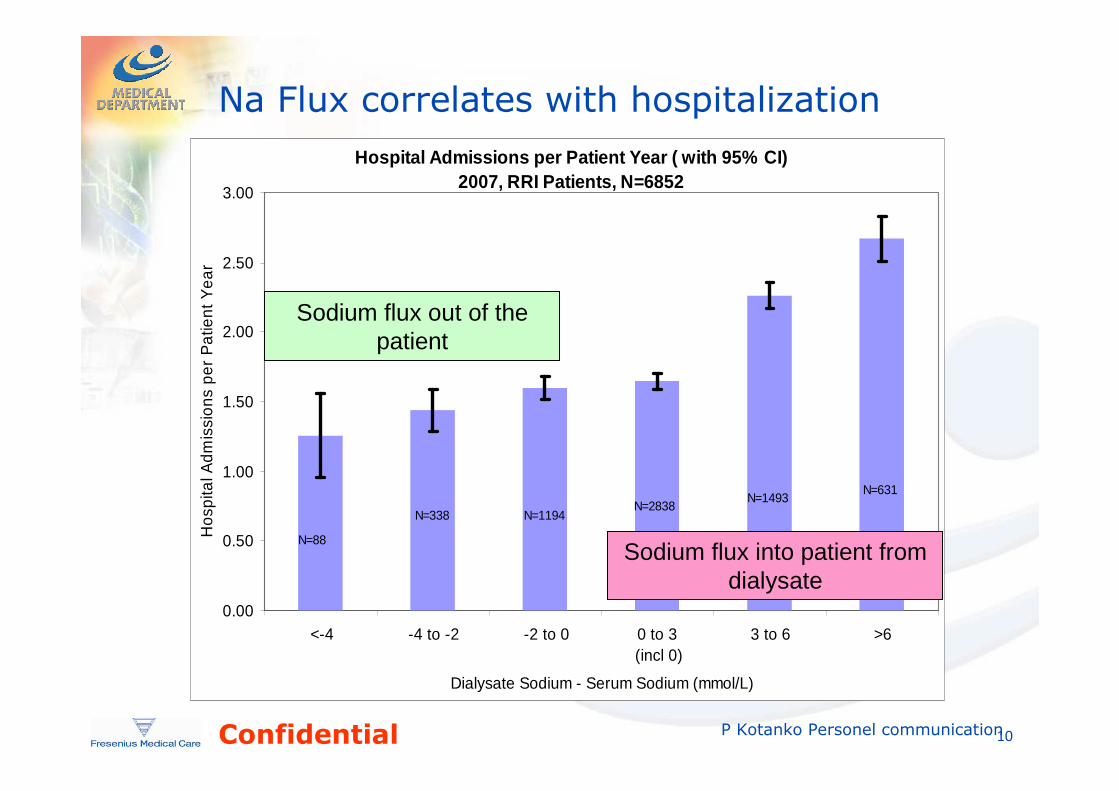
Na Flux correlates with hospitalization
Hospital Admissions per Patient Year ( with 95% CI)2007, RRI Patients, N=6852
0.00
0.50
1.00
1.50
2.00
2.50
3.00
<-4 -4 to -2 -2 to 0 0 to 3 (incl 0)
3 to 6 >6
Dialysate Sodium - Serum Sodium (mmol/L)
Hos
pita
l Adm
issi
ons
per
Pat
ient
Yea
r
N=88
N=338 N=1194N=2838
N=1493N=631
Sodium flux into patient from dialysate
Sodium flux out of the patient
P Kotanko Personel communication
Confidential 11
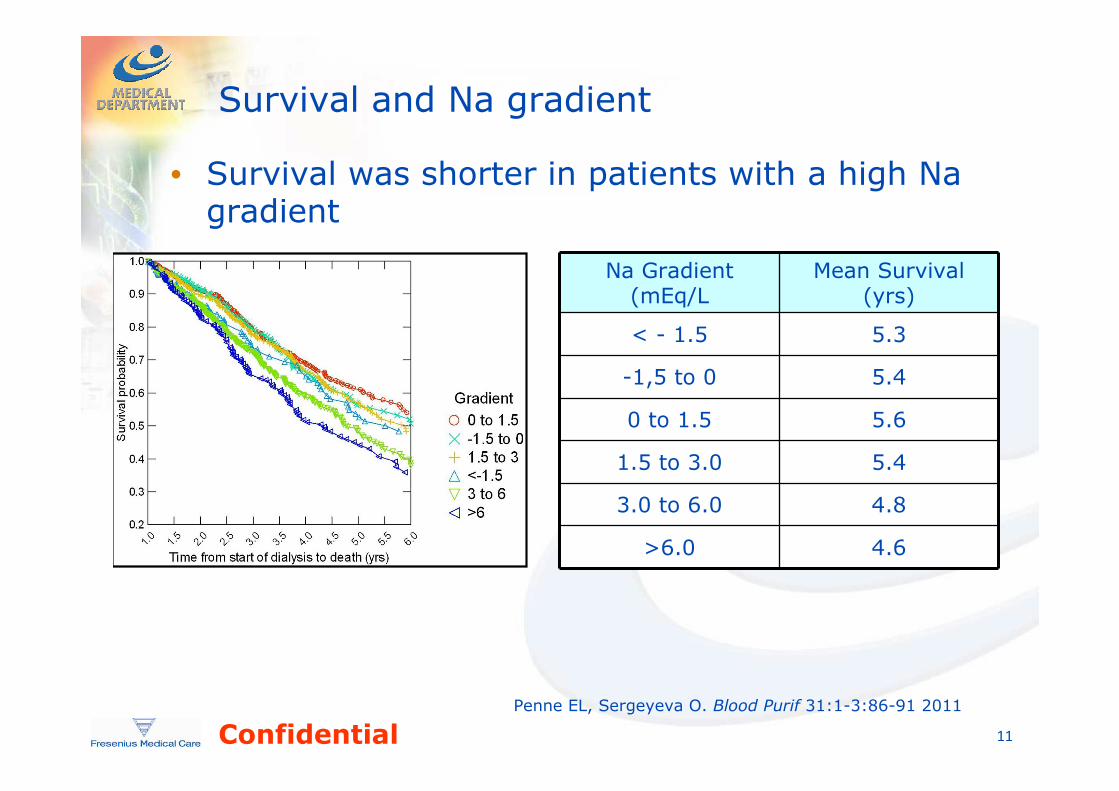
Survival and Na gradient
• Survival was shorter in patients with a high Na gradient
Penne EL, Sergeyeva O. Blood Purif 31:1-3:86-91 2011
Na Gradient (mEq/L
Mean Survival (yrs)
< - 1.5 5.3
-1,5 to 0 5.4
0 to 1.5 5.6
1.5 to 3.0 5.4
3.0 to 6.0 4.8
>6.0 4.6
Confidential 12
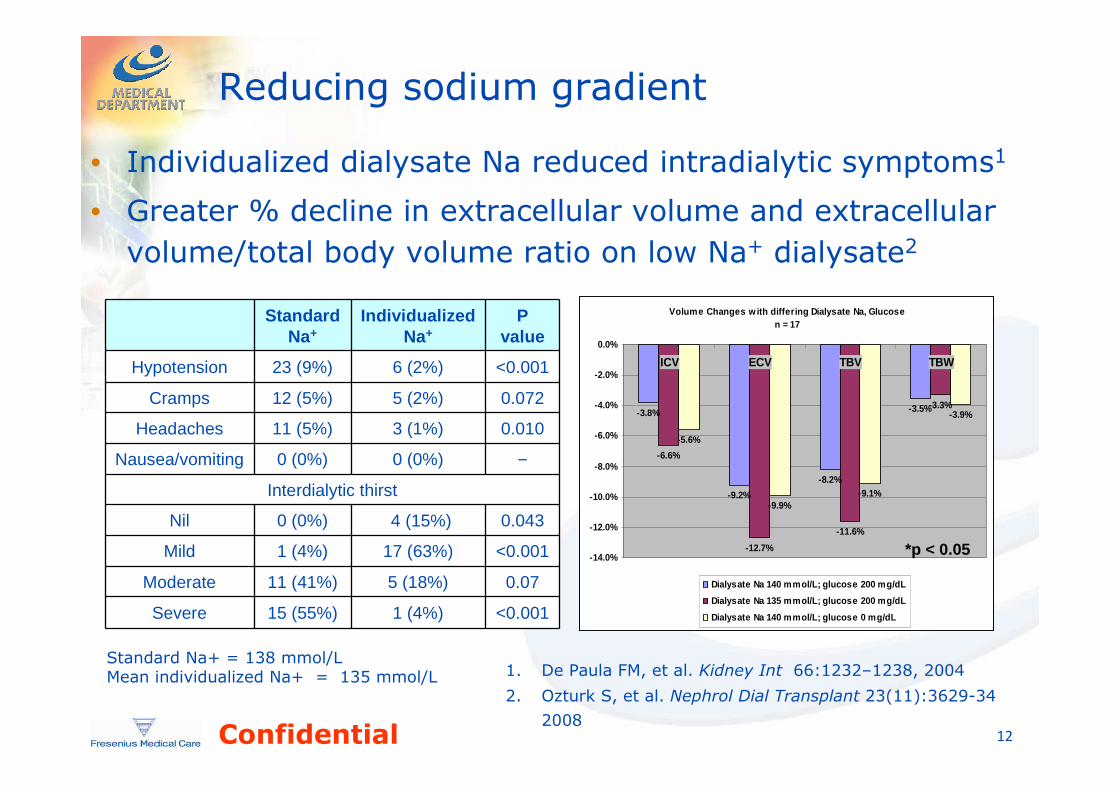
Reducing sodium gradient
• Individualized dialysate Na reduced intradialytic symptoms1
• Greater % decline in extracellular volume and extracellular
volume/total body volume ratio on low Na+ dialysate2
1. De Paula FM, et al. Kidney Int 66:1232–1238, 2004
2. Ozturk S, et al. Nephrol Dial Transplant 23(11):3629-34
2008
Standard Na+
Individualized Na+
Pvalue
Hypotension 23 (9%) 6 (2%) <0.001
Cramps 12 (5%) 5 (2%) 0.072
Headaches 11 (5%) 3 (1%) 0.010
Nausea/vomiting 0 (0%) 0 (0%) –
Interdialytic thirst
Nil 0 (0%) 4 (15%) 0.043
Mild 1 (4%) 17 (63%) <0.001
Moderate 11 (41%) 5 (18%) 0.07
Severe 15 (55%) 1 (4%) <0.001
Standard Na+ = 138 mmol/LMean individualized Na+ = 135 mmol/L
Volume Changes w ith differing Dialysate Na, Glucosen = 17
-3.8%
-9.2%
-8.2%
-3.5%
-6.6%
-12.7%
-11.6%
-3.3%
-5.6%
-9.9%-9.1%
-3.9%
-14.0%
-12.0%
-10.0%
-8.0%
-6.0%
-4.0%
-2.0%
0.0%
ICV ECV TBV TBW
Dialysate Na 140 mmol/L; glucose 200 mg/dL
Dialysate Na 135 mmol/L; glucose 200 mg/dL
Dialysate Na 140 mmol/L; glucose 0 mg/dL
*p < 0.05

Confidential 13
2008 Series hemodialysis machine specifications
• Base Na (130 to 155 mEq/L Na)
– Once set, remains unchanged until reset
• Conductivity reflects dialysate Na (~Na/10)– Accuracy ± 1.5%
• Alarm windows ±0.5 mS/cm around TCD– Can adjust an additional ±0.5 mS/cm asymetrically– Range of Display: 10.0 to 17.0 mS/cm
– Alarm limits will not go below 12.5 or above 16.0 mS/cm
Dialysis Paused
Conc 2231 45x
Conductivity Limits
SVS Profile
14.1
13.1
Alarm
Position
Alarm
Width
Acid/Bicarb
Alert
Dialysate HeparinBlood
Pressure
Test,
OptionsHome
Dex.
mEq/L
Ca++
K+
Mg++
Ac.
mEq/L
mEq/L
mEq/L
mg/dL
1.02.2
4.0
2.0
99
mS/cmTCD 13.6
Bicarbonate
mEq/L35
mEq/L
Base Na+
138
Dialysate Composition
Trends
13.8 mS/ cm
Kt/V
AF
BTM
BVM
None
Blood Pressure 9:05
9:00 100/70 53Dialysis Paused
ArterialPressure
VenousPressure
260
-80
500
0
-160 mmHg
300
-280
0
TMP
190mmHg mmHg
UF Goal
UF Rate
UF Removed
UF Time
Dialysate Flow
Temperature
Conductivity
RTD
UF Profile
ml/min500
hr:min3:00 oC37.0
mS/cm13.8ml/hr1000
ml0 hr:min3:00
ml3000
60
520
SVS Profile
Tx Paused
Blood Pressure 9:05
Home Dialysate HeparinBlood
Pressure
Test,
OptionsTrends
Kt/V
AF
BTM
BVM
Blood Pump Rate
ml/min250 NoneNone
9:00 100/70 53Dialysis PausedArterial
PressureVenous
Pressure
260
-80
500
0
-160 mmHg
300
-280
0
TMP
190mmHg mmHg
UF Goal
UF Rate
UF Removed
UF Time
Dialysate Flow
Temperature
Conductivity
RTD
UF Profile
ml/min500 ml/min500
hr:min3:00 hr:min3:00 oC37.0 oC37.0
mS/cm13.8 mS/cm13.8ml/hr1000 ml/hr1000
ml0 ml0 hr:min3:00 hr:min3:00
ml3000
60
520
SVS Profile
Tx Paused
Blood Pressure 9:05Blood Pressure 9:05
Home Dialysate HeparinBlood
Pressure
Test,
OptionsTrends
Kt/V
AF
BTM
BVM
Blood Pump Rate
ml/min250 ml/min250 NoneNone
9:00 100/70 53

Confidential 14
Na % From Nominal 11/09-05/10
-3.00
-2.00
-1.00
0.00
1.00
2.00
3.00
1 27 53 79 105 131 157 183 209 235 261 287 313 339 365 391 417 443 469 495 521 547 573 599 625 651 677 703 729 755
1st Sample
Last Sample
% Deviation of daily samples of acid concentratefrom the target over 6 months
Acid concentrate and Na variability
• Acid concentrate: Within ±2.5% specifications• Concentrate delivery requirements
– Maximum supplied pressure 2 psi
– Maximum suction height 3 feet
F Gotch 2010

Confidential 15
SVS profiles and Na balance
• SVS profiles are Na balance positive (PS) unless the base Na is set lower than the patients Na
• Balance positive Na+ profiles can easily be overused
– Prescribed PRN without systematic review

Confidential 16
Increased weight gain and higher serum Na with
Na positive profiles (PS)
• Use of Na+ balance positive profiles should be avoided
unless specifically directed by the physician
– Greater weight gain, serum Na increased (p < 0.05)
• Balance–neutral Na+ profiles (NS, NA) achieved lower
post dialysis weight, closest to EDW with less UF
Song JH, et al. J Am Soc Nephrol 16:1, 237-246, 2005

Confidential 17
Topic 2: Bicarbonate
What is the most commonly prescribed dialysate bicarbonate?
a. 35
b. 36
c. 37
d. 38
e. 39
f. 40

Confidential
What is the most common patient pre-dialysis bicarbonate?
a. 22
b. 23
c. 24
d. 25
e. 26,
f. 27
g. 28
18
Confidential
What level of bicarbonate correlates with increased risk of sudden death in incident patients (Pick all that apply)?
a. <20,
b. 20-21.9
c. 22-23.9
d. 24-25.9
e. 26-27.9
f. ≥28
19

Confidential 20
Dialysate Bicarbonate Distribution# of Patients = 86,617 (July, 2011)
0.8 0.3 0.4
10.9
1.9
10.0
2.9
60.7
4.2 4.3 3.9
0
10
20
30
40
50
60
70
≤30 31 32 33 34 35 36 37 38 39 40
Dialysate Bicarbonate
%
Prescribed base bicarbonate (mEq/L)
• ≤32: 1.5% patients• 33 to 34: 12.8% patients• 35 to 36: 12.9% patients• 37: 60.7% patients• 38 to 39: 8.5% patients• 40: 3.9% patients
Note: Proton Only

Confidential 21
Bicarbonate Lab Result Distribution# of Patients = 91,984 (July. 2011)
2.5 2.2
3.5
5.4
7.8
10.1
11.712.4
11.7
10.2
8.2
5.8
3.8
2.3 2.5
0
2
4
6
8
10
12
14
≤17 18 19 20 21 22 23 24 25 26 27 28 29 30 ≥31
Serum Bicarbonate
%
Patient pre-dialysis bicarbonate (mEq/L)
• ≤20: 13.6% patients• 21 to 22: 14.2% patients• 23 to 25: 35.8% patients• 26 to 27: 18.4% patients• ≥28: 14.4% patients
Note: Proton Only

Confidential 22
Pre-HD Bicarbonate and sudden death risk
Relative Risk of CP Arrest: Bicarbonate
0.0
1.0
2.0
3.0
4.0
5.0
6.0
7.0
<20 20-21.9 22-23.9 24-25.9 26-27.9 ≥28
Bicarbonate
Od
ds
Rat
io E
stim
ates
0
6
12
18
24
30
36
% o
f Pat
ient
s
Unadjusted
Case-Mix Adj.
Case-Mix+Lab Adj.
Case-Mix+Lab+VA Adj.
% of Patients
Ref
*
*
*
*
* : P < 0.0001
^ : P < 0.05
Labs included for Adjustment:alb, calcium, glucose, hgb, phosphorus, & wbc
Vascular Access Adjustment:catheter = 1, fistula & graft = 0
*
^
*
****
**
*
Confidential 23
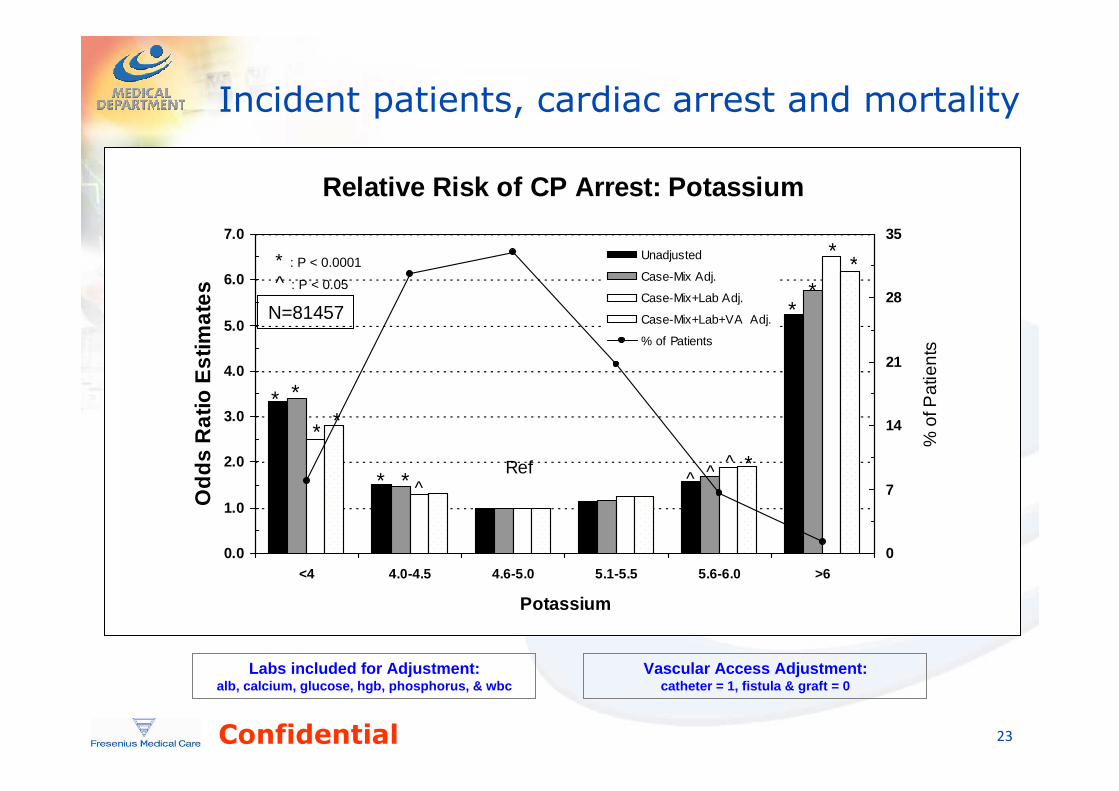
Incident patients, cardiac arrest and mortality
Labs included for Adjustment:alb, calcium, glucose, hgb, phosphorus, & wbc
Vascular Access Adjustment:catheter = 1, fistula & graft = 0
Relative Risk of CP Arrest: Potassium
0.0
1.0
2.0
3.0
4.0
5.0
6.0
7.0
<4 4.0-4.5 4.6-5.0 5.1-5.5 5.6-6.0 >6
Potassium
Od
ds
Rat
io E
stim
ates
0
7
14
21
28
35
% o
f Pat
ient
s
Unadjusted
Case-Mix Adj.
Case-Mix+Lab Adj.
Case-Mix+Lab+VA Adj.
% of Patients
Ref
*
* ^
^
^^ ^
*
*
*
*
*
*
*
*
** : P < 0.0001
^ : P < 0.05
N=81457

Confidential 24
Incident patients, cardiac arrest and mortality
Labs included for Adjustment:alb, calcium, glucose, hgb, phosphorus, & wbc
*
Vascular Access Adjustment:catheter = 1, fistula & graft = 0
Relative Risk of CP Arrest: Potassium & Bicarbonate
0.0
1.0
2.0
3.0
4.0
5.0
6.0
7.0
8.0
9.0
k<4 & Bicarb<28 k<4 & Bicarb≥28 k≥4 & Bicarb<28 k≥4 & Bicarb≥28
Potassium & Bicarbonate
Od
ds
Rat
io E
stim
ates
0
10
20
30
40
50
60
70
80
90
% o
f Pat
ient
s
Unadjusted
Case-Mix Adj.
Case-Mix+Lab Adj.
Case-Mix+Lab+VA Adj.
% of Patients
Ref
*
*
*
*
*
*
*
**
*
*
*
*
*
* : P < 0.0001
^ : P < 0.05
N=81457
Confidential 25
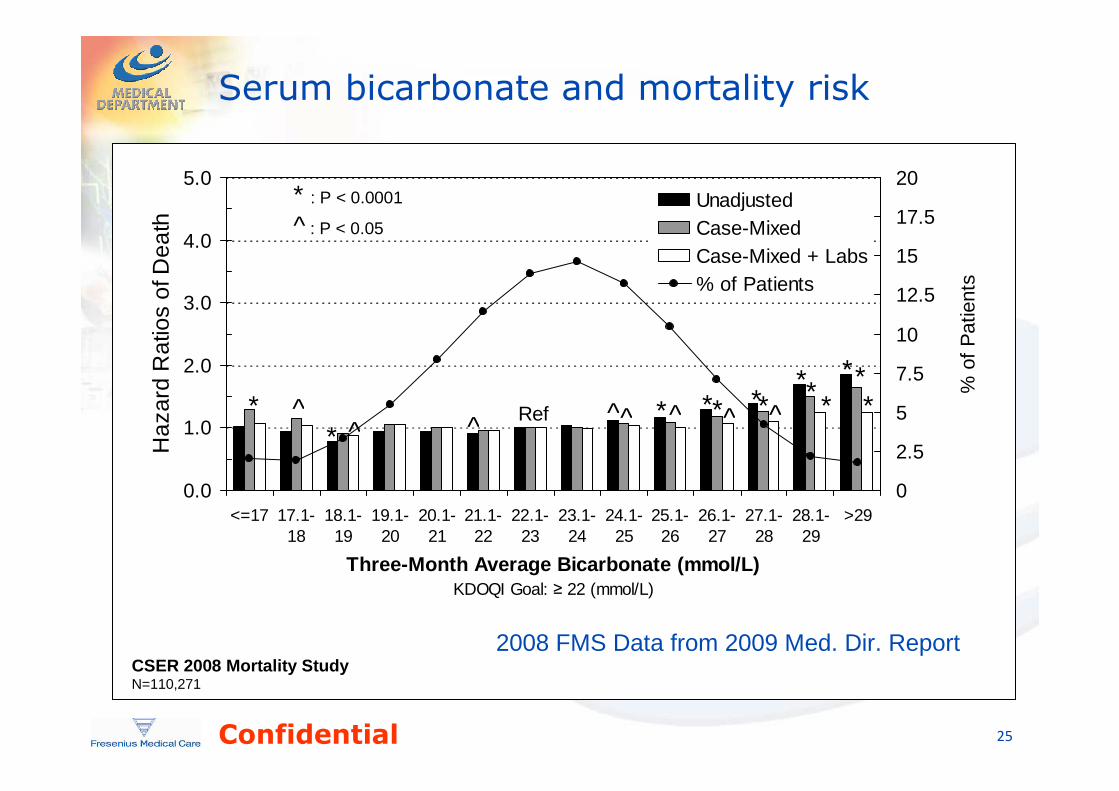
Serum bicarbonate and mortality risk
0.0
1.0
2.0
3.0
4.0
5.0
<=17 17.1-18
18.1-19
19.1-20
20.1-21
21.1-22
22.1-23
23.1-24
24.1-25
25.1-26
26.1-27
27.1-28
28.1-29
>29
Three-Month Average Bicarbonate (mmol/L)KDOQI Goal: ≥ 22 (mmol/L)
Haz
ard
Rat
ios
of D
eath
0
2.5
5
7.5
10
12.5
15
17.5
20
% o
f P
atie
nts
UnadjustedCase-Mixed Case-Mixed + Labs% of Patients
Ref** ^ ^
**^
**^^ ^ ^ *
^*
*** **
* : P < 0.0001
^ : P < 0.05
CSER 2008 Mortality StudyN=110,271
2008 FMS Data from 2009 Med. Dir. Report

Confidential 26
Machine and concentrate
• Bicarbonate– Adjustment Range 20 to 40 mEq/L Bicarbonate
– Total base includes bicarb + acetate and/or citrate
• Naturalyte 4mEq/L acetate, Granuflo 8mEq/L acetate
• Concentrate supply– Maximum supplied pressure 2 psi
– Maximum suction height 3 feet
Dialysis Paused
Conc 2231 45x
Conductivity Limits
SVS Profile
14.1
13.1
Alarm
Position
Alarm
Width
Acid/Bicarb
Alert
Dialysate HeparinBlood
Pressure
Test,
OptionsHome
Dex.
mEq/L
Ca++
K+
Mg++
Ac.
mEq/L
mEq/L
mEq/L
mg/dL
1.02.2
4.0
2.0
99
mS/cmTCD 13.6
Bicarbonate
mEq/L35
mEq/L
Base Na+
138
Dialysate Composition
Trends
13.8 mS/ cm
Kt/V
AF
BTM
BVM
None
Blood Pressure 9:05
9:00 100/70 53Dialysis Paused
Conc 2231 45x
Conductivity Limits
SVS Profile
14.1
13.1
Alarm
Position
Alarm
Width
Acid/Bicarb
Alert
Dialysate HeparinBlood
Pressure
Test,
OptionsHome
Dex.
mEq/L
Ca++
K+
Mg++
Ac.
mEq/L
mEq/L
mEq/L
mg/dL
1.02.2
4.0
2.0
99
mS/cmTCD 13.6
Bicarbonate
mEq/L35
mEq/L
Base Na+
138
Dialysate Composition
Trends
13.8 mS/ cm
Kt/V
AF
BTM
BVM
None
Blood Pressure 9:05
9:00 100/70 53Dialysis PausedArterial
PressureVenous
Pressure
260
-80
500
0
-160 mmHg
300
-280
0
TMP
190mmHg mmHg
UF Goal
UF Rate
UF Removed
UF Time
Dialysate Flow
Temperature
Conductivity
RTD
UF Profile
ml/min500
hr:min3:00 oC37.0
mS/cm13.8ml/hr1000
ml0 hr:min3:00
ml3000
60
520
SVS Profile
Tx Paused
Blood Pressure 9:05
Home Dialysate HeparinBlood
Pressure
Test,
OptionsTrends
Kt/V
AF
BTM
BVM
Blood Pump Rate
ml/min250 NoneNone
9:00 100/70 53Dialysis PausedArterial
PressureVenous
Pressure
260
-80
500
0
-160 mmHg
300
-280
0
TMP
190mmHg mmHg
UF Goal
UF Rate
UF Removed
UF Time
Dialysate Flow
Temperature
Conductivity
RTD
UF Profile
ml/min500 ml/min500
hr:min3:00 hr:min3:00 oC37.0 oC37.0
mS/cm13.8 mS/cm13.8ml/hr1000 ml/hr1000
ml0 ml0 hr:min3:00 hr:min3:00
ml3000
60
520
SVS Profile
Tx Paused
Blood Pressure 9:05Blood Pressure 9:05
Home Dialysate HeparinBlood
Pressure
Test,
OptionsTrends
Kt/V
AF
BTM
BVM
Blood Pump Rate
ml/min250 ml/min250 NoneNone
9:00 100/70 53

Confidential 27
Topic 3: Dialysis adequacy
What percentage of patients have spKt/V < 1.4 by
UKM in any given month?
a. 0-3.9%
b. 4-6.9% 7-9.9%
c. 10-12.9%
d. ≥ 13%

Confidential
What percentage of patients have mean spKt/V <
1.4 by OLC in any given month?
• 0-3.9%
• 4-6.9%
• 7-9.9%
• 10-12.9%
• ≥ 13%
28

Confidential
What % of patients in a month with spKt/V by
OLC < 1.4 on 0% treatments?
a. <20%
b. 20-34.9%
c. 35-49.9%
d. 50-64.9%
e. 65-84.9%
f. ≥ 85%
29
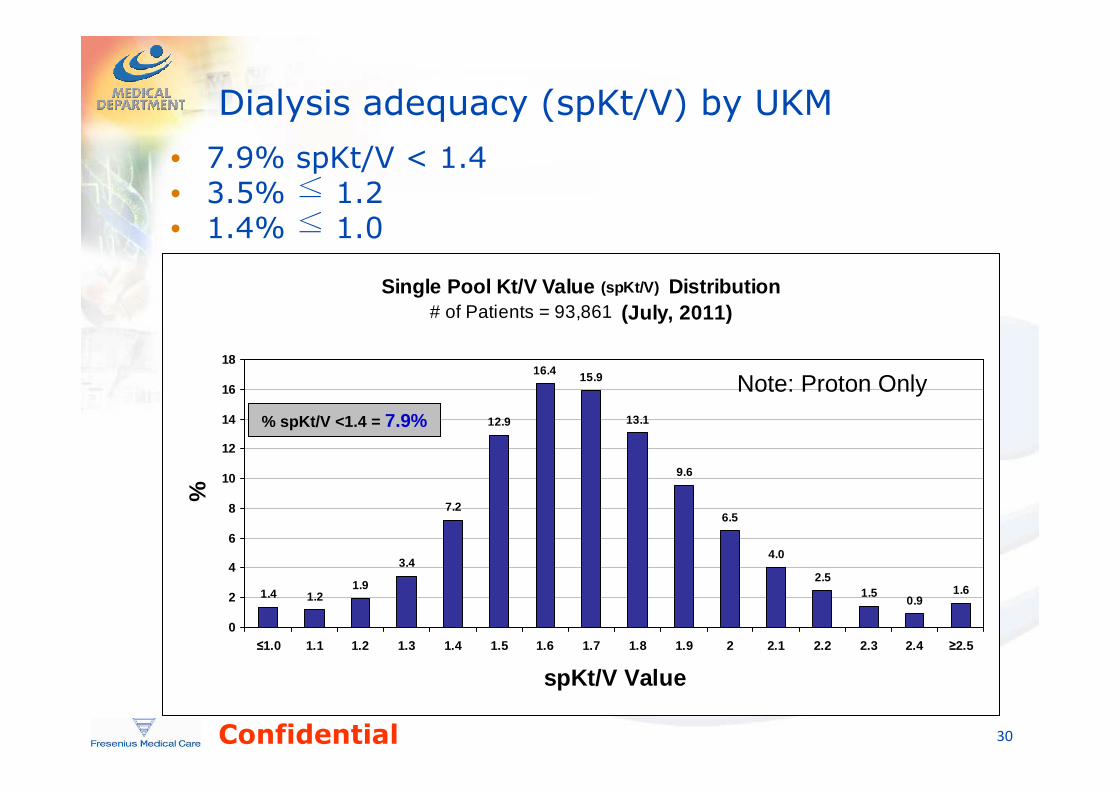
Confidential 30
Single Pool Kt/V Value (spKt/V) Distribution# of Patients = 93,861 (July, 2011)
1.4 1.21.9
3.4
7.2
12.9
16.4 15.9
13.1
9.6
6.5
4.0
2.51.5
0.91.6
0
2
4
6
8
10
12
14
16
18
≤1.0 1.1 1.2 1.3 1.4 1.5 1.6 1.7 1.8 1.9 2 2.1 2.2 2.3 2.4 ≥2.5
spKt/V Value
%
% spKt/V <1.4 = 7.9%
Note: Proton Only
Dialysis adequacy (spKt/V) by UKM
• 7.9% spKt/V < 1.4• 3.5% ≤ 1.2• 1.4% ≤ 1.0

Confidential 31
Mean & Median OLC Distribution of All Available Treatments per Patient
# of Patients = 93,280(July, 2011)
2.0 2.1
3.7
6.6
11.8
17.2 17.3
13.9
9.9
6.2
3.82.3
1.3 0.8 0.5 0.92.2 2.0
3.3
16.3
10.5
7.0
4.4
2.7
1.10.60.9
1.6
14.4
17.2
10.5
5.4
0
2
4
6
8
10
12
14
16
18
20
≤1.0 1.1 1.2 1.3 1.4 1.5 1.6 1.7 1.8 1.9 2 2.1 2.2 2.3 2.4 ≥2.5
OLC Value
%
mean median
% spKt/V <1.4 >14.3%
Dialysis adequacy (spKt/V) by OLC
• 14.3% spKt/V < 1.4 (mean for month)• 7.7% ≤ 1.2• 2.0% ≤ 1.0
Note: Proton Only

Confidential 32
% of Treatments w. OLC <1.4# of Patients = 93,280 (July, 2011)
38.4
17.3
10.8
6.7 6.54.2
2.6 3.3 2.3 2.3
5.8
0
5
10
15
20
25
30
35
40
45
0 1-10 11-20 21-30 31-40 41-50 51-60 61-70 71-80 81-90 91-100
% of Treatments w. OLC < 1.4
%
Note: Proton Only
% Treatments with spKt/V by OLC < 1.4
• 0% Tx < 1.4: 38.4% patients• 1 -20%: 28.6% patients• 21-40%: 13.2% patients• >40% 21.3% patients

Confidential 33
Distribution of OLC spKt/V Standard Deviation(July, 2011)
6.2
24.7 24.2
17.5
11.3
7.2
4.12.2 1.1 0.7 1.0
0
5
10
15
20
25
30
35
40
45
0-.05 .06-.10 .11-.15 .16-.20 .21-.25 .26-.30 .31-.35 .36-.40 .41-.45 .46-.50 >.50
OLC Standard Deviation
%
Note: Proton Only
Intra-patient variation in spKt/V by OLC
• Mean OLC spKt/V = 1.61• Mean SD = 0.17 (in individual patients)• Mean CV =10.69% (in individual patients)

Confidential 34
15105Subgroup 0
1.7
1.6
1.5
Indi
vidu
al V
alue
Mean=1.612
UCL=1.716
LCL=1.508
0.15
0.10
0.05
0.00
Mo
ving
Ran
ge
R=0.03923
UCL=0.1282
LCL=0
Normal Variation

Confidential 35
0Subgroup 5 10
1.0
1.5
2.0
Indi
vidu
al V
alue
1
Mean=1.473
UCL=2.026
LCL=0.9188
0.00.10.20.30.40.50.60.7
Mo
ving
Ran
ge
R=0.2082
UCL=0.6802
LCL=0
I and MR Chart for July OLC spKt/V
Improved Qb Improved Qb
spKt/V by OLC: Example 1

Confidential 36
105Subgroup 0
2.32.22.12.01.91.81.71.61.51.41.3
Indi
vidu
al V
alue
1
Mean=1.804
UCL=2.206
LCL=1.403
0.6
0.5
0.4
0.3
0.2
0.1
0.0
Mo
ving
Ran
ge
1
R=0.1509
UCL=0.4931
LCL=0
Incorrect VolumeIncorrect Volume
spKt/V by OLC: Example 2
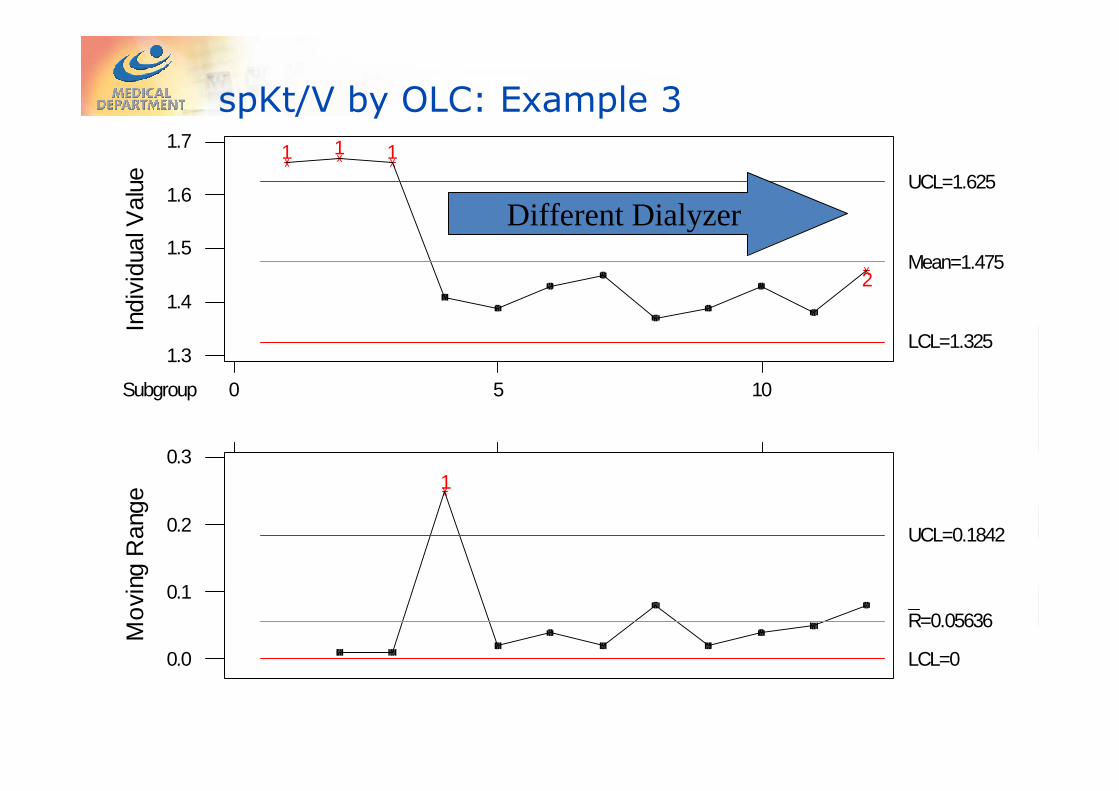
Confidential 37
105Subgroup 0
1.7
1.6
1.5
1.4
1.3
Indi
vidu
al V
alue
1 1 1
2Mean=1.475
UCL=1.625
LCL=1.325
0.3
0.2
0.1
0.0
Mo
ving
Ran
ge
1
R=0.05636
UCL=0.1842
LCL=0
Different Dialyzer
spKt/V by OLC: Example 3

Confidential 38
8765432Subgroup 1
1.35
1.30
1.25
1.20
1.15
1.10
1.05
1.00
Indi
vidu
al V
alue
Mean=1.174
UCL=1.330
LCL=1.018
0.2
0.1
0.0
Mo
ving
Ran
ge
R=0.05857
UCL=0.1914
LCL=0
Needs Prescription ChangeNeeds Prescription Change
spKt/V by OLC: Example 4

Confidential 39
Practical steps to ensure better outcomes
• Follow manufacturers recommendations
– Check conductivity and pH with an independent meter
– "On-line Pressure Holding Test" must be activated
• Consider the alarm limits
– Shifting conductivity limits from ±0.5 mE/L theoretical can allow up to a 10 mEq/L variation in Na from prescribed
• Consider the dialysis prescription
– Na: What is the patients Na gradient?
• Contribution: ~8.7 gms NaCl for every 5 mEq/L gradient• Na profiles (SVS) result in a positive Na gradient unless base Na is lower than the patients pre-HD Na
– Bicarb: Avoid pre and post HD alkalosis
• Remember: Total buffer = base bicarbonate plus up to 8 mEq/L of base (acetate, citrate) from acid concentrate
• Use machine information (OLC, TCD, conductivity etc)
– Observe AMP lights; obtain adequate OLC Kt/V every Tx

Confidential 40
Conclusions
• Na balance, volume control and and dialysis
adequacy remain areas with potential for
outcomes improvement
– More emphasis on preventing Na loading
• Serum bicarbonate and the risk of alkalosis are
also potentially overlooked
• Machines settings and alarms are designed to
provide range of prescriptions safely and
effectively
• HD machine information can provide insight
into the specifics of dialysis delivery and
facilitate improved dialysis outcomes


![Continuous UF [c-UF] - Fluytec](https://img.pdfslide.net/doc/110x75/621dd77d3e23281ec7546610/continuous-uf-c-uf-fluytec.jpg)

