Embed Size (px)
Citation preview
All Contents © 2008 Burton Group. All rights reserved.
Your Strategic Security Metrics Program
Pete Lindstrom
Senior Analyst, SRMS
www.burtongroup.com
All Contents © 2008 Burton Group. All rights reserved.
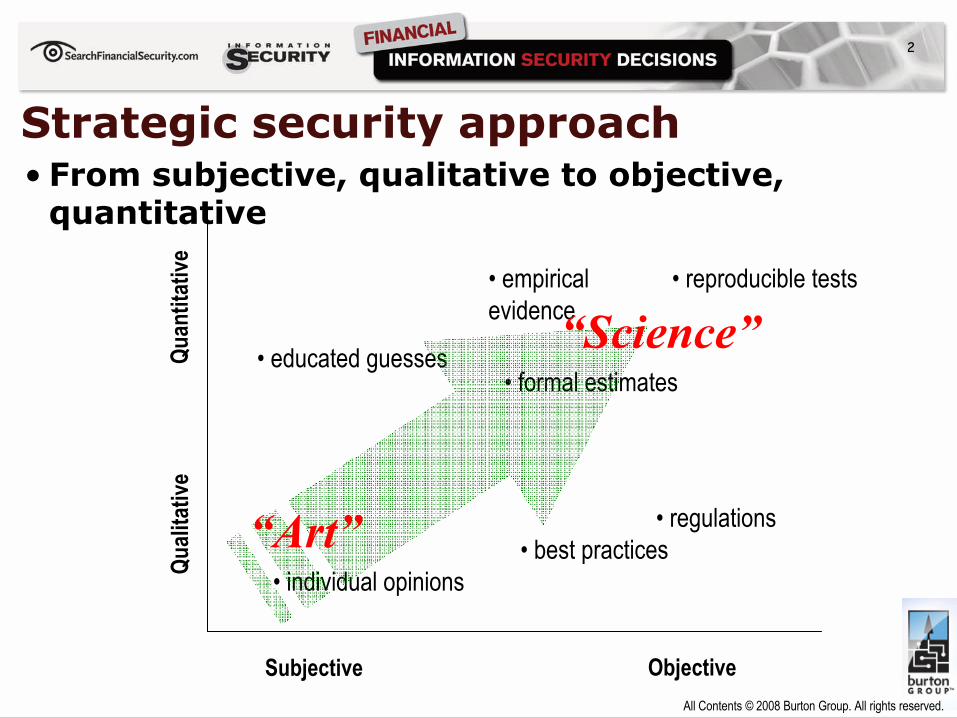
Strategic security approach
Subjective Objective
Quali
tativ
eQu
antit
ative
• educated guesses
• empirical evidence
• individual opinions
• formal estimates
• best practices
• From subjective, qualitative to objective, quantitative
“Art”
“Science”• reproducible tests
• regulations
2
All Contents © 2008 Burton Group. All rights reserved.
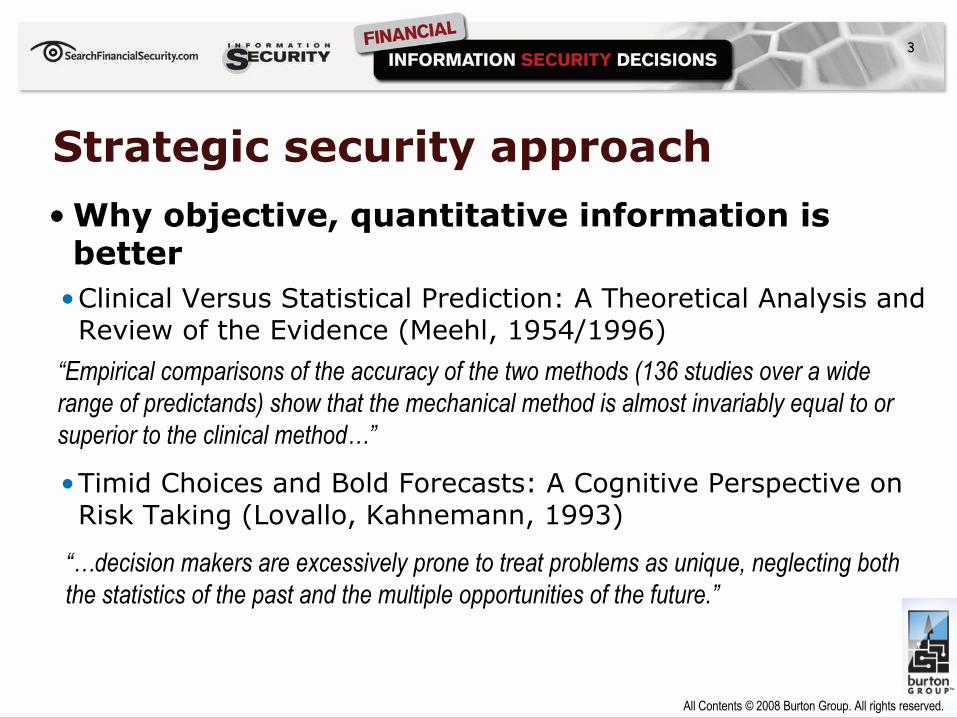
Strategic security approach
• Why objective, quantitative information is better
•Clinical Versus Statistical Prediction: A Theoretical Analysis and Review of the Evidence (Meehl, 1954/1996)
•Timid Choices and Bold Forecasts: A Cognitive Perspective on Risk Taking (Lovallo, Kahnemann, 1993)
“…decision makers are excessively prone to treat problems as unique, neglecting both the statistics of the past and the multiple opportunities of the future.”
“Empirical comparisons of the accuracy of the two methods (136 studies over a wide range of predictands) show that the mechanical method is almost invariably equal to or superior to the clinical method…”
3
All Contents © 2008 Burton Group. All rights reserved.
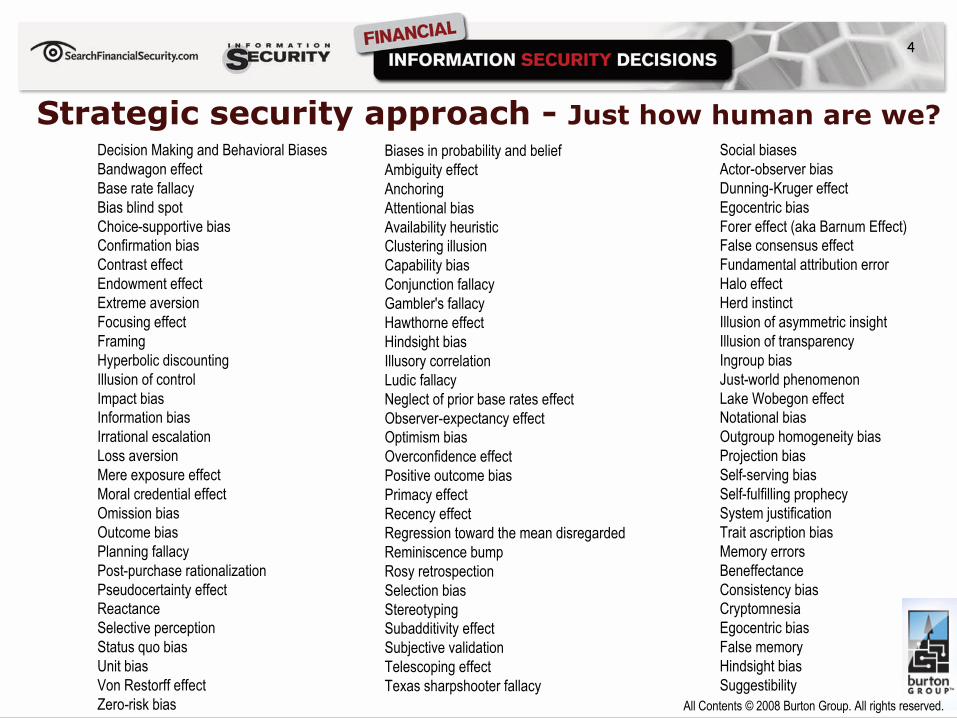
Strategic security approach - Just how human are we?Decision Making and Behavioral BiasesBandwagon effectBase rate fallacyBias blind spotChoice-supportive biasConfirmation biasContrast effectEndowment effectExtreme aversionFocusing effectFramingHyperbolic discountingIllusion of controlImpact biasInformation biasIrrational escalationLoss aversionMere exposure effectMoral credential effectOmission biasOutcome biasPlanning fallacyPost-purchase rationalizationPseudocertainty effectReactanceSelective perceptionStatus quo biasUnit biasVon Restorff effectZero-risk bias
Social biasesActor-observer biasDunning-Kruger effectEgocentric biasForer effect (aka Barnum Effect)False consensus effectFundamental attribution errorHalo effectHerd instinctIllusion of asymmetric insightIllusion of transparencyIngroup biasJust-world phenomenonLake Wobegon effectNotational biasOutgroup homogeneity biasProjection biasSelf-serving biasSelf-fulfilling prophecySystem justificationTrait ascription biasMemory errorsBeneffectanceConsistency biasCryptomnesiaEgocentric biasFalse memoryHindsight biasSuggestibility
Biases in probability and beliefAmbiguity effectAnchoringAttentional biasAvailability heuristicClustering illusionCapability biasConjunction fallacyGambler's fallacyHawthorne effectHindsight biasIllusory correlationLudic fallacyNeglect of prior base rates effectObserver-expectancy effectOptimism biasOverconfidence effectPositive outcome biasPrimacy effectRecency effectRegression toward the mean disregardedReminiscence bumpRosy retrospectionSelection biasStereotypingSubadditivity effectSubjective validationTelescoping effectTexas sharpshooter fallacy
4
All Contents © 2008 Burton Group. All rights reserved.
Strategic security approach
• Bottom line•Risk is impossible to eliminate•Subjective approaches are full of bias and ambiguity•Decisions are being made based on assumptions and guesses•We must move toward objective approaches to be taken seriously
•In the end, we can demonstrate what a strong security program looks like
5
All Contents © 2008 Burton Group. All rights reserved.
A security metrics model
• What does executive management want to know?•What is our risk level?•How strong is our security program?•Are we maintaining appropriate cost control?
• What they don’t want to know…•How many security FTEs it takes to change a lightbulb?•The risk difference between SSL VPNs and IPsec VPNs•A smirky, self-righteous “nobody knows for sure”
• What we give them•Red, Yellow, Green based on guesses•Thumbs up, thumbs down
6
All Contents © 2008 Burton Group. All rights reserved.
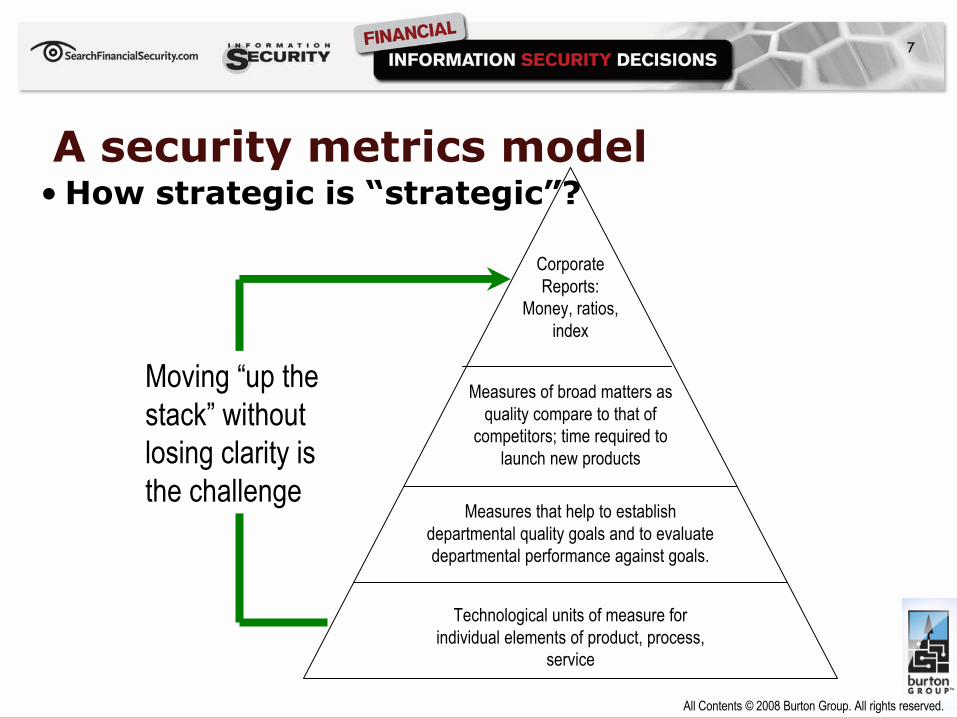
A security metrics model• How strategic is “strategic”?
Corporate Reports:
Money, ratios, index
Measures of broad matters as quality compare to that of
competitors; time required to launch new products
Measures that help to establish departmental quality goals and to evaluate departmental performance against goals.
Technological units of measure for individual elements of product, process,
service
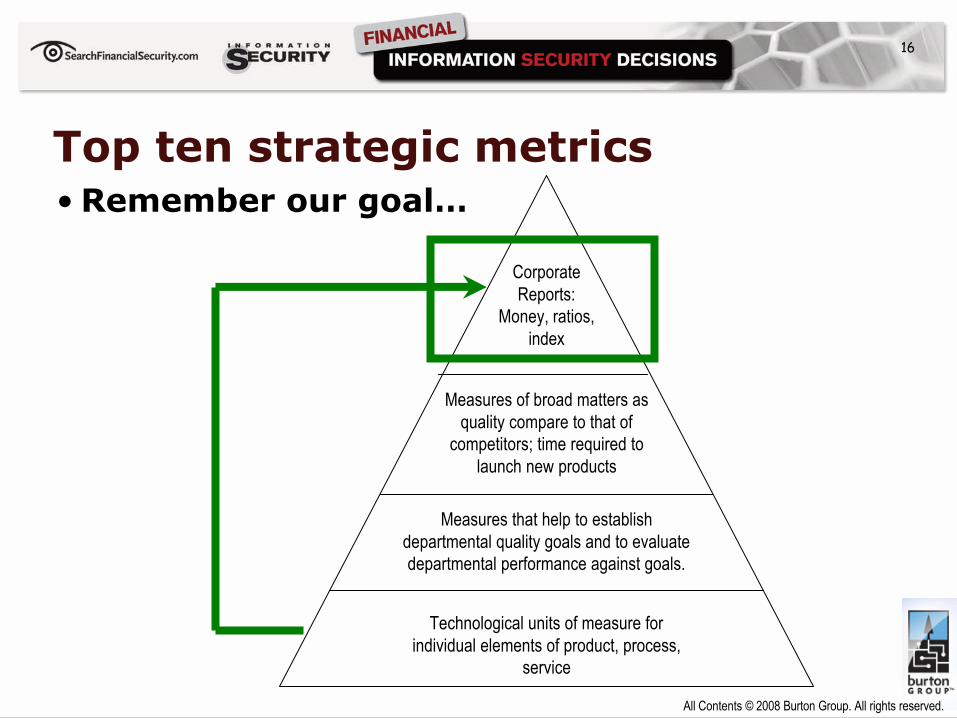
Moving “up the stack” without losing clarity is the challenge
7
All Contents © 2008 Burton Group. All rights reserved.
A security metrics model
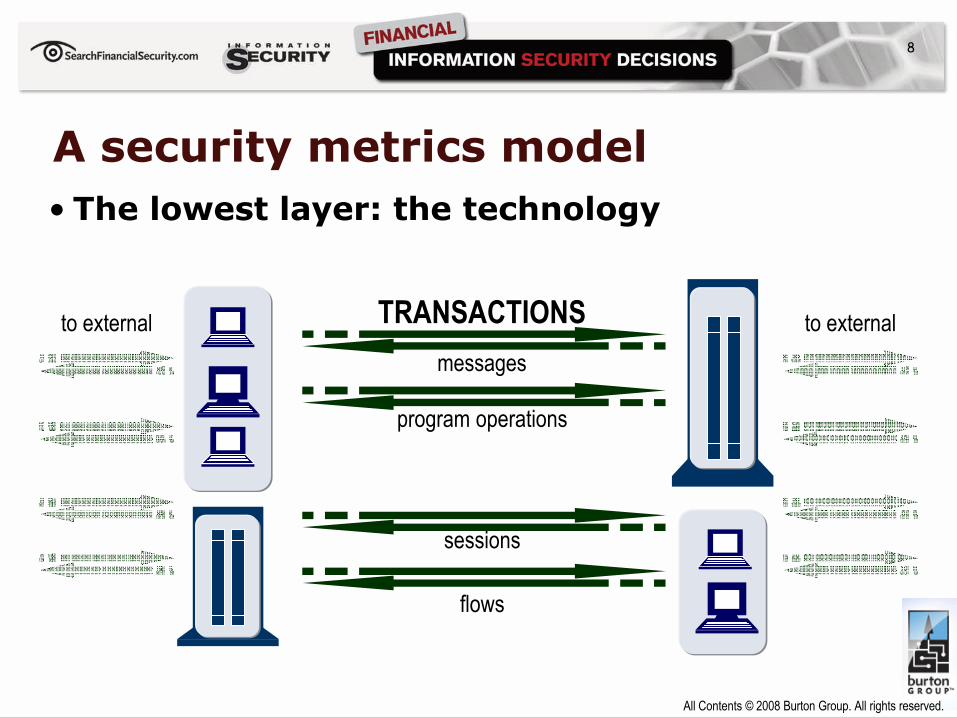
TRANSACTIONSmessages
program operations
sessions
flows
to external to external
8
• The lowest layer: the technology
All Contents © 2008 Burton Group. All rights reserved.
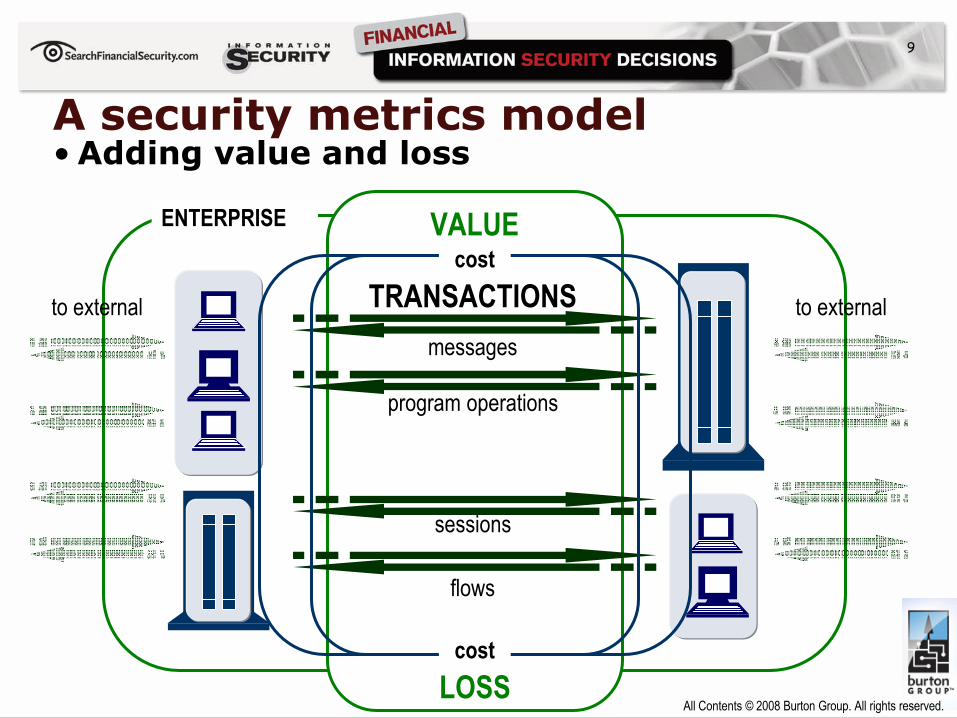
A security metrics model
TRANSACTIONSmessages
program operations
sessions
flows
to external to external
VALUE
LOSS
ENTERPRISEcost
cost
9
• Adding value and loss
All Contents © 2008 Burton Group. All rights reserved.
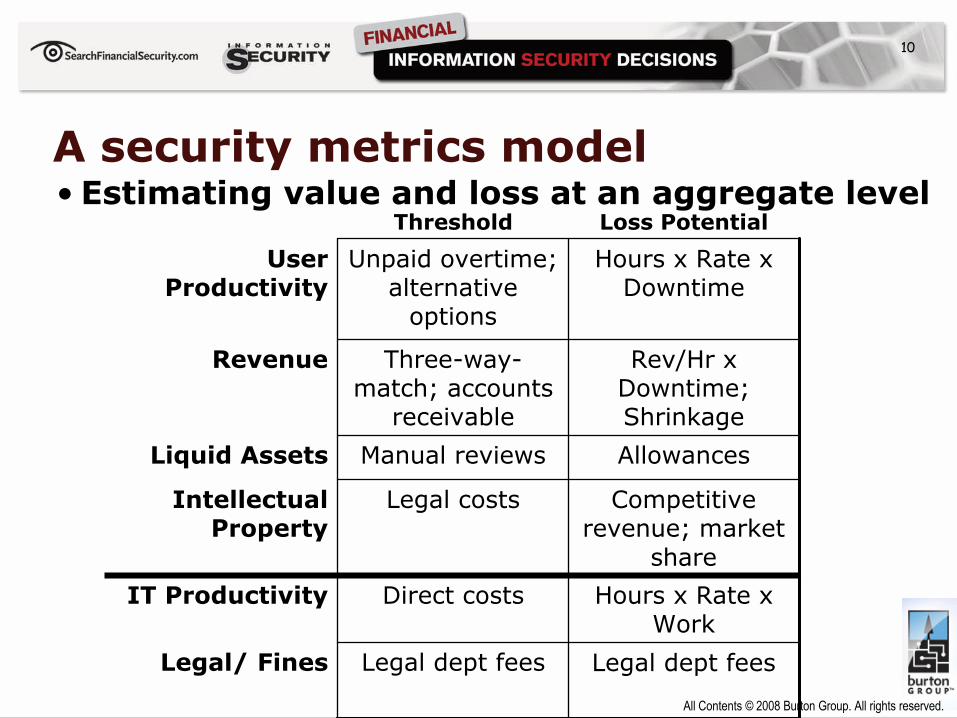
A security metrics model• Estimating value and loss at an aggregate level
Legal dept fees
Direct costs
Legal costs
Manual reviews
Three-way-match; accounts
receivable
Unpaid overtime; alternative
options
Threshold
Hours x Rate x Downtime
User Productivity
Legal dept feesLegal/ Fines
Hours x Rate x Work
IT Productivity
Competitive revenue; market
share
Intellectual Property
AllowancesLiquid Assets
Rev/Hr x Downtime; Shrinkage
Revenue
Loss Potential
10
All Contents © 2008 Burton Group. All rights reserved.
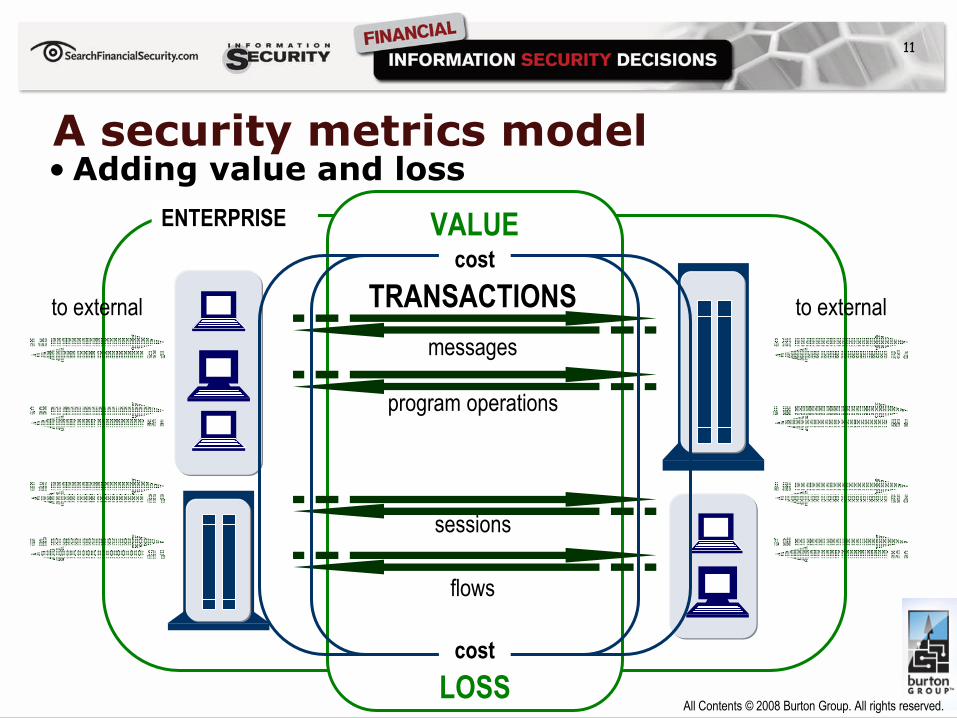
A security metrics model
TRANSACTIONSmessages
program operations
sessions
flows
to external to external
VALUE
LOSS
ENTERPRISEcost
cost
11
• Adding value and loss
All Contents © 2008 Burton Group. All rights reserved.
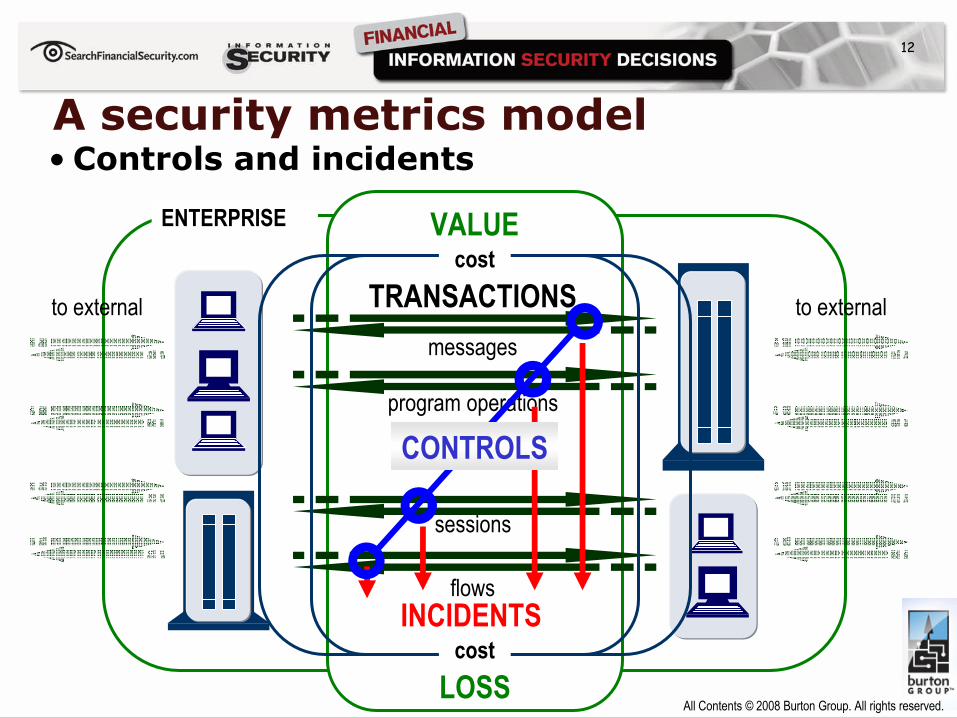
A security metrics model
TRANSACTIONSmessages
program operations
sessions
flows
to external
INCIDENTS
to external
CONTROLS
VALUE
LOSS
ENTERPRISEcost
cost
12
• Controls and incidents
All Contents © 2008 Burton Group. All rights reserved.
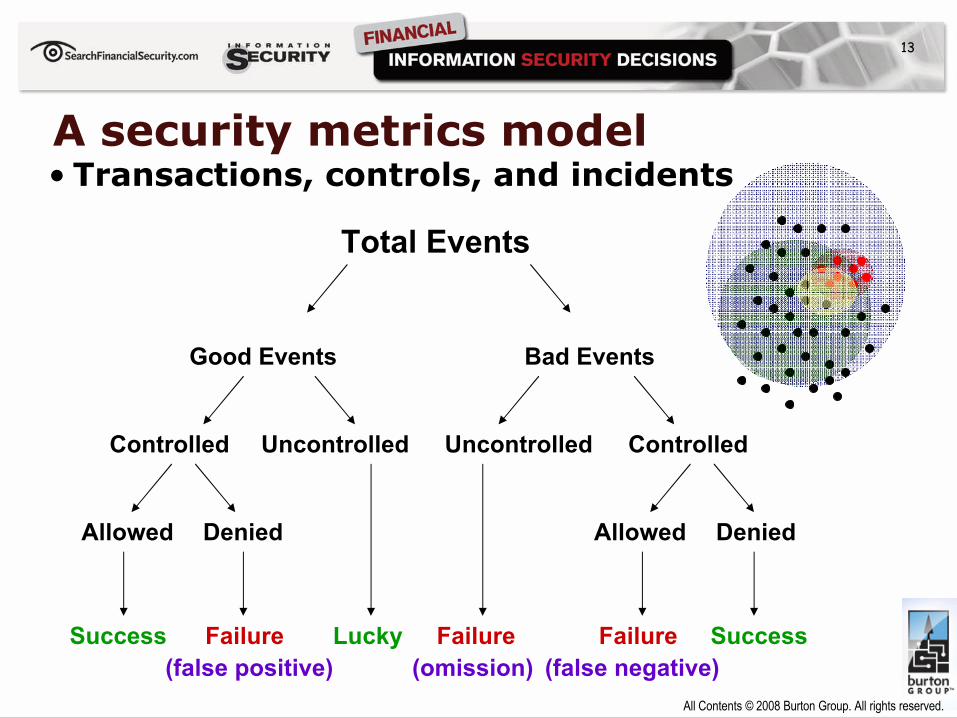
Good Events Bad Events
ControlledControlled UncontrolledUncontrolled
Allowed Denied Allowed Denied
Success SuccessFailureFailureLuckyFailure
Total Events
(false positive) (omission) (false negative)
A security metrics model• Transactions, controls, and incidents
13
All Contents © 2008 Burton Group. All rights reserved.
A security metrics model
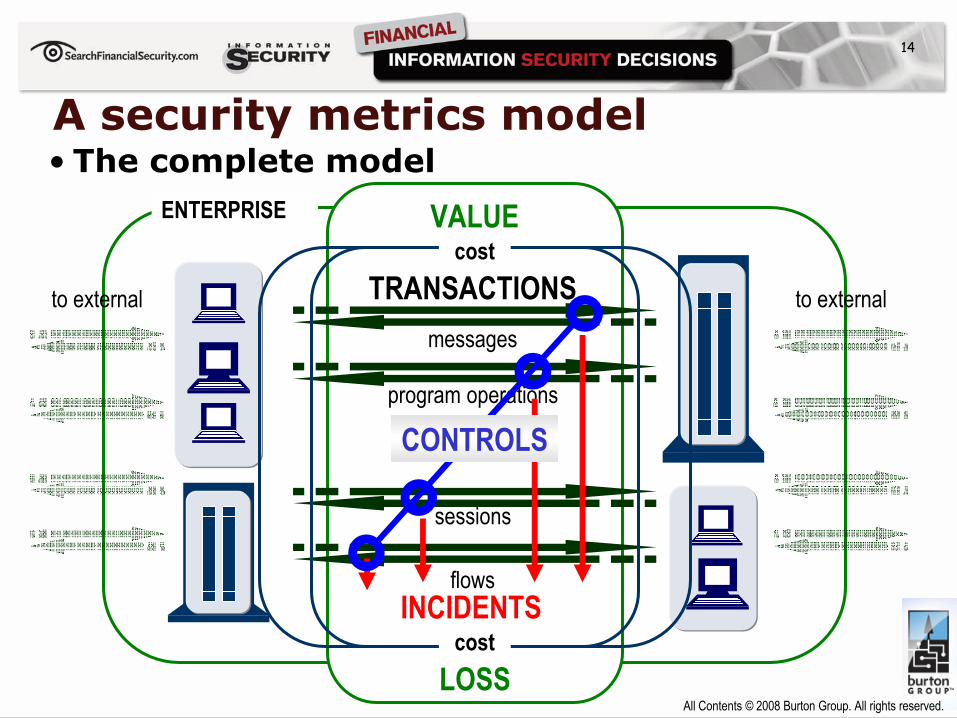
TRANSACTIONSmessages
program operations
sessions
flows
to external
INCIDENTS
to external
CONTROLS
VALUE
LOSS
ENTERPRISEcost
cost
14
• The complete model
All Contents © 2008 Burton Group. All rights reserved.
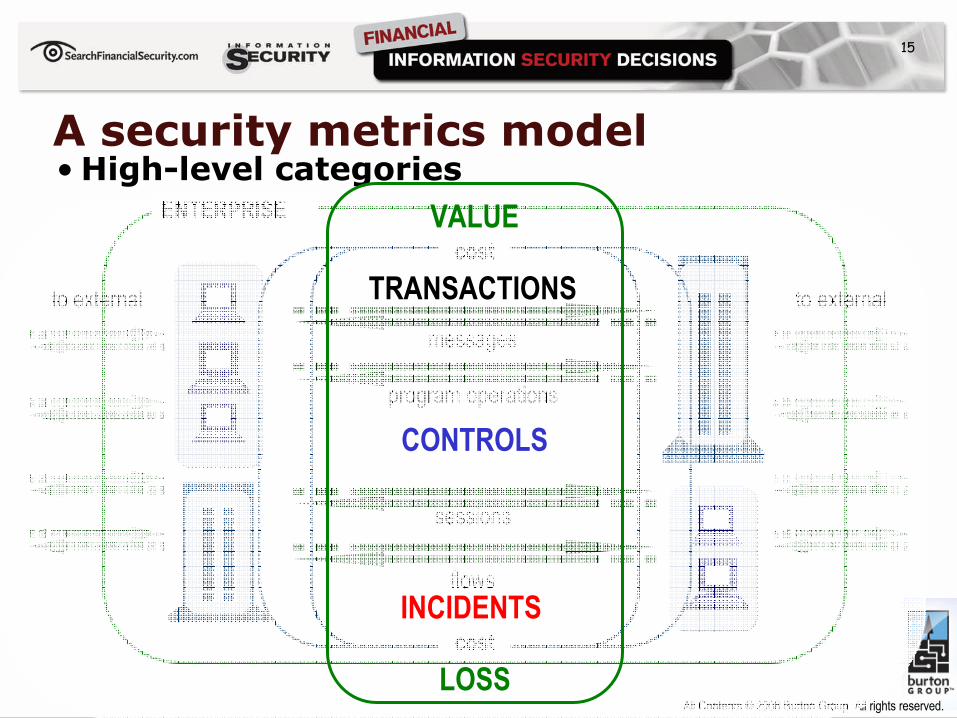
A security metrics model
to external to external
ENTERPRISE
15
• High-level categories
messages
program operations
sessions
flows
cost
cost
TRANSACTIONS
INCIDENTS
CONTROLS
VALUE
LOSS
All Contents © 2008 Burton Group. All rights reserved.
Top ten strategic metrics• Remember our goal…
Corporate Reports:
Money, ratios, index
Measures of broad matters as quality compare to that of
competitors; time required to launch new products
Measures that help to establish departmental quality goals and to evaluate departmental performance against goals.
Technological units of measure for individual elements of product, process,
service
16
All Contents © 2008 Burton Group. All rights reserved.
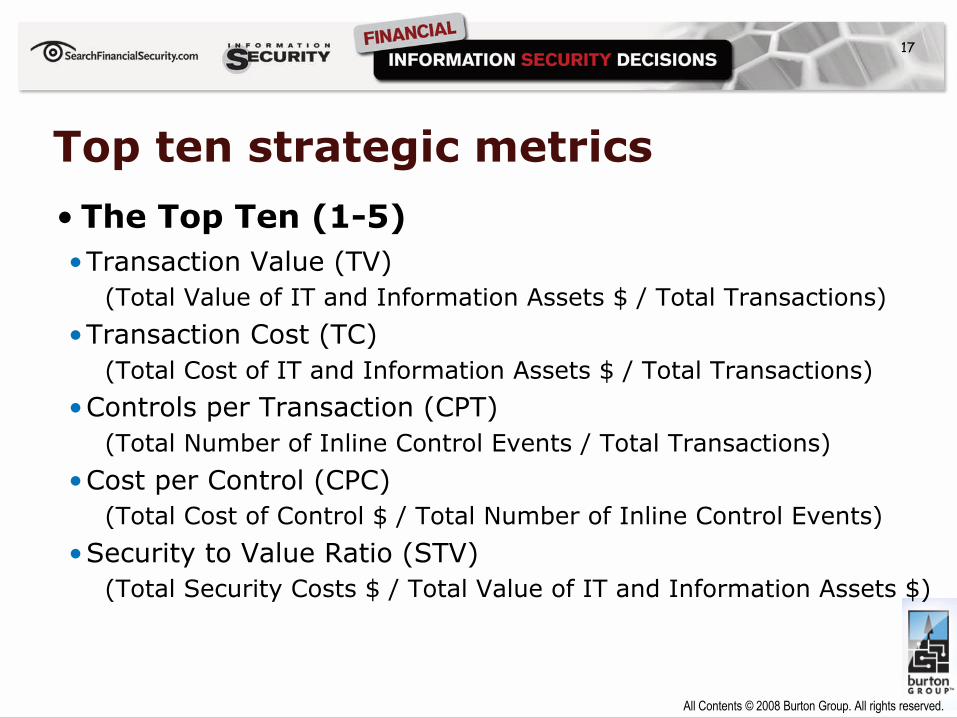
Top ten strategic metrics
• The Top Ten (1-5)•Transaction Value (TV)
(Total Value of IT and Information Assets $ / Total Transactions)
•Transaction Cost (TC)(Total Cost of IT and Information Assets $ / Total Transactions)
•Controls per Transaction (CPT)(Total Number of Inline Control Events / Total Transactions)
•Cost per Control (CPC)(Total Cost of Control $ / Total Number of Inline Control Events)
•Security to Value Ratio (STV)(Total Security Costs $ / Total Value of IT and Information Assets $)
17
All Contents © 2008 Burton Group. All rights reserved.
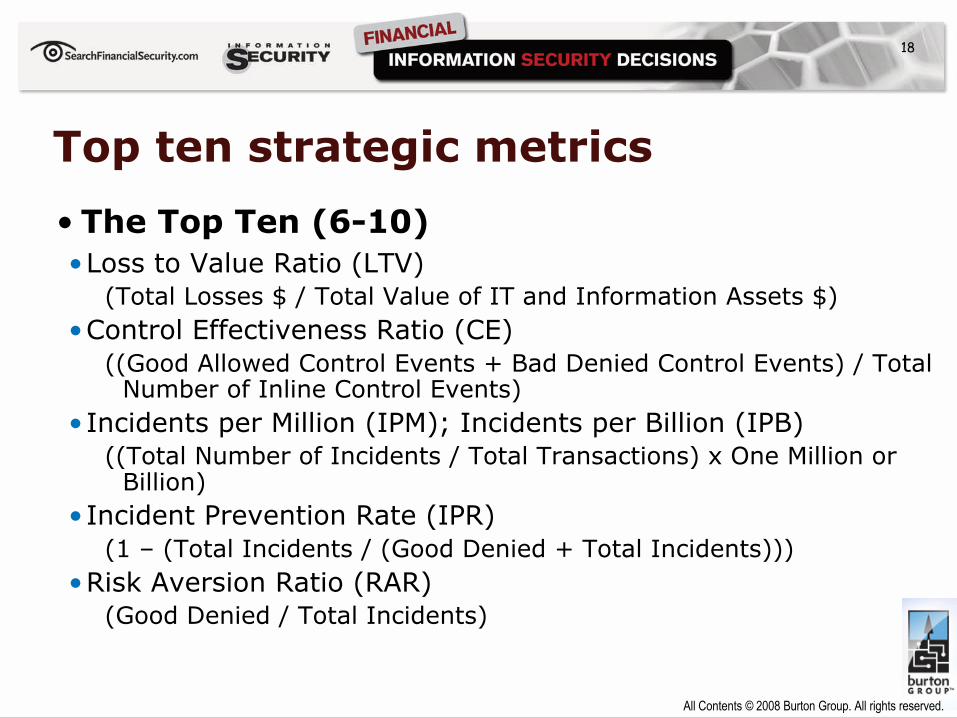
Top ten strategic metrics
• The Top Ten (6-10)•Loss to Value Ratio (LTV)
(Total Losses $ / Total Value of IT and Information Assets $)•Control Effectiveness Ratio (CE)
((Good Allowed Control Events + Bad Denied Control Events) / Total Number of Inline Control Events)
•Incidents per Million (IPM); Incidents per Billion (IPB)((Total Number of Incidents / Total Transactions) x One Million or
Billion)•Incident Prevention Rate (IPR)
(1 – (Total Incidents / (Good Denied + Total Incidents)))•Risk Aversion Ratio (RAR)
(Good Denied / Total Incidents)
18
All Contents © 2008 Burton Group. All rights reserved.
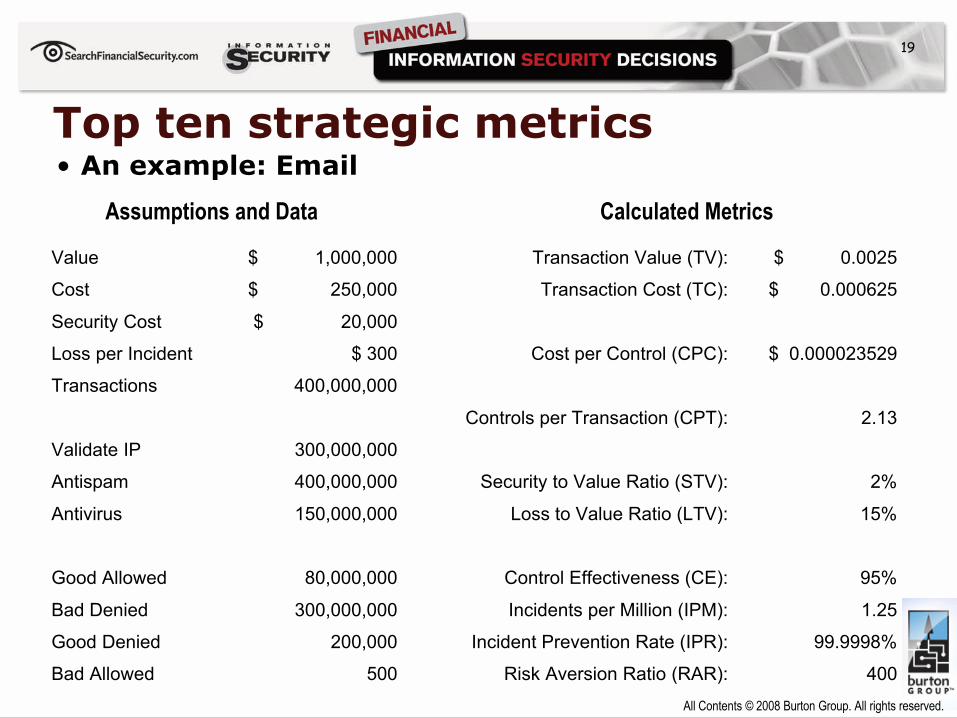
Top ten strategic metrics• An example: Email
400Risk Aversion Ratio (RAR):500Bad Allowed
99.9998%Incident Prevention Rate (IPR):200,000Good Denied
1.25 Incidents per Million (IPM):300,000,000Bad Denied
95%Control Effectiveness (CE):80,000,000Good Allowed
15%Loss to Value Ratio (LTV):150,000,000Antivirus
2%Security to Value Ratio (STV):400,000,000Antispam
300,000,000Validate IP
2.13 Controls per Transaction (CPT):
400,000,000 Transactions
$ 0.000023529 Cost per Control (CPC):$ 300 Loss per Incident
$ 20,000Security Cost
$ 0.000625 Transaction Cost (TC):$ 250,000 Cost
$ 0.0025 Transaction Value (TV):$ 1,000,000 Value
Assumptions and Data Calculated Metrics
19
All Contents © 2008 Burton Group. All rights reserved.
Top ten strategic metrics
-200,000,000400,000,000600,000,000800,000,000
1,000,000,0001,200,000,000
1 2 3 4 5 6
Good Allowed Bad Denied
-
2,000
4,000
6,000
8,000
1 2 3 4 5 6
Good Denied Bad Allow ed
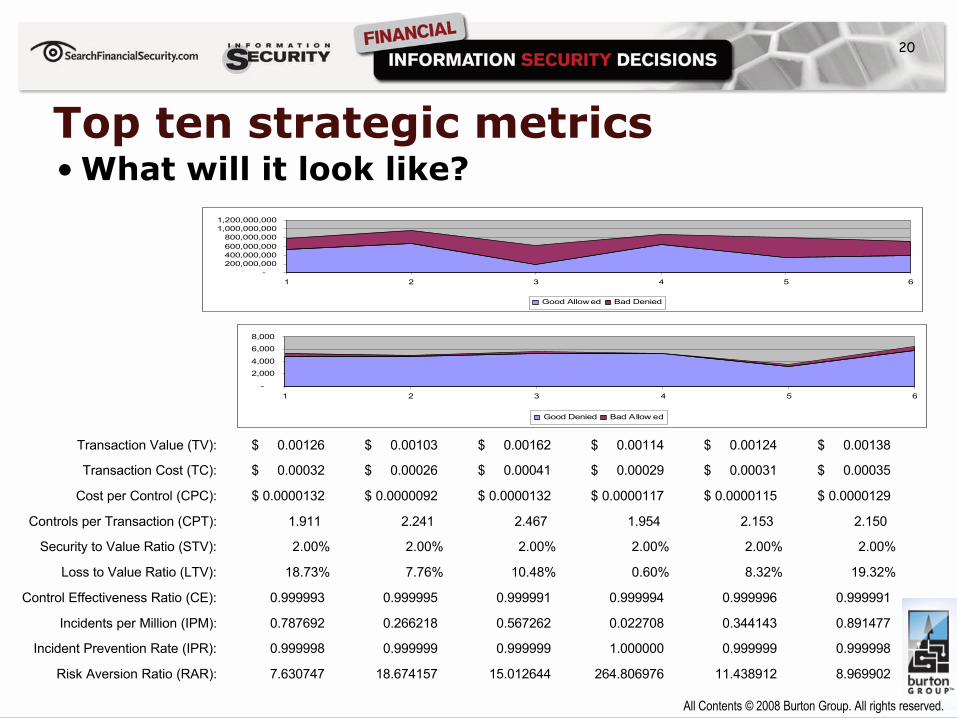
• What will it look like?
8.969902 11.438912 264.806976 15.012644 18.674157 7.630747 Risk Aversion Ratio (RAR):
0.999998 0.999999 1.000000 0.999999 0.999999 0.999998 Incident Prevention Rate (IPR):
0.891477 0.344143 0.022708 0.567262 0.266218 0.787692 Incidents per Million (IPM):
0.999991 0.999996 0.999994 0.999991 0.999995 0.999993 Control Effectiveness Ratio (CE):
19.32%8.32%0.60%10.48%7.76%18.73%Loss to Value Ratio (LTV):
2.00%2.00%2.00%2.00%2.00%2.00%Security to Value Ratio (STV):
2.150 2.153 1.954 2.467 2.241 1.911 Controls per Transaction (CPT):
$ 0.0000129 $ 0.0000115 $ 0.0000117 $ 0.0000132 $ 0.0000092 $ 0.0000132 Cost per Control (CPC):
$ 0.00035 $ 0.00031 $ 0.00029 $ 0.00041 $ 0.00026 $ 0.00032 Transaction Cost (TC):
$ 0.00138 $ 0.00124 $ 0.00114 $ 0.00162 $ 0.00103 $ 0.00126 Transaction Value (TV):
20
All Contents © 2008 Burton Group. All rights reserved.
Top ten strategic metrics
• Putting a plan into action•Identify logical starting points
• Where data is readily available• Closed or otherwise contained environments• Control-specific data
•Define the baseline• 3-6 months of data to evaluate variance• Average, weighted average, cycles, other trends
•Normalize the data•Incorporate other data
• From other controls, business units, geographic locations, etc.•Compare to peers
• Benchmark for same-size, same-industry peers
21
All Contents © 2008 Burton Group. All rights reserved.
Recommendations
• Moving forward…•Be consistent, but adapt•Understand first, act second•Think of data as inputs, not outputs•Manage expectations•Consider opportunities for benchmarking•Get started
22