Embed Size (px)
Citation preview
Ref: R4217-9.doc
YOUTH KNOWLEDGE OFYOUTH KNOWLEDGE OFYOUTH KNOWLEDGE OFYOUTH KNOWLEDGE OF
AND ATTITUDES TOAND ATTITUDES TOAND ATTITUDES TOAND ATTITUDES TO
MENTAL HEALTH ANDMENTAL HEALTH ANDMENTAL HEALTH ANDMENTAL HEALTH AND
MENTAL ILLNESSMENTAL ILLNESSMENTAL ILLNESSMENTAL ILLNESS
COMPARISON OF SURVEY DATA FROM
2004 AND 1997
R E S E A R C H R E P O R T F O R
February 2006
AuthorsAlice FearnKathryn GoodmanAllan Wyllie
CONTENTS
1. SUMMARY .......................................... .......................................................... 3
2. DISCUSSION AND CONCLUSIONS ....................... ........................................ 7
3. BACKGROUND ....................................... ...................................................... 9
4. INTRODUCTION.......................................................................................... 10
5. RESEARCH METHOD.................................. ................................................ 11
6. DETAILED FINDINGS................................ .................................................. 17
6.1 EXPERIENCE WITH MENTAL ILLNESS ................................................................. 17
6.2 DEFINING GOOD HEALTH .................................................................................... 20
6.3 DEFINING MENTAL ILLNESS ................................................................................ 23
6.4 PREVALENCE OF MENTAL ILLNESS .................................................................... 28
6.5 CAUSES AND RECOVERY .................................................................................... 30
6.6 CABABILITY AND SOCIAL ACCEPTANCE OF PEOPLE WITH MENTAL ILLNESS .. 38
6.7 ATTITUDES TO PEOPLE WITH MENTAL ILLNESS ................................................ 48
6.8 IMPACTS .............................................................................................................. 52
6.9 OPINIONS OF MENTAL HEALTH SERVICES AND KNOWLEDGE ABOUT MENTALILLNESS ...................................................................................................................... 53
3
1. SUMMARY
INTRODUCTION
• This report provides an overview of knowledge and attitudes to mental healthamong youth. It is based on analyses of data from the Like Minds NationalSurveys of public attitudes to mental illness in 2004 and 1997.
• The 1997 benchmark survey was conducted by BRC, before the Like Mindscampaign began. An update of the benchmark survey was conducted byPhoenix Research in 2004. This 2004 survey also included new questions,based in part on qualitative research that preceded the survey.
RESEARCH METHOD
• In 2004, a sample of 1008 persons aged 15 to 44 years was randomly selectedfrom throughout New Zealand. Of these, 191 were youth, i.e. 19% of the totalsample (17% of the population, weighted by age). In 1997, the total samplesize was 1733, of which 231 were youth, i.e. 13% of the total sample.
• Both surveys were designed to over-sample Maori. A total of 252 Maoriinterviews were completed in 2004, of which 52 interviews were with Maoriyouth (27% of the total youth sample). In the 1997 survey 473 Maori wereincluded, of whom 82 were Maori youth (35% of the total youth sample).
• There was over-sampling of Pacific peoples in the 2004 survey, but not the1997 survey. A total of 190 interviews were completed in 2004, of which 46were with Pacific youth (24% of the total youth sample).
• In 2004, the data was weighted by ethnicity, gender and age, to accuratelyreflect the New Zealand population aged 15 to 44 years as at the 2001Census. Percentages reported for youth are also based on these weighteddatasets.
• The 2004 interviews were completed using CATI (computer assisted telephoneinterviewing), which allows a high level of quality control. The interviews wereof 20 minutes average duration and were undertaken between August 25 andOctober 24, 2004. The weighted response rate was 81 percent.
• There are some differences between the methods used for the 1997 and 2004surveys. Most significantly, the low response rate achieved in the 1997 survey(19% weighted) impacts the comparability of the data. Also, the 1997 data wasnot weighted by age despite the sample having an over-representation of olderpeople.
4
EXPERIENCE WITH MENTAL ILLNESS
• Compared with 1997, more youth reported providing support or service topeople with experience of mental illness, although this was still less than in thewider 15 to 44 year target group
• Youth were more likely than the wider target group to incorrectly includeintellectual disability and other conditions within their definition of mentalillness
• Youth were less likely than all 15 to 44 year olds to report knowing someonewith a (correctly defined) mental illness
DEFINING GOOD HEALTH AND MENTAL ILLNESS
• Youth were also less likely than the wider target group to mention mentalhealth issues as contributors to good health, particularly Pacific youth
• When asked their immediate thoughts on hearing the term 'mental illness', themost common youth response was to name specific mental illnesses, but thelevel of correctly named illnesses was lower than for the wider target group.Maori youth were particularly likely to say don't know/nothing
• Consistent with Pacific peoples in the wider target audience, Pacific youthwere less likely than other youth to mention specific mental illnesses
• Youth showed marked increases in awareness of depression and bi-polardisorder, which was consistent with changes in the wider target group
• Youth had much lower awareness of all the main mental illnesses than did thewider target group
PREVALENCE OF MENTAL ILLNESS
• As with the wider target group, youth in 2004 were more likely to reportdepression as being less prevalent in the population than they did in 1997.However, unlike the wider target group, youth also reported a reducedprevalence of bi-polar disorder
CAUSES AND RECOVERY
• For all four illnesses asked about, except depression, youth were less likely tobe able to give a cause than were the wider target group
• There was little change since 1997 in the reasons youth gave for anxietydisorders, the most frequently mentioned ones being too much stress, theresult of a major shock and a childhood experience such as abuse.
• As with the wider target group of all 15 to 44 year olds, there were a numberof decreases in reasons given for bi-polar disorder
• The most frequently identified reasons for depression described by youth in2004 were as a result of a major shock and having a negative perception ofyourself. Youth differed from the wider age group in making less mention of jobstress and money problems. There were fewer youth in 2004 who mentioneddrug or alcohol abuse as a cause of depression compared to 1997
5
• Compared with 1997, fewer youth in 2004 believed schizophrenia is inherited,or a result of childhood experiences such as abuse
• The majority of youth, as with the wider age group, thought those with mentalillness can stay well most of the time
• The two things youth most frequently mentioned that can help a personbecome well again (for all four mental illnesses) were support of friends andfamily support. Medication was not mentioned as frequently by youth as in thewider target group
• There were no significant differences between the results for youth in 2004and in 1997 for both anxiety disorders and bi-polar disorder. There were someincreased mentions of support for people with schizophrenia (family/whanausupport, going to doctor and support groups) and more youth in 2004 believedpsychotherapy can help a person with depression and less so hobbies
CAPABILITY AND SOCIAL ACCEPTANCE OF PEOPLE WITH
MENTAL ILLNESS
• There was an improvement since 1997 in youth attitudes regarding thecapability of people with mental illness, particularly towards people with bi-polar disorder and depression. However, the number of changes was not asgreat as in the wider target group.
• As with the wider target group, youth showed the least change in relation toanxiety disorders
• The levels of youth agreement/disagreement on these capability attitudestatements were generally similar to those for the wider target group
• There have been some improvements among youth in willingness to acceptpeople with mental illness in different social settings. The number ofimprovements was similar to that for the total sample, except for youthshowing much less improvement than the total sample for accepting peoplewith depression
• For all four illnesses asked about, a similar sized large proportion believedthat the impact of the illness varied from small to large for different people
ATTITUDES TO PEOPLE WITH MENTAL ILLNESS
• Youth showed improvements on four of seven attitude statements, which wasbetter than for the wider target group, in part reflecting poorer youth attitudesin 1997. They were significantly more likely to:
� Disagree that it is best to avoid someone who has a mental illness (93% cf.83% in 1997)
� Disagree that those with mental illness should not be given anyresponsibility (90% cf. 83% in 1997)
� Agree that their attitude can make a real difference to the way people withmental illness feel about themselves (91% cf. 84% in 1997)
� (and significantly less likely to) Agree that people with mental illness wouldalways be unpredictable in their behaviour (29% cf. 44% in 1997)
6
• However, despite the improvements, youth still had less sympathetic attitudestowards those with mental illness than did the wider age group
• As with the wider group, youth felt someone without a mental illness posed atleast as much threat of danger, and possibly more, than did someone with amental illness
• Youth were more likely than others to estimate that high proportions of violentcrimes are committed by people with experience of mental illness
IMPACTS
• The proportion of youth who had made a positive change in the way they actor feel towards people with mental illness was similar to that for the widertarget group
GENERAL KNOWLEDGE OF MENTAL ILLNESS AND MENTAL
HEALTH SERVICES
• In 2004, youth generally had higher opinions of the mental health servicesthan the total sample and these had generally improved somewhat since 1997
• Youth felt more informed in 2004 than they did in 1997. Although the youthincrease was greater than for the wider target group, youth were stillsignificantly less well informed than this group
• Education (including tertiary) was the most commonly cited source of youthknowledge on mental illness, followed by advertising (Like Minds), which wasat a similar level to the wider target group
• Youth reported a high level of trust in their main source of knowledge, apattern that was also evident among the wider age group
• As with the wider target group, youth reported high levels of interest in sixdifferent forms of information for which they were asked to respond
7
2. DISCUSSION AND CONCLUSIONS
DISCUSSION
POSITIVE IMPROVEMENTS FOR YOUTH
As with the wider target group, this report shows that there have been a numberof positive improvements in youth behaviour and attitudes towards people withexperience of mental illness since the Like Minds campaign began. In terms ofbehaviour this is reflected in increased proportions reporting providing support orservice to people with experience of mental illness and reporting positivechanges in the way they act or feel towards people with experience of mentalillness. In terms of attitudes there have been improvements in youth perceptionsof the capabilities of people with experience of mental illness and in youthwillingness to accept people with experience of mental illness in different socialsettings. There were also improvements in more general statements relating toattitudes towards people with experience of mental illness.
YOUTH STILL LESS WELL INFORMED BUT KEEN TO KNOW MORE
It is positive that youth have made some gains in terms of feeling informed aboutmental illness, their gains being at a greater rate than for the wider target group.However, there is still quite a gap. This is reflected in things like a higher level ofinclusion of people with intellectual disability within youth definitions of mentalillness. Youth feeling less informed may in part reflect youth having had feweryears in which to encounter mental illness among people they know. Youthappear to be open to receiving more information about mental illness, asreflected in their very positive response to the different forms of informationasked about.
SEEMINGLY MIXED PATTERNS IN COMPARING YOUTH ATTITUDES WITH
WIDER TARGET GROUP
On some types of attitude measures youth were similar to the wider target group.This was the case for the perceived capability of people with experience ofmental illness and, with the exception of depression, willingness to accept peoplewith experience of mental illness in a range of social situations. However on thebattery of attitudes towards people with mental illness, youth had less positiveattitudes on several items. The largest difference was for the statement: "Thereis something about people with a mental illness that makes it easy to tell themfrom other people". This suggests that the greater youth confusion with peoplewho have intellectual disabilities may be contributing to this difference inattitudes. It may also be contributing to a difference in attitude on the statement:"People with mental illness are always unpredictable in their behaviour". Theattitudes may also reflect the lack of exposure youth have probably had to peoplewith mental illness, as reflected in less disagreement with attitudes such as:"Anyone can become mentally ill"; "As soon as a person shows signs of beingmentally unwell I think they should be hospitalised"; "I don't know how to actaround people with mental illness".
Youth were also more likely to attribute high proportions of violent crimes to
8
people with experience of mental illness, which again seems to point to youthlacking knowledge about mental illness and related issues.
The earlier qualitative research identified that depression is the mental illnessthat is most prominent in young people's thinking and therefore the responses tothe general attitude statements are likely to be influenced strongly by perceptionsrelating to depression. This would in part explain why youth were more likely toagree that: "People with mental illness need to just stop feeling sorry forthemselves", as they would be thinking primarily of depression.
Therefore there is actually more consistency in the youth responses thanoriginally appeared to be the case, as people with depression were the group withwhich youth tended to show less willingness to interact socially (than did thewider age group). There was however no difference for depression on thecapability items, which suggests they may have been answered more rationallyand be based less on people's feelings about people with mental illness.
The qualitative research also found that inconsistency in responses is moreprevalent within groups who are less well informed about mental illness, as is thecase with youth. In the qualitative study youth often appeared quite open in theirattitudes once they had time to discuss and think about mental illness. But in asurvey context we are getting spontaneous, unconsidered responses.
CHANGING PERCEPTIONS OF DEPRESSION
Youth, as with the wider target group, reported depression as being lessprevalent in 2004 than 1997. Given both groups also reported increasedawareness of depression, the decreased perceptions of prevalence may reflectan improved understanding that depression as a mental illness is different from"feeling depressed" (which most people experience). If youth are now seeing itas a more serious illness, then this would be consistent with the lower levels ofimprovement reported in willingness to accept someone with depression in socialsettings (than was evident for other mental illnesses).
CONCLUSIONS
The findings of lower knowledge and less positive attitudes for youth (comparedwith the wider target group) raises questions as to how much focus should be onthis age group within the Like Minds campaign. This is a bigger question thancan be addressed simply on the basis of these research findings. It needs totake into account issues such as what opportunities there are to impact on thisage group and how effective such strategies are likely to be, relative to strategiesdesigned to reach the wider target group or other parts of it.
9
3. BACKGROUND
This study is part of a programme of research that will inform future directions forthe Like Minds Like Mine project to counter stigma and discrimination associatedwith mental illness under the Ministry of Health.
In 1997, prior to the Like Minds Like Mine programme, a benchmark survey wasconducted by BRC to establish public knowledge of and attitudes toward mentalhealth and mental illness. Since that time Phoenix Research has developed theLike Minds Tracking Surveys, which monitor changes in awareness and attitudesin association with the national media advertising. This has identified generalimprovement in attitudes following each media campaign.
Given the project has been running for seven years, the Ministry decided toundertake a repeat of the 1997 study to ascertain what had changed in the widerrange of measures that this study included that were not in the tracking surveys.This update survey was preceded by a major qualitative study undertaken byPhoenix Research, which examined current public attitudes and perceptions and,where possible, changes over the seven year period. Issues identified in thatstudy were included in the national update survey. To allow the new questions tobe added, some of the 1997 questions were not included in the 2004 survey.
The results of the updated study were published in February 2005, in a PhoenixResearch report entitled Public Knowledge of and Attitudes to Mental Health andMental Illness, and compared public attitudes in 1997 and 2004.
This current report compares the knowledge and attitudes of youth (15 to 19 yearolds), as measured in the 1997 and 2004 national surveys. It also integratesrelevant findings from the qualitative research.
10
4. INTRODUCTION
This report provides an overview of knowledge and attitudes to mental healthamong youth in 1997 and 2004, and also compares the attitudes of youth withthose of the general public.
It is based on analyses of data from the surveys of Public Attitudes To MentalIllness in 2004 and 1997, as well as qualitative research with (youth) members ofthe public (Like Minds Like Mine Qualitative Research) completed by PhoenixResearch in 2004.
This report was commissioned by the Ministry of Health to inform the youthtargeted aspects of the Like Minds Like Mine campaign.
OBJECTIVES
• To track changes in youth attitudes, behaviours, thoughts and feelings aroundthe topic of mental illness from 1997 to 2004.
• To compare youth with the general population in 2004.
• To integrate these findings with those from qualitative research, in particularresearch with youth, completed earlier in 2004
11
5. RESEARCH METHOD
SAMPLE SELECTION AND SAMPLE SIZE - GENERAL POPULATION
The following section describes how data from the 2004 survey was collected. Aswith the 1997 survey, all respondents were aged 15 to 44 years, the target groupfor the campaign.
A general population sample was generated using randomly selected phonenumbers, stratified by region. To obtain the correct proportions of males andfemales in each region, some interviews targeted males only. This generalpopulation sample consisted of 663 people, of whom 82 were Maori and 15 werePacific peoples. The proportion of Maori was 12 percent (compared with 14percent for this age group in the 2001 Census). The proportion of Pacific peopleswas 2 percent (compared with 6 percent in the Census).
A separate Maori sample was also generated using phone numbers matched toMaori names randomly selected from the electoral rolls. It was also stratified byregion, with similar numbers interviews with males and females conducted ineach region. This generated 170 interviews, which combined with the Maori in thegeneral population sample, gave a final Maori sample of 252 (increased to 25percent of sample).
A separate Pacific peoples sample was based on randomly selected Pacificpeoples names from phone directories in Auckland and Wellington (these tworegions account for 83 percent of the Pacific Peoples population in New Zealand).A total of 175 Pacific peoples interviews were conducted using this method,which gave a final Pacific sample of 190 when combined with the 15 from thegeneral population sample (increased to 19 percent of sample).
The three surveys had a combined sample size of 1,008.
SAMPLE SIZE - YOUTH
Of the 1008 interviews in 2004, 191 were youth, i.e. 19% of the total sample (17%of the population, weighted by age). In 1997, the total sample size was 1733, ofwhich 231 were youth, i.e. 13% of the total sample.
Of the 252 Maori interviews completed in 2004, 52 were with Maori youth (27% ofthe total youth sample). In the 1997 survey 473 Maori were included, of whom 82were Maori youth (35% of the total youth sample).
There was over-sampling of Pacific peoples in the 2004 survey, but not the 1997survey. A total of 190 Pacific interviews were completed in 2004, of which 46were with Pacific youth (24% of the total youth sample).
As with the 2004 general population data, the youth percentages reported arebased on data that has been weighted by ethnicity, gender and age, to accuratelyreflect the New Zealand population at the 2001 Census.
12
METHOD OF DATA COLLECTION
The 2004 surveys were undertaken using a CATI system (computer assistedtelephone interviewing) by trained PHOENIX interviewers. The interviews were of20 minutes average duration and were undertaken between August 25 andOctober 24, 2004. All the interviewing in the separate Maori sample wasundertaken by Maori interviewers. All had some knowledge of Te Reo, althoughthe questions were only asked in English. The additional Pacific peoplesinterviews were undertaken by Pacific peoples interviewers. In the generalsample everyone was told that if they were a Maori or Pacific person they couldbe interviewed by a Maori or Pacific interviewer if they wished.
RESPONSE RATE
Phoenix Research made considerable efforts were made to maximise theresponse rate. This included making at least 15 calls to each number andsometimes more than this if necessary to make contact with a household orqualifying respondent. In keeping with Ministry of Health procedures, a weightedresponse rate was calculated, which takes into account that some of the refusalswould have been non-qualifying households. The weighted response rate in thegeneral survey was 80 percent, in the Maori survey it was 87 percent and in thePacific peoples survey it was 80 percent, averaging 81 percent overall.
QUALITY CONTROL
The advantage of the CATI system is that any call can be monitored at any time,as they are all conducted from one centralised contact centre. Phoenix Researchalso operate a 'call catcher' which records all calls and allows them to be listenedto at a later date if required. The Phoenix contact centre is IQS accredited, whichis the industry quality standard.
DIFFERENCES IN RESEARCH METHODS IN 1997 AND 2004
The 2004 response rates was 81 percent; however we have calculated the BRC1997 weighted response rate to be only 19 percent, raising questions about howadequately the findings represented the target population in 1997.
Adding unlisted telephone numbers (including businesses and 'no such number'lines) to the sample may affect response rates. These were used in 1997 but not2004, due to cost and respect for the privacy of unlisted numbers.
In 1997, data was recorded on questionnaires and later entered, a method whichmay allow errors in interviewing or data entry (although there were high levels ofchecking. Use of CATI in 2004 reduces the potential for such errors.
Some Maori interviews in 1997 were not undertaken by Maori interviewers.
While the 2004 study over-sampled Pacific peoples to get a larger data base foranalysis, the general population analyses are still comparable between the two
13
surveys, as both were weighted to reflect the correct ethnic proportions in thepopulation aged 15 to 44 at the census nearest the survey.
The 1997 survey did not weight for age, which leaves it vulnerable to age biasesin the sample.
COMPARISON OF 2004 AND 1997 SAMPLE COMPOSITION
The low response rate in 1997 raises concerns about how well the 1997 datarepresents the population at the time. The following compares the samplecomposition for the two surveys, using weighted data. Both surveys wereweighted by gender and ethnicity, but the 2004 survey was also weighted by age.
The key differences were:
• The 1997 survey had a lower proportion of people aged 15 to 24 years andmore aged 35 to 44.
• The 1997 survey had fewer full time wage and salary earners and more peoplewith children aged up to 12 years (probably a product of the response rate, asthese types of people are more likely to be home when interviewers ring.)
• In the 2004 Maori sample more participants were supervisors or managersthan in 1997; however this may reflect a real change over the seven years.
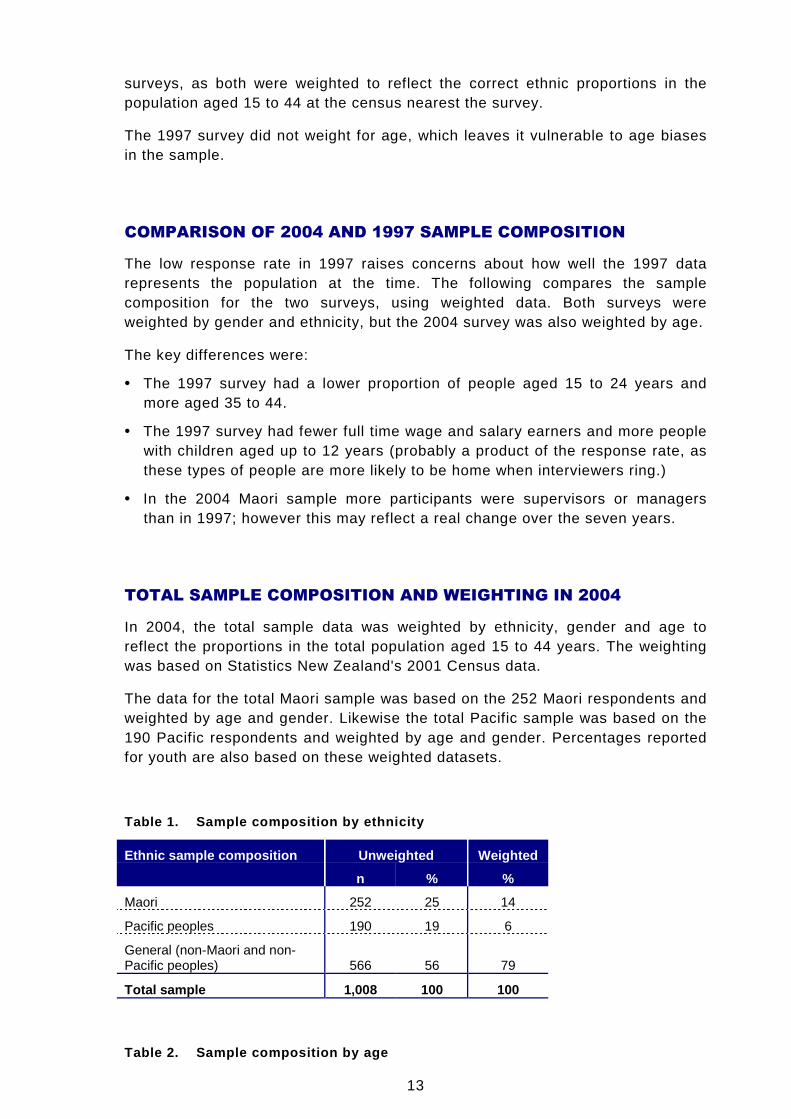
TOTAL SAMPLE COMPOSITION AND WEIGHTING IN 2004
In 2004, the total sample data was weighted by ethnicity, gender and age toreflect the proportions in the total population aged 15 to 44 years. The weightingwas based on Statistics New Zealand's 2001 Census data.
The data for the total Maori sample was based on the 252 Maori respondents andweighted by age and gender. Likewise the total Pacific sample was based on the190 Pacific respondents and weighted by age and gender. Percentages reportedfor youth are also based on these weighted datasets.
Table 1. Sample composition by ethnicity
Ethnic sample composition Unweighted Weighted
n % %
Maori 252 25 14
Pacific peoples 190 19 6
General (non-Maori and non-Pacific peoples) 566 56 79
Total sample 1,008 100 100
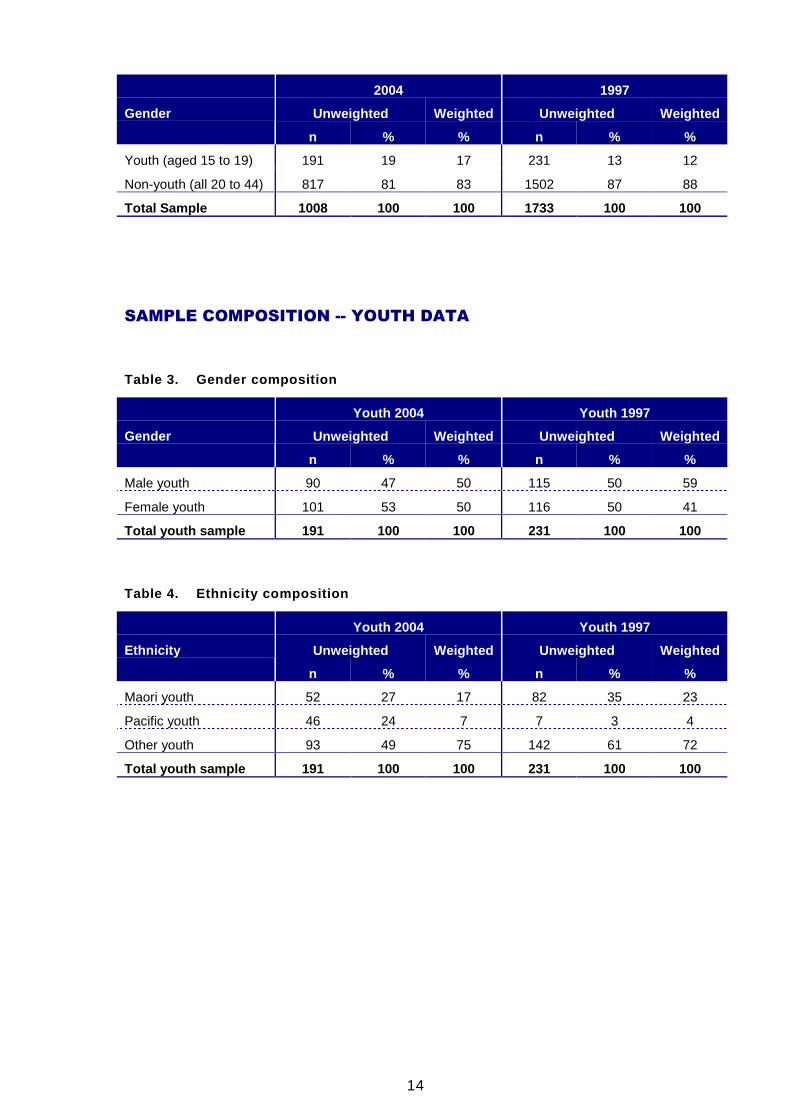
Table 2. Sample composition by age
14
2004 1997
Unweighted Weighted Unweighted WeightedGender
n % % n % %
Youth (aged 15 to 19) 191 19 17 231 13 12
Non-youth (all 20 to 44) 817 81 83 1502 87 88
Total Sample 1008 100 100 1733 100 100
SAMPLE COMPOSITION -- YOUTH DATA
Table 3. Gender composition
Youth 2004 Youth 1997
Unweighted Weighted Unweighted WeightedGender
n % % n % %
Male youth 90 47 50 115 50 59
Female youth 101 53 50 116 50 41
Total youth sample 191 100 100 231 100 100
Table 4. Ethnicity composition
Youth 2004 Youth 1997
Unweighted Weighted Unweighted WeightedEthnicity
n % % n % %
Maori youth 52 27 17 82 35 23
Pacific youth 46 24 7 7 3 4
Other youth 93 49 75 142 61 72
Total youth sample 191 100 100 231 100 100
15
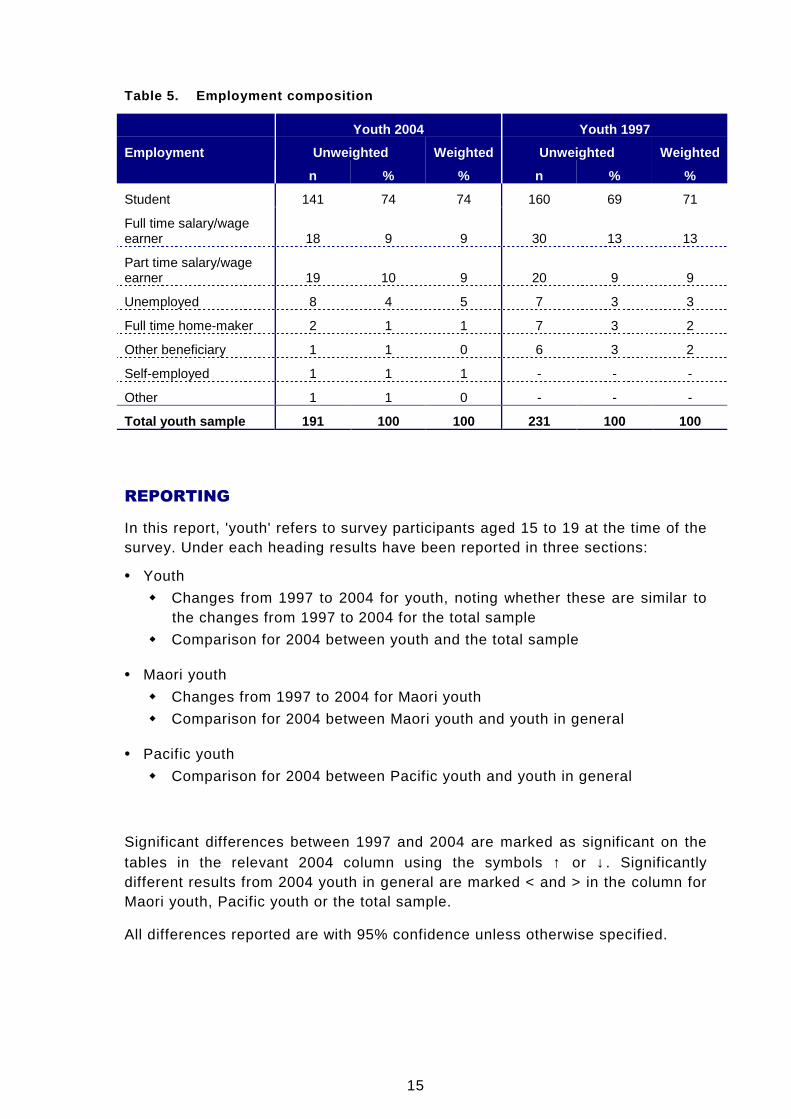
Table 5. Employment composition
Youth 2004 Youth 1997
Unweighted Weighted Unweighted WeightedEmployment
n % % n % %
Student 141 74 74 160 69 71
Full time salary/wageearner 18 9 9 30 13 13
Part time salary/wageearner 19 10 9 20 9 9
Unemployed 8 4 5 7 3 3
Full time home-maker 2 1 1 7 3 2
Other beneficiary 1 1 0 6 3 2
Self-employed 1 1 1 - - -
Other 1 1 0 - - -
Total youth sample 191 100 100 231 100 100
REPORTING
In this report, 'youth' refers to survey participants aged 15 to 19 at the time of thesurvey. Under each heading results have been reported in three sections:
• Youth
� Changes from 1997 to 2004 for youth, noting whether these are similar tothe changes from 1997 to 2004 for the total sample
� Comparison for 2004 between youth and the total sample
• Maori youth
� Changes from 1997 to 2004 for Maori youth
� Comparison for 2004 between Maori youth and youth in general
• Pacific youth
� Comparison for 2004 between Pacific youth and youth in general
Significant differences between 1997 and 2004 are marked as significant on thetables in the relevant 2004 column using the symbols ↑ or ↓. Significantlydifferent results from 2004 youth in general are marked < and > in the column forMaori youth, Pacific youth or the total sample.
All differences reported are with 95% confidence unless otherwise specified.
16
NOTES REGARDING COMPARISON OF 2004 AND 1997 DATA
The 1997 survey asked a set of questions relating only to one of four illnesses,anxiety disorders, bi-polar disorder/manic depression, depression andschizophrenia. Respondents were randomly assigned one of the illnesses,provided they had demonstrated previous awareness of it. If they were then ableto describe characteristics of it to a satisfactory level they were asked the set ofquestions. The 2004 survey did not require respondents to describe the illnessthey had already indicated awareness of.
The 1997 results, as reported by BRC at the time, included in their baserespondents who could not adequately describe the illness, even though theywere not asked following questions with respect to the illness. The percentagesfor each mental illness were: 9 percent for anxiety disorder, 13 percent for bi-polar, 3 percent for depression and 8 percent for schizophrenia. Therefore wherea question within this set has structured responses, the 1997 results have beenreproduced without this group of respondents, so that it is more directlycomparable with the 2004 results. Where a question was open-ended this groupof respondents has been combined with 'don't know' in the 1997 results. This isbecause there were high levels of don't knows on the 2004 survey for theseopen-ended questions, reflecting that there were a group who knew little aboutthe illness they were answering for, many of whom would have been in the groupwho did not answer the question in 1997. By including those in the 1997 resultswho did not know anything about the illness the data becomes more directlycomparable.
These differences in question design mean that for the sections of the reportbased on the specific mental illnesses, the comparisons between 1997 and 2004need to be made with some caution. However, there is a high degree ofconsistency between the two sets of data, as reported, so there are reasonablegrounds for believing that larger significant changes are reflecting real change.
Note: For the sections of the report that refer to questions asked with a specificillness in mind, mention of bi-polar disorder in the text and tables includes manicdepression.
17
6. DETAILED FINDINGS
6.1 EXPERIENCE WITH MENTAL ILLNESS
Respondents were asked what, if any, personal experience they had with mentalillness, in part to understand the influence it might have on perceptions, attitudesand behaviours.
PERSONAL INVOLVEMENT WITH PEOPLE WITH MENTAL ILLNESS
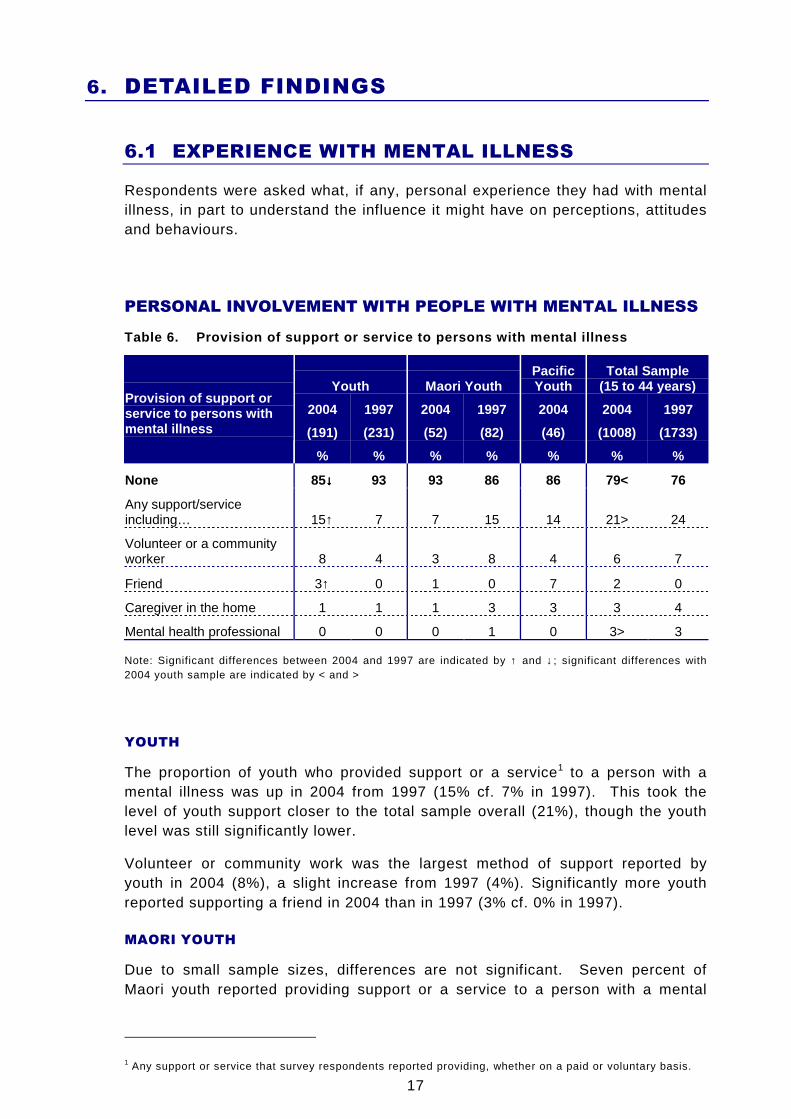
Table 6. Provision of support or service to persons with mental illness
Youth Maori YouthPacificYouth
Total Sample(15 to 44 years)
2004 1997 2004 1997 2004 2004 1997
(191) (231) (52) (82) (46) (1008) (1733)
Provision of support orservice to persons withmental illness
% % % % % % %
None 85↓↓↓↓ 93 93 86 86 79< 76
Any support/serviceincluding… 15↑ 7 7 15 14 21> 24
Volunteer or a communityworker 8 4 3 8 4 6 7
Friend 3↑ 0 1 0 7 2 0
Caregiver in the home 1 1 1 3 3 3 4
Mental health professional 0 0 0 1 0 3> 3
Note: Significant differences between 2004 and 1997 are indicated by ↑ and ↓; significant differences with2004 youth sample are indicated by < and >
YOUTH
The proportion of youth who provided support or a service1 to a person with amental illness was up in 2004 from 1997 (15% cf. 7% in 1997). This took thelevel of youth support closer to the total sample overall (21%), though the youthlevel was still significantly lower.
Volunteer or community work was the largest method of support reported byyouth in 2004 (8%), a slight increase from 1997 (4%). Significantly more youthreported supporting a friend in 2004 than in 1997 (3% cf. 0% in 1997).
MAORI YOUTH
Due to small sample sizes, differences are not significant. Seven percent ofMaori youth reported providing support or a service to a person with a mental
1 Any support or service that survey respondents reported providing, whether on a paid or voluntary basis.
18
illness in 2004 (compared with 15% among all youth). There were indications of adecrease in this involvement among Maori youth (from 15% in 1997).
PACIFIC YOUTH
Due to small sample sizes, differences are not significant. Fourteen percent ofPacific youth said they provided support or a service to a person with a mentalillness. This was similar to the total sample (15%).
KNOWLEDGE OF PEOPLE WITH MENTAL ILLNESS
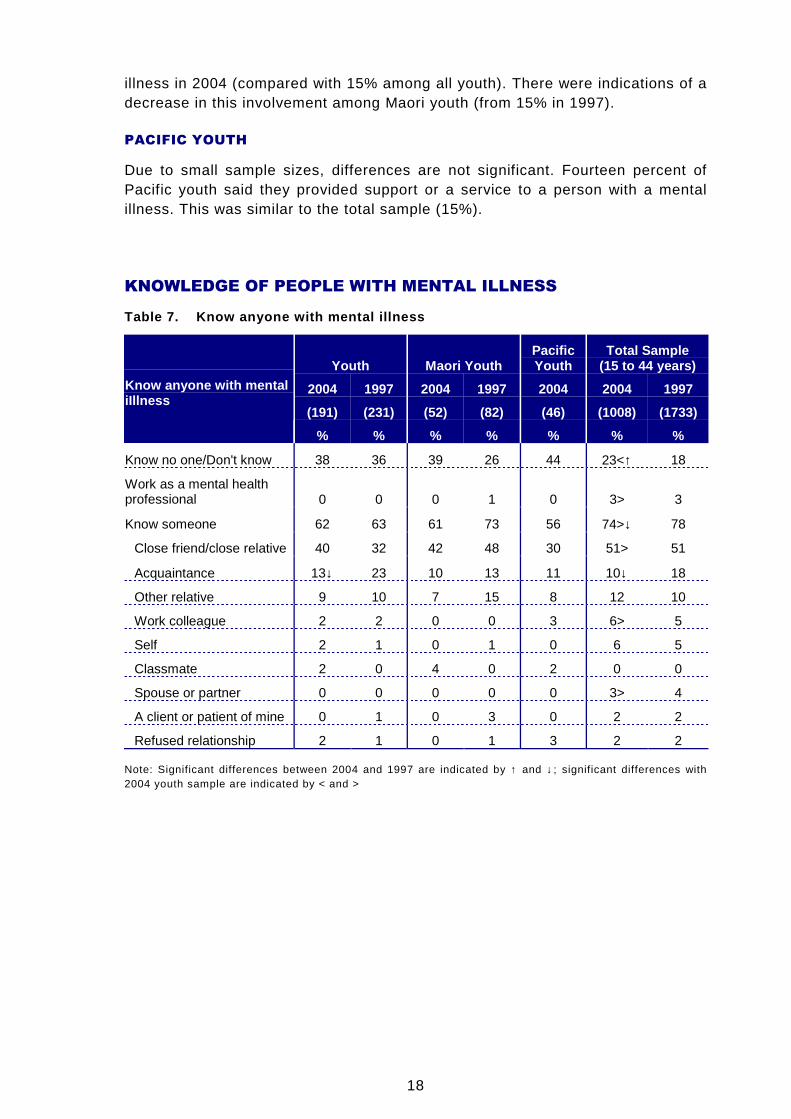
Table 7. Know anyone with mental illness
Youth Maori YouthPacificYouth
Total Sample(15 to 44 years)
2004 1997 2004 1997 2004 2004 1997
(191) (231) (52) (82) (46) (1008) (1733)
Know anyone with mentaliIllness
% % % % % % %
Know no one/Don't know 38 36 39 26 44 23<↑ 18
Work as a mental healthprofessional 0 0 0 1 0 3> 3
Know someone 62 63 61 73 56 74>↓ 78
Close friend/close relative 40 32 42 48 30 51> 51
Acquaintance 13↓ 23 10 13 11 10↓ 18
Other relative 9 10 7 15 8 12 10
Work colleague 2 2 0 0 3 6> 5
Self 2 1 0 1 0 6 5
Classmate 2 0 4 0 2 0 0
Spouse or partner 0 0 0 0 0 3> 4
A client or patient of mine 0 1 0 3 0 2 2
Refused relationship 2 1 0 1 3 2 2
Note: Significant differences between 2004 and 1997 are indicated by ↑ and ↓; significant differences with2004 youth sample are indicated by < and >
19
YOUTH
In 2004, two thirds of youth said they knew someone who had (or has had) amental illness (62%). When asked to name the mental illness, some reportedillnesses that were not actually mental illnesses. When these were removed, 36%of youth knew someone who has, or has had a mental illness2. This confirms thequalitative research findings that youth often mistakenly included people withintellectual disabilities when describing people with mental illness.
The proportion of the wider population aged 15 to 44 years who knew someonewith or who has had a mental illness was significantly higher than the sameproportion of youth (62% cf. 74% of total sample). When non-mental illnesseswere removed, there were 59% overall who knew someone who has or had amental illness (cf. 36% for youth).
Forty percent of youth knew a close friend or relative with a mental illness,significantly fewer than the overall proportion (51%). Also significantly lower,somewhat expected, were the proportions of work colleagues (6% cf. 2% overall)and spouse/partners (3% cf. 0% overall) known by youth to have a mental illness.
MAORI YOUTH
There were indications that Maori youth were less likely to know or have knownsomeone with a mental illness in 2004 than they did in 1997. Almost threequarters of Maori youth (73%) said they knew someone with or who has had amental illness in 1997, compared with 61% in 2004. However the difference wasstill not large enough to be statistically significant with the small sub-samples. In2004, 40% associated a correctly specified mental illness with a person theyknew.
PACIFIC YOUTH
Pacific youth tended to show a similar pattern to youth in general 3.
2 There was no comparable figure for 1997 as respondents were not asked the type of mental illness
3 In subsequent sections of the report where there are no differences worthy of note in the Maori or Pacificsection, there will be no commentary
20
6.2 DEFINING GOOD HEALTH
WHAT CONTRIBUTES TO GOOD HEALTH
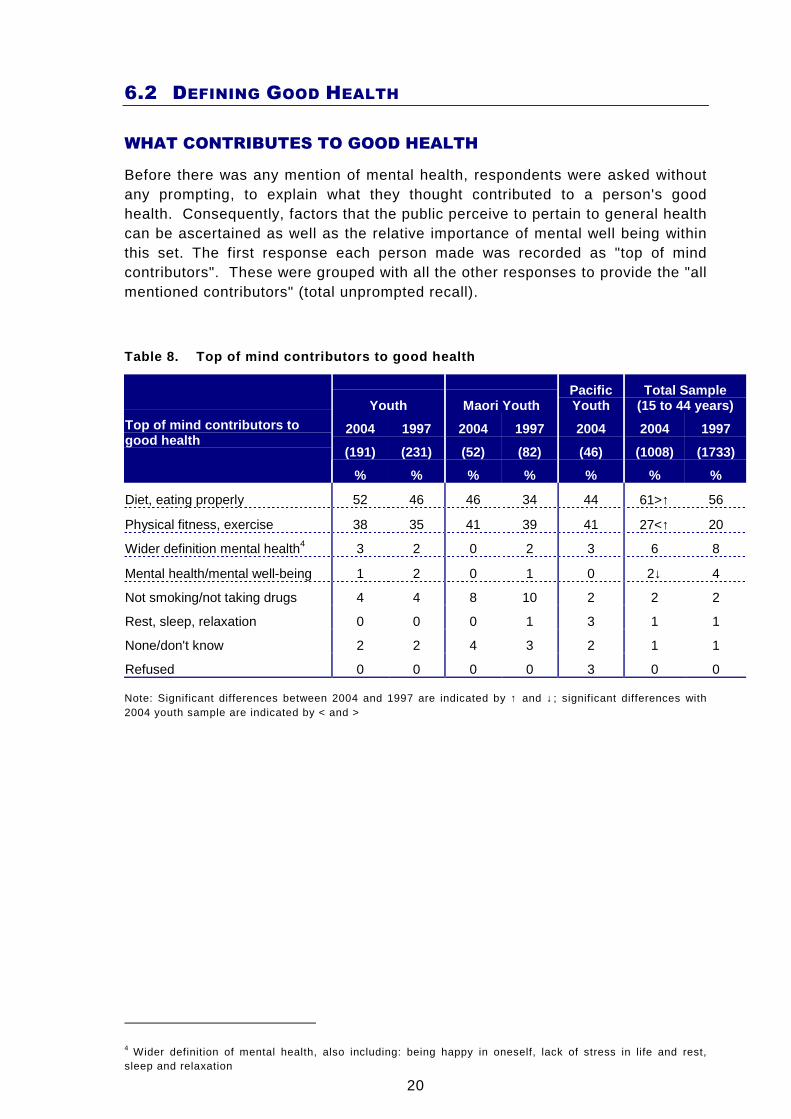
Before there was any mention of mental health, respondents were asked withoutany prompting, to explain what they thought contributed to a person's goodhealth. Consequently, factors that the public perceive to pertain to general healthcan be ascertained as well as the relative importance of mental well being withinthis set. The first response each person made was recorded as "top of mindcontributors". These were grouped with all the other responses to provide the "allmentioned contributors" (total unprompted recall).
Table 8. Top of mind contributors to good health
Youth Maori YouthPacificYouth
Total Sample(15 to 44 years)
2004 1997 2004 1997 2004 2004 1997
(191) (231) (52) (82) (46) (1008) (1733)
Top of mind contributors togood health
% % % % % % %
Diet, eating properly 52 46 46 34 44 61>↑ 56
Physical fitness, exercise 38 35 41 39 41 27<↑ 20
Wider definition mental health4 3 2 0 2 3 6 8
Mental health/mental well-being 1 2 0 1 0 2↓ 4
Not smoking/not taking drugs 4 4 8 10 2 2 2
Rest, sleep, relaxation 0 0 0 1 3 1 1
None/don't know 2 2 4 3 2 1 1
Refused 0 0 0 0 3 0 0
Note: Significant differences between 2004 and 1997 are indicated by ↑ and ↓; significant differences with2004 youth sample are indicated by < and >
4 Wider definition of mental health, also including: being happy in oneself, lack of stress in life and rest,sleep and relaxation
21
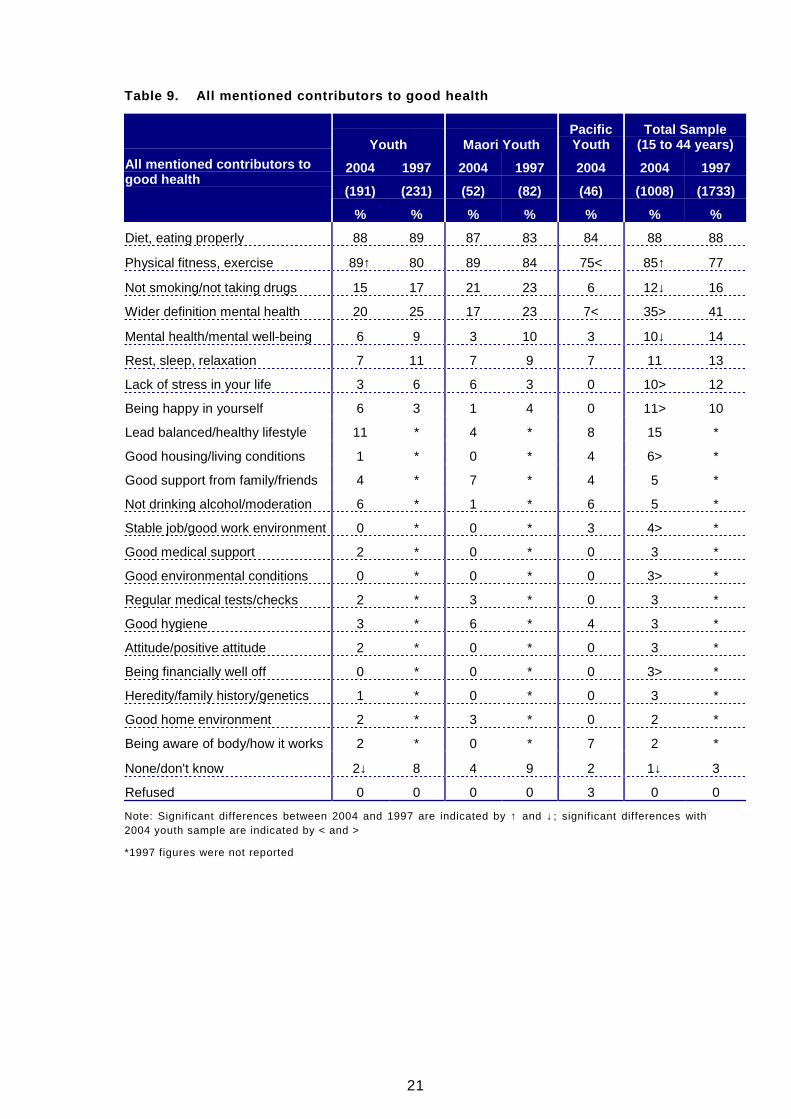
Table 9. All mentioned contributors to good health
Youth Maori YouthPacificYouth
Total Sample(15 to 44 years)
2004 1997 2004 1997 2004 2004 1997
(191) (231) (52) (82) (46) (1008) (1733)
All mentioned contributors togood health
% % % % % % %
Diet, eating properly 88 89 87 83 84 88 88
Physical fitness, exercise 89↑ 80 89 84 75< 85↑ 77
Not smoking/not taking drugs 15 17 21 23 6 12↓ 16
Wider definition mental health 20 25 17 23 7< 35> 41
Mental health/mental well-being 6 9 3 10 3 10↓ 14
Rest, sleep, relaxation 7 11 7 9 7 11 13
Lack of stress in your life 3 6 6 3 0 10> 12
Being happy in yourself 6 3 1 4 0 11> 10
Lead balanced/healthy lifestyle 11 * 4 * 8 15 *
Good housing/living conditions 1 * 0 * 4 6> *
Good support from family/friends 4 * 7 * 4 5 *
Not drinking alcohol/moderation 6 * 1 * 6 5 *
Stable job/good work environment 0 * 0 * 3 4> *
Good medical support 2 * 0 * 0 3 *
Good environmental conditions 0 * 0 * 0 3> *
Regular medical tests/checks 2 * 3 * 0 3 *
Good hygiene 3 * 6 * 4 3 *
Attitude/positive attitude 2 * 0 * 0 3 *
Being financially well off 0 * 0 * 0 3> *
Heredity/family history/genetics 1 * 0 * 0 3 *
Good home environment 2 * 3 * 0 2 *
Being aware of body/how it works 2 * 0 * 7 2 *
None/don't know 2↓ 8 4 9 2 1↓ 3
Refused 0 0 0 0 3 0 0
Note: Significant differences between 2004 and 1997 are indicated by ↑ and ↓; significant differences with2004 youth sample are indicated by < and >
*1997 figures were not reported
22
YOUTH
One in five youth (20%) mentioned at least one contributor from the widerdefinition of mental health5 in 2004, significantly fewer than in the 15 to 44 yearage group (35%). Although youth tended to be lower in mention of many of thecategories, the difference for mental health was particularly marked.
The most common responses for youth at all were diet and eating properly (top ofmind 52%, overall 88%) and physical fitness and exercise (38% and 89%). Youthmentioned fitness and exercise significantly more in 2004 than in 1997 (80%).
PACIFIC YOUTH 6
Pacific youth were significantly less likely to mention any contributor from thewider definition of mental health (7% cf. 20% of youth overall).
5 Wider definition of mental health, also including: being happy in oneself, lack of stress in life and rest,sleep and relaxation
6 Maori youth are not mentioned as there was nothing important to comment on
23
6.3 DEFINING MENTAL ILLNESS
IMMEDIATE THOUGHTS ON HEARING 'MENTAL ILLNESS'
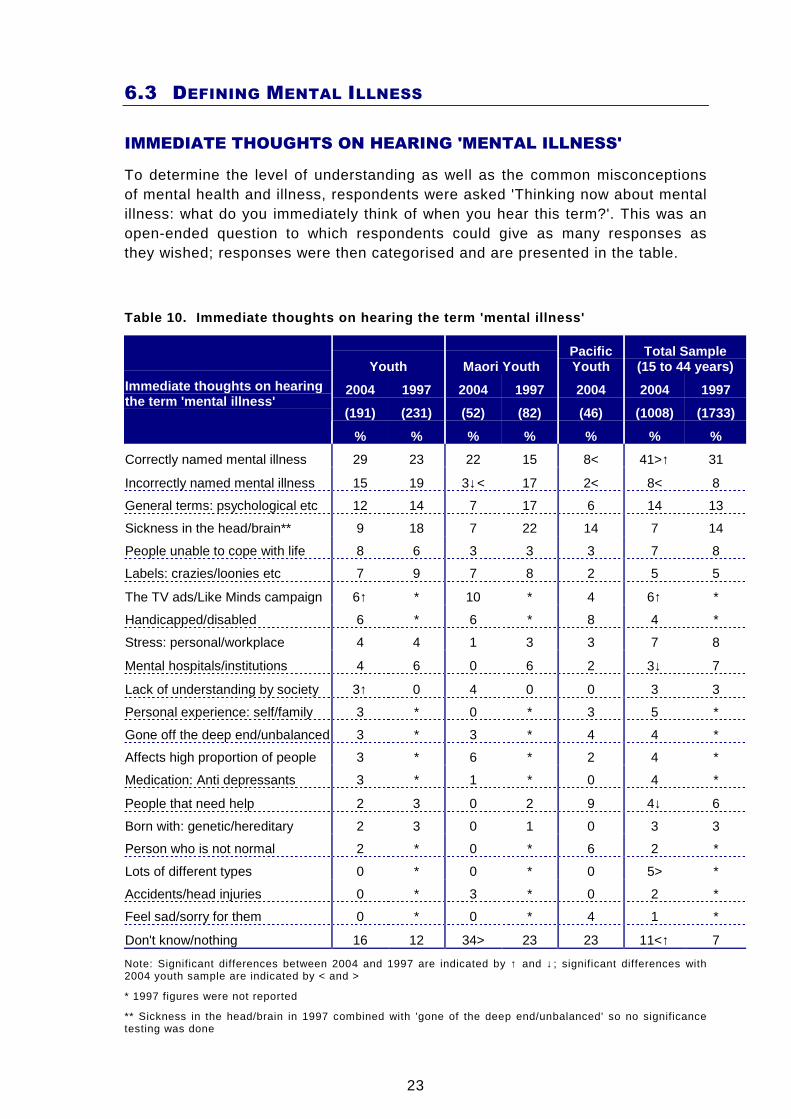
To determine the level of understanding as well as the common misconceptionsof mental health and illness, respondents were asked 'Thinking now about mentalillness: what do you immediately think of when you hear this term?'. This was anopen-ended question to which respondents could give as many responses asthey wished; responses were then categorised and are presented in the table.
Table 10. Immediate thoughts on hearing the term 'm ental illness'
Youth Maori YouthPacificYouth
Total Sample(15 to 44 years)
2004 1997 2004 1997 2004 2004 1997
(191) (231) (52) (82) (46) (1008) (1733)
Immediate thoughts on hearingthe term 'mental illness'
% % % % % % %
Correctly named mental illness 29 23 22 15 8< 41>↑ 31
Incorrectly named mental illness 15 19 3↓< 17 2< 8< 8
General terms: psychological etc 12 14 7 17 6 14 13
Sickness in the head/brain** 9 18 7 22 14 7 14
People unable to cope with life 8 6 3 3 3 7 8
Labels: crazies/loonies etc 7 9 7 8 2 5 5
The TV ads/Like Minds campaign 6↑ * 10 * 4 6↑ *
Handicapped/disabled 6 * 6 * 8 4 *
Stress: personal/workplace 4 4 1 3 3 7 8
Mental hospitals/institutions 4 6 0 6 2 3↓ 7
Lack of understanding by society 3↑ 0 4 0 0 3 3
Personal experience: self/family 3 * 0 * 3 5 *
Gone off the deep end/unbalanced 3 * 3 * 4 4 *
Affects high proportion of people 3 * 6 * 2 4 *
Medication: Anti depressants 3 * 1 * 0 4 *
People that need help 2 3 0 2 9 4↓ 6
Born with: genetic/hereditary 2 3 0 1 0 3 3
Person who is not normal 2 * 0 * 6 2 *
Lots of different types 0 * 0 * 0 5> *
Accidents/head injuries 0 * 3 * 0 2 *
Feel sad/sorry for them 0 * 0 * 4 1 *
Don't know/nothing 16 12 34> 23 23 11<↑ 7
Note: Significant differences between 2004 and 1997 are indicated by ↑ and ↓; significant differences with2004 youth sample are indicated by < and >
* 1997 figures were not reported
** Sickness in the head/brain in 1997 combined with 'gone of the deep end/unbalanced' so no significancetesting was done
24
YOUTH
In 2004, less than one third of youth mentioned actual mental illnesses as theirimmediate thoughts, significantly fewer than in the total sample (29% cf. 41% of15 to 44 year olds). Significantly more youth named conditions that were notmental illnesses than in the total sample (15% cf. 8% overall).
Six percent of youth immediately thought of the Like Minds, Like Mineadvertisements.
Sixteen percent of youth said they did not know or could not of think of anything,that proportion being significantly higher than for the total sample (11%).
The only difference in youth attitudes from 1997 to 2004 was an increase in thelevel of mention of lack of understanding by society (3% cf. 0% in 1997).
The category "sickness in the head/brain" was in 1997 grouped with "gone off thedeep end/unbalanced". These have been separated in 2004, but when groupedfor comparison purposes, the proportion of youth mentioning either was now 12percent, compared with 18 percent in 1997, a difference that was not statisticallysignificant.
MAORI YOUTH
For immediate thoughts on mental illness, 22% of Maori youth thought of actualmental illnesses in 2004 and seven percent thought of general terms such as'psychological'.
Compared to youth in general, significantly fewer Maori youth in 2004 mentionedan illness that is not an actual mental illness (3% cf. 15% of all youth). Maoriyouth mentioned a non-mental illness less frequently in 2004 (17% in 1997).
Ten percent of Maori youth immediately thought of the Like Minds advertisementsin 2004, slightly but not significantly more than the six percent among youth ingeneral.
Maori youth were significantly more likely than youth in general to say they didn’tknow or could not think of anything (34% cf. 16% of youth overall). There wereindications that this level was higher than in 1997 (34% cf. 23% in 1997), but thedifference was not significant because of the small sub-sample sizes.
PACIFIC YOUTH
Eight percent of Pacific youth immediately thought of actual mental illnesses in2004. This was significantly lower than 29% of youth in general who did so.Similarly fewer Pacific youth mentioned a non-mental illness (2% cf. 15% of allyouth). This pattern of mentioning few specific mental illnesses was consistentwith that for Pacific in the wider target group7
Twenty three percent said they did not know or thought of nothing; this wasslightly higher than the 16% among youth in general.
7 This information is not in the table, but comes from the national survey report
25
AWARENESS OF MENTAL ILLNESSES
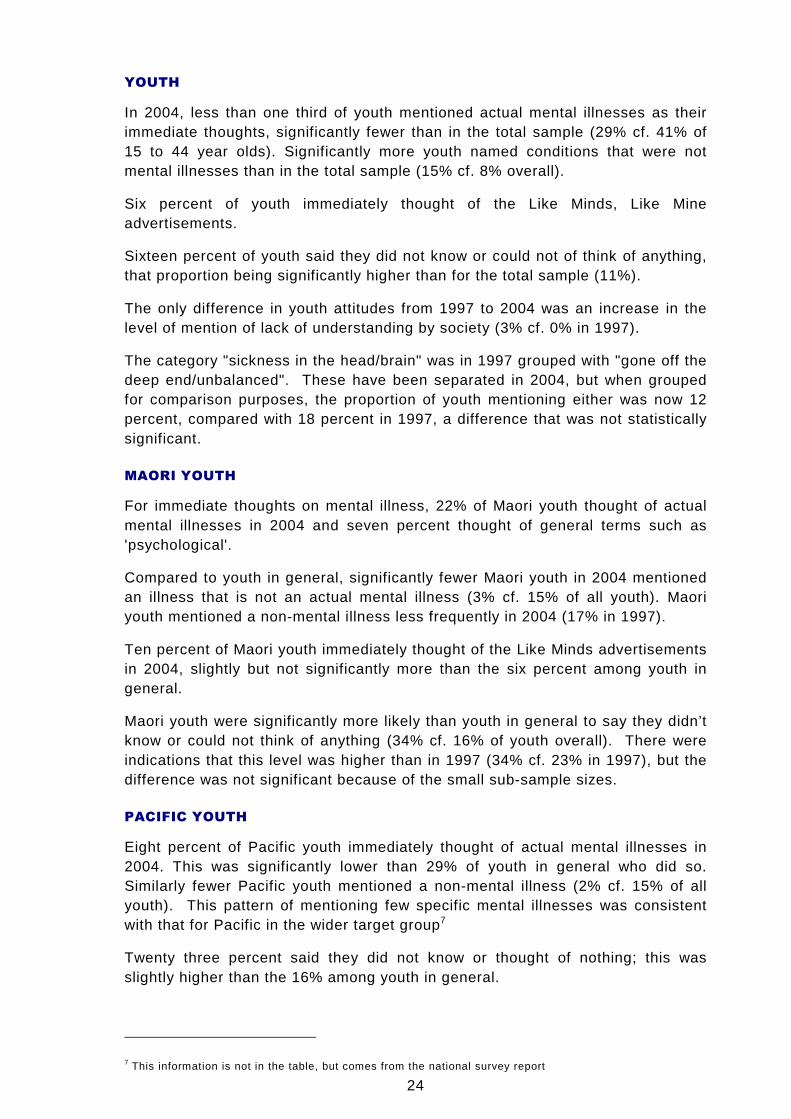
To determine what mental illnesses were most in public consciousnessrespondents were asked to give the names of mental illnesses they had heard of.Responses are recorded at three levels: the first response is top of mindawareness and then top of mind combined with any other unprompted responsesmake up unprompted awareness. Finally respondents are prompted with thenames of certain illnesses and are asked to indicate whether or not they arefamiliar with them, to give total prompted awareness.
Table 11. Mental illnesses have heard of
Youth
2004 1997
Top ofmind
TotalUnpr'mpt
Totalprompt
Top ofmind
TotalUnpr'mpt
Totalprompt
(1008) (1008) (1008) (1733) (1733) (1733)
Mental illnesses have heard of
% % % % %
Depression 23↑ 36↑ 88 7 17 81
Schizophrenia 24 37 83 32 46 85
Manic depression 1↓ 2↓ 74 5 9 71
Bi-polar disorder 6↑ 19↑ 68↑ 1 1 21
Anxiety disorders 0 2↓ 65↓ 0 7 75
Alzheimer's 2↓ 3↓ * 7 15 62
Senile Dementia 0 0 * 1 2 50
None/Don't know 29 29 4↑ 28 28 1
Note: Significant differences between 2004 and 1997 are indicated by ↑ and ↓
Total Sample(15 to 44 years)
2004 1997
Top ofmind
TotalUnpr'mpt
Totalprompt
Top ofmind
TotalUnpr'mpt
Totalprompt
(1008) (1008) (1008) (1733) (1733) (1733)
Mental illnesses have heard of
% % % % %
Depression 29↑ 50>↑ 93>↑ 14 34 89
Schizophrenia 27↓ 56>↓ 91>↓ 44 67 94
Manic depression 2↓ 9>↓ 86> 6 21 88
Bi-polar disorder 11↑ 34>↑ 73↑ 1 7 32
Anxiety disorders 1 9> 81>↓ 1 11 84
Alzheimer's 3↓ 8>↓ 0 5 16 68
Senile Dementia 0 3>↓ 0 1 5 65
None/Don't know 19< 19< 2< 13 13 0
Note: Significant differences with 2004 youth sample are indicated by < and >
26
Top of mind awareness
In 1997 the most commonly first mentioned illness by youth was schizophrenia(32%). All other illnesses were mentioned by fewer than 10% each and a largeproportion did not mention anything (28%). Schizophrenia was also mentionedmost often by youth in 2004 (24%). Depression was mentioned significantly moreoften in 2004 (23% cf. 7% in 1997) as was bi-polar disorder (6% cf. 1% in 1997),which was consistent with the changes in the wider target group. The rise in theawareness of bi-polar disorder was offset by the fall in the awareness level ofmanic depression (1% cf. 5% in 1997). Alzheimer's was also mentioned lessfrequently by youth in 2004 (2% cf. 7% in 1997).
Maori youth were no different from youth in general in the mental illnesses theymentioned first in 2004. More than one half of all Pacific youth could not nameany mental illnesses, significantly more than youth overall (54% cf. 29% of youthin general).
There were very few differences between youth and the sample overall in 2004.More youth failed to mention any mental illnesses (29% cf. 19% overall)
Unprompted awareness
After the first response was recorded, subsequent responses were added toderive total unprompted awareness. Depression (26% cf. 17% in 1997) and bi-polar disorder (19% cf. 1% in 1997) were both mentioned more frequently byyouth in 2004 than in 1997, again reflecting the trend in the wider target group.The following were all mentioned less frequently:
• Manic depression (2% cf. 9% in 1997)
• Anxiety disorders (2% cf. 7% in 1997)
• Alzheimer's (3% cf. 15% in 1997)
There were no significant differences between youth in general and either Maorior Pacific youth, though there were indications of more Maori youth mentioningschizophrenia (49% cf. 37% overall) while fewer Pacific youth did (26%).
All four mental illnesses focused on in this research were mentioned lessfrequently by youth than by people in the wider age group in 2004:
• Schizophrenia (37% cf. 56% overall)
• Depression (36% cf. 50% overall)
• Bi-polar disorder (19% cf. 34% overall)
• Anxiety disorders (2% cf. 9% overall)
Total prompted awareness
Similar proportions of youth in 2004 as in 1997 had heard of depression,schizophrenia and manic depression. Significantly more youth were aware of bi-polar disorder in 2004 than were in 1997 (68% cf. 21% in 1997). Fewer youthwere aware of anxiety disorders in 2004 (65% cf. 75% in 1997).
27
The awareness levels for the four mental illnesses focussed on in this researchwere lower for youth than for the public at large.
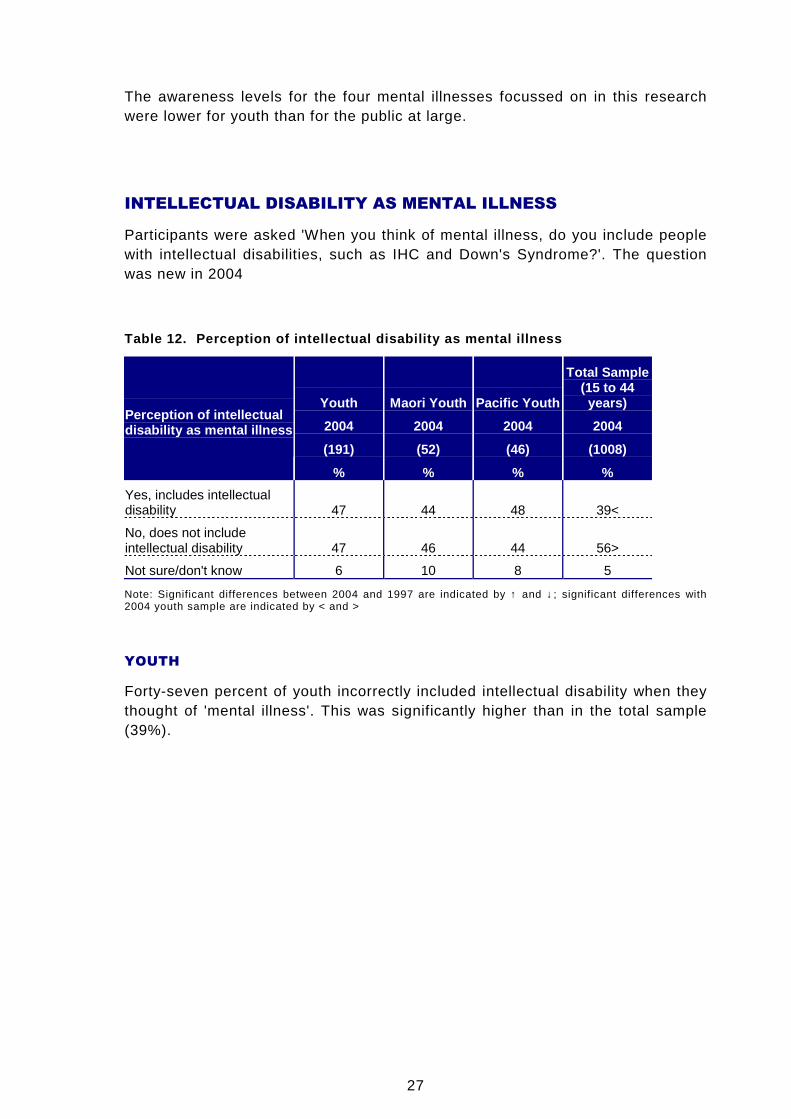
INTELLECTUAL DISABILITY AS MENTAL ILLNESS
Participants were asked 'When you think of mental illness, do you include peoplewith intellectual disabilities, such as IHC and Down's Syndrome?'. The questionwas new in 2004
Table 12. Perception of intellectual disability as mental illness
Youth Maori Youth Pacific Youth
Total Sample(15 to 44years)
2004 2004 2004 2004
(191) (52) (46) (1008)
Perception of intellectualdisability as mental illness
% % % %
Yes, includes intellectualdisability 47 44 48 39<
No, does not includeintellectual disability 47 46 44 56>
Not sure/don't know 6 10 8 5
Note: Significant differences between 2004 and 1997 are indicated by ↑ and ↓; significant differences with2004 youth sample are indicated by < and >
YOUTH
Forty-seven percent of youth incorrectly included intellectual disability when theythought of 'mental illness'. This was significantly higher than in the total sample(39%).
28
6.4 PREVALENCE OF MENTAL ILLNESS
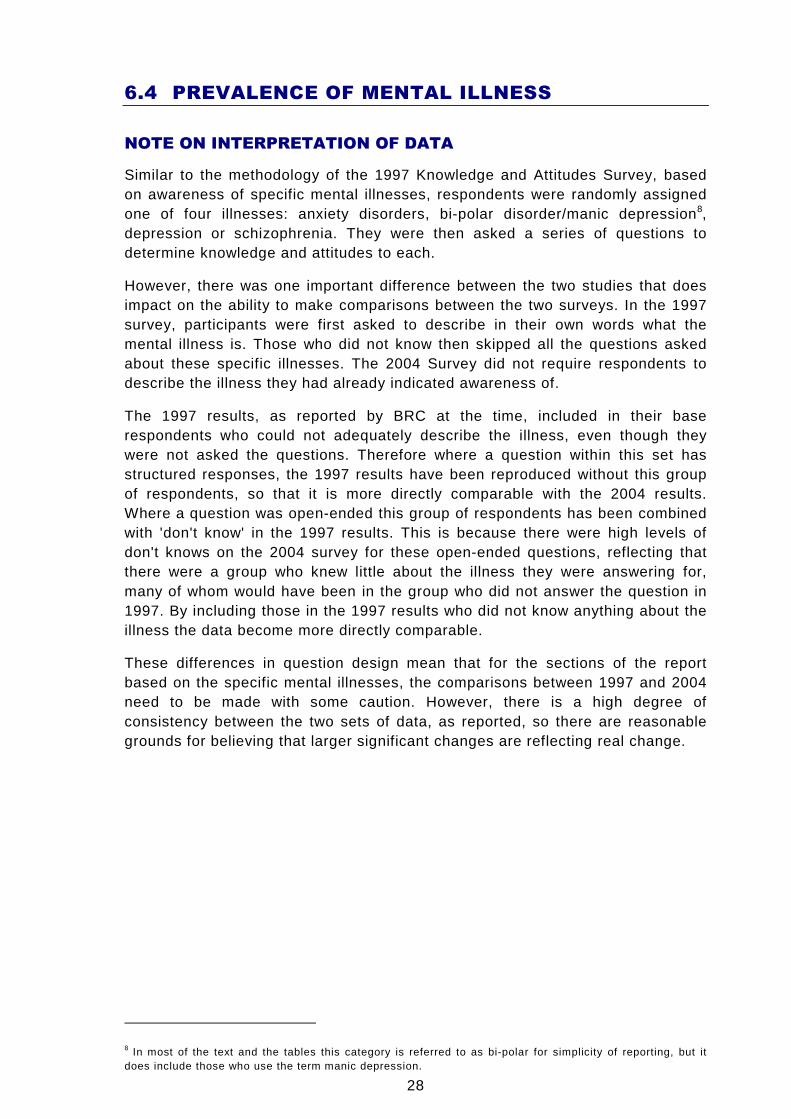
NOTE ON INTERPRETATION OF DATA
Similar to the methodology of the 1997 Knowledge and Attitudes Survey, basedon awareness of specific mental illnesses, respondents were randomly assignedone of four illnesses: anxiety disorders, bi-polar disorder/manic depression8,depression or schizophrenia. They were then asked a series of questions todetermine knowledge and attitudes to each.
However, there was one important difference between the two studies that doesimpact on the ability to make comparisons between the two surveys. In the 1997survey, participants were first asked to describe in their own words what themental illness is. Those who did not know then skipped all the questions askedabout these specific illnesses. The 2004 Survey did not require respondents todescribe the illness they had already indicated awareness of.
The 1997 results, as reported by BRC at the time, included in their baserespondents who could not adequately describe the illness, even though theywere not asked the questions. Therefore where a question within this set hasstructured responses, the 1997 results have been reproduced without this groupof respondents, so that it is more directly comparable with the 2004 results.Where a question was open-ended this group of respondents has been combinedwith 'don't know' in the 1997 results. This is because there were high levels ofdon't knows on the 2004 survey for these open-ended questions, reflecting thatthere were a group who knew little about the illness they were answering for,many of whom would have been in the group who did not answer the question in1997. By including those in the 1997 results who did not know anything about theillness the data become more directly comparable.
These differences in question design mean that for the sections of the reportbased on the specific mental illnesses, the comparisons between 1997 and 2004need to be made with some caution. However, there is a high degree ofconsistency between the two sets of data, as reported, so there are reasonablegrounds for believing that larger significant changes are reflecting real change.
8 In most of the text and the tables this category is referred to as bi-polar for simplicity of reporting, but itdoes include those who use the term manic depression.
29
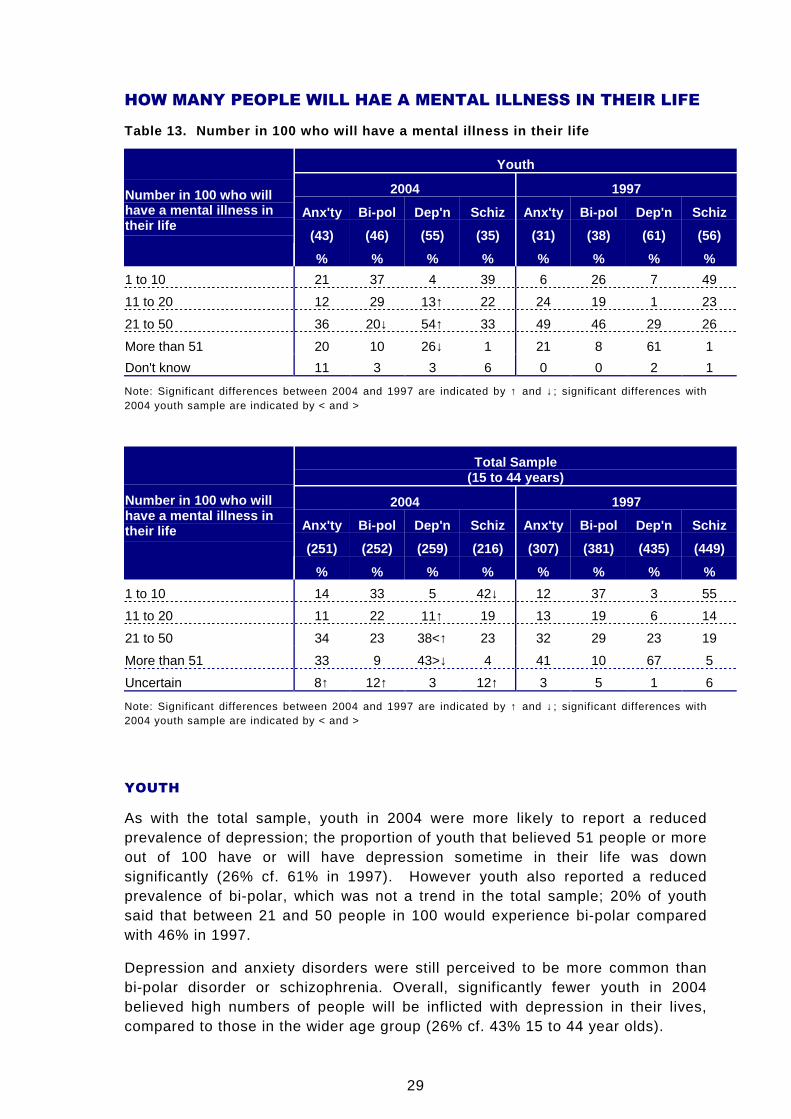
HOW MANY PEOPLE WILL HAE A MENTAL ILLNESS IN THEIR LIFE
Table 13. Number in 100 who will have a mental illn ess in their life
Youth
2004 1997
Anx'ty Bi-pol Dep'n Schiz Anx'ty Bi-pol Dep'n Schiz
(43) (46) (55) (35) (31) (38) (61) (56)
Number in 100 who willhave a mental illness intheir life
% % % % % % % %
1 to 10 21 37 4 39 6 26 7 49
11 to 20 12 29 13↑ 22 24 19 1 23
21 to 50 36 20↓ 54↑ 33 49 46 29 26
More than 51 20 10 26↓ 1 21 8 61 1
Don't know 11 3 3 6 0 0 2 1
Note: Significant differences between 2004 and 1997 are indicated by ↑ and ↓; significant differences with2004 youth sample are indicated by < and >
Total Sample(15 to 44 years)
2004 1997
Anx'ty Bi-pol Dep'n Schiz Anx'ty Bi-pol Dep'n Schiz
(251) (252) (259) (216) (307) (381) (435) (449)
Number in 100 who willhave a mental illness intheir life
% % % % % % % %
1 to 10 14 33 5 42↓ 12 37 3 55
11 to 20 11 22 11↑ 19 13 19 6 14
21 to 50 34 23 38<↑ 23 32 29 23 19
More than 51 33 9 43>↓ 4 41 10 67 5
Uncertain 8↑ 12↑ 3 12↑ 3 5 1 6
Note: Significant differences between 2004 and 1997 are indicated by ↑ and ↓; significant differences with2004 youth sample are indicated by < and >
YOUTH
As with the total sample, youth in 2004 were more likely to report a reducedprevalence of depression; the proportion of youth that believed 51 people or moreout of 100 have or will have depression sometime in their life was downsignificantly (26% cf. 61% in 1997). However youth also reported a reducedprevalence of bi-polar, which was not a trend in the total sample; 20% of youthsaid that between 21 and 50 people in 100 would experience bi-polar comparedwith 46% in 1997.
Depression and anxiety disorders were still perceived to be more common thanbi-polar disorder or schizophrenia. Overall, significantly fewer youth in 2004believed high numbers of people will be inflicted with depression in their lives,compared to those in the wider age group (26% cf. 43% 15 to 44 year olds).
30
6.5 CAUSES AND RECOVERY
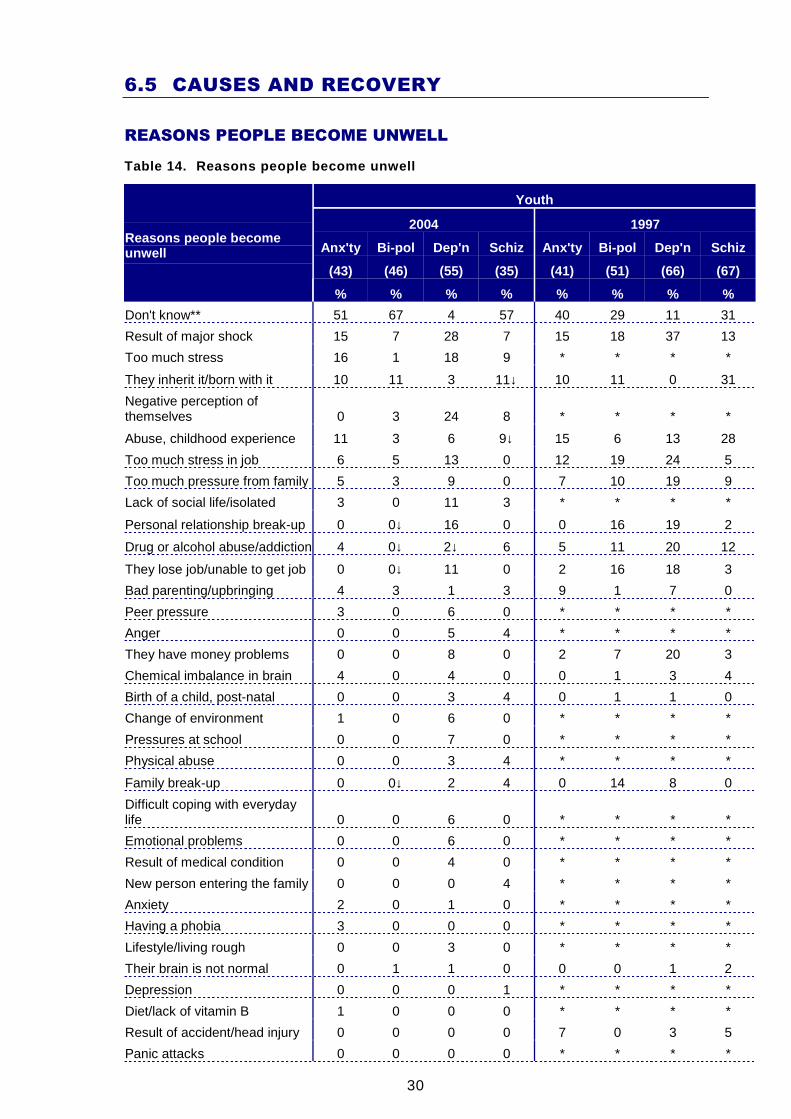
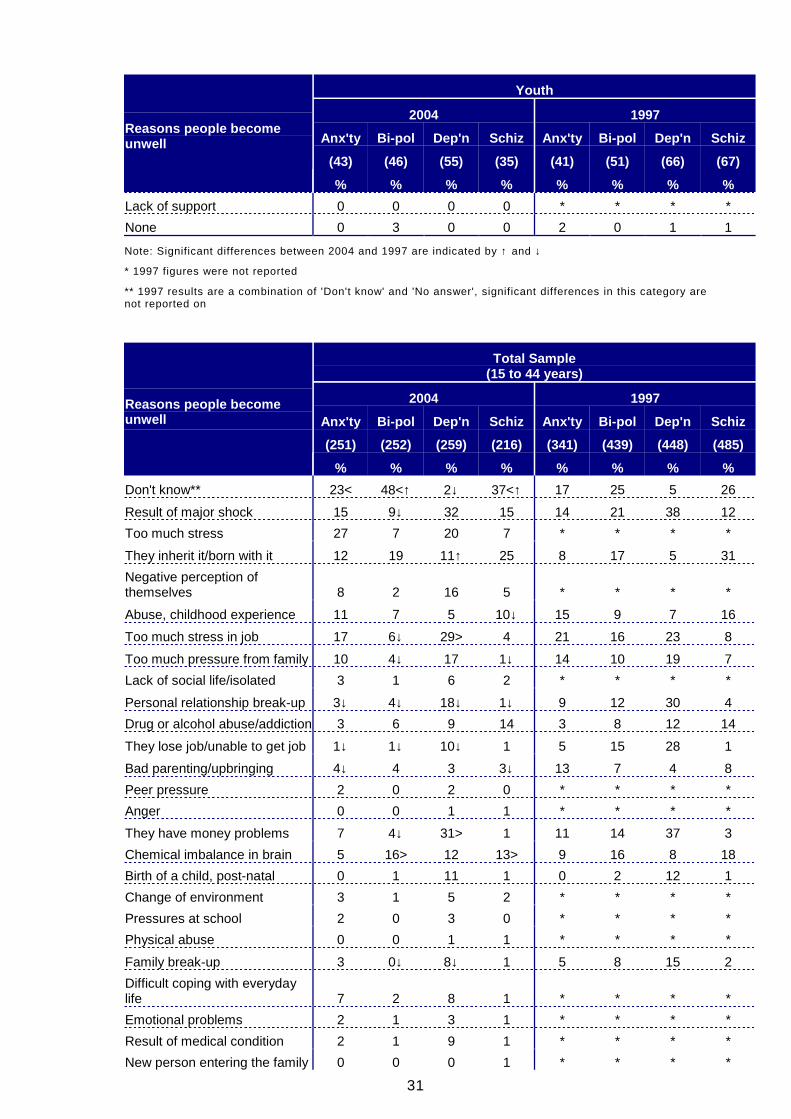
REASONS PEOPLE BECOME UNWELL
Table 14. Reasons people become unwell
Youth
2004 1997
Anx'ty Bi-pol Dep'n Schiz Anx'ty Bi-pol Dep'n Schiz
(43) (46) (55) (35) (41) (51) (66) (67)
Reasons people becomeunwell
% % % % % % % %
Don't know** 51 67 4 57 40 29 11 31
Result of major shock 15 7 28 7 15 18 37 13
Too much stress 16 1 18 9 * * * *
They inherit it/born with it 10 11 3 11↓ 10 11 0 31
Negative perception ofthemselves 0 3 24 8 * * * *
Abuse, childhood experience 11 3 6 9↓ 15 6 13 28
Too much stress in job 6 5 13 0 12 19 24 5
Too much pressure from family 5 3 9 0 7 10 19 9
Lack of social life/isolated 3 0 11 3 * * * *
Personal relationship break-up 0 0↓ 16 0 0 16 19 2
Drug or alcohol abuse/addiction 4 0↓ 2↓ 6 5 11 20 12
They lose job/unable to get job 0 0↓ 11 0 2 16 18 3
Bad parenting/upbringing 4 3 1 3 9 1 7 0
Peer pressure 3 0 6 0 * * * *
Anger 0 0 5 4 * * * *
They have money problems 0 0 8 0 2 7 20 3
Chemical imbalance in brain 4 0 4 0 0 1 3 4
Birth of a child, post-natal 0 0 3 4 0 1 1 0
Change of environment 1 0 6 0 * * * *
Pressures at school 0 0 7 0 * * * *
Physical abuse 0 0 3 4 * * * *
Family break-up 0 0↓ 2 4 0 14 8 0
Difficult coping with everydaylife 0 0 6 0 * * * *
Emotional problems 0 0 6 0 * * * *
Result of medical condition 0 0 4 0 * * * *
New person entering the family 0 0 0 4 * * * *
Anxiety 2 0 1 0 * * * *
Having a phobia 3 0 0 0 * * * *
Lifestyle/living rough 0 0 3 0 * * * *
Their brain is not normal 0 1 1 0 0 0 1 2
Depression 0 0 0 1 * * * *
Diet/lack of vitamin B 1 0 0 0 * * * *
Result of accident/head injury 0 0 0 0 7 0 3 5
Panic attacks 0 0 0 0 * * * *
31
Youth
2004 1997
Anx'ty Bi-pol Dep'n Schiz Anx'ty Bi-pol Dep'n Schiz
(43) (46) (55) (35) (41) (51) (66) (67)
Reasons people becomeunwell
% % % % % % % %
Lack of support 0 0 0 0 * * * *
None 0 3 0 0 2 0 1 1
Note: Significant differences between 2004 and 1997 are indicated by ↑ and ↓
* 1997 figures were not reported
** 1997 results are a combination of 'Don't know' and 'No answer', significant differences in this category arenot reported on
Total Sample(15 to 44 years)
2004 1997
Anx'ty Bi-pol Dep'n Schiz Anx'ty Bi-pol Dep'n Schiz
(251) (252) (259) (216) (341) (439) (448) (485)
Reasons people becomeunwell
% % % % % % % %
Don't know** 23< 48<↑ 2↓ 37<↑ 17 25 5 26
Result of major shock 15 9↓ 32 15 14 21 38 12
Too much stress 27 7 20 7 * * * *
They inherit it/born with it 12 19 11↑ 25 8 17 5 31
Negative perception ofthemselves 8 2 16 5 * * * *
Abuse, childhood experience 11 7 5 10↓ 15 9 7 16
Too much stress in job 17 6↓ 29> 4 21 16 23 8
Too much pressure from family 10 4↓ 17 1↓ 14 10 19 7
Lack of social life/isolated 3 1 6 2 * * * *
Personal relationship break-up 3↓ 4↓ 18↓ 1↓ 9 12 30 4
Drug or alcohol abuse/addiction 3 6 9 14 3 8 12 14
They lose job/unable to get job 1↓ 1↓ 10↓ 1 5 15 28 1
Bad parenting/upbringing 4↓ 4 3 3↓ 13 7 4 8
Peer pressure 2 0 2 0 * * * *
Anger 0 0 1 1 * * * *
They have money problems 7 4↓ 31> 1 11 14 37 3
Chemical imbalance in brain 5 16> 12 13> 9 16 8 18
Birth of a child, post-natal 0 1 11 1 0 2 12 1
Change of environment 3 1 5 2 * * * *
Pressures at school 2 0 3 0 * * * *
Physical abuse 0 0 1 1 * * * *
Family break-up 3 0↓ 8↓ 1 5 8 15 2
Difficult coping with everydaylife 7 2 8 1 * * * *
Emotional problems 2 1 3 1 * * * *
Result of medical condition 2 1 9 1 * * * *
New person entering the family 0 0 0 1 * * * *
32
Total Sample(15 to 44 years)
2004 1997
Anx'ty Bi-pol Dep'n Schiz Anx'ty Bi-pol Dep'n Schiz
(251) (252) (259) (216) (341) (439) (448) (485)
Reasons people becomeunwell
% % % % % % % %
Anxiety 6 1 1 1 * * * *
Having a phobia 7 0 0 0 * * * *
Lifestyle/living rough 1 1 3 1 * * * *
Their brain is not normal 0↓ 1 0 4 2 2 1 4
Depression 3 1 0 2 * * * *
Diet/lack of vitamin B 0 0 3 1 * * * *
Result of accident/head injury 1↓ 1 1 1↓ 5 3 3 4
Panic attacks 3 0 0 1 0 0 0 0
Lack of support 0 1 3 0 * * * *
None 1 1 0 1 1 1 0 2
Note: Significant differences with 2004 youth sample are indicated by < and >
* 1997 figures were not reported
** 1997 results are a combination of 'Don't know' and 'No answer', significant differences in this category arenot reported on
YOUTH
The comparisons with 1997 need to be made with caution, though theconsistency between the responses for the two surveys suggests that wherethere are larger changes these are likely to reflect real changes.
Anxiety Disorders
There was little difference between the reasons youth gave in 2004 and thereasons they gave in 1997. The most frequently mentioned ones in 2004 were toomuch stress, the result of a major shock and abuse or a childhood experience.
There is also little difference in the reasons youth gave for becoming unwell withan anxiety disorder and the reasons the overall population gave though moreyouth could not give a reason (51% cf. 23% overall).
Bi-polar Disorder
As with the wider target group of all 15 to 44 year olds, there were a number ofdecreases in reasons given for bi-polar disorder. The following were allsignificantly lower in 2004 and other reasons also showed indications ofdecreases:
• Personal relationship break-up (0% cf. 16% in 1997)
• Drug or alcohol abuse/addiction (0% cf. 11% in 1997)
• They lose job/unable to get job (0% cf. 16% in 1997)
• Family break-up (0% cf. 14% in 1997)
33
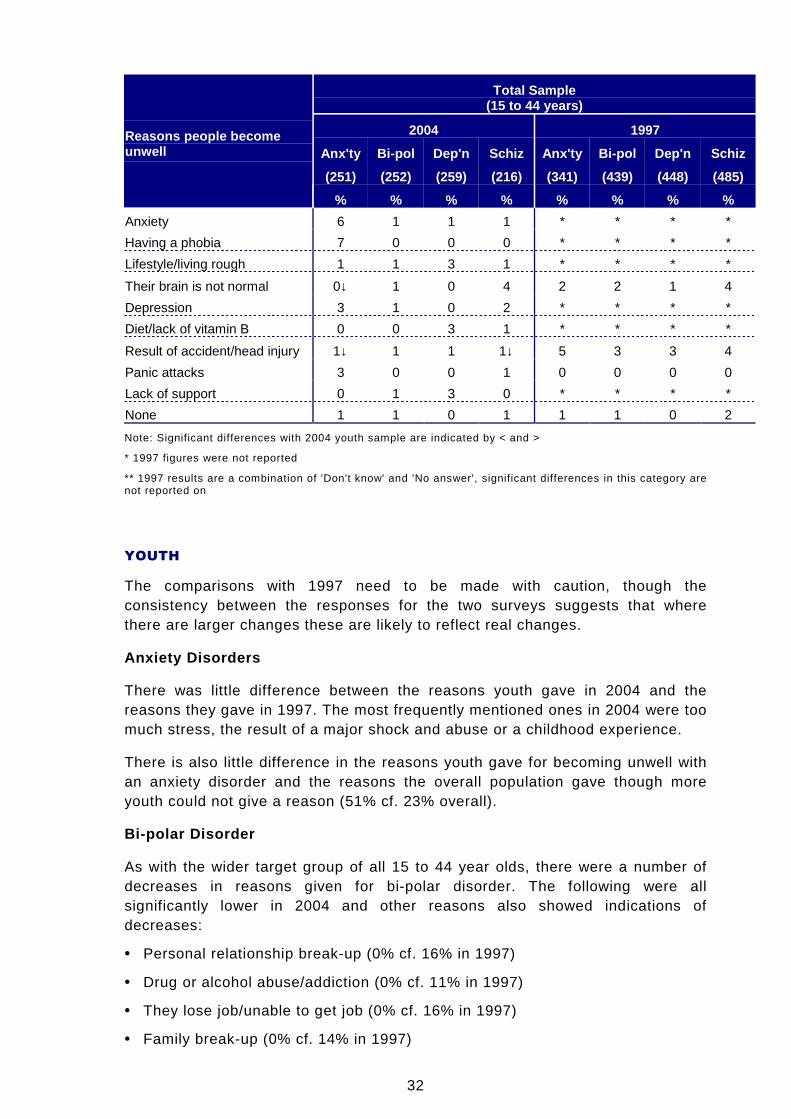
More in the total sample explained bi-polar disorder with a chemical imbalance inthe brain compared to youth in 2004 (0% cf. 16% overall). More youth could notname a reason (67% cf. 48% overall)
Depression
The most frequently identified reasons for depression described by youth in 2004were as a result of a major shock and having a negative perception of yourself.There were fewer youth in 2004 who mentioned drug or alcohol abuse comparedto in 1997 (2% cf. 20% in 1997), which was the only significant difference.
Compared to the wider age group surveyed, fewer youth mentioned the followingin 2004:
• Too much stress in job (13% cf. 29% overall)
• They have money problems (8% cf. 31% overall)
Schizophrenia
Some youth attitudes had changed since 1997. Fewer believed schizophrenia isinherited (11% cf. 31% in 1997) and fewer believed it is a result of childhoodabuse or another childhood experience (9% cf. 28% in 1997).
Like with anxiety disorders and bi-polar disorder, significantly more youth couldnot give a reason for schizophrenia when compared to the overall survey group.More in the total sample said schizophrenia is as a result of a chemicalimbalance in the brain compared to youth (0% cf. 13% overall).
34
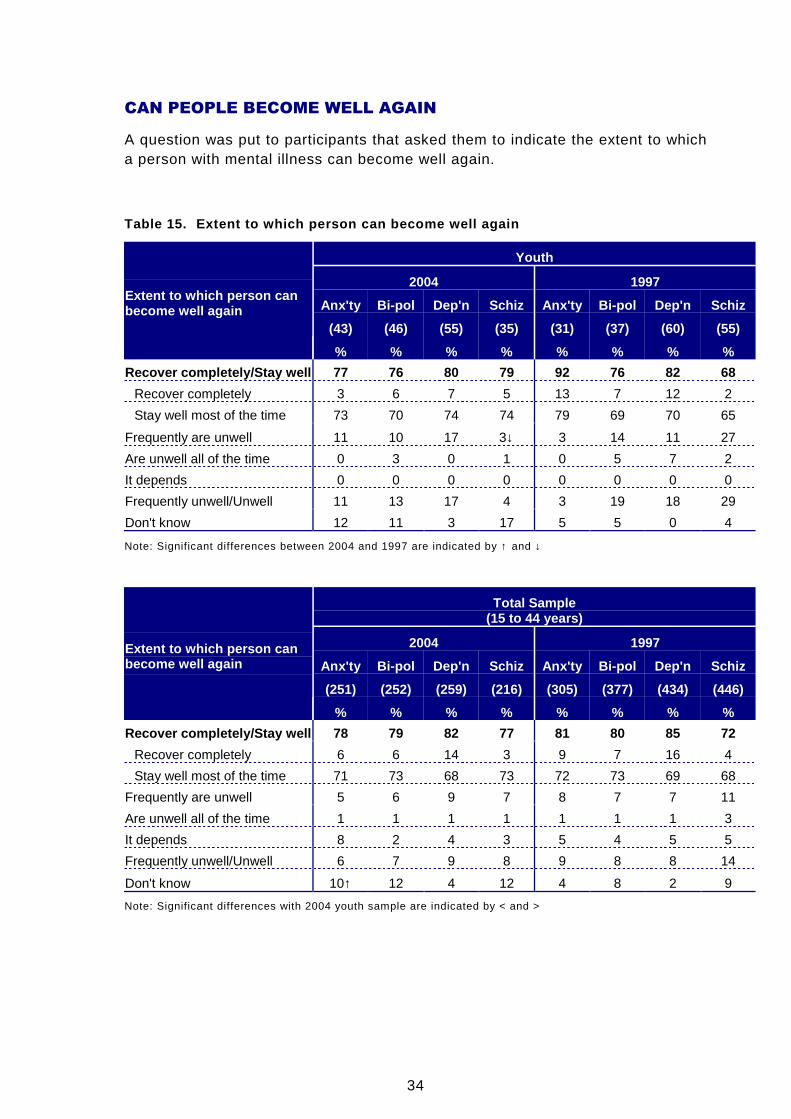
CAN PEOPLE BECOME WELL AGAIN
A question was put to participants that asked them to indicate the extent to whicha person with mental illness can become well again.
Table 15. Extent to which person can become well ag ain
Youth
2004 1997
Anx'ty Bi-pol Dep'n Schiz Anx'ty Bi-pol Dep'n Schiz
(43) (46) (55) (35) (31) (37) (60) (55)
Extent to which person canbecome well again
% % % % % % % %
Recover completely/Stay well 77 76 80 79 92 76 82 68
Recover completely 3 6 7 5 13 7 12 2
Stay well most of the time 73 70 74 74 79 69 70 65
Frequently are unwell 11 10 17 3↓ 3 14 11 27
Are unwell all of the time 0 3 0 1 0 5 7 2
It depends 0 0 0 0 0 0 0 0
Frequently unwell/Unwell 11 13 17 4 3 19 18 29
Don't know 12 11 3 17 5 5 0 4
Note: Significant differences between 2004 and 1997 are indicated by ↑ and ↓
Total Sample(15 to 44 years)
2004 1997
Anx'ty Bi-pol Dep'n Schiz Anx'ty Bi-pol Dep'n Schiz
(251) (252) (259) (216) (305) (377) (434) (446)
Extent to which person canbecome well again
% % % % % % % %
Recover completely/Stay well 78 79 82 77 81 80 85 72
Recover completely 6 6 14 3 9 7 16 4
Stay well most of the time 71 73 68 73 72 73 69 68
Frequently are unwell 5 6 9 7 8 7 7 11
Are unwell all of the time 1 1 1 1 1 1 1 3
It depends 8 2 4 3 5 4 5 5
Frequently unwell/Unwell 6 7 9 8 9 8 8 14
Don't know 10↑ 12 4 12 4 8 2 9
Note: Significant differences with 2004 youth sample are indicated by < and >
35
YOUTH
For all four mental illnesses in 2004, the majority of youth said that those whoexperience the illness can stay well most of the time. The following were thepercentages who mentioned either this or full recovery. There was a high degreeof consistency with the result from the wider target group.
• Anxiety disorders (77% cf. 78% overall)
• Bi-polar disorder (76% cf. 79% overall)
• Depression (80% cf. 82% overall)
• Schizophrenia (79% cf. 77% overall)
Results for youth in 2004 were also consistent with those in 1997. The onlysignificant difference was with respect to schizophrenia. Fewer youth in 2004believed someone with schizophrenia is frequently unwell (3% cf. 27% in 1997).
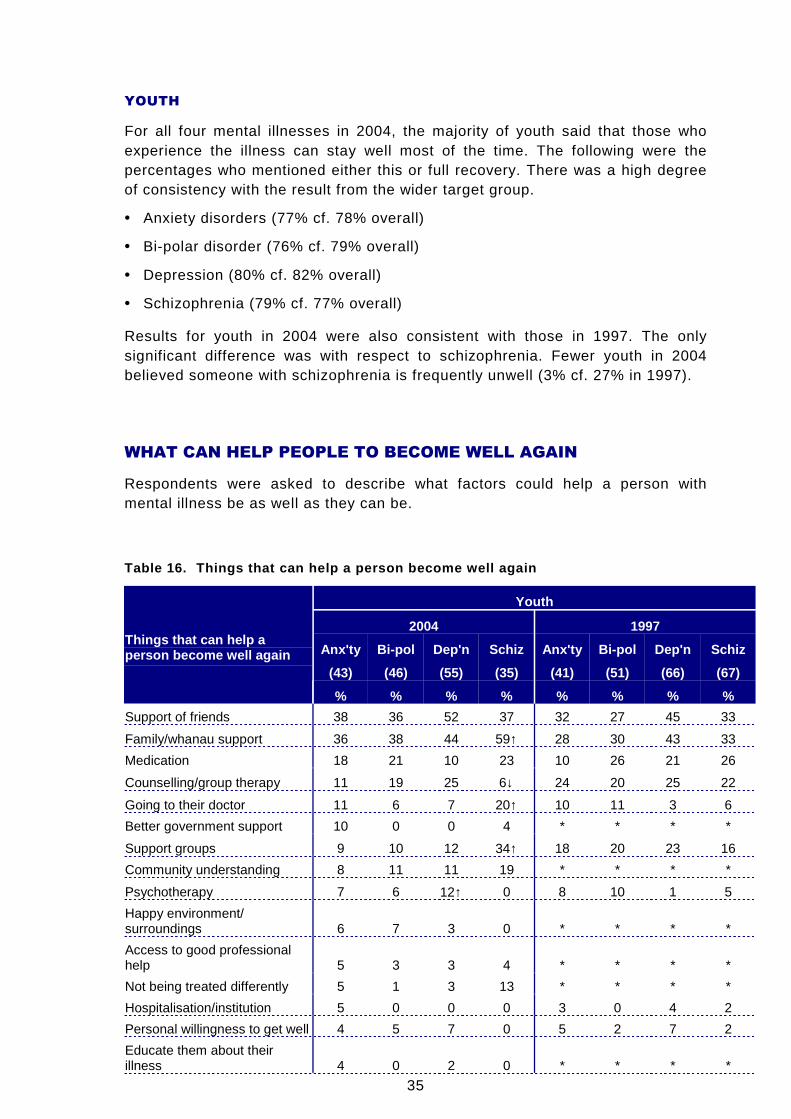
WHAT CAN HELP PEOPLE TO BECOME WELL AGAIN
Respondents were asked to describe what factors could help a person withmental illness be as well as they can be.
Table 16. Things that can help a person become well again
Youth
2004 1997
Anx'ty Bi-pol Dep'n Schiz Anx'ty Bi-pol Dep'n Schiz
(43) (46) (55) (35) (41) (51) (66) (67)
Things that can help aperson become well again
% % % % % % % %
Support of friends 38 36 52 37 32 27 45 33
Family/whanau support 36 38 44 59↑ 28 30 43 33
Medication 18 21 10 23 10 26 21 26
Counselling/group therapy 11 19 25 6↓ 24 20 25 22
Going to their doctor 11 6 7 20↑ 10 11 3 6
Better government support 10 0 0 4 * * * *
Support groups 9 10 12 34↑ 18 20 23 16
Community understanding 8 11 11 19 * * * *
Psychotherapy 7 6 12↑ 0 8 10 1 5
Happy environment/surroundings 6 7 3 0 * * * *
Access to good professionalhelp 5 3 3 4 * * * *
Not being treated differently 5 1 3 13 * * * *
Hospitalisation/institution 5 0 0 0 3 0 4 2
Personal willingness to get well 4 5 7 0 5 2 7 2
Educate them about theirillness 4 0 2 0 * * * *
36
Youth
2004 1997
Anx'ty Bi-pol Dep'n Schiz Anx'ty Bi-pol Dep'n Schiz
(43) (46) (55) (35) (41) (51) (66) (67)
Things that can help aperson become well again
% % % % % % % %
More contact with people 3 4 2 0 * * * *
Stress management/reduction 3 3 0 0 0 15 4 4
Balanced lifestyle 3 0 0 0 * * * *
Eating well 0 9 1 0 0 1 2 3
Stability/stable lifestyle 0 7 0 0 * * * *
Exercising 0 6 4 0 0 1 2 3
Know it ok to talk about illness 0 4 5 9 * * * *
Keeping busy/occupied 0 3 5 0 * * * *
Meditation/relaxation 0 3 0 0 2 0 5 0
Understanding employer 0 3 0 9 * * * *
Living a healthy lifestyle 0 3 0 0 * * * *
More public education 0 3 0 0 * * * *
Good caregivers 0 3 0 0 * * * *
Colleague/work mate support 0 3 0 0 * * * *
Pursuing hobbies 0 1 0↓ 0 0 0 8 1
Positive reinforcement 0 0 8 1 * * * *
Working on their self esteem 0 0 6 0 * * * *
Getting a job 0 0 3 0 0 6 4 2
Getting enough sleep 0 0 1 0 3 0 4 0
Rehabilitation centres 0 0 0 0 0 0 3 2
Maintain a routine 0 0 0 0 0 1 0 2
Don't know** 21 18 14 18 27 26 11 23
Note: Significant differences between 2004 and 1997 are indicated by ↑ and ↓
* 1997 figures were not reported
** 1997 results are a combination of 'Don't know' and 'No answer', significant differences in this category arenot reported on
Total Sample(15 to 44 years)
2004 1997
Anx'ty Bi-pol Dep'n Schiz Anx'ty Bi-pol Dep'n Schiz
(251) (252) (259) (216) (341) (439) (448) (485)
Things that can help aperson become well again
% % % % % % % %
Support of friends 36 38 42 27 34 33 42 27
Family/whanau support 47 51↑ 53 42 41 41 47 39
Medication 31 35 35> 43> 28 40 35 46
Counselling/group therapy 19↓ 16↓ 23↓ 14↓ 32 29 37 21
Going to their doctor 8 8 9 8 13 11 12 14
Better government support 2 1 1 3 * * * *
Support groups 27> 23 20↓ 30 31 29 27 26
37
Total Sample(15 to 44 years)
2004 1997
Anx'ty Bi-pol Dep'n Schiz Anx'ty Bi-pol Dep'n Schiz
(251) (252) (259) (216) (341) (439) (448) (485)
Things that can help aperson become well again
% % % % % % % %
Community understanding 16 15 17 23 * * * *
Psychotherapy 5 2↓ 6 4 9 7 6 6
Happy environment/surroundings 2 4 2 1 * * * *
Access to good professionalhelp 9 11 9 12 * * * *
Not being treated differently 3 1 2 4 * * * *
Hospitalisation/institution 2↓ 2 1↓ 1↓ 6 5 4 8
Personal willingness to get well 3↓ 3 6↓ 2 7 6 12 4
Educate them about theirillness 7 7 6 4 * * * *
More contact with people 3 3 3 1 * * * *
Stress management/reduction 8 4 4 3 8 7 4 5
Balanced lifestyle 1 1 2 1 * * * *
Eating well 1↓ 6 4 2 4 3 5 4
Stability/stable lifestyle 2 3 1 1 * * * *
Exercising 1↓ 4 4 3 4 2 5 4
Know it ok to talk about illness 5 1 3 1 * * * *
Keeping busy/occupied 2 1 5 2 * * * *
Meditation/relaxation 2 2 1 0 3 1 4 2
Understanding employer 4 3 3 2 * * * *
Living a healthy lifestyle 1 2 2 1 * * * *
More public education 4 5 2 6 * * * *
Good caregivers 0 1 0 0 * * * *
Colleague/work mate support 2 1 1 0 * * * *
Pursuing hobbies 0 0 2 0 1 3 6 2
Positive reinforcement 1 1 3 2 * * * *
Working on their self esteem 1 0 2 0 * * * *
Getting a job 1↓ 1↓ 2↓ 3 4 7 6 4
Getting enough sleep 0 3 1 0 1 2 2 1
Rehabilitation centres 0 0 0 0 3 2 4 6
Maintain a routine 1 0 0 1 1 2 2 4
Don't know** 8< 9 5< 10 11 15 4 11
Note: Significant differences with 2004 youth sample are indicated by < and >
* 1997 figures were not reported
** 1997 results are a combination of 'Don't know' and 'No answer', significant differences in this category arenot reported on
38
YOUTH
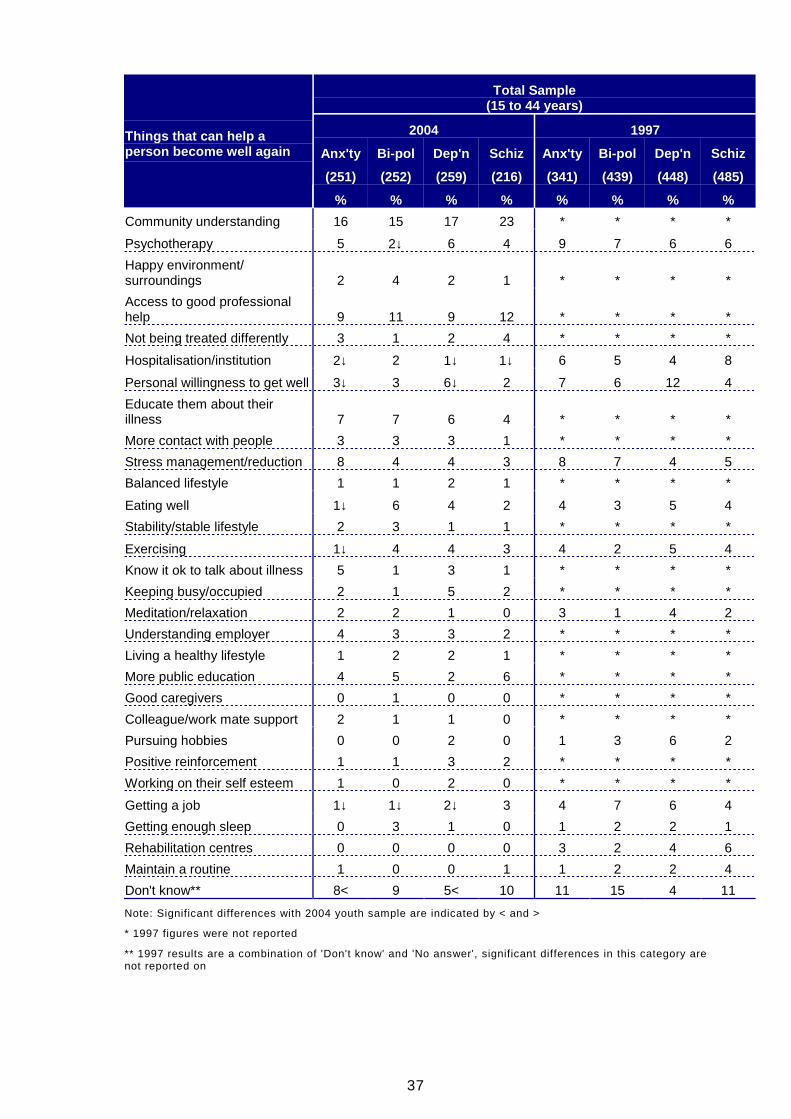
The two most frequently mentioned responses by youth for all four mentalillnesses were support of friends and family support. This was not dissimilar fromthe total sample results, though medication was also mentioned as frequentlyoverall but not so by youth. For depression and schizophrenia the difference wassignificant: depression (10% cf. 35% overall), schizophrenia (23% cf. 43%overall).
In 2004, compared to the wider target group, more youth did not know of anythingthat will assist a person with an anxiety disorder (21% cf. 8% overall) ordepression (14% cf. 5% overall). The only other significant difference betweenyouth and the 15 to 44 year old age group was with respect to anxiety disorders,where fewer youth mentioned support groups (9% cf. 27% overall).
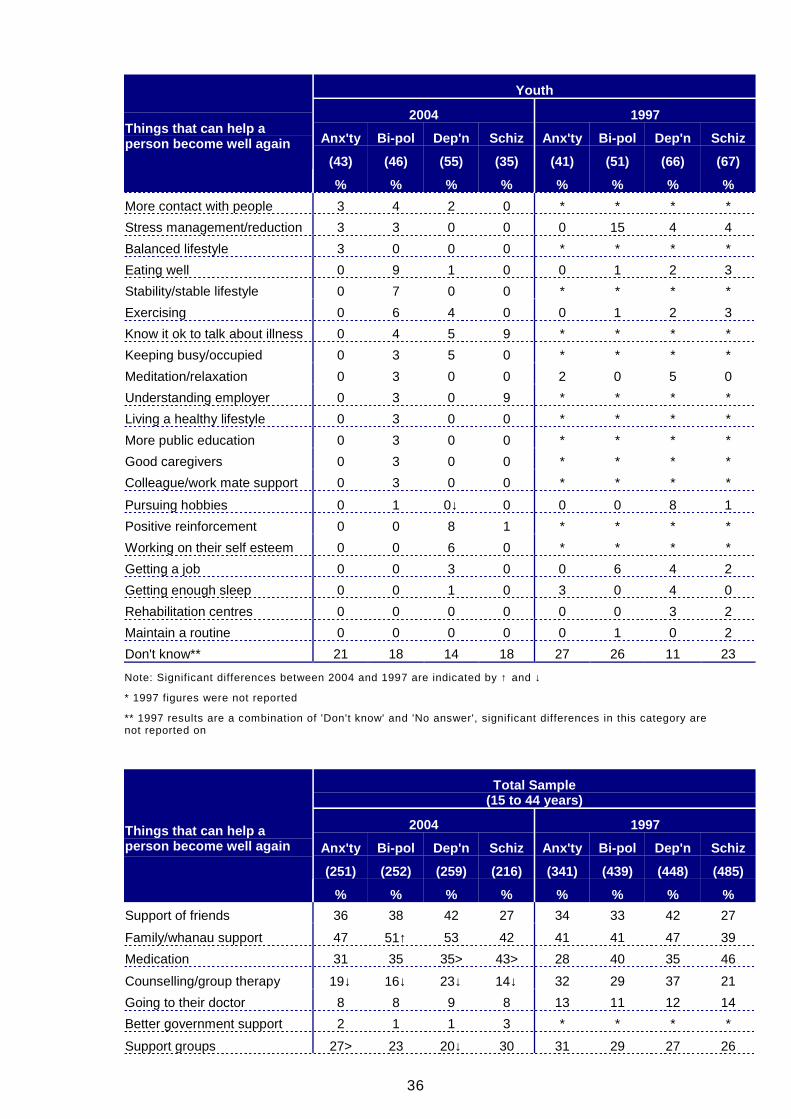
There were no significant differences between the results for youth in 2004 and in1997 for both anxiety disorders and bi-polar disorder.
In 2004 more youth believed psychotherapy can help a person with depression beas well as they can be (12% cf. 1% in 1997). On the other hand fewer mentionedpursuing hobbies (0% cf. 8% in 1997). Neither of these changes were significantin the wider target group.
There were a number of changes in youth perceptions of assistance forschizophrenia between 1997 and 2004:
• Family/whanau support (59% cf. 33% in 1997)
• Going to their doctor (20% cf. 6% in 1997)
• Support groups (34% cf. 16% in 1997)
Counselling or group therapy was mentioned by fewer youth (6% cf. 22% in1997), a trend that was also evident in the wider age group. However, none ofthe other changes mentioned above were evident in this wider target group.
39
6.6 CABABILITY AND SOCIAL ACCEPTANCE OFPEOPLE WITH MENTAL ILLNESS
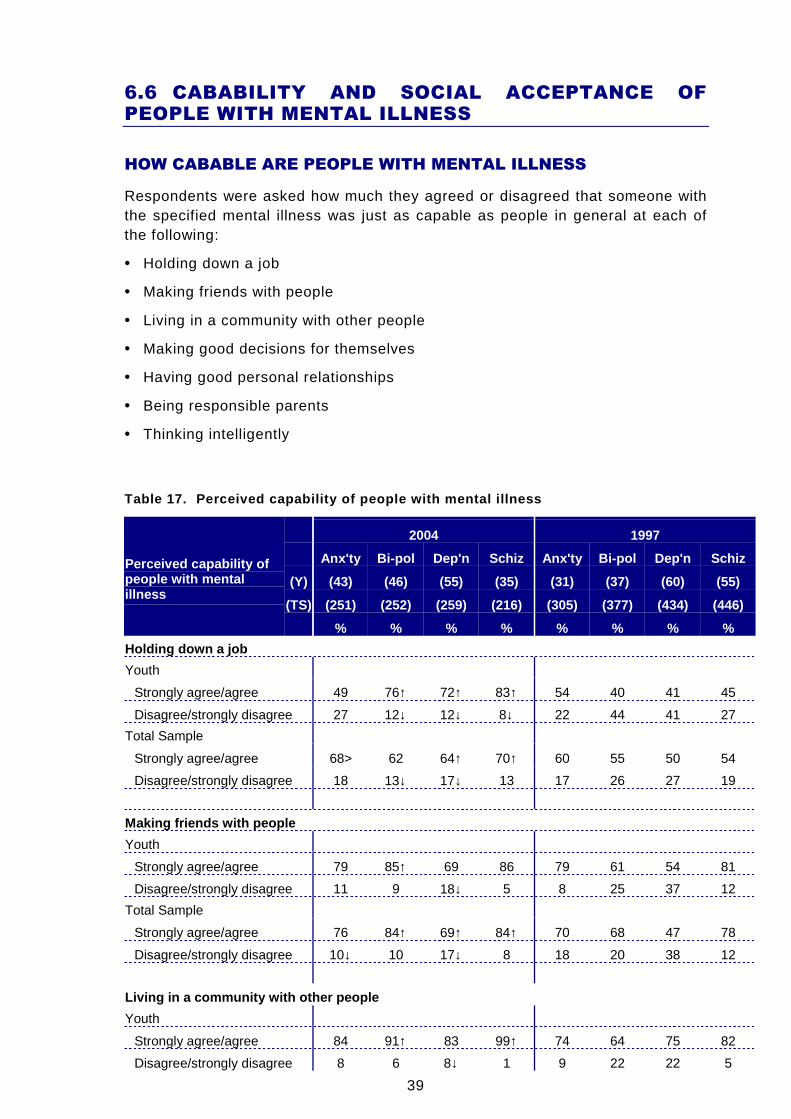
HOW CABABLE ARE PEOPLE WITH MENTAL ILLNESS
Respondents were asked how much they agreed or disagreed that someone withthe specified mental illness was just as capable as people in general at each ofthe following:
• Holding down a job
• Making friends with people
• Living in a community with other people
• Making good decisions for themselves
• Having good personal relationships
• Being responsible parents
• Thinking intelligently
Table 17. Perceived capability of people with menta l illness
2004 1997
Anx'ty Bi-pol Dep'n Schiz Anx'ty Bi-pol Dep'n Schiz
(Y) (43) (46) (55) (35) (31) (37) (60) (55)
(TS) (251) (252) (259) (216) (305) (377) (434) (446)
Perceived capability ofpeople with mentalillness
% % % % % % % %
Holding down a job
Youth
Strongly agree/agree 49 76↑ 72↑ 83↑ 54 40 41 45
Disagree/strongly disagree 27 12↓ 12↓ 8↓ 22 44 41 27
Total Sample
Strongly agree/agree 68> 62 64↑ 70↑ 60 55 50 54
Disagree/strongly disagree 18 13↓ 17↓ 13 17 26 27 19
Making friends with people
Youth
Strongly agree/agree 79 85↑ 69 86 79 61 54 81
Disagree/strongly disagree 11 9 18↓ 5 8 25 37 12
Total Sample
Strongly agree/agree 76 84↑ 69↑ 84↑ 70 68 47 78
Disagree/strongly disagree 10↓ 10 17↓ 8 18 20 38 12
Living in a community with other people
Youth
Strongly agree/agree 84 91↑ 83 99↑ 74 64 75 82
Disagree/strongly disagree 8 6 8↓ 1 9 22 22 5
40
2004 1997
Anx'ty Bi-pol Dep'n Schiz Anx'ty Bi-pol Dep'n Schiz
(Y) (43) (46) (55) (35) (31) (37) (60) (55)
(TS) (251) (252) (259) (216) (305) (377) (434) (446)
Perceived capability ofpeople with mentalillness
% % % % % % % %
Total Sample
Strongly agree/agree 86↑ 87↑ 81↑ 84<↑ 72 65 70 75
Disagree/strongly disagree 5↓ 5 8↓ 6 13 18 16 9
Make good decisions for themselves
Youth
Strongly agree/agree 65 61↑ 52 71↑ 65 33 33 40
Disagree/strongly disagree 15 15↓ 34↓ 12↓ 11 53 54 38
Total Sample
Strongly agree/agree 61↑ 53↑ 45↑ 53 48 37 32 45
Disagree/strongly disagree 15↓ 18↓ 36↓ 21 26 37 47 27
Having good personal relationships
Youth
Strongly agree/agree 76 87↑ 58 61 61 31 46 51
Disagree/strongly disagree 8 9↓ 16↓ 24 19 52 42 32
Total Sample
Strongly agree/agree 73↑ 72<↑ 57↑ 66↑ 57 48 41 54
Disagree/strongly disagree 10↓ 12↓ 23↓ 18↓ 24 34 41 27
Being responsible parents
Youth
Strongly agree/agree 64 63↑ 68↑ 44 49 15 35 38
Disagree/strongly disagree 21 14↓ 19↓ 30 25 53 43 39
Total Sample
Strongly agree/agree 69↑ 65↑ 58↑ 51↑ 57 37 44 40
Disagree/strongly disagree 14 13↓ 22↓ 19↓ 18 35 35 32
Think intelligently
Youth
Strongly agree/agree 77 76 67 79 71 66 55 75
Disagree/strongly disagree 5 9 16↓ 8 8 21 36 16
Total Sample
Strongly agree/agree 80 78↑ 75↑ 82↑ 76 62 57 75
Disagree/strongly disagree 10 6↓ 13↓ 7↓ 12 21 27 13
Note: Significant differences between 2004 and 1997 are indicated by ↑ and ↓; significant differences with2004 youth sample are indicated by < and >
41
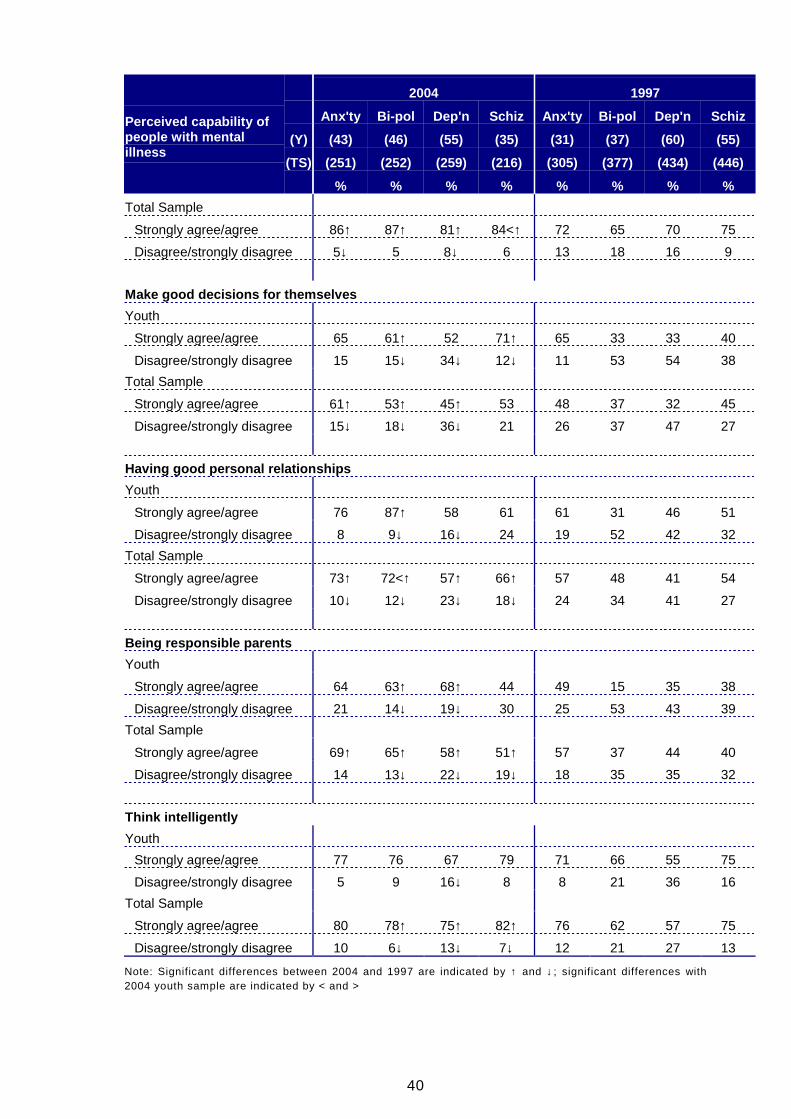
The evidence suggests that there had been an improvement in youth attitudestowards people with mental illness in 2004 since 1997, particularly towardspeople with bi-polar disorder and depression. The number of changes was not asgreat as in the total sample, but this may reflect the greater difficulty of achievingsignificant change with the small sub-sample sizes for youth. As with the widertarget group, youth showed the least change in relation to anxiety disorders.
The 2004 youth results were generally similar to the 2004 target group as awhole.
Holding down a job
More youth in 2004 than in 1997 agreed or strongly agreed that a person with bi-polar disorder (76% cf. 40% in 1997), depression (72% cf. 41% in 1997) orschizophrenia (83% cf. 45% in 1997) is capable of holding down a job.
Compared to the total sample, fewer youth agreed or strongly agreed thatsomeone with an anxiety disorder is capable of holding down a job (49% cf. 68%overall).
Making friends with people
Significantly more youth in 2004 agreed or strongly agreed that someone with bi-polar disorder is capable of making friends with people (85% cf. 61% in 1997)while fewer disagreed or strongly disagreed that someone with depression can dothe same (18% cf. 37% in 1997).
Living in a community with other people
More youth in 2004 than in 1997 agreed or strongly agreed that a person with bi-polar disorder (91% cf. 64% in 1997) or schizophrenia (99% cf. 82% in 1997) iscapable living in a community with other people. Fewer disagreed or stronglydisagreed that someone with depression can do the same (8% cf. 22% in 1997).
Making good decisions for themselves
Significantly more youth in 2004 agreed or strongly agreed that someone with bi-polar disorder (61% cf. 33% in 1997) or schizophrenia (71% cf. 40% in 1997) iscapable of making good decisions for themselves while fewer disagreed orstrongly disagreed that someone with depression can do the same (34% cf. 54%in 1997).
Having good personal relationships
More youth in 2004 than in 1997 agreed or strongly agreed that a person with bi-polar disorder is capable at having good personal relationships (87% cf. 31% in1997). Fewer disagreed or strongly disagreed that someone with depression cando the same (16% cf. 42% in 1997).
Being responsible parents
Significantly more youth in 2004 agreed or strongly agreed that someone with bi-polar disorder (63% cf. 15% in 1997) or schizophrenia (68% cf. 35% in 1997) iscapable of being responsible parents.
42
Thinking intelligently
Fewer youth disagreed or strongly disagreed that someone with depression iscapable of thinking intelligently (16% cf. 36% in 1997).
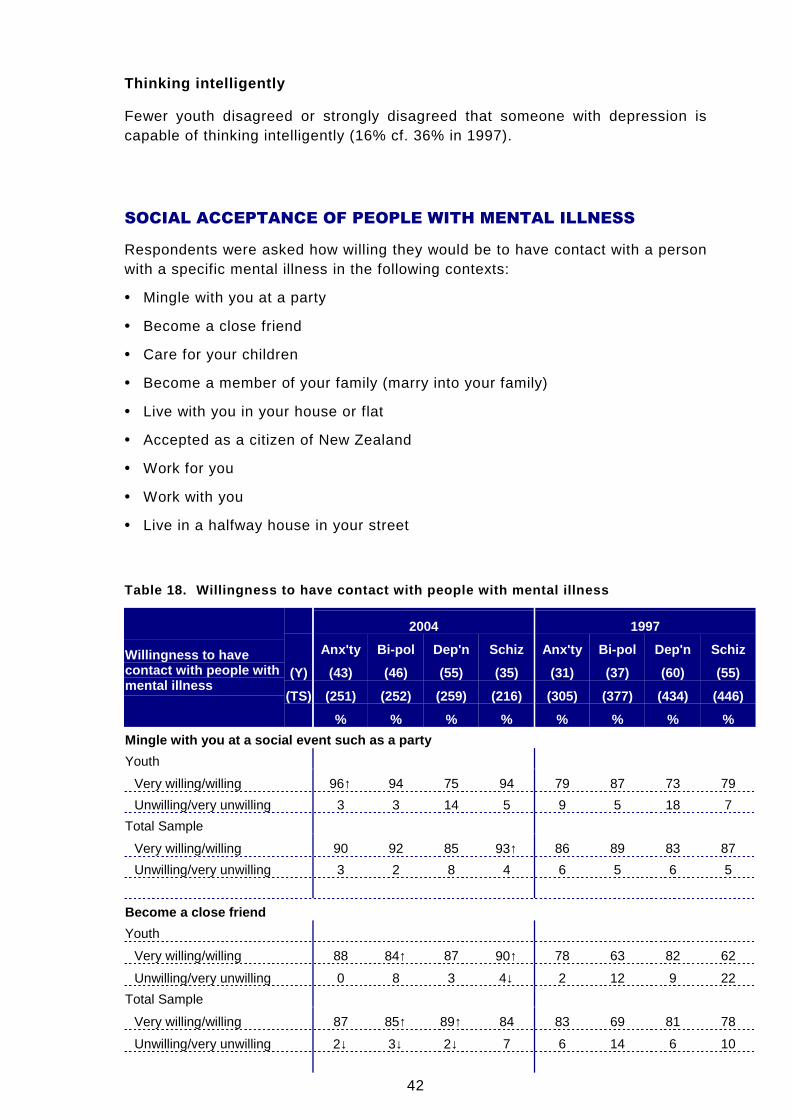
SOCIAL ACCEPTANCE OF PEOPLE WITH MENTAL ILLNESS
Respondents were asked how willing they would be to have contact with a personwith a specific mental illness in the following contexts:
• Mingle with you at a party
• Become a close friend
• Care for your children
• Become a member of your family (marry into your family)
• Live with you in your house or flat
• Accepted as a citizen of New Zealand
• Work for you
• Work with you
• Live in a halfway house in your street
Table 18. Willingness to have contact with people w ith mental illness
2004 1997
Anx'ty Bi-pol Dep'n Schiz Anx'ty Bi-pol Dep'n Schiz
(Y) (43) (46) (55) (35) (31) (37) (60) (55)
(TS) (251) (252) (259) (216) (305) (377) (434) (446)
Willingness to havecontact with people withmental illness
% % % % % % % %
Mingle with you at a social event such as a party
Youth
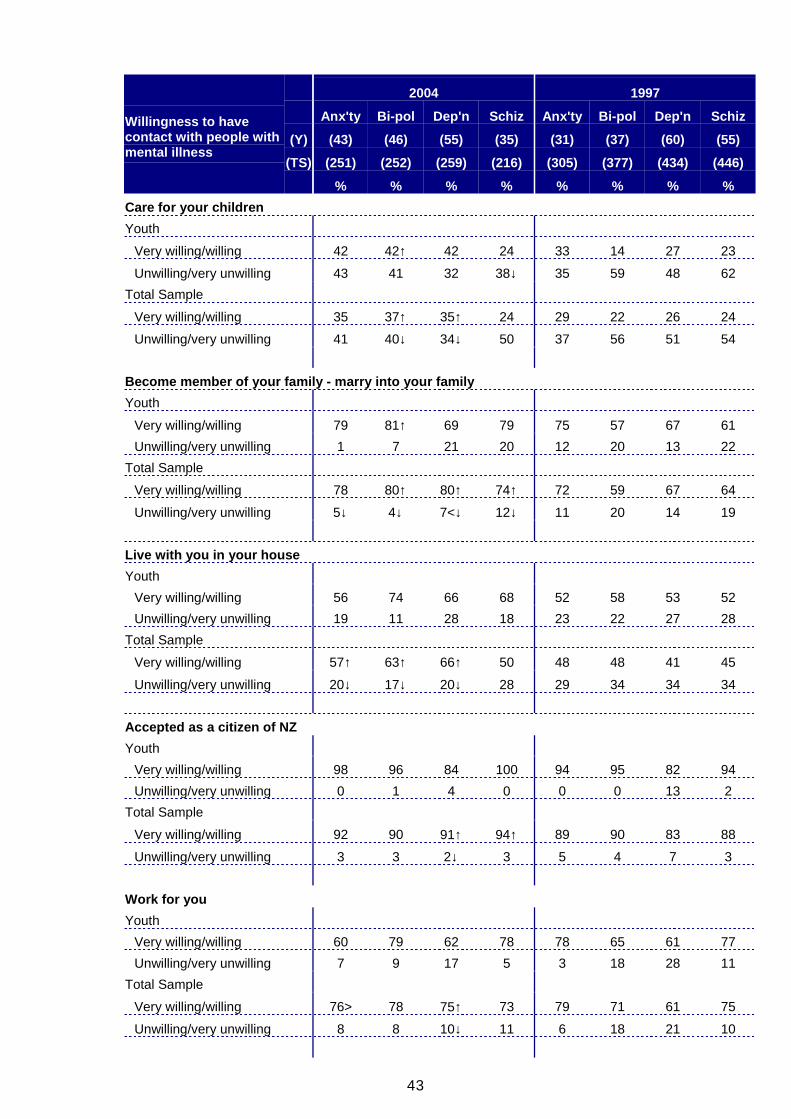
Very willing/willing 96↑ 94 75 94 79 87 73 79
Unwilling/very unwilling 3 3 14 5 9 5 18 7
Total Sample
Very willing/willing 90 92 85 93↑ 86 89 83 87
Unwilling/very unwilling 3 2 8 4 6 5 6 5
Become a close friend
Youth
Very willing/willing 88 84↑ 87 90↑ 78 63 82 62
Unwilling/very unwilling 0 8 3 4↓ 2 12 9 22
Total Sample
Very willing/willing 87 85↑ 89↑ 84 83 69 81 78
Unwilling/very unwilling 2↓ 3↓ 2↓ 7 6 14 6 10
43
2004 1997
Anx'ty Bi-pol Dep'n Schiz Anx'ty Bi-pol Dep'n Schiz
(Y) (43) (46) (55) (35) (31) (37) (60) (55)
(TS) (251) (252) (259) (216) (305) (377) (434) (446)
Willingness to havecontact with people withmental illness
% % % % % % % %
Care for your children
Youth
Very willing/willing 42 42↑ 42 24 33 14 27 23
Unwilling/very unwilling 43 41 32 38↓ 35 59 48 62
Total Sample
Very willing/willing 35 37↑ 35↑ 24 29 22 26 24
Unwilling/very unwilling 41 40↓ 34↓ 50 37 56 51 54
Become member of your family - marry into your fami ly
Youth
Very willing/willing 79 81↑ 69 79 75 57 67 61
Unwilling/very unwilling 1 7 21 20 12 20 13 22
Total Sample
Very willing/willing 78 80↑ 80↑ 74↑ 72 59 67 64
Unwilling/very unwilling 5↓ 4↓ 7<↓ 12↓ 11 20 14 19
Live with you in your house
Youth
Very willing/willing 56 74 66 68 52 58 53 52
Unwilling/very unwilling 19 11 28 18 23 22 27 28
Total Sample
Very willing/willing 57↑ 63↑ 66↑ 50 48 48 41 45
Unwilling/very unwilling 20↓ 17↓ 20↓ 28 29 34 34 34
Accepted as a citizen of NZ
Youth
Very willing/willing 98 96 84 100 94 95 82 94
Unwilling/very unwilling 0 1 4 0 0 0 13 2
Total Sample
Very willing/willing 92 90 91↑ 94↑ 89 90 83 88
Unwilling/very unwilling 3 3 2↓ 3 5 4 7 3
Work for you
Youth
Very willing/willing 60 79 62 78 78 65 61 77
Unwilling/very unwilling 7 9 17 5 3 18 28 11
Total Sample
Very willing/willing 76> 78 75↑ 73 79 71 61 75
Unwilling/very unwilling 8 8 10↓ 11 6 18 21 10
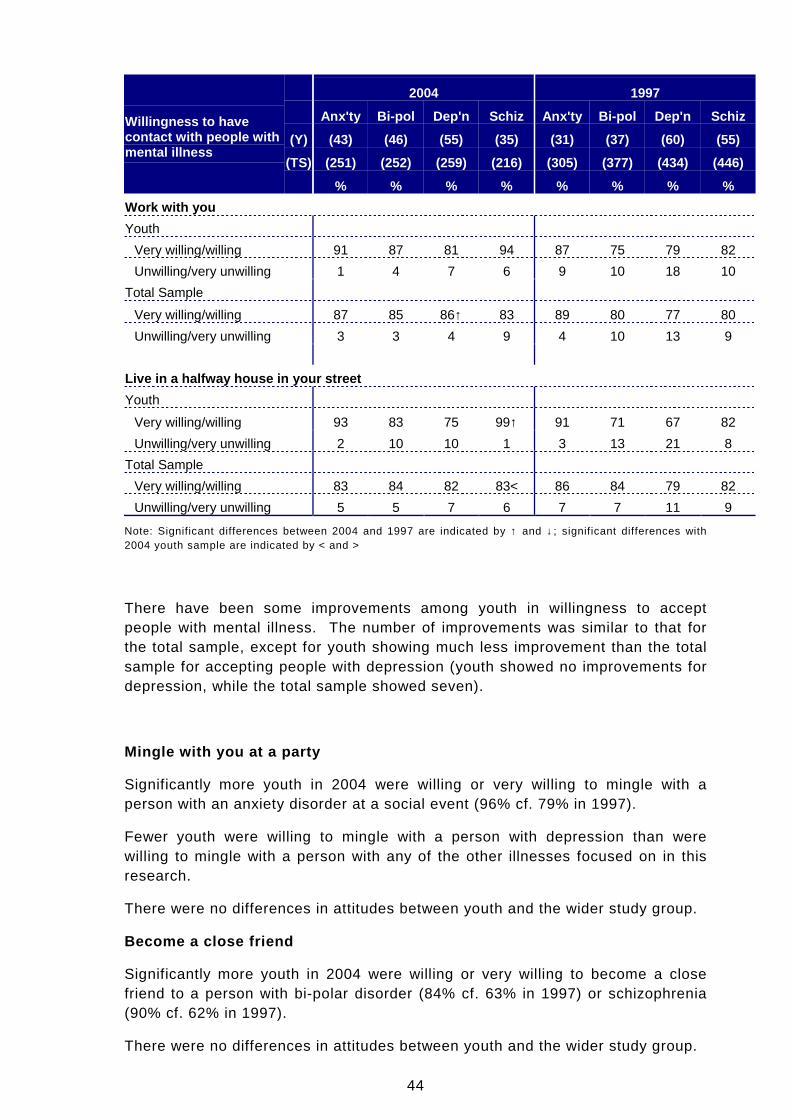
44
2004 1997
Anx'ty Bi-pol Dep'n Schiz Anx'ty Bi-pol Dep'n Schiz
(Y) (43) (46) (55) (35) (31) (37) (60) (55)
(TS) (251) (252) (259) (216) (305) (377) (434) (446)
Willingness to havecontact with people withmental illness
% % % % % % % %
Work with you
Youth
Very willing/willing 91 87 81 94 87 75 79 82
Unwilling/very unwilling 1 4 7 6 9 10 18 10
Total Sample
Very willing/willing 87 85 86↑ 83 89 80 77 80
Unwilling/very unwilling 3 3 4 9 4 10 13 9
Live in a halfway house in your street
Youth
Very willing/willing 93 83 75 99↑ 91 71 67 82
Unwilling/very unwilling 2 10 10 1 3 13 21 8
Total Sample
Very willing/willing 83 84 82 83< 86 84 79 82
Unwilling/very unwilling 5 5 7 6 7 7 11 9
Note: Significant differences between 2004 and 1997 are indicated by ↑ and ↓; significant differences with2004 youth sample are indicated by < and >
There have been some improvements among youth in willingness to acceptpeople with mental illness. The number of improvements was similar to that forthe total sample, except for youth showing much less improvement than the totalsample for accepting people with depression (youth showed no improvements fordepression, while the total sample showed seven).
Mingle with you at a party
Significantly more youth in 2004 were willing or very willing to mingle with aperson with an anxiety disorder at a social event (96% cf. 79% in 1997).
Fewer youth were willing to mingle with a person with depression than werewilling to mingle with a person with any of the other illnesses focused on in thisresearch.
There were no differences in attitudes between youth and the wider study group.
Become a close friend
Significantly more youth in 2004 were willing or very willing to become a closefriend to a person with bi-polar disorder (84% cf. 63% in 1997) or schizophrenia(90% cf. 62% in 1997).
There were no differences in attitudes between youth and the wider study group.
45
Care for your children
Significantly more youth in 2004 were willing or very willing to have a person withbi-polar disorder care for their children (42% cf. 14% in 1997). Significantly feweryouth were unwilling to let a person with schizophrenia care for their children(38% cf. 62% in 1997).
Fewer youth were willing to let a person with schizophrenia care for their childrenthan were willing to let a person with any of the other illnesses focused on in thisresearch care for their children.
There were no differences in attitudes between youth and the wider study group.
Become a member of your family (marry into your family)
Significantly more youth in 2004 were willing or very willing to have a person withbi-polar disorder become a member of their family (81% cf. 57% in 1997).
Slightly fewer youth were willing to have a person with depression become amember of the family than were willing to have a person with any of the otherillnesses focused on in this research become a member.
Compared with the wider study group more youth were unwilling to have a personwith depression become a member of the family (21% cf. 7% overall).
Live with you in your house or flat
There were no differences in the results for youth in 2004 and in 1997.
There were also no differences in attitudes between youth and the wider studygroup.
Accepted as a citizen of New Zealand
There were no differences in the results for youth in 2004 and in 1997.
There were also no differences in attitudes between youth and the wider studygroup.
Work for you
There were no differences in the results for youth in 2004 and in 1997.
Compared with the wider study group fewer youth were willing to have a personwith an anxiety disorder work for them (60% cf. 76% overall).
Work with you
There were no differences in the results for youth in 2004 and in 1997.
There were also no differences in attitudes between youth and the wider studygroup.
Live in a halfway house in your street
Significantly more youth in 2004 were willing or very willing to have a person withschizophrenia live in a halfway house in their street (99% cf. 82% in 1997).

46
Compared with the wider study group more youth were willing to have a personwith schizophrenia live in a halfway house on their street (60% cf. 76% overall).
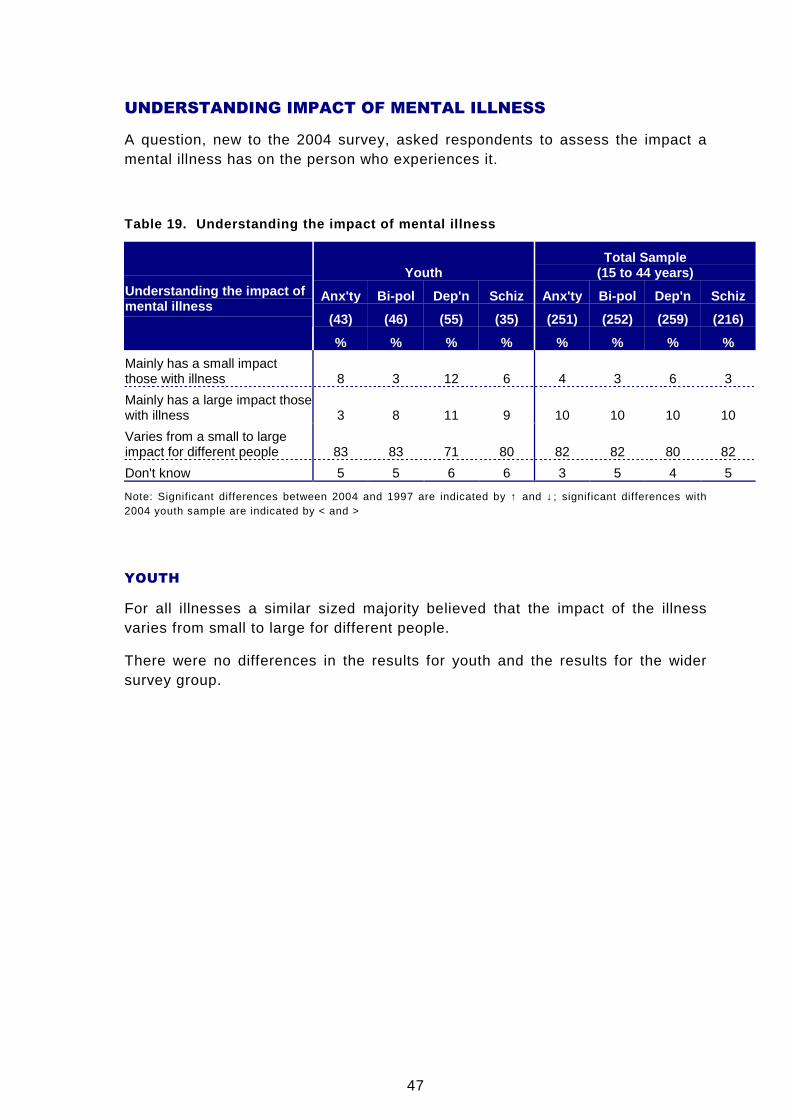
47
UNDERSTANDING IMPACT OF MENTAL ILLNESS
A question, new to the 2004 survey, asked respondents to assess the impact amental illness has on the person who experiences it.
Table 19. Understanding the impact of mental illnes s
YouthTotal Sample
(15 to 44 years)
Anx'ty Bi-pol Dep'n Schiz Anx'ty Bi-pol Dep'n Schiz
(43) (46) (55) (35) (251) (252) (259) (216)
Understanding the impact ofmental illness
% % % % % % % %
Mainly has a small impactthose with illness 8 3 12 6 4 3 6 3
Mainly has a large impact thosewith illness 3 8 11 9 10 10 10 10
Varies from a small to largeimpact for different people 83 83 71 80 82 82 80 82
Don't know 5 5 6 6 3 5 4 5
Note: Significant differences between 2004 and 1997 are indicated by ↑ and ↓; significant differences with2004 youth sample are indicated by < and >
YOUTH
For all illnesses a similar sized majority believed that the impact of the illnessvaries from small to large for different people.
There were no differences in the results for youth and the results for the widersurvey group.
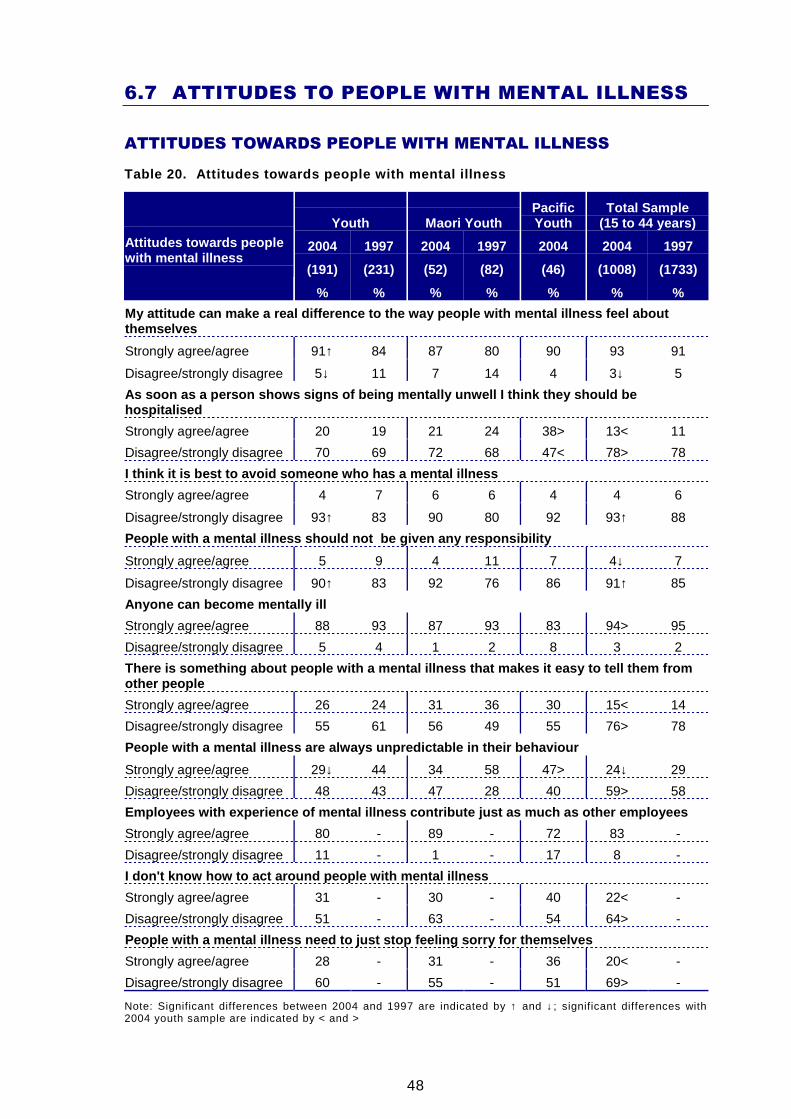
48
6.7 ATTITUDES TO PEOPLE WITH MENTAL ILLNESS
ATTITUDES TOWARDS PEOPLE WITH MENTAL ILLNESS
Table 20. Attitudes towards people with mental illn ess
Youth Maori YouthPacificYouth
Total Sample(15 to 44 years)
2004 1997 2004 1997 2004 2004 1997
(191) (231) (52) (82) (46) (1008) (1733)
Attitudes towards peoplewith mental illness
% % % % % % %
My attitude can make a real difference to the way p eople with mental illness feel aboutthemselves
Strongly agree/agree 91↑ 84 87 80 90 93 91
Disagree/strongly disagree 5↓ 11 7 14 4 3↓ 5
As soon as a person shows signs of being mentally u nwell I think they should behospitalised
Strongly agree/agree 20 19 21 24 38> 13< 11
Disagree/strongly disagree 70 69 72 68 47< 78> 78
I think it is best to avoid someone who has a menta l illness
Strongly agree/agree 4 7 6 6 4 4 6
Disagree/strongly disagree 93↑ 83 90 80 92 93↑ 88
People with a mental illness should not be given a ny responsibility
Strongly agree/agree 5 9 4 11 7 4↓ 7
Disagree/strongly disagree 90↑ 83 92 76 86 91↑ 85
Anyone can become mentally ill
Strongly agree/agree 88 93 87 93 83 94> 95
Disagree/strongly disagree 5 4 1 2 8 3 2
There is something about people with a mental illne ss that makes it easy to tell them fromother people
Strongly agree/agree 26 24 31 36 30 15< 14
Disagree/strongly disagree 55 61 56 49 55 76> 78
People with a mental illness are always unpredictab le in their behaviour
Strongly agree/agree 29↓ 44 34 58 47> 24↓ 29
Disagree/strongly disagree 48 43 47 28 40 59> 58
Employees with experience of mental illness contrib ute just as much as other employees
Strongly agree/agree 80 - 89 - 72 83 -
Disagree/strongly disagree 11 - 1 - 17 8 -
I don't know how to act around people with mental i llness
Strongly agree/agree 31 - 30 - 40 22< -
Disagree/strongly disagree 51 - 63 - 54 64> -
People with a mental illness need to just stop feel ing sorry for themselves
Strongly agree/agree 28 - 31 - 36 20< -
Disagree/strongly disagree 60 - 55 - 51 69> -
Note: Significant differences between 2004 and 1997 are indicated by ↑ and ↓; significant differences with2004 youth sample are indicated by < and >
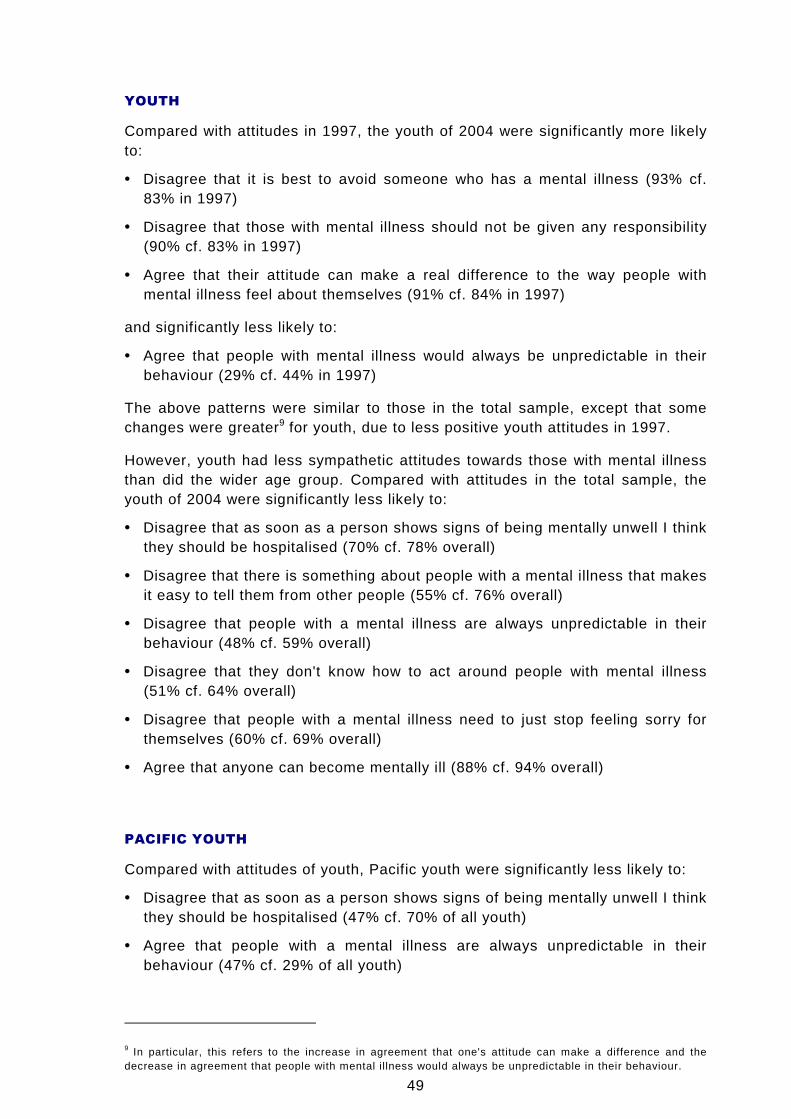
49
YOUTH
Compared with attitudes in 1997, the youth of 2004 were significantly more likelyto:
• Disagree that it is best to avoid someone who has a mental illness (93% cf.83% in 1997)
• Disagree that those with mental illness should not be given any responsibility(90% cf. 83% in 1997)
• Agree that their attitude can make a real difference to the way people withmental illness feel about themselves (91% cf. 84% in 1997)
and significantly less likely to:
• Agree that people with mental illness would always be unpredictable in theirbehaviour (29% cf. 44% in 1997)
The above patterns were similar to those in the total sample, except that somechanges were greater9 for youth, due to less positive youth attitudes in 1997.
However, youth had less sympathetic attitudes towards those with mental illnessthan did the wider age group. Compared with attitudes in the total sample, theyouth of 2004 were significantly less likely to:
• Disagree that as soon as a person shows signs of being mentally unwell I thinkthey should be hospitalised (70% cf. 78% overall)
• Disagree that there is something about people with a mental illness that makesit easy to tell them from other people (55% cf. 76% overall)
• Disagree that people with a mental illness are always unpredictable in theirbehaviour (48% cf. 59% overall)
• Disagree that they don't know how to act around people with mental illness(51% cf. 64% overall)
• Disagree that people with a mental illness need to just stop feeling sorry forthemselves (60% cf. 69% overall)
• Agree that anyone can become mentally ill (88% cf. 94% overall)
PACIFIC YOUTH
Compared with attitudes of youth, Pacific youth were significantly less likely to:
• Disagree that as soon as a person shows signs of being mentally unwell I thinkthey should be hospitalised (47% cf. 70% of all youth)
• Agree that people with a mental illness are always unpredictable in theirbehaviour (47% cf. 29% of all youth)
9 In particular, this refers to the increase in agreement that one's attitude can make a difference and thedecrease in agreement that people with mental illness would always be unpredictable in their behaviour.
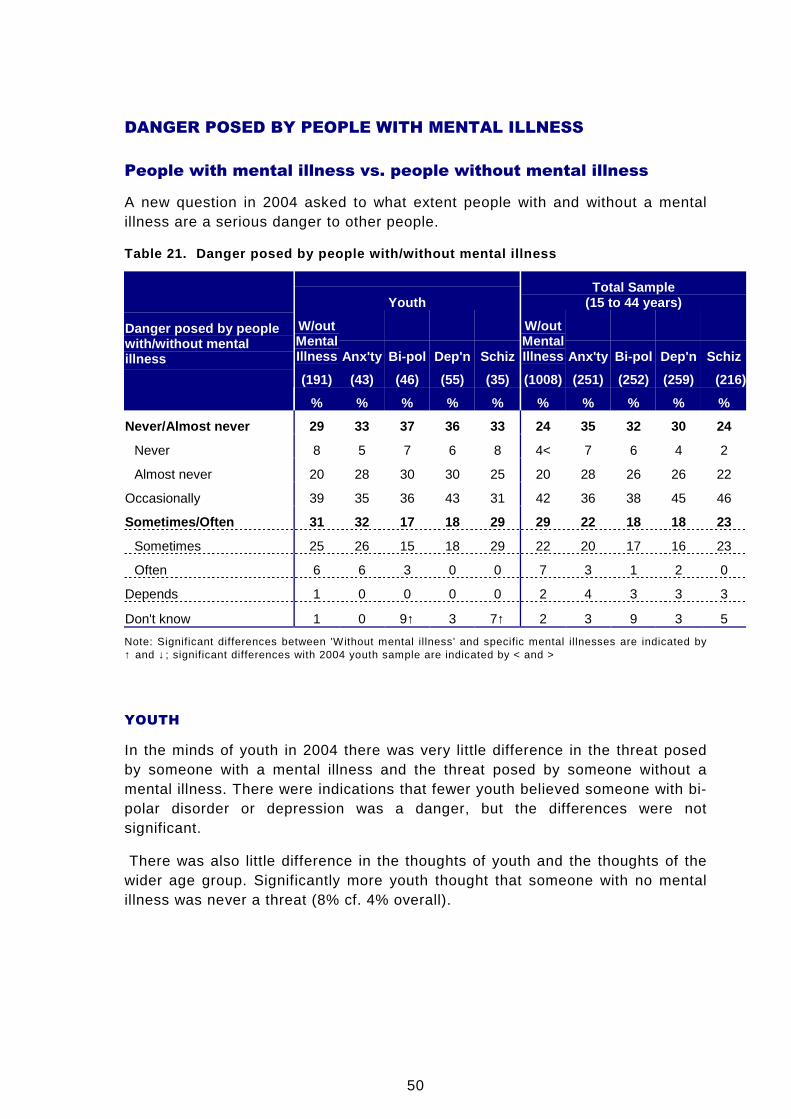
50
DANGER POSED BY PEOPLE WITH MENTAL ILLNESS
People with mental illness vs. people without mental illness
A new question in 2004 asked to what extent people with and without a mentalillness are a serious danger to other people.
Table 21. Danger posed by people with/without menta l illness
YouthTotal Sample
(15 to 44 years)
W/outMentalIllness Anx'ty Bi-pol Dep'n Schiz
W/outMentalIllness Anx'ty Bi-pol Dep'n Schiz
(191) (43) (46) (55) (35) (1008) (251) (252) (259) (216)
Danger posed by peoplewith/without mentalillness
% % % % % % % % % %
Never/Almost never 29 33 37 36 33 24 35 32 30 24
Never 8 5 7 6 8 4< 7 6 4 2
Almost never 20 28 30 30 25 20 28 26 26 22
Occasionally 39 35 36 43 31 42 36 38 45 46
Sometimes/Often 31 32 17 18 29 29 22 18 18 23
Sometimes 25 26 15 18 29 22 20 17 16 23
Often 6 6 3 0 0 7 3 1 2 0
Depends 1 0 0 0 0 2 4 3 3 3
Don't know 1 0 9↑ 3 7↑ 2 3 9 3 5
Note: Significant differences between 'Without mental illness' and specific mental illnesses are indicated by↑ and ↓; significant differences with 2004 youth sample are indicated by < and >
YOUTH
In the minds of youth in 2004 there was very little difference in the threat posedby someone with a mental illness and the threat posed by someone without amental illness. There were indications that fewer youth believed someone with bi-polar disorder or depression was a danger, but the differences were notsignificant.
There was also little difference in the thoughts of youth and the thoughts of thewider age group. Significantly more youth thought that someone with no mentalillness was never a threat (8% cf. 4% overall).
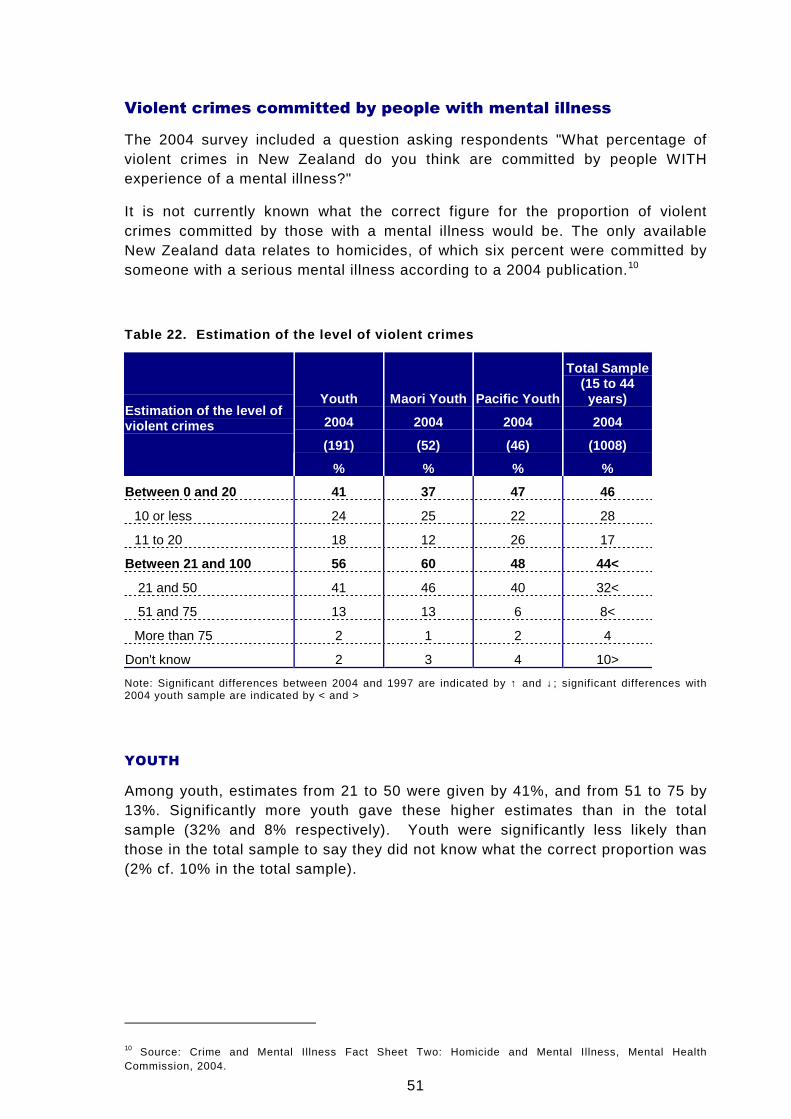
51
Violent crimes committed by people with mental illness
The 2004 survey included a question asking respondents "What percentage ofviolent crimes in New Zealand do you think are committed by people WITHexperience of a mental illness?"
It is not currently known what the correct figure for the proportion of violentcrimes committed by those with a mental illness would be. The only availableNew Zealand data relates to homicides, of which six percent were committed bysomeone with a serious mental illness according to a 2004 publication.10
Table 22. Estimation of the level of violent crimes
Youth Maori Youth Pacific Youth
Total Sample(15 to 44years)
2004 2004 2004 2004
(191) (52) (46) (1008)
Estimation of the level ofviolent crimes
% % % %
Between 0 and 20 41 37 47 46
10 or less 24 25 22 28
11 to 20 18 12 26 17
Between 21 and 100 56 60 48 44<
21 and 50 41 46 40 32<
51 and 75 13 13 6 8<
More than 75 2 1 2 4
Don't know 2 3 4 10>
Note: Significant differences between 2004 and 1997 are indicated by ↑ and ↓; significant differences with2004 youth sample are indicated by < and >
YOUTH
Among youth, estimates from 21 to 50 were given by 41%, and from 51 to 75 by13%. Significantly more youth gave these higher estimates than in the totalsample (32% and 8% respectively). Youth were significantly less likely thanthose in the total sample to say they did not know what the correct proportion was(2% cf. 10% in the total sample).
10 Source: Crime and Mental Illness Fact Sheet Two: Homicide and Mental Illness, Mental HealthCommission, 2004.
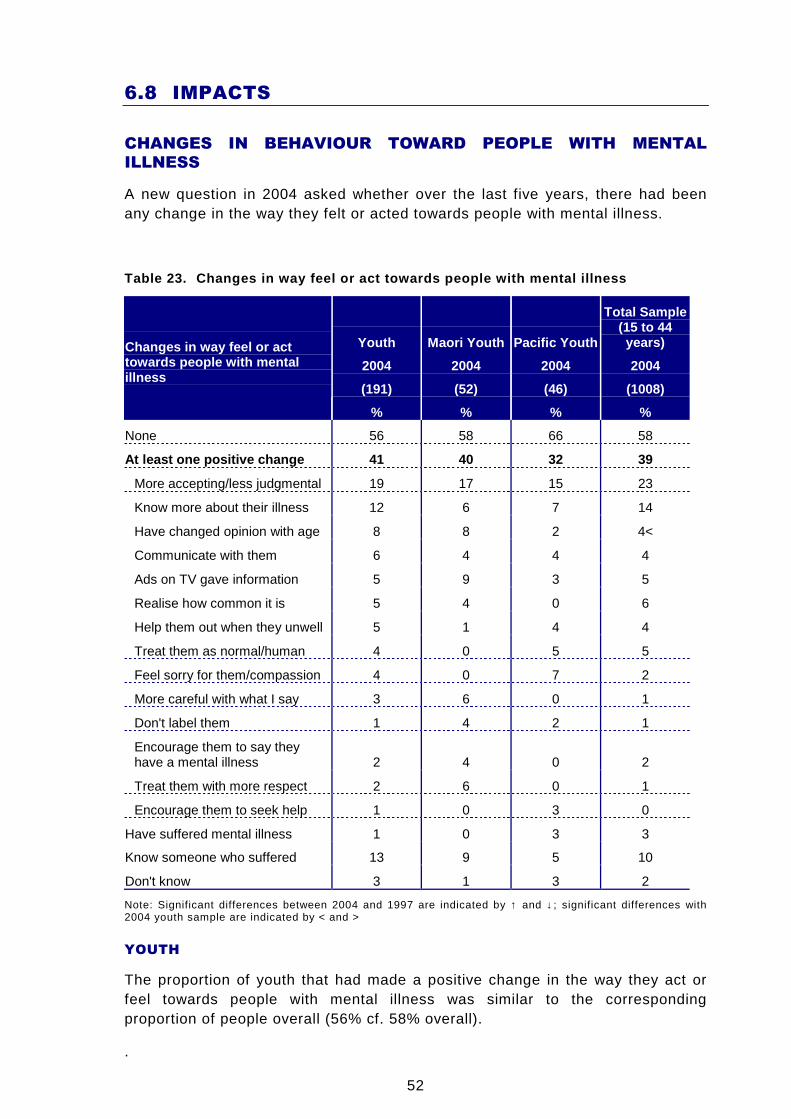
52
6.8 IMPACTS
CHANGES IN BEHAVIOUR TOWARD PEOPLE WITH MENTAL
ILLNESS
A new question in 2004 asked whether over the last five years, there had beenany change in the way they felt or acted towards people with mental illness.
Table 23. Changes in way feel or act towards people with mental illness
Youth Maori Youth Pacific Youth
Total Sample(15 to 44years)
2004 2004 2004 2004
(191) (52) (46) (1008)
Changes in way feel or acttowards people with mentalillness
% % % %
None 56 58 66 58
At least one positive change 41 40 32 39
More accepting/less judgmental 19 17 15 23
Know more about their illness 12 6 7 14
Have changed opinion with age 8 8 2 4<
Communicate with them 6 4 4 4
Ads on TV gave information 5 9 3 5
Realise how common it is 5 4 0 6
Help them out when they unwell 5 1 4 4
Treat them as normal/human 4 0 5 5
Feel sorry for them/compassion 4 0 7 2
More careful with what I say 3 6 0 1
Don't label them 1 4 2 1
Encourage them to say theyhave a mental illness 2 4 0 2
Treat them with more respect 2 6 0 1
Encourage them to seek help 1 0 3 0
Have suffered mental illness 1 0 3 3
Know someone who suffered 13 9 5 10
Don't know 3 1 3 2
Note: Significant differences between 2004 and 1997 are indicated by ↑ and ↓; significant differences with2004 youth sample are indicated by < and >
YOUTH
The proportion of youth that had made a positive change in the way they act orfeel towards people with mental illness was similar to the correspondingproportion of people overall (56% cf. 58% overall).
.
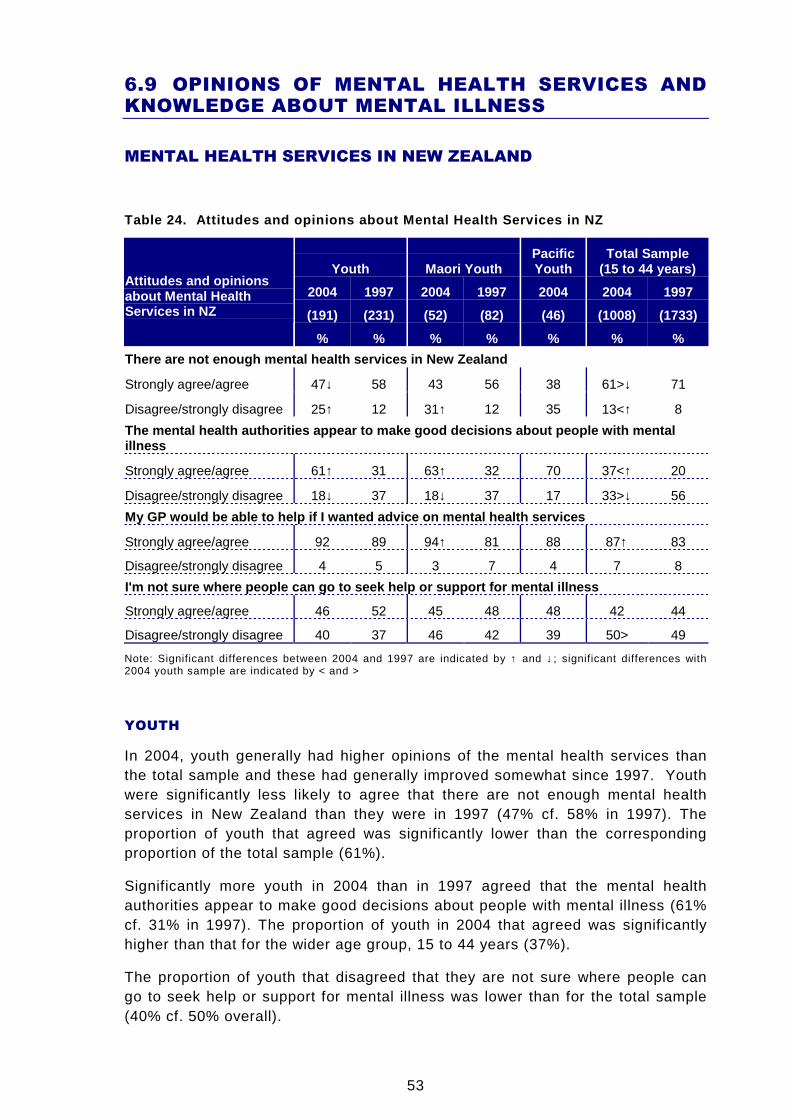
53
6.9 OPINIONS OF MENTAL HEALTH SERVICES ANDKNOWLEDGE ABOUT MENTAL ILLNESS
MENTAL HEALTH SERVICES IN NEW ZEALAND
Table 24. Attitudes and opinions about Mental Healt h Services in NZ
Youth Maori YouthPacificYouth
Total Sample(15 to 44 years)
2004 1997 2004 1997 2004 2004 1997
(191) (231) (52) (82) (46) (1008) (1733)
Attitudes and opinionsabout Mental HealthServices in NZ
% % % % % % %
There are not enough mental health services in New Zealand
Strongly agree/agree 47↓ 58 43 56 38 61>↓ 71
Disagree/strongly disagree 25↑ 12 31↑ 12 35 13<↑ 8
The mental health authorities appear to make good d ecisions about people with mentalillness
Strongly agree/agree 61↑ 31 63↑ 32 70 37<↑ 20
Disagree/strongly disagree 18↓ 37 18↓ 37 17 33>↓ 56
My GP would be able to help if I wanted advice on m ental health services
Strongly agree/agree 92 89 94↑ 81 88 87↑ 83
Disagree/strongly disagree 4 5 3 7 4 7 8
I'm not sure where people can go to seek help or su pport for mental illness
Strongly agree/agree 46 52 45 48 48 42 44
Disagree/strongly disagree 40 37 46 42 39 50> 49
Note: Significant differences between 2004 and 1997 are indicated by ↑ and ↓; significant differences with2004 youth sample are indicated by < and >
YOUTH
In 2004, youth generally had higher opinions of the mental health services thanthe total sample and these had generally improved somewhat since 1997. Youthwere significantly less likely to agree that there are not enough mental healthservices in New Zealand than they were in 1997 (47% cf. 58% in 1997). Theproportion of youth that agreed was significantly lower than the correspondingproportion of the total sample (61%).
Significantly more youth in 2004 than in 1997 agreed that the mental healthauthorities appear to make good decisions about people with mental illness (61%cf. 31% in 1997). The proportion of youth in 2004 that agreed was significantlyhigher than that for the wider age group, 15 to 44 years (37%).
The proportion of youth that disagreed that they are not sure where people cango to seek help or support for mental illness was lower than for the total sample(40% cf. 50% overall).
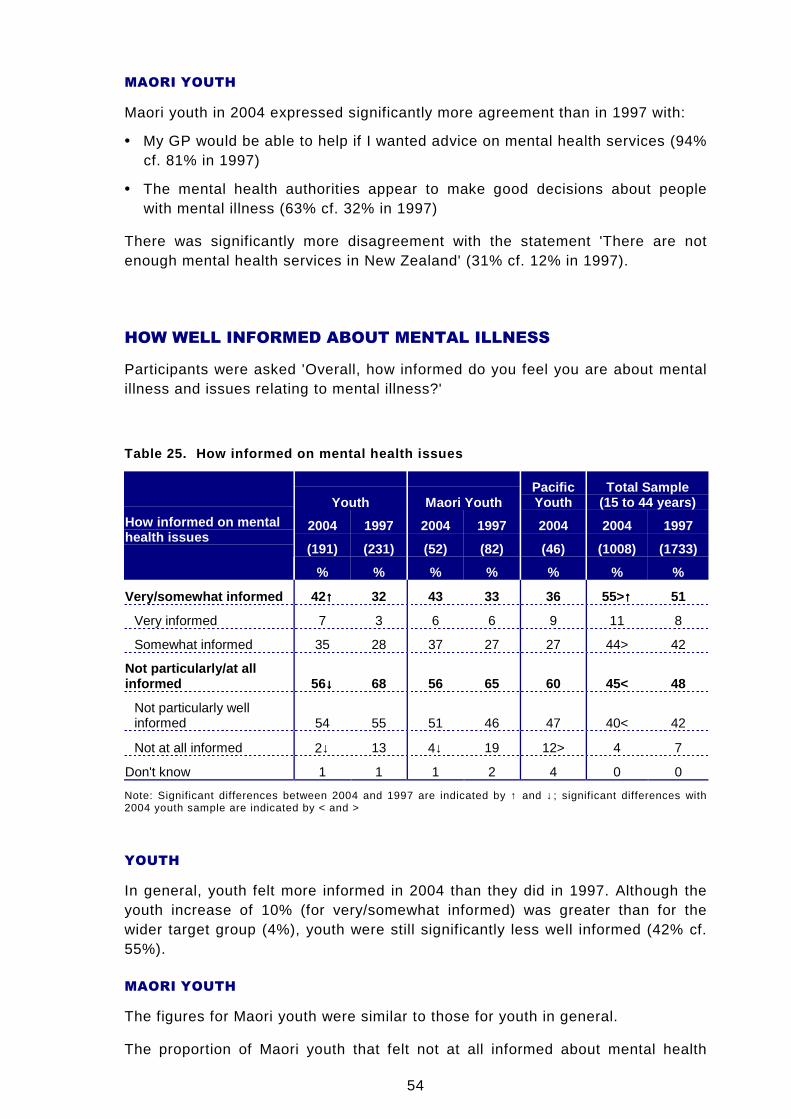
54
MAORI YOUTH
Maori youth in 2004 expressed significantly more agreement than in 1997 with:
• My GP would be able to help if I wanted advice on mental health services (94%cf. 81% in 1997)
• The mental health authorities appear to make good decisions about peoplewith mental illness (63% cf. 32% in 1997)
There was significantly more disagreement with the statement 'There are notenough mental health services in New Zealand' (31% cf. 12% in 1997).
HOW WELL INFORMED ABOUT MENTAL ILLNESS
Participants were asked 'Overall, how informed do you feel you are about mentalillness and issues relating to mental illness?'
Table 25. How informed on mental health issues
Youth Maori YouthPacificYouth
Total Sample(15 to 44 years)
2004 1997 2004 1997 2004 2004 1997
(191) (231) (52) (82) (46) (1008) (1733)
How informed on mentalhealth issues
% % % % % % %
Very/somewhat informed 42 ↑↑↑↑ 32 43 33 36 55>↑↑↑↑ 51
Very informed 7 3 6 6 9 11 8
Somewhat informed 35 28 37 27 27 44> 42
Not particularly/at allinformed 56 ↓↓↓↓ 68 56 65 60 45< 48
Not particularly wellinformed 54 55 51 46 47 40< 42
Not at all informed 2↓ 13 4↓ 19 12> 4 7
Don't know 1 1 1 2 4 0 0
Note: Significant differences between 2004 and 1997 are indicated by ↑ and ↓; significant differences with2004 youth sample are indicated by < and >
YOUTH
In general, youth felt more informed in 2004 than they did in 1997. Although theyouth increase of 10% (for very/somewhat informed) was greater than for thewider target group (4%), youth were still significantly less well informed (42% cf.55%).
MAORI YOUTH
The figures for Maori youth were similar to those for youth in general.
The proportion of Maori youth that felt not at all informed about mental health

55
issues had decreased since 1997 (4% cf. 19% in 1997).
PACIFIC YOUTH
Twelve percent of Pacific youth felt they were not at all informed, which wassignificantly higher than the 2% among youth in general.
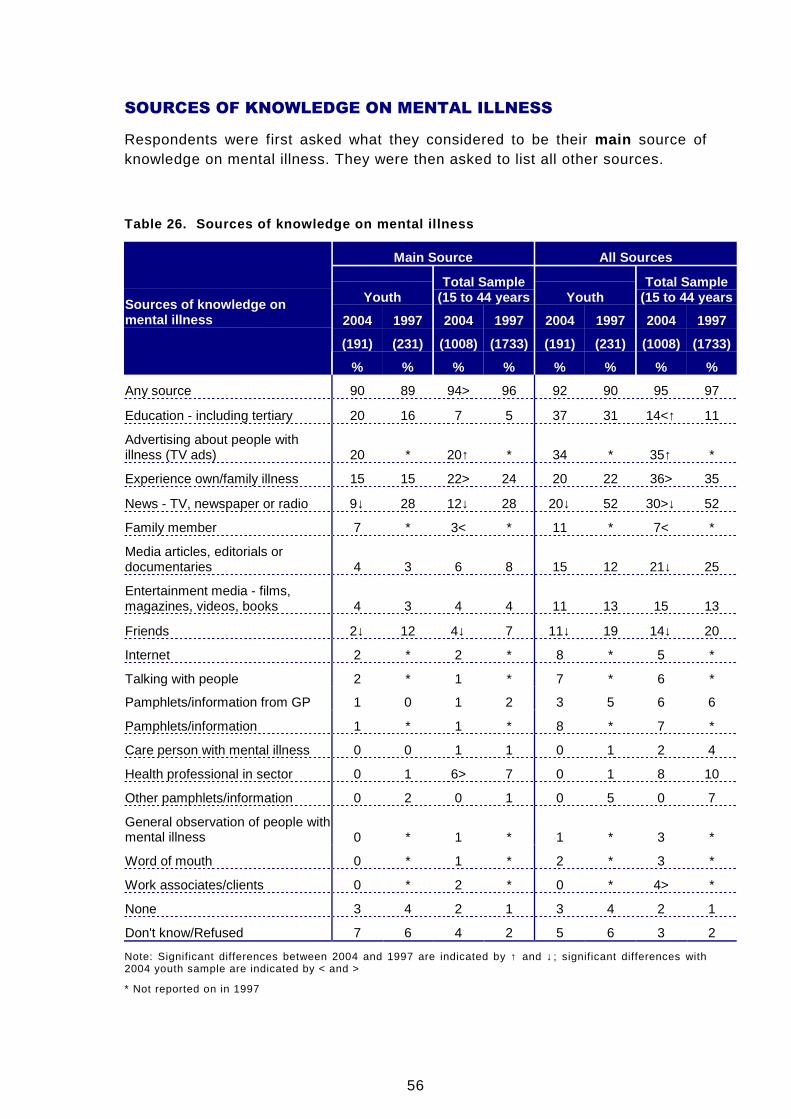
56
SOURCES OF KNOWLEDGE ON MENTAL ILLNESS
Respondents were first asked what they considered to be their main source ofknowledge on mental illness. They were then asked to list all other sources.
Table 26. Sources of knowledge on mental illness
Main Source All Sources
YouthTotal Sample
(15 to 44 years YouthTotal Sample
(15 to 44 years
2004 1997 2004 1997 2004 1997 2004 1997
(191) (231) (1008) (1733) (191) (231) (1008) (1733)
Sources of knowledge onmental illness
% % % % % % % %
Any source 90 89 94> 96 92 90 95 97
Education - including tertiary 20 16 7 5 37 31 14<↑ 11
Advertising about people withillness (TV ads) 20 * 20↑ * 34 * 35↑ *
Experience own/family illness 15 15 22> 24 20 22 36> 35
News - TV, newspaper or radio 9↓ 28 12↓ 28 20↓ 52 30>↓ 52
Family member 7 * 3< * 11 * 7< *
Media articles, editorials ordocumentaries 4 3 6 8 15 12 21↓ 25
Entertainment media - films,magazines, videos, books 4 3 4 4 11 13 15 13
Friends 2↓ 12 4↓ 7 11↓ 19 14↓ 20
Internet 2 * 2 * 8 * 5 *
Talking with people 2 * 1 * 7 * 6 *
Pamphlets/information from GP 1 0 1 2 3 5 6 6
Pamphlets/information 1 * 1 * 8 * 7 *
Care person with mental illness 0 0 1 1 0 1 2 4
Health professional in sector 0 1 6> 7 0 1 8 10
Other pamphlets/information 0 2 0 1 0 5 0 7
General observation of people withmental illness 0 * 1 * 1 * 3 *
Word of mouth 0 * 1 * 2 * 3 *
Work associates/clients 0 * 2 * 0 * 4> *
None 3 4 2 1 3 4 2 1
Don't know/Refused 7 6 4 2 5 6 3 2
Note: Significant differences between 2004 and 1997 are indicated by ↑ and ↓; significant differences with2004 youth sample are indicated by < and >
* Not reported on in 1997
57
YOUTH
Education (including tertiary) was the most mentioned source of knowledge onmental illness for youth. Not surprisingly, given this age group's exposure toeducation in general, the mention of education was higher than for the widertarget group of all 15 to 44 year olds (37% for youth cf. 14% for total sample).
With the emergence of the Like Minds Like Mine campaign after 1997, advertisingabout people with mental illness was one of the more common sources ofknowledge in 2004. The youth level of 34% was similar to that for the totalsample (35%).
Broadcast and print news media were mentioned as sources of knowledge onmental illness in 2004 significantly less frequently than in 1997 (20% cf. 52% in1997, all sources). While there was also some corresponding decrease in thetotal sample, the greater youth decrease has resulted in a significantly lower2004 level than for the total sample (20% cf. 30% total sample).
Friends have also become a less common knowledge source since 1997 (11% cf.19% in 1997).
Personal experience of mental illness was mentioned by more in the wider agegroup than by youth in 2004 (36% cf. 20%).
Youth said a family member is a knowledge source more often than peopleoverall in 2004 (11% cf. 7% overall).
MAORI YOUTH
Eighty-three percent of Maori youth mentioned at least one source of knowledge,which was slightly lower than the total sample (92%), but not significantly.
PACIFIC YOUTH
For Pacific youth, 80% named one or more sources of knowledge, significantlylower than the total sample (92%).
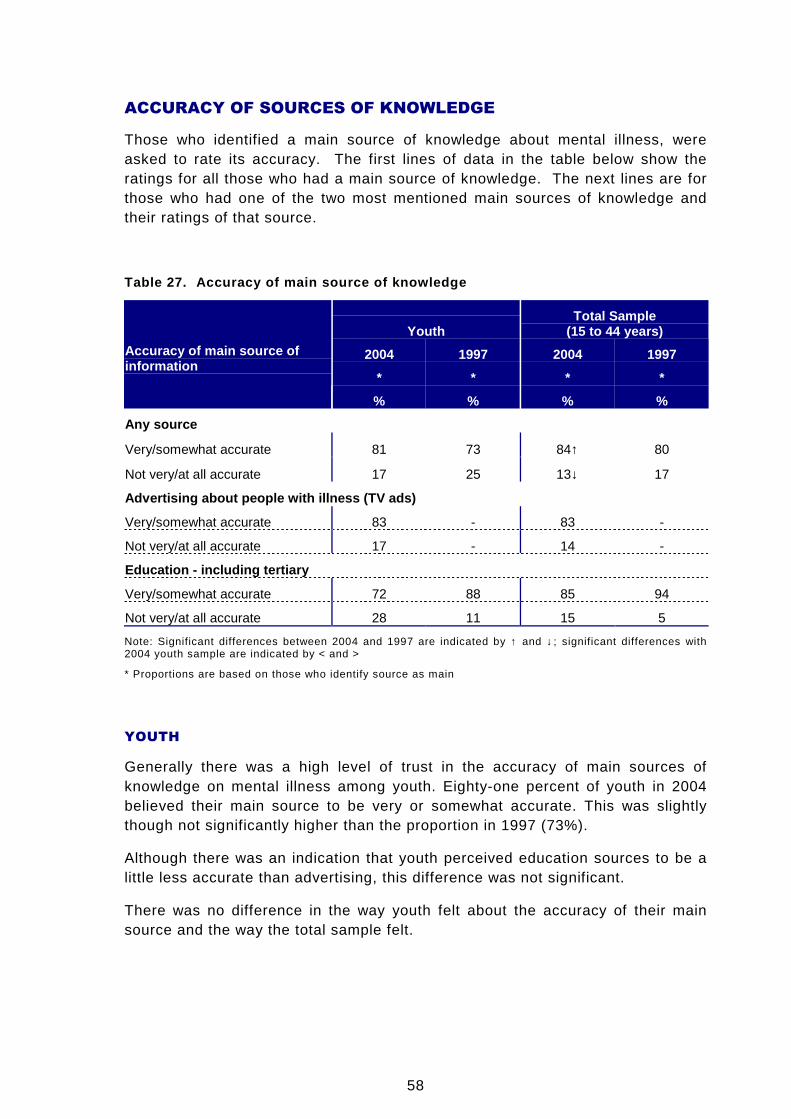
58
ACCURACY OF SOURCES OF KNOWLEDGE
Those who identified a main source of knowledge about mental illness, wereasked to rate its accuracy. The first lines of data in the table below show theratings for all those who had a main source of knowledge. The next lines are forthose who had one of the two most mentioned main sources of knowledge andtheir ratings of that source.
Table 27. Accuracy of main source of knowledge
YouthTotal Sample
(15 to 44 years)
2004 1997 2004 1997
* * * *
Accuracy of main source ofinformation
% % % %
Any source
Very/somewhat accurate 81 73 84↑ 80
Not very/at all accurate 17 25 13↓ 17
Advertising about people with illness (TV ads)
Very/somewhat accurate 83 - 83 -
Not very/at all accurate 17 - 14 -
Education - including tertiary
Very/somewhat accurate 72 88 85 94
Not very/at all accurate 28 11 15 5
Note: Significant differences between 2004 and 1997 are indicated by ↑ and ↓; significant differences with2004 youth sample are indicated by < and >
* Proportions are based on those who identify source as main
YOUTH
Generally there was a high level of trust in the accuracy of main sources ofknowledge on mental illness among youth. Eighty-one percent of youth in 2004believed their main source to be very or somewhat accurate. This was slightlythough not significantly higher than the proportion in 1997 (73%).
Although there was an indication that youth perceived education sources to be alittle less accurate than advertising, this difference was not significant.
There was no difference in the way youth felt about the accuracy of their mainsource and the way the total sample felt.
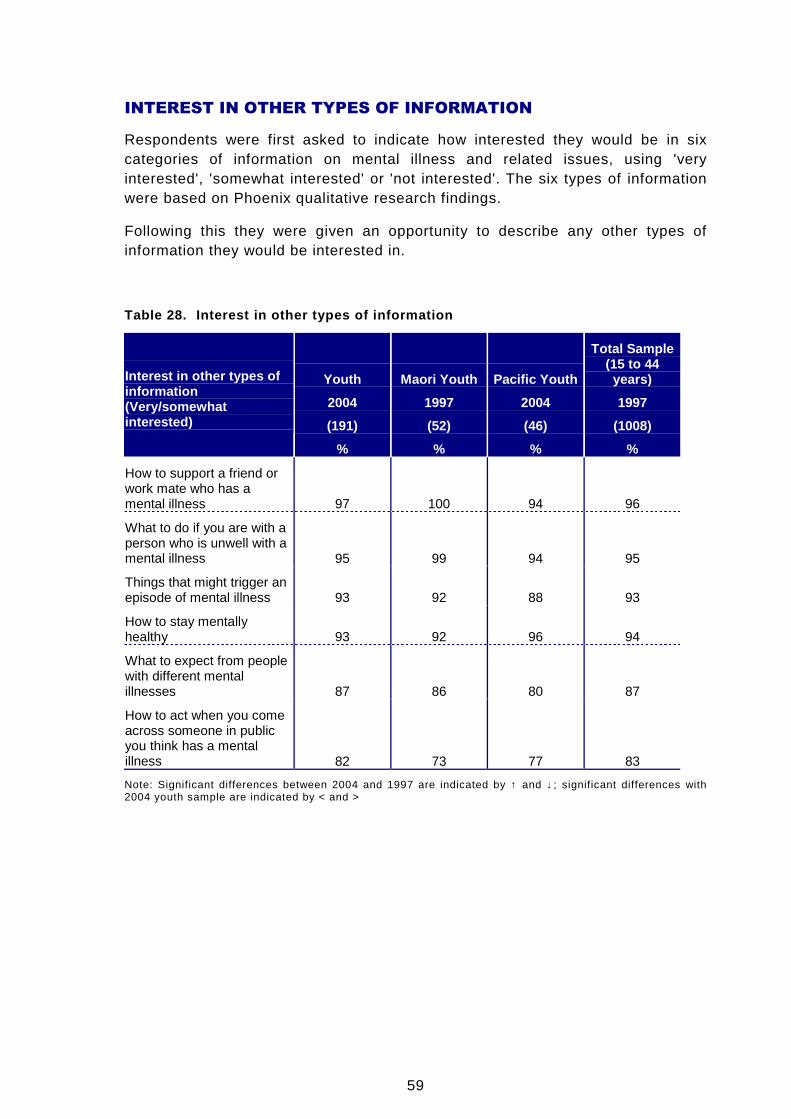
59
INTEREST IN OTHER TYPES OF INFORMATION
Respondents were first asked to indicate how interested they would be in sixcategories of information on mental illness and related issues, using 'veryinterested', 'somewhat interested' or 'not interested'. The six types of informationwere based on Phoenix qualitative research findings.
Following this they were given an opportunity to describe any other types ofinformation they would be interested in.
Table 28. Interest in other types of information
Youth Maori Youth Pacific Youth
Total Sample(15 to 44years)
2004 1997 2004 1997
(191) (52) (46) (1008)
Interest in other types ofinformation(Very/somewhatinterested)
% % % %
How to support a friend orwork mate who has amental illness 97 100 94 96
What to do if you are with aperson who is unwell with amental illness 95 99 94 95
Things that might trigger anepisode of mental illness 93 92 88 93
How to stay mentallyhealthy 93 92 96 94
What to expect from peoplewith different mentalillnesses 87 86 80 87
How to act when you comeacross someone in publicyou think has a mentalillness 82 73 77 83
Note: Significant differences between 2004 and 1997 are indicated by ↑ and ↓; significant differences with2004 youth sample are indicated by < and >
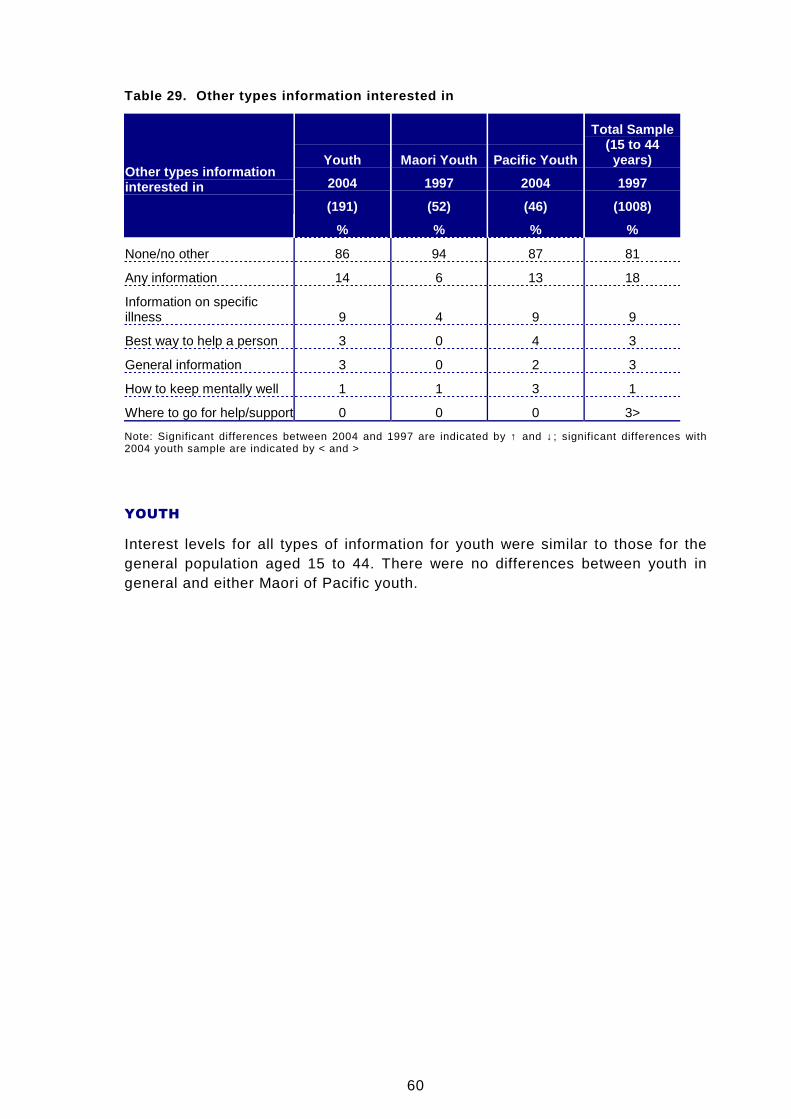
60
Table 29. Other types information interested in
Youth Maori Youth Pacific Youth
Total Sample(15 to 44years)
2004 1997 2004 1997
(191) (52) (46) (1008)
Other types informationinterested in
% % % %
None/no other 86 94 87 81
Any information 14 6 13 18
Information on specificillness 9 4 9 9
Best way to help a person 3 0 4 3
General information 3 0 2 3
How to keep mentally well 1 1 3 1
Where to go for help/support 0 0 0 3>
Note: Significant differences between 2004 and 1997 are indicated by ↑ and ↓; significant differences with2004 youth sample are indicated by < and >
YOUTH
Interest levels for all types of information for youth were similar to those for thegeneral population aged 15 to 44. There were no differences between youth ingeneral and either Maori of Pacific youth.