Embed Size (px)
Citation preview
Youth Needs In the Post School Education System
Trying to Get a Better Picture of the Current Institutional & Conceptual
Exclusion of Youth
Pyramids & Calabashes
Nico Cloete4th March 08
..........................................................................
..........................................................................
“Information Contributors”
• Ian Bunting DoE (Higher Education)
• Ben Parker SAQA (Research)
• Penny Vinjevoldt DoE (FET)
• Jo Muller (UCT)
• Rosa Dias & Dorrit Posel (UKZN & DPRU)
• Teboho Moja (New York University)
• Febe Potgieter (Foreign Affairs and HSRC Research Group)
..........................................................................
Advantages of Differentiation
(Birnbaum, 1983; Van Vught, 2007)
1. Strategy to meet student needs, and improve success from diverse backgrounds
2. Diversity provides for social mobility – equity, choices changes, different horizons
3. Respond to diverse needs of an increasingly diverse labour market
4. Respond to political needs of different interest groups
Advantages of Differentiation (2)
5. Permits the combination of an elite and a mass system
6. Improves efficiency through mission focus
7. Encourages experimentation
8. Modern Knowledge Economies underpinned by differentiated mass systems
Research Evidence(Reviewed Van Vught, 2007)
1. Remarkably limited empirical research
2. Main determinants are governmental regulation and academic norms and values
3. All studies point to de-differentiation, even in US system
4. Government legislation can defend existing
differentiation
5. Government steering (mergers) promote homogenisation
6. Strong academic cultures defend/promote existing status
7. Weak academic cultures try to mimic the strong
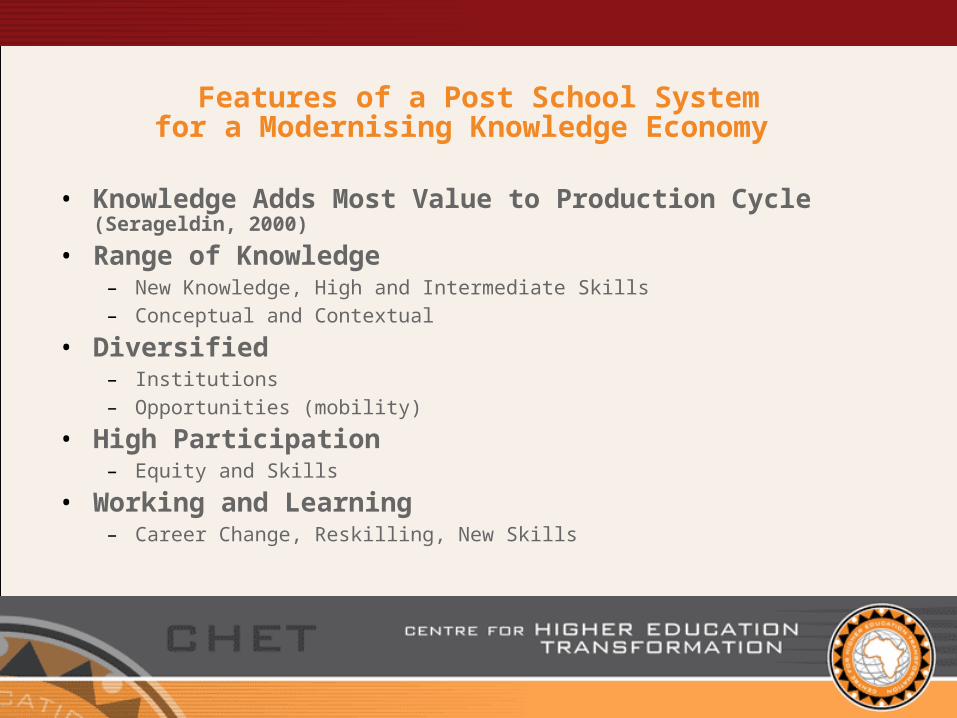
Features of a Post School Systemfor a Modernising Knowledge Economy
• Knowledge Adds Most Value to Production Cycle (Serageldin, 2000)
• Range of Knowledge – New Knowledge, High and Intermediate Skills– Conceptual and Contextual
• Diversified– Institutions – Opportunities (mobility)
• High Participation– Equity and Skills
• Working and Learning– Career Change, Reskilling, New Skills
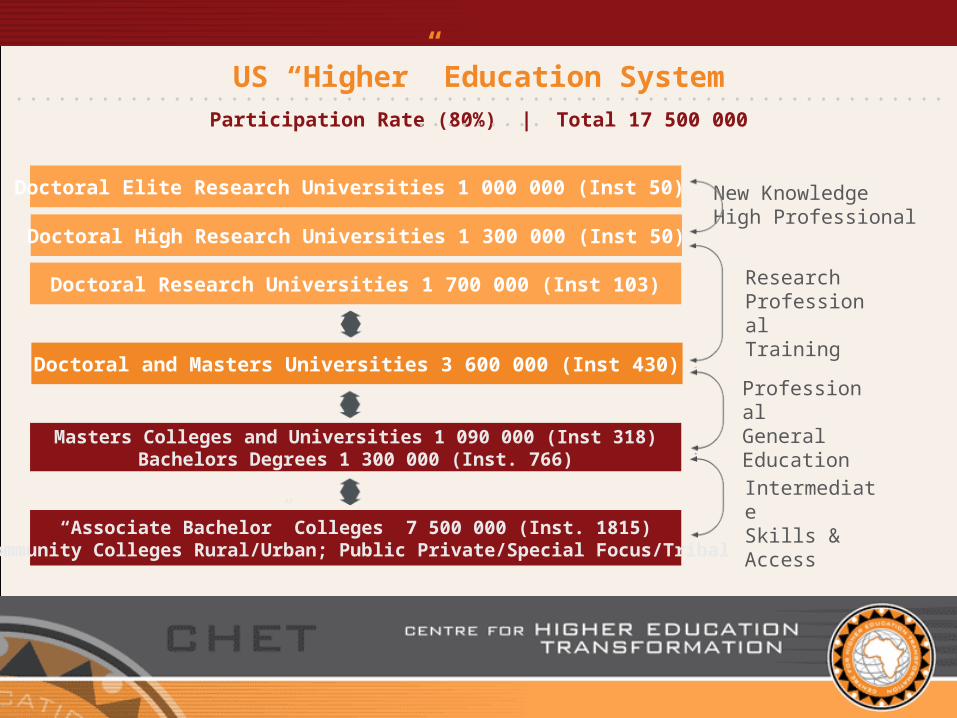
US “Higher” Education SystemParticipation Rate (80%) | Total 17 500 000
“Associate Bachelor” Colleges 7 500 000 (Inst. 1815)Community Colleges Rural/Urban; Public Private/Special Focus/Tribal
Masters Colleges and Universities 1 090 000 (Inst 318)Bachelors Degrees 1 300 000 (Inst. 766)
Doctoral and Masters Universities 3 600 000 (Inst 430)
Doctoral Research Universities 1 700 000 (Inst 103)
Doctoral High Research Universities 1 300 000 (Inst 50)
Doctoral Elite Research Universities 1 000 000 (Inst 50) New KnowledgeHigh Professional
ResearchProfessionalTraining
ProfessionalGeneralEducation
IntermediateSkills & Access
..........................................................................
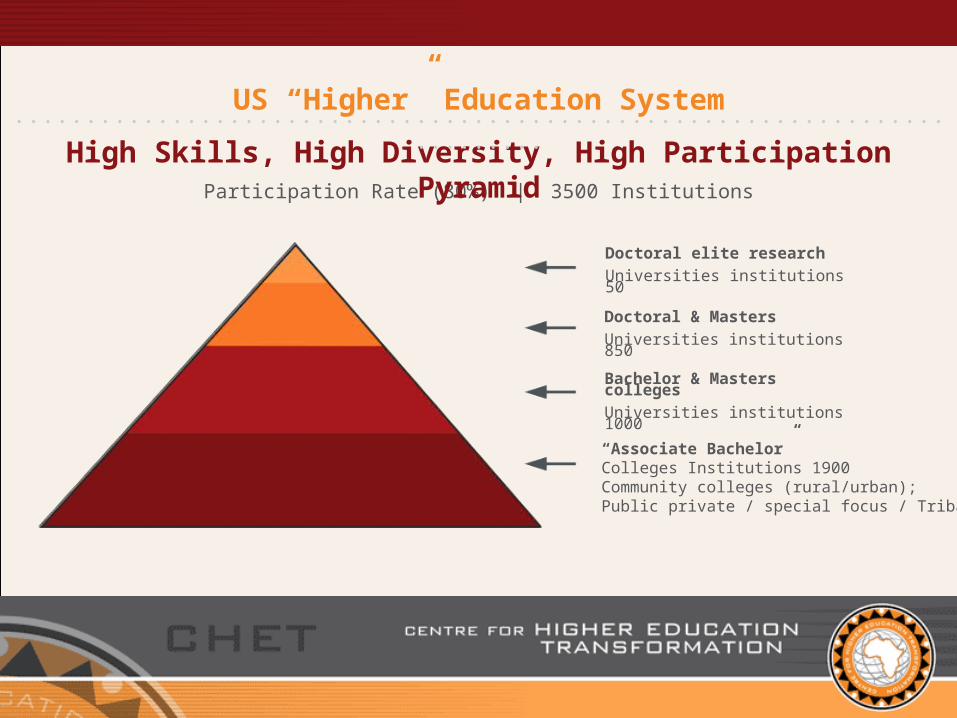
US “Higher” Education System
Participation Rate (80%) | 3500 Institutions
High Skills, High Diversity, High Participation Pyramid
“Associate Bachelor” Colleges Institutions 1900Community colleges (rural/urban); Public private / special focus / Tribal
..........................................................................
Doctoral elite research Universities institutions 50
Doctoral & Masters Universities institutions 850
Bachelor & Masters colleges Universities institutions 1000
Ideology of the Calabash
Ukhamba (Nguni word)• Unity & Teamwork• Replenishment• Knowledge and wisdom• Self-sacrifice• No individual may drink alone • Even a California Transformation Movement
called Calabash
..........................................................................
Post Colonial / Apartheid Inheritance
• Designed for a “Subaltern Class”
• Marked Most Students as Failures
• Only a Few Could Lead
• Limit Access to Further Education in Africa
– (John Gay in Higher Education in Europe, vol 30, 2005)
• A Hard Boundary Between Contextual & Conceptual Knowledge (Jo Muller)
– Lack of a combination of conceptual and contextual knowledge undermines the false promises of NQF
..........................................................................
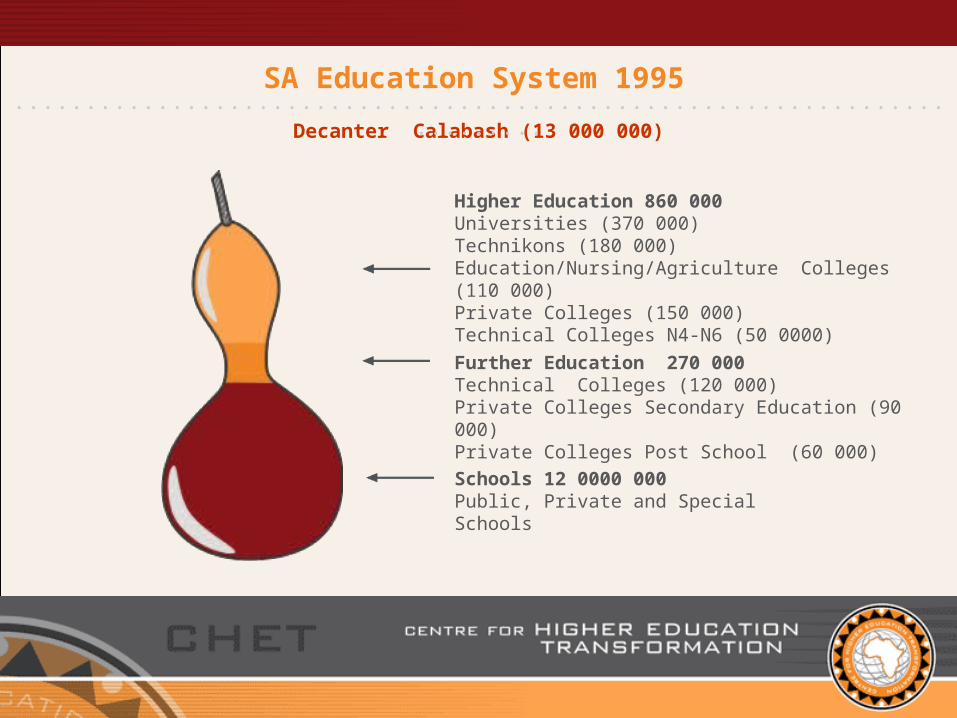
SA Education System 1995
Decanter Calabash (13 000 000)
Higher Education 860 000Universities (370 000)Technikons (180 000)Education/Nursing/Agriculture Colleges (110 000)Private Colleges (150 000)Technical Colleges N4-N6 (50 0000)
Further Education 270 000Technical Colleges (120 000)Private Colleges Secondary Education (90 000)Private Colleges Post School (60 000)
Schools 12 0000 000 Public, Private and Special Schools
..........................................................................
A Post Apartheid Framework
• NCHE (1996)
– Increased Participation, Greater Responsiveness, Increased Cooperation
– Redress and Massification Necessary for Equity and Development
• White Paper 1997
– Planned Growth, Limit College Sector
• Higher Education Plan (2001)
– Mergers, Enrolment Planning, Efficiency, Shape of System
..........................................................................
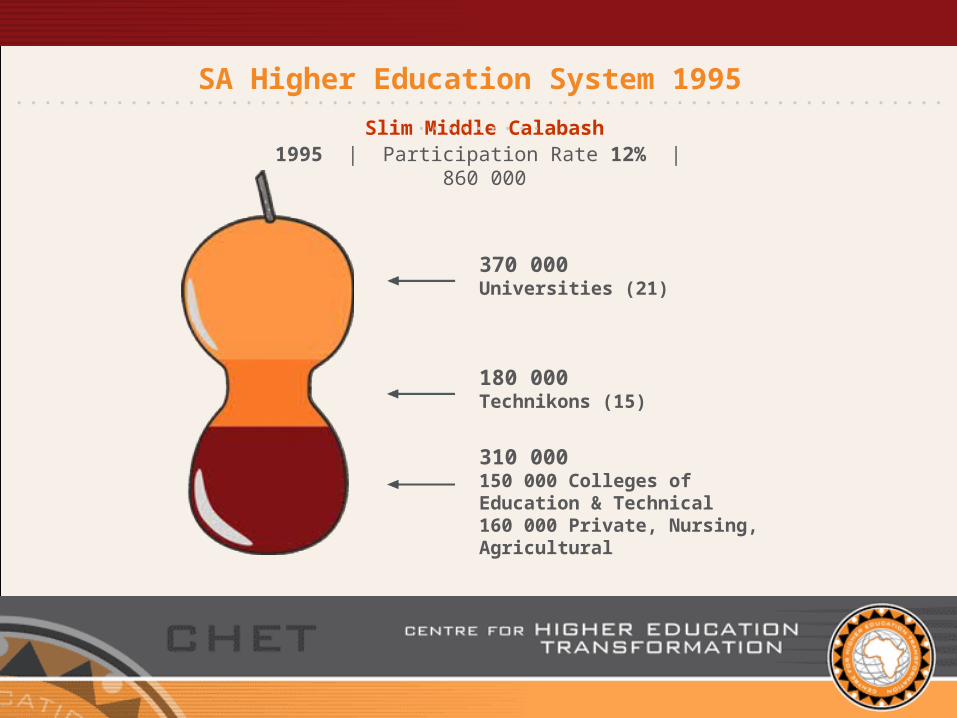
SA Higher Education System 1995
1995 | Participation Rate 12% | 860 000Slim Middle Calabash
370 000Universities (21)
180 000Technikons (15)
310 000150 000 Colleges of Education & Technical160 000 Private, Nursing, Agricultural
..........................................................................
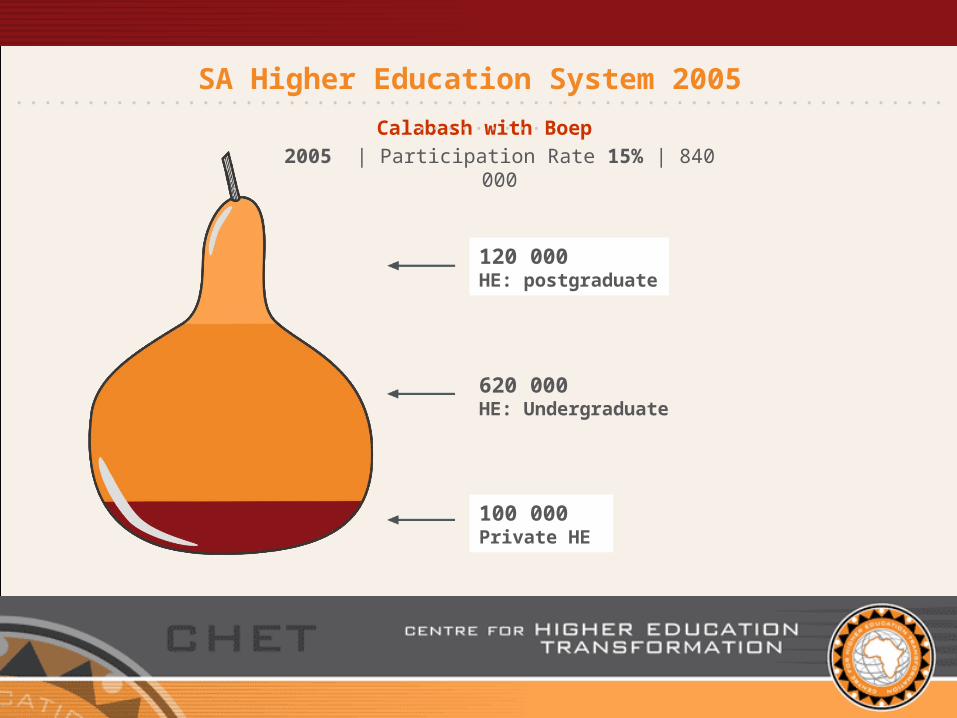
SA Higher Education System 2005
2005 | Participation Rate 15% | 840 000
Calabash with Boep
120 000HE: postgraduate
620 000HE: Undergraduate
100 000Private HE
..........................................................................
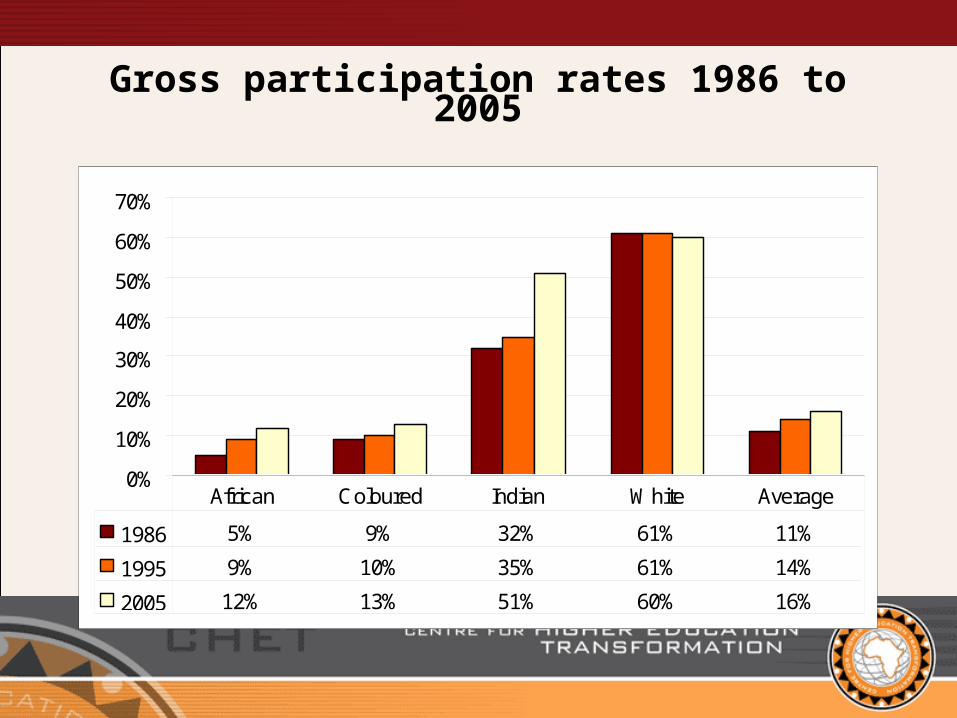
Gross participation rates 1986 to 2005
0%
10%
20%
30%
40%
50%
60%
70%
1986 5% 9% 32% 61% 11%
1995 9% 10% 35% 61% 14%
2005 12% 13% 51% 60% 16%
African Coloured Indian White Average
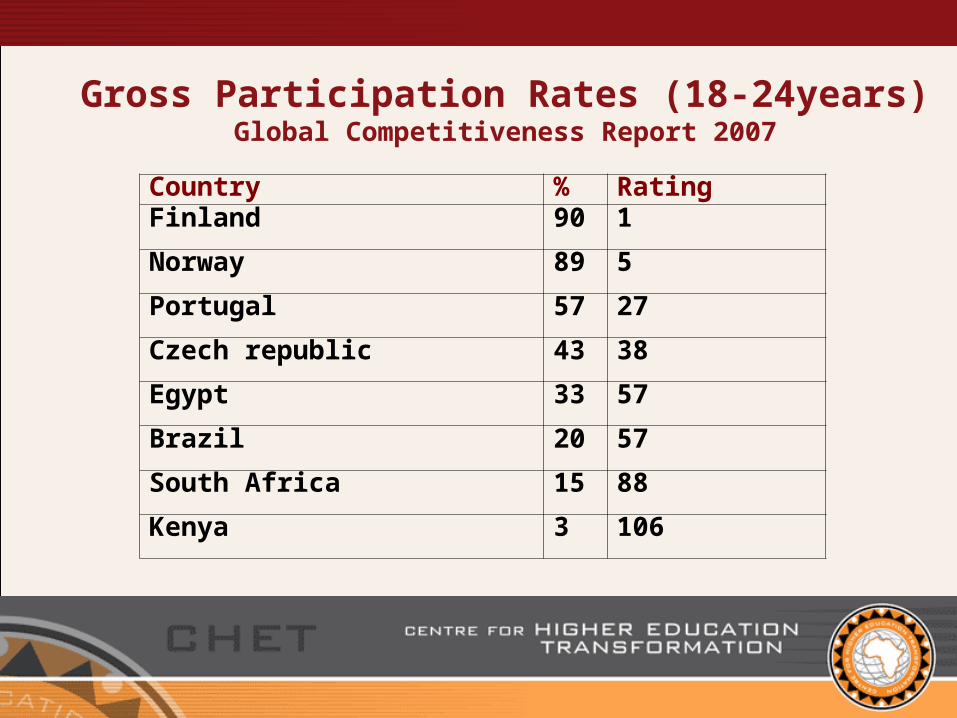
Gross Participation Rates (18-24years)Global Competitiveness Report 2007
Country % RatingFinland 90 1
Norway 89 5
Portugal 57 27
Czech republic 43 38
Egypt 33 57
Brazil 20 57
South Africa 15 88
Kenya 3 106
Problems of the Well Rounded Calabash
• Limited Range of Knowledge
• Institutions Differentiated According to Quality, not Range of Offerings (Venda & UCT)
• Lack of Mobility
• Education as a series of “life” (opportunity) sentences
• Pressure for Access will Build to an “Africa Option”
• Overcrowding, not massification
• Shortage of High and Intermediate Skills
• Narrow Elite Formation (mirror BEE)
• System Designed for Social Exclusion, Not for a Knowledge Economy
..........................................................................
Social Exclusion by the Shape of the System
• Single Biggest Problem is the ”Vacuum” between “Post School” & University
• This is where the greatest Social Exclusion occurs and is a direct cause of the
Intermediate Skills Crisis (See Simkins and Embargoed DoE report, 2008)
• The “Double Move” of abandoning a Public College System & imposing
“impossible” conditions on a Private College system must rate with Aids
Denialism as two of the most pernicious policies in the new South Africa
• The extent of the problem is much more difficult to determine than HIV infection
rates or electricity shortages
• Discrete data systems and the failure of “state” research agencies.
..........................................................................
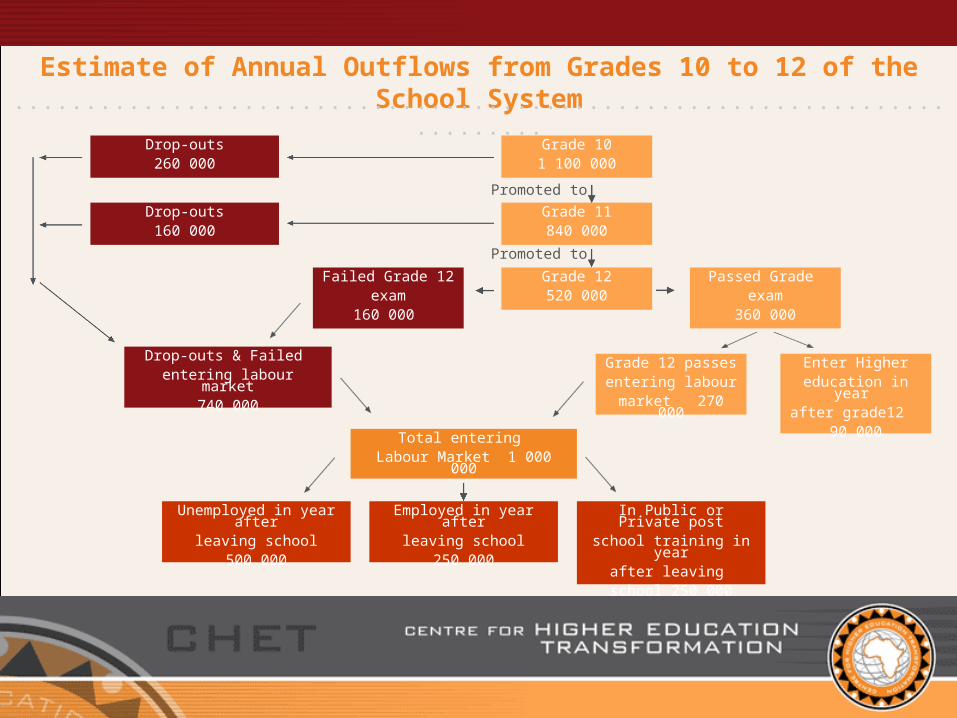
Estimate of Annual Outflows from Grades 10 to 12 of the School System
Grade 101 100 000
Passed Grade exam
360 000
Grade 11840 000
Grade 12520 000
Enter Highereducation in year
after grade12 90 000
Grade 12 passesentering labour
market 270 000
Total entering Labour Market 1 000 000
In Public or Private postschool training in year
after leaving school 250 000
Employed in year afterleaving school
250 000
Unemployed in year afterleaving school
500 000
Drop-outs & Failed entering labour market
740 000
Drop-outs160 000
Failed Grade 12exam
160 000
Drop-outs260 000
Promoted to
Promoted to
..........................................................................
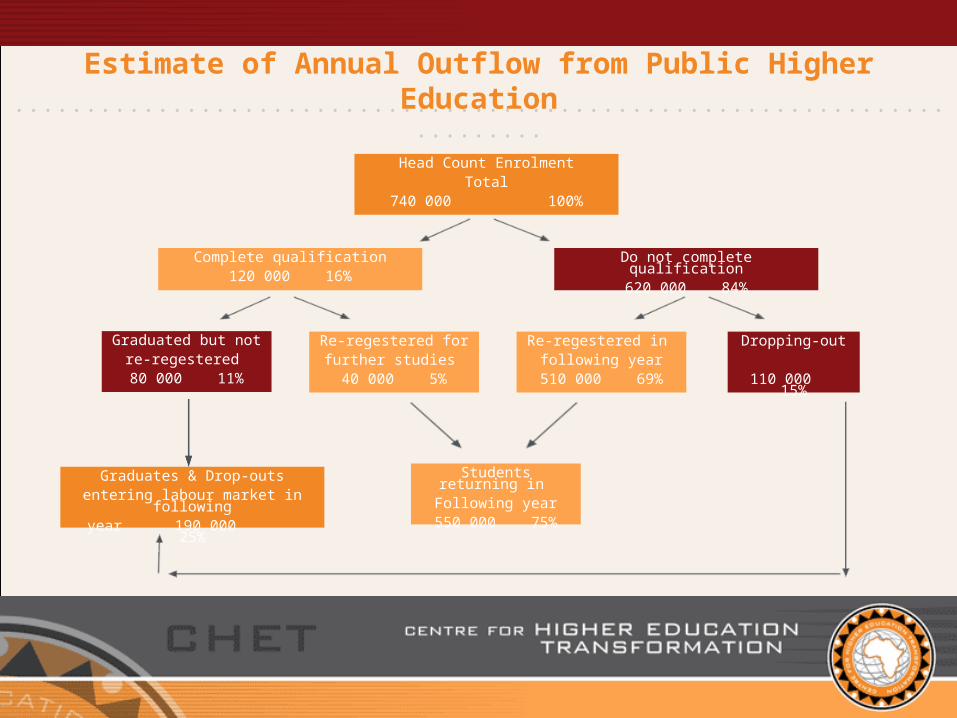
Estimate of Annual Outflow from Public Higher Education
Head Count EnrolmentTotal
740 000 100%
Complete qualification120 000 16%
Do not complete qualification620 000 84%
Graduated but notre-regestered 80 000 11%
Re-regestered for further studies 40 000 5%
Re-regestered in following year
510 000 69%
Dropping-out
110 000 15%
Graduates & Drop-outsentering labour market in following
year 190 000 25%
Students returning in Following year550 000 75%
..........................................................................
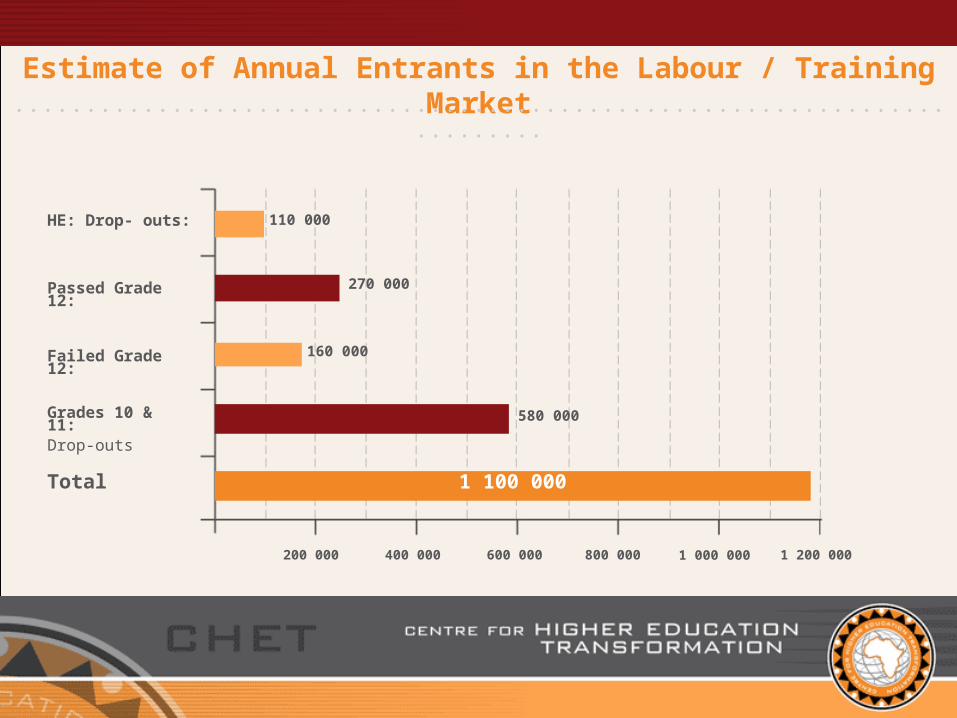
Estimate of Annual Entrants in the Labour / Training Market
Total
Grades 10 & 11:Drop-outs
Failed Grade 12:
Passed Grade 12:
HE: Drop- outs:
200 000 400 000 600 000 800 000 1 000 000 1 200 000
1 100 000
110 000
270 000
580 000
160 000
..........................................................................
Questions..........................................................................
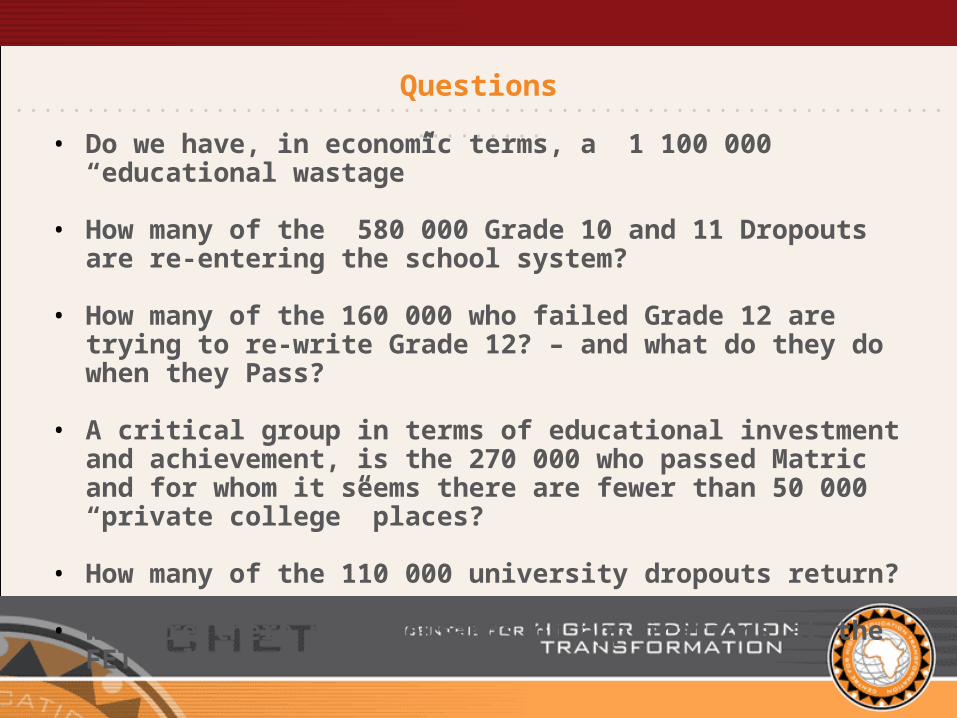
• Do we have, in economic terms, a 1 100 000 “educational wastage”
• How many of the 580 000 Grade 10 and 11 Dropouts are re-entering the school system?
• How many of the 160 000 who failed Grade 12 are trying to re-write Grade 12? – and what do they do when they Pass?
• A critical group in terms of educational investment and achievement, is the 270 000 who passed Matric and for whom it seems there are fewer than 50 000 “private college” places?
• How many of the 110 000 university dropouts return?
• Why are there not Thousands of applications at the FET colleges?
Some Obvious Steps (1)..........................................................................
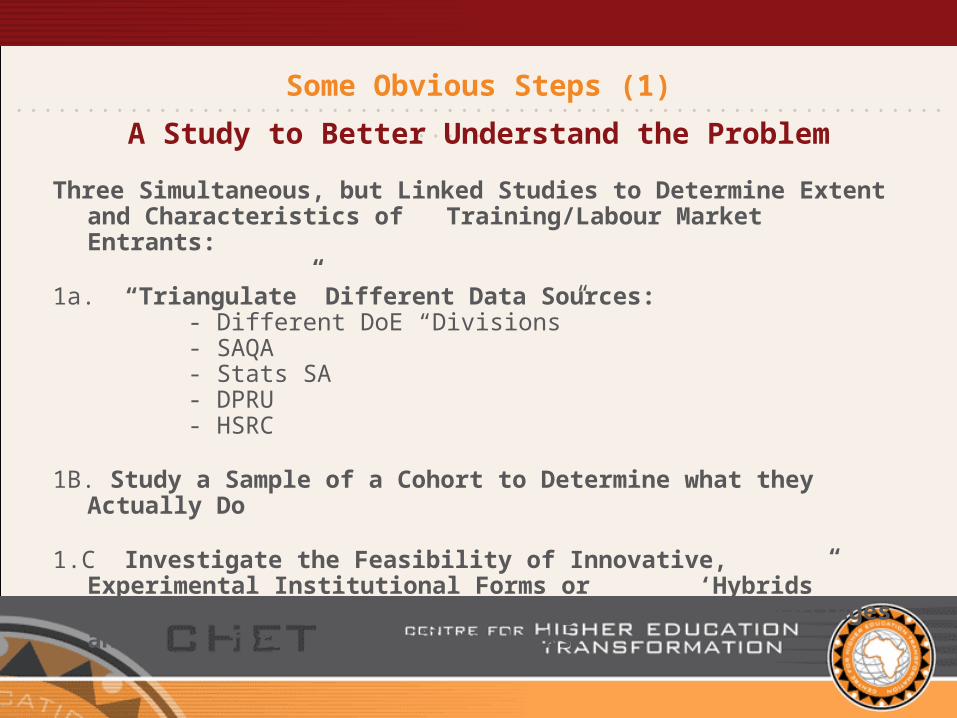
Three Simultaneous, but Linked Studies to Determine Extent and Characteristics of Training/Labour Market Entrants:
1a. “Triangulate” Different Data Sources: - Different DoE “Divisions” - SAQA - Stats SA - DPRU - HSRC
1B. Study a Sample of a Cohort to Determine what they Actually Do
1.C Investigate the Feasibility of Innovative, Experimental Institutional Forms or ‘Hybrids” that will strengthen academic programmes at FET colleges and forge new mobility links.
A Study to Better Understand the Problem
Some Obvious Steps (2)..........................................................................
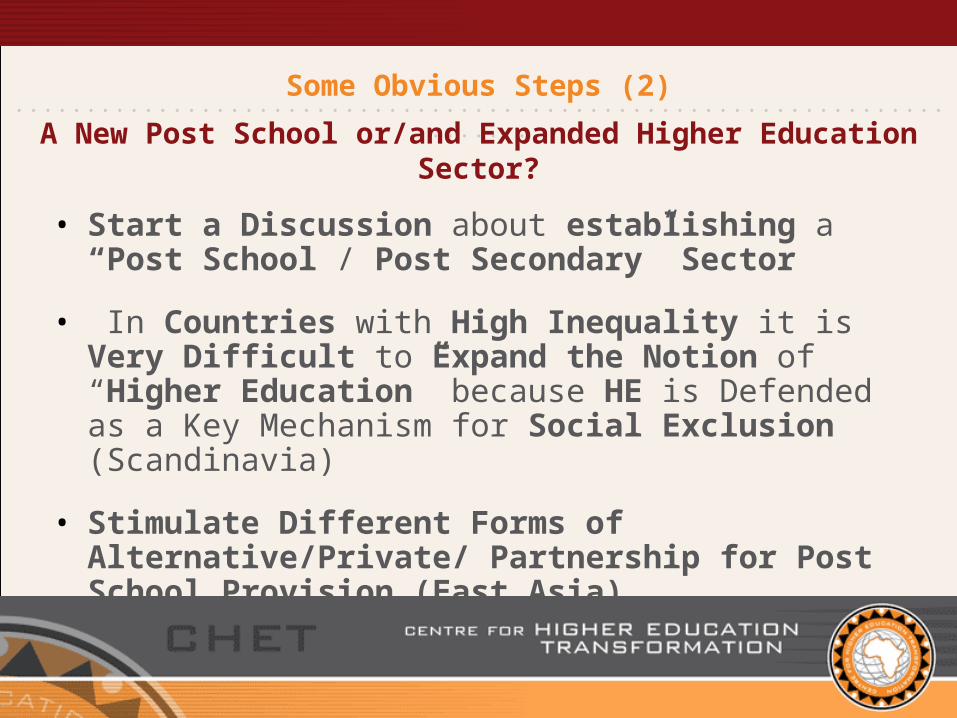
• Start a Discussion about establishing a “Post School / Post Secondary” Sector
• In Countries with High Inequality it is Very Difficult to Expand the Notion of “Higher Education” because HE is Defended as a Key Mechanism for Social Exclusion (Scandinavia)
• Stimulate Different Forms of Alternative/Private/ Partnership for Post School Provision (East Asia)
A New Post School or/and Expanded Higher Education Sector?
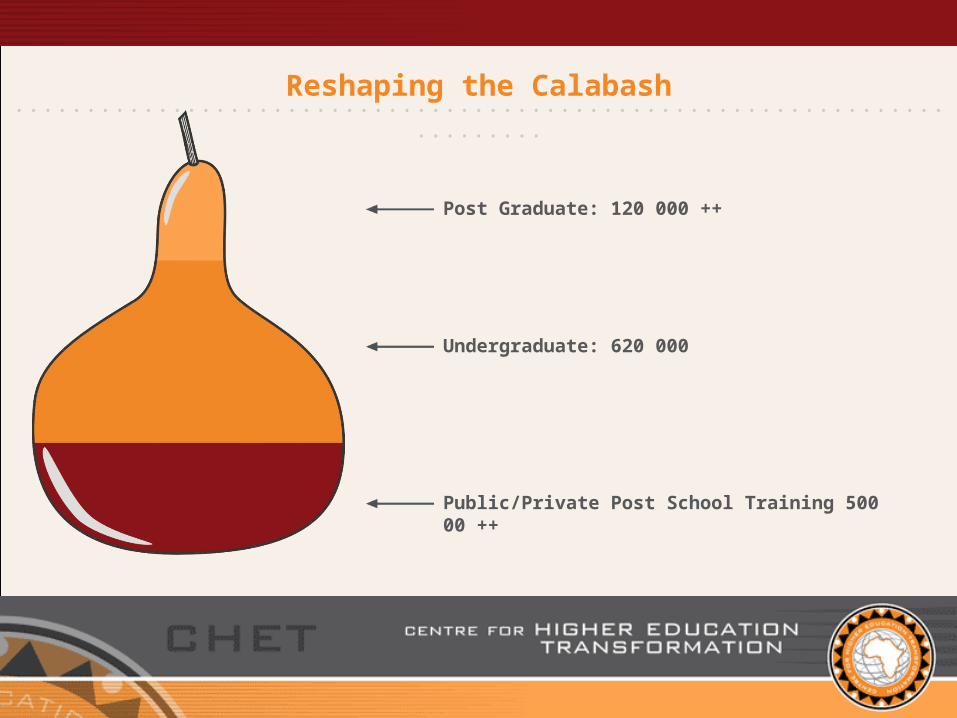
Reshaping the Calabash..........................................................................
Public/Private Post School Training 500 00 ++
Undergraduate: 620 000
Post Graduate: 120 000 ++
Some Obvious Steps (3)..........................................................................
• Current problem is the result of certain “old” attitudes amongst “new” bureaucrats in 1995 and the shape of the Department itself
• DoE will have to Reshape/Restructure to deal with the exclusion of youth, it cannot be marginalised into a Division of Social Inclusion
• Social Inclusion could monitor the “Excluded”, but “Inclusion” needs to be Mainstreamed
Reshape the Department of Education


![Moving Beyond Exclusion...Moving Beyond Exclusion: Focusing on the Needs of Asian/Pacific Islander Youth in San Francisco THE SERVICES AND ADVOCACY FOR ASIAN YOUTH [SAAY] CONSORTIUM](https://img.pdfslide.net/doc/110x75/5f141a7e3decd44a3359d0e5/moving-beyond-exclusion-moving-beyond-exclusion-focusing-on-the-needs-of-asianpacific.jpg)