Embed Size (px)
Citation preview

YUKON FINANCIAL
ADVISORY PANEL
FINAL REPORT
For Premier Sandy Silver
Government of Yukon
November 15, 2017
Ron Kneebone Norman McIntyre
Tim O’Neill Grace Southwick
Trevor Tombe

1
Table of Contents
Summary ............................................................................................................................... 3
What We Heard Before Developing Our Options .............................................................................4
What We Did .................................................................................................................................6
What We Heard in the Fall Consultation Phase ................................................................................7
Summary of the Options for Consideration ................................................................................... 10
Government Budgeting: A Primer ........................................................................................ 18
Total Revenue .............................................................................................................................. 19
Total Spending ............................................................................................................................. 20
Dealing with Uncertainty .............................................................................................................. 21
Infrastructure Spending ................................................................................................................ 24
The Government’s Net Debt/Asset Position .................................................................................. 26
Anchoring the Government’s Budget ............................................................................................ 26
Priorities and Trade-offs ............................................................................................................... 29
Yukon’s Finances: Past, Present, and Future......................................................................... 32
Size of Government ...................................................................................................................... 34
Yukon’s Current Fiscal Challenge ................................................................................................... 37
Exploring the Budget .................................................................................................................... 40
The Territorial Formula Financing ................................................................................................. 41
Taxes ........................................................................................................................................... 44
Income Taxes ...................................................................................................................................... 45
Consumption Taxes ............................................................................................................................ 47
Gasoline and Alcohol Taxes ............................................................................................................... 49
Carbon Taxes ...................................................................................................................................... 50
Health Spending ........................................................................................................................... 51
The Future of Yukon’s Finances ..................................................................................................... 55
Future Health Spending ..................................................................................................................... 60
Volatility of Revenue Sources ....................................................................................................... 61
Summing Up ................................................................................................................................ 64
Priorities of the Yukon Government – Context and Constraints ............................................ 66
Yukon Government Priorities ........................................................................................................ 66
Priorities and Context/Constraints ................................................................................................ 67
Mitigating Constraints and Improving Trade-Offs – Policies for Improving Trend Growth ............... 69
Mitigating Constraints and Improving Trade-Offs – Improving Public Sector Efficiency ................... 72
Back to the Government’s Priorities – Policy Change Considerations ............................................. 75
Options for Sustainable Finances ......................................................................................... 91
Near-Term Options to Balance ...................................................................................................... 91
Option 1: Spending Control................................................................................................................ 92
Option 2: Increase Revenue ............................................................................................................... 97

2
Option 3: Combine New Revenues with Spending Restraint ......................................................... 105
Option 4: Wait and See .................................................................................................................... 105
Medium-Term Options ............................................................................................................... 106
Index the Borrowing Limit to GDP ................................................................................................... 106
Implement a Revenue Neutral Carbon Tax ..................................................................................... 108
Review Resource Sector Policies...................................................................................................... 111
Support for Societies ........................................................................................................................ 116
Collaboration with Local Governments ........................................................................................... 116
Other Medium-Term Options .......................................................................................................... 117
Long-Term General Tax Reform .................................................................................................. 119
Anchoring the Budget to Long-Term Goals ..................................................................................... 119
Selecting Tax Instruments ................................................................................................................ 121
Options for a Tax Shift: How to Recycle HST Revenue .................................................................... 127
Limited Reform: A Savings Fund ...................................................................................................... 129
First Nations’ Fiscal Relations in Yukon ................................................................................. 131
The Self-Government Agreements .............................................................................................. 132
First Nation Personal Income Tax ................................................................................................ 132
First Nation Goods and Services Tax ............................................................................................ 133
Other First Nation Taxes ............................................................................................................. 133
First Nation Governments as Yukon Taxpayers ............................................................................ 134
Resource Revenue Sharing ......................................................................................................... 134
Infrastructure Funding ................................................................................................................ 135
Government-to-Government Fiscal Relationships with First Nation Governments ........................ 136

3
Summary
In May 2017, the Government of Yukon established an independent Yukon Financial Advisory
Panel (Panel) to provide independent and expert advice on how to improve the Yukon
government’s financial outlook. The mandate of the Panel is to develop options on how the
Yukon government can deliver on its priorities while meeting the fundamental needs of
Yukoners and returning to a healthy financial position.
Under the Panel’s terms of reference, the development of options for improving the financial
position of Yukon is to be guided by broad engagement with citizens (Yukoners), key
stakeholder organizations and First Nation and municipal government partners. The first phase
of the engagement process was launched on June 14, 2017 and closed on July 14, 2017.
Yukoners participated via an online discussion forum, an online survey and opportunities for
video and written submissions. More than 200 Yukoners provided their input and feedback. In
formulating its draft options the Panel considered, and to the extent possible, was guided by the
thoughts and opinions of participants in the initial phase of the public engagement process.
The initial public engagement process enabled participants to provide input and feedback on
what it means to successfully achieve the Government of Yukon’s stated priorities and provide
input on options that might be implemented to achieve success. The Yukon’s stated priorities
are:
1. Our people-centered approach to wellness helps Yukoners thrive. 2. Our strategic investments build healthy, vibrant, sustainable communities. 3. Our strong government-to-government relationships with First Nations foster
reconciliation. 4. Our diverse, growing economy provides good jobs for Yukoners in an environmentally
responsible way.
In addition to providing input on what constitutes success in achieving these priorities,
participants were provided background information regarding Yukon’s financial planning, current
projections of anticipated revenue, spending levels and financial assets and asked to provide
from their perspective key considerations or criteria to guide Yukon’s financial planning.
The Panel used the input from the first phase of the public engagement process to guide its
development of options for consideration. A draft report of options for consideration was
developed and released to the public on September 12, 2017. The draft report was the basis
for the second phase of public engagement (Fall Consultation Phase) to obtain input and
feedback.
During the Fall Consultation Phase the Panel met with leadership and/or representatives of
eleven of the fourteen First Nation governments, the Council of Yukon First Nations, eight
municipal governments, and twenty stakeholder groups. The panel hosted twenty public events
in fourteen of the communities. The Panel also met with Members of the Legislative Assembly
representing the Yukon Party and the New Democratic Party, as well as Deputy Minister and
Assistant Deputy Minister focus groups. 426 individuals participated in an online survey. The
Panel believes that the public engagement process was very broad with sufficient depth that it

4
was effective at providing additional options that had not been fully considered by the Panel in
the draft report and led to a better understanding of the potential impacts that the various
options might have on Yukoners, First Nation and municipal governments, businesses and
stakeholder groups.
What We Heard Before Developing Our Options
It is not possible to report all of the input we heard from participants. However, there were
general themes that we identified from the initial engagement that shaped the Panel’s options
for consideration as they related to the success of the four priorities as follows:
Success of a people-centered approach to wellness helps Yukoners thrive means there will be
access to health care, including mental health and wellness for all Yukoners (with extra
consideration of the most vulnerable Yukoners) at all stages of life. Investments in the social
determinants of heath including poverty, housing, food security, employment and education and
early intervention programs will result in improved outcomes and, therefore, a reduction in future
costs and pressures on the health care system. In addition to health care outcomes, participants
believed increased rates of high school graduation and access to a variety of learning programs
would indicate success of a people-centered approach to wellness.
Success of strategic investments to build healthy, vibrant, sustainable communities means that
Yukoners are able to purchase, rent, or access housing and services they need in their
communities. Respondents believed to achieve success in this area would require investments
in a variety of infrastructure including roads, bridges, recreation, and increased internet
connectivity with opportunities for communities to access financing and resources to meet their
own investment needs. However, to be successful participants felt these investments must
include resources to provide for ongoing operations and maintenance related to the
infrastructure investments.
Success of strong government-to-government relationships with First Nations that foster
reconciliation means Yukon will continually build relationships with First Nation governments
that support collaborative approaches. Success in this area means that all Yukoners will
have a better understanding of the history, past relationships and current situations and
issues facing First Nation communities in Yukon, leading to a concurrent reduction in
barriers to First Nations people accessing the programs and services they need.
Success of a diverse, growing economy that provides good jobs for Yukoners in an
environmentally responsible way means an economy that is diversified and creates job
opportunities that are beneficial to Yukoners today and tomorrow for all of Yukon’s communities
and where all workers earn a living wage. The Yukon government considers the impact of where
government jobs are placed and of the impact on the communities. It also means building an
economy that provides income to Yukoners, but in environmentally balanced way that protects
the wilderness for future generations. It also means the Yukon government has a better
understanding of how its legislation and policies impact Yukon businesses, and supports building

5
and growing private businesses while also working collaboratively with other service providers to
ensure no duplication of services.
Participants had many ideas to achieve success in these areas of priority such as: increase the
efficiency of program and service delivery and utilizing a whole of government approach that
eliminates “working in silos” within and between government departments; establish work
processes that provide collaborative, integrated services while at the same time creating more
opportunities for First Nation governments to be at the decision making tables to work together
toward a common future for all Yukoners; provide access to programs based on a means, or
income test; create partnerships with the federal government and/or communities to invest in
affordable housing for Yukoners along with policy, regulation, grant, or program options to
support more Yukoners purchasing land and homes; keep small business taxes favorable to
smaller Yukon-based businesses rather than larger corporations along with a competitive and
sustainable regulatory regime; and empower First Nation development corporations to be more
active in exploring and developing potential streams of employment.
In trying to balance expenditures with revenues, participants believed that emphasis should be
placed on reducing expenditures by improving efficiency with Yukon government programs and
services. They felt this could be accomplished by streamlining processes including reducing
redundancies and duplication of effort, using new tools and ways of doing business, and
reviewing expenditures to eliminate wasteful spending, including a review of the contracting and
procurement processes. There were suggestions to use existing human resources more
effectively by eliminating or scaling back programs that have outlived their usefulness and
redeploying government employees in other areas of priority.
There was no clear overwhelming preference of participants towards deficit financing of
expenditures, or a balanced budget approach. Some participants felt Yukon should not be
spending more than is received, especially as it relates to operations and maintenance
spending, and other participants saw value in deficit spending in support of long-term goals for a
limited time with an active plan to return to non-deficit spending scenarios.
Participants saw value in planning for the future and ensuring that plans for programs and
services and infrastructure align with the available financial resources. They felt this type of
financial planning is broad and needs to serve the needs of many. It needs to consider the
young and the old, the majority and the minority, the urban and the remote, and that there are
social and environmental benefits beyond the financial or economic benefits, all requiring
difficult choices and needing thoughtful consideration.
The need to raise additional revenue was suggested by participants. There were differing views
on the best way to do this effectively. Some suggestions for revenue generation were increasing
taxes, raising user fees for public services, increasing royalties and exploring the use of new
models for raising revenue.
There were comments on the structure of the civil service, from reducing it in size and/or reducing
salaries to restructuring so there is a more effective distribution of the workload. There was also

6
feedback that suggested an investment in and focus on private sector success and minimizing
the role of government.
What We Did
The Panel believed an overview of Yukon’s finances was needed for Yukoners to understand
the current financial situation, the facts behind the decline in the financial health of Yukon, and
the concern that future projections of revenues and expenditures have raised about the rate of
debt accumulation. This overview also informed the Panel’s discussions around options. Ron
Kneebone and Trevor Tombe prepared the section of the report, “Yukon’s Finances: Past,
Present and Future”, aimed at detailing the territory’s current situation and near- and long-term
challenges.
Tim O’Neill outlines the “Priorities and Context” in which the options for sustainable finances
need to be considered. Tim also prepared three sections of the report outlining ways to improve
government policies with a view to restoring the fiscal balance in the long-term. The section of
the report, “Mitigating Constraints and Improving Tradeoffs – Policies for Improving Trend
Growth”, focuses on those policy areas in which the government can apply direct control
[business taxes and economic infrastructure] or in which public sector spending dominates
resource allocation decisions [education and training]. The section of the report “Mitigating
Constraints and Improving Tradeoffs – Improving Public Sector Efficiency” focuses on initiatives
that the government can take to improve the efficiency of its own operations and programs.
Tim’s final section, “Back to the Government’s Priorities – Policy Change Considerations”, offers
suggestions for the government to consider regarding improved efficiency and effectiveness of
its policies especially as they relate to the four categories of current government priorities.
Ron Kneebone and Trevor Tombe also prepared the section of the report, “Options for
Sustainable Finances.” This section of the report provides specific initiatives and policy changes
that reflect four guiding principles: simplicity, sustainability, equity, and efficiency. The options
include near-term, medium-term and long-term options for consideration. The options range
from spending restraint to tax reform.
Norman McIntyre and Grace Southwick prepared the section of the report, “First Nations’ Fiscal
Relations in Yukon”, to provide a background to current First Nation fiscal arrangements and to
assess the impact the options may have on those arrangements. They also worked with Trevor
Tombe outlining the necessity of reviewing and possibly mitigating impacts the implementation
of the options may have on municipal and community finances.
The Panel’s draft report, released on September 12, 2017, was the subject of review by
Yukoners, First Nation governments and municipal governments and stakeholders in the fall
consultation phase. The feedback and input received was used by the Panel to add to and
modify the options presented in the draft report. The members of the panel reached consensus
on all of the options presented for consideration in this final report, completed in November of
2017.
7
What We Heard in the Fall Consultation Phase
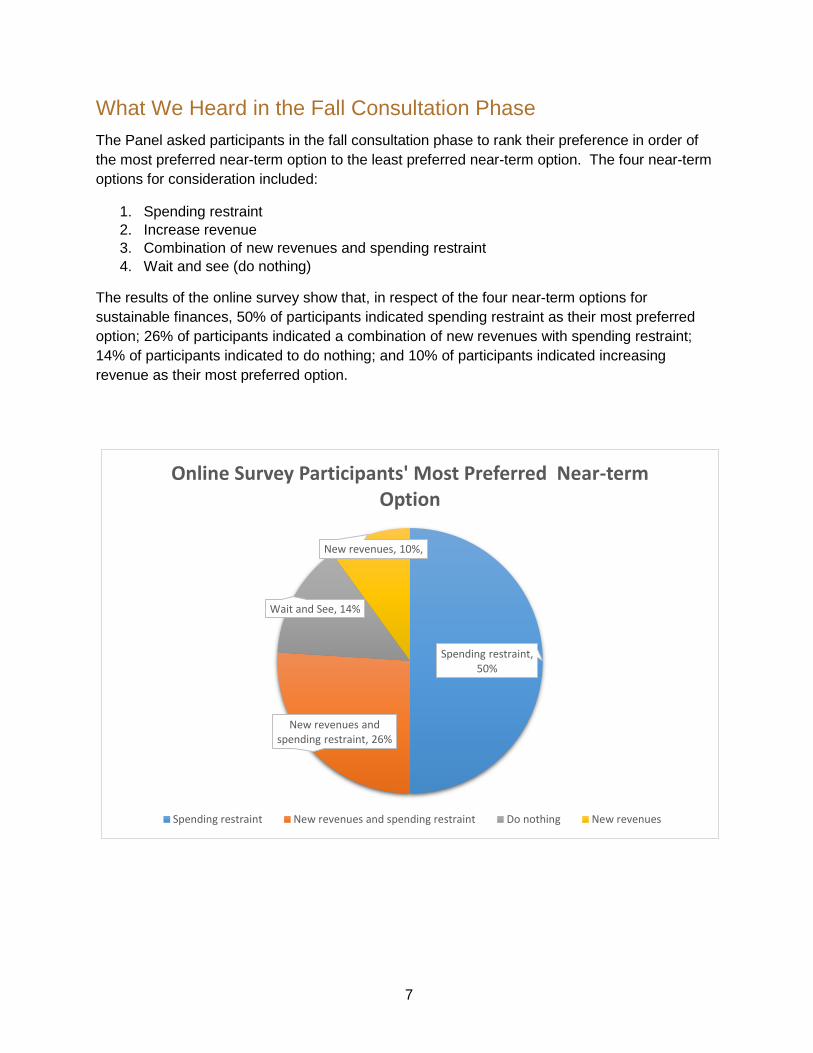
The Panel asked participants in the fall consultation phase to rank their preference in order of
the most preferred near-term option to the least preferred near-term option. The four near-term
options for consideration included:
1. Spending restraint
2. Increase revenue
3. Combination of new revenues and spending restraint
4. Wait and see (do nothing)
The results of the online survey show that, in respect of the four near-term options for
sustainable finances, 50% of participants indicated spending restraint as their most preferred
option; 26% of participants indicated a combination of new revenues with spending restraint;
14% of participants indicated to do nothing; and 10% of participants indicated increasing
revenue as their most preferred option.
Spending restraint, 50%
New revenues and spending restraint, 26%
Wait and See, 14%
New revenues, 10%,
Online Survey Participants' Most Preferred Near-term Option
Spending restraint New revenues and spending restraint Do nothing New revenues

8
The Panel also asked participants to provide their level of agreement with the following medium
to long-term options:
1. Index the borrowing limit to the economy (Gross Domestic Product as a measure of the
economy)
2. A tax shift – moving taxes away from income to consumption
3. Creating a savings fund
The long-term option of a savings fund that would receive deposits in years where tax revenue
comes in above a set threshold and could be withdrawn in years where tax revenue comes in
below that threshold appeared to have a relatively high level of agreement. 73% of participants
agreed or strongly agreed. 11% disagreed or strongly disagreed, with 16% being neutral.
Participants in the online survey were also asked to provide their level of agreement with a
broad reform that shifts taxes away from income and towards consumption. Primarily this would
result from the introduction of a territorial sales tax and redistributing this revenue through
lowering personal and business taxes. 43% of participants agreed or strongly agreed. 42% of
participant disagreed or strongly disagreed, with 15% being neutral
The Government of Yukon could negotiate with Canada to tie its borrowing limit to the Yukon
economy. The results of the online survey show that 34% of participants either agree on
strongly agree with tying the borrowing limit to the Yukon economy. 27% either disagreed or
strongly disagreed, with 39% being neutral. The chart below shows the level of agreement on
these options:
It should be noted that in our meetings with First Nation and municipal governments,
stakeholder groups, and in our community tours where we met with the general public we found
similar subjective ranking of the near term options and levels of agreement/disagreement with
0% 10% 20% 30% 40% 50% 60% 70% 80% 90% 100%
Index borrowing limit
Tax Shift
Savings fund
Level of Agreement with Medium- to Long-Term Options
Strongly Agree Agree Neutral Disagree Strongly Disagre
9
respect to the medium term to long term options as the online survey discussed above, giving
the Panel a high level of comfort with the online results.
In our draft report the Panel provided a number of other options for sustainable finances as well
as suggestions for the Yukon government to consider associated with the successful
implementation of the government’s four priorities. Yukoners had opportunities to review these
suggestions and provide input and feedback.
The Panel heard concerns about the size of government and the rate of growth over time in
relation to the size of the private sector economy. As a result of this feedback the panel
provided additional background information on the size and growth of government.
Many Yukoners expressed a preference for options that would address the spending side to fix
the fiscal imbalance and felt that improvements in efficiency and human resource management
may close the projected fiscal gap. The Panel added a variety of additional options to address
the preference of Yukoners to improve efficiency and limit growth in the public sector from a
comprehensive review of all department and programs, to a review of specific grant programs
such as the homeowner grant, to implementing a public sector compensation and hiring freeze.
With respect to raising revenue, Yukoners were generally not supportive of a Territorial Sales
Tax. A common theme seemed to be to raise revenue through user fees and taxation of non-
resident economic activity. The Panel added options in respect of a closer alignment of user
fees, certain license and registration fees with the actual costs of program delivery and to the
same level as other jurisdictions. Other options added from the suggestions of Yukoners was
the imposition of Yukon-wide Hotel Tax to be developed in close collaboration with communities
and industry as well as the options of a payroll tax with offsetting income tax credit to Yukon
residents similar to the payroll tax imposed in the Northwest Territories.
Feedback from the public indicated that if taxes were to be raised alcohol and tobacco taxes
and a tax on cannabis are areas where addition revenues could be generated. This option has
been added to the report.
In discussion with municipal governments, property tax rates between Yukon and municipal
rates was an issue. The Panel has added an option to review property tax rates, especially
near municipalities. There was also a theme that local government may be able to provide
services more effectively than the Yukon government. The Panel consequently developed an
option to explore opportunities for devolution to local governments where the shift would lower
the overall cost of program and service delivery.
There was a general theme that there may be ways for the Yukon government to benefit more
from the resource sector and that this area should be reviewed. Yukoners mentioned a variety
of issues from fuel tax exemptions to the royalty regime. The panel broadened its option from a
review of the royalty regime to a comprehensive review of resource-sector policies.
It must be noted that not all Yukoners supported further reviews of issues, but rather suggested
that government should be taking immediate action.

10
In our consultations during the Fall Engagement Phase the Panel heard about the complexities
of the bilateral and trilateral relationships amongst Yukon First Nation governments, the Yukon
government and Canada and the frustration felt by Yukon First Nation governments as to the
lack of progress in joint decision making/priority setting, collaboration in program and service
delivery, and the transfer of program and service delivery in respect of various areas of
jurisdiction such as education, health care and justice. As a fiscal matter First Nation
governments felt that there has to be more sharing of the wealth by way of new or enhanced
tax, royalty or revenue sharing agreements as envisioned in the Self-Government Agreements.
The Panel felt that it could not do justice to the multitude of matters mentioned and that would
have to be the subject of a separate study. However, where possible the report has been
modified to bring forward issues and suggestions for possible changes to enhance the
government to government relationship and work towards reconciliation. In respect of
government efficiency, participants offered that First Nation governments could assist in finding
efficiencies and work collaboratively with the Yukon government to do so.
Summary of the Options for Consideration
Some of the options that follow may be subject to the Taxpayer Protection Act. This Act
constrains the Yukon government’s ability to unilaterally (1) create or increase an accumulated
deficit and (2) introduce new taxes or raise the rate of existing taxes. Tax reform, of the type
described in the several of the options below, may first require a referendum or other legislative
changes.
Mitigating Constraints and Improving Trade-Offs – General Observations
Longer-term structural changes in government policies open up other prospects
for easing the financial and human resource constraints that government will
have to deal with.
o Spending or tax changes - reduce corporate income taxes, increase
economic infrastructure investments and enhance workers’ skills.
Improvements in the design and delivery of government services and programs.
o Internal operational changes to improve public sector efficiency and
effectiveness can include institutional reorganization, skills upgrading,
capital investment and process/delivery and funding innovations.
The Government’s Priorities and Policy Change Suggestions
The Yukon government’s Department of Finance is in the process of increasing
its capacity for program evaluation with a focus on policy outcomes. However,
“line” departments also have a responsibility to utilize their experience and
expertise in defining the type of data required for assessment of outcomes and,
as appropriate, to engage in the collection of relevant information.
11
Consider undertaking a comparative analysis of regions with similar population
densities to gather metrics to assist determining if the Yukon government is the
“right size”.
Consider the potential benefits of either contracting out to or collaborating with
other governments on the provision of such things as IT and analytics, standard
processing activities and common purchases in order to lower operating costs
and some capital expenditures.
Consideration should be given to collaboration with, or outsourcing to First Nation
and municipal governments on programs that are currently unilaterally delivered.
Consider further reduction in the corporate tax rates after assessing the impact of
the proposed drop from 15% to 12%.
Consider public-private partnerships [P3] to share the costs and risks associated
with public infrastructure projects. The federal government is a potential funding
partner in such joint ventures with the private sector through PPP Canada and/or
the new Canada Infrastructure Bank [CIB].
Consider comparing the costs of business support programs to the revenues
generated from business income taxes. An assessment of whether the territory
is achieving desired outcomes and getting value for the resources spent would
assist in redesigning some programs and eliminating others.
Consider a comprehensive review of the healthcare sector akin to the one done
in 2008 focusing on the factors driving costs and on the quality of the outcomes
being delivered to Yukoners.
Consider innovations in health care delivery and funding.
o For example:
Contract out to private firms some diagnostic work to mobile labs
or clinics.
Privately operated but publicly funded surgical facilities.
Examine the potential for relatively low-impact changes to co-pay
arrangements in areas such as pharma care.
Consider appointment of hospitalists.
o Recent studies from Canada, the US and internationally show that
reallocating tax dollars -- so there is no impact on total spending -- from

12
health spending to social spending has a positive effect on key indicators
of health and wellness.
Assess the outcomes from current approaches to dealing with adult literacy
challenges and consider program design changes to improve those outcomes.
It is suggested that the government dedicate a specific percentage of its
spending to maintenance and upgrading of [economic] infrastructure. If a
sovereign wealth fund is established to “store” budget surpluses as they arise,
that could be the source of investment in social infrastructure and would avoid
the problem of its competing with the economic infrastructure requirements of the
territory.
Assess the educational outcomes for aboriginal students and to craft, with the
First Nations communities and federal government, ways to improve outcomes.
Consider joint ventures, including public-private partnerships, with First Nations
governments.
Consider focusing intensive effort on the collaborative design and delivery of one
key program area in each First Nation.
Near-Term Options to Balance
Spending control –
o Currently, the government plans for spending growth of approximately 2%
per year from now until 2020/21. If this growth rate is maintained beyond
2020, then the territory is on track to balance by 2022/23.
o Balancing sooner requires further spending restraint. For example, to
balance by 2020/21 requires spending growth to not exceed 1% while a
nominal spending freeze at 2017/18 levels achieves balance by 2019/20.
o Conduct a comprehensive review of all departments and programs to
ensure government activities are appropriate and achieve value for
money; for example, the following options arose directly from the public:
i. Ensure accounting procedures and processes do not create
incentives to spend money without concern for the value of the
goods or services purchased, especially near the fiscal year end.
ii. Review the size and purpose of Yukon Government’s involvement
in the housing sector; explore charging rental rates in Yukon.
Housing accommodations that, where appropriate, reflect actual
market conditions
13
iii. Carefully review public service operations to ensure employment
and benefit levels and growth are well grounded in efficiently
delivering public services.
iv. Explore the possibility of more efficient human resource
management policies, to better facilitate the sharing of work
across department units and for more flexible job descriptions.
v. Implement a public-sector compensation and hiring freeze while
broader human resource reforms are considered.
vi. Review the Home Owner Grant, potentially cancelling it or better
targeting it so only those in need receive it.
vii. Review all government grant programs. Eliminate ones that do not
achieve clear public policy objectives. Where possible, consolidate
programs meant to support lower-income residents into a single
program.
Raising revenues –
o The most cost-effective tool available is a territorial sales tax harmonized
with the federal GST (an HST). Each 1% sales tax would raise roughly $7
million, net of expanded low-income rebates. Not only are sales taxes of
this kind generally more economically efficient than other forms of
taxation, the low-income rebates ensure that an HST is not regressive
o Raise user fees, fines, and related policies to better reflect costs of
providing goods and services. Independent of the projected fiscal deficits,
there is a strong case to align user fees with costs.
o Expand residency requirements for eligibility to long-term care facilities.
Introduce an income or asset test and scale user fees accordingly.
Introduce means-tested fees for home care. For individuals of means,
increase fees to be in line with other jurisdictions.
o Review property tax rates, especially in areas near municipalities.
Consider using some of the incremental revenue to increase municipal
grants.
o Explore opportunities for devolution to Yukon local governments, where
such a shift would lower the overall cost of delivering public services.
Ensure local governments have adequate resource to undertake such
expanded responsibilities.

14
o Consider raising alcohol and tobacco taxes, along with a comprehensive
review of cannabis fiscal space. Revenue raised can be used to support
additional community and drug support programs.
o Consider introducing a Yukon-wide Hotel Tax. Funds may be used in
close collaboration with local communities and industry to support Yukon
communities, enhancing the experience visitors and improving the
standard of living of residents.
o Reduce the number of fuel tax exemptions to commercial activities. That
is, where possible, broaden the fuel tax base and charge the same tax
rate on fuel use regardless of the commercial activity.
o The additional revenue raised by broadening the fuel tax base could be
recycled in any number of ways, though the feedback received by the
panel suggest it be used to increase local infrastructure initiatives.
Combine of spending restraint and raising revenues – a balanced budget under
various combinations of HST rates and spending growth rates are as follows:
o If spending grows at 2%, a 4% sales tax would allow balance by 2020/21.
o If spending grows at 1.5%, a 4% sales tax would allow for balance by 2019/20.
o If spending grows at 0.5%, a 2% sales tax would allow for balance by 2019/20.
Wait and see –
o Do not implement any spending controls or revenue increases in
anticipation that the economy will strengthen and revenues will increase
correspondingly.
Medium-Term Options
Index Yukon’s borrowing limit to its nominal GDP. As the Yukon economy grows,
so too will its government's borrowing limit. A 15% debt/GDP limit is appropriate
for Yukon, even given its near-term fiscal challenges.
Proceed with a fully revenue-neutral implementation of the Federal carbon tax.
We illustrate a package of policies to recycle carbon revenue that balances
equity and efficiency concerns. It includes:
o A universal cost-of-living credit of $300 per year;
o Lower personal income taxes by 20-25% across the board; and,

15
o Lower corporate income taxes by 20-25%.
o Use carbon tax revenue to fund additional grants to improve the energy
efficiency of households, businesses, and local and First Nation
governments, or to help offset the rising local adaptation costs as the
climate changes.
Improve comprehensiveness and transparency of territorial budgeting to include
fully consolidated books and projections.
As discussed above undertake a thorough review of the Yukon health system,
with a particular emphasis on ensuring cost efficiencies are fully exploited, and
that outcomes reflect such spending.
Undertake a comprehensive review of resource-sector policies, with a particular
emphasis on ensuring fair and efficient royalty rates, fee structures, permit and
licensing costs, tax exemptions, and minimum work requirements.
Explore the possibility of a Yukon payroll tax on out-of-territory workers at large-
scale mining operations.
Review, compare, and assess the performance of government-funded societies.
Encourage opportunities for cost-saving amalgamations or dissolution of under-
performing societies.
Improve comprehensiveness and transparency of territorial budgeting to include
fully consolidated books and projections.
In partnership with the federal government, explore changes to the Federal
Territorial Formula Financing grant to reflect the disproportionate burden an
aging population places on health services in the territories.
Long-Term General Tax Reform
Explore the opportunity to shift taxes away from income and productivity and
towards consumption. Sales taxes, while unpopular due to their visibility, could
fund reductions in income taxes that could increase economic efficiency, lower
government revenue volatility, and better extract value from visitors to Yukon.
Consider a clear “fiscal anchor” to ensure a robust financial situation well into the
future. The adoption of a fiscal anchor is intended to ensure that short-term
shocks do not permanently push the government off the path leading to a long-
term goal. A long-term goal might be a targeted debt/GDP ratio or a certain net
asset position.

16
Dampen government revenue volatility by creating a savings fund to smooth out
positive and negative revenue shocks over time. Specifically, use prior-year
budget projections or a clear fiscal anchor to define a level of revenue above
which excess dollars are saved, rather than spent.

17
A Primer on Government
Budgets

18
Government Budgeting: A Primer
In this section we present a very high-level overview of government budgets and budgeting
choices. The discussion is largely generic in the sense it describes budgeting issues faced by all
governments. In later sections we drill down into more detail and focus on the specific
challenges faced by the Yukon government.
A good place to start is to define the concept of “government” whose budget we will describe.
This may be a surprising thing to say but governments have such broad responsibilities and
meet those responsibilities in such a variety of ways that what you might consider to be a part of
government someone else might not. For example, is a college, provided with the responsibility
of raising tuition, hiring instructors, and teaching students a part of your definition of
“government”? For some the answer is yes but others would not agree.
The broadest definition of government includes what we all might agree should be part of any
concept of government -- Departments of Health, Education, Justice, and etcetera -- but also
includes the activities of not-for-profit organizations such as colleges and health institutions.
When we include the revenues and expenditures of all these entities, we define what is referred
to as a government’s Consolidated Budget. The revenues and expenses of the most important
not-for-profit organizations included in Yukon’s consolidated budget are Yukon College, the
Yukon Hospital Corporation and the Yukon Housing Corporation.
When governments present their non-consolidated budgets, they present separate accounts for
not-for-profit entities. Non-consolidated accounts are more complicated in that they must show
the flows of spending and revenues between what we might call (and some provincial
governments do call) the “core government” sector (Departments of Health, Education, Justice,
and etcetera) and not-for-profit entities. For example, a payment from the Department of Health
to a hospital would be an expense for the Department and a source of revenue for the hospital
and these flows would need to both be presented in the non-consolidated accounts. A
consolidated budget excludes these offsetting transactions and is therefore somewhat simpler
to follow. In most of what follows, we focus on the government’s consolidated budget.
Finally, before proceeding, we should note that the federal government and all provincial and
territorial governments report their budget financials for a fiscal year ending March 31st. In the
presentations provided below, any reference to a year should be understood as referring to the
year ending March 31st. Thus, a reference to 2017 should be understood to be referring to the
period from April 1, 2016 to March 31, 2017.
With those preliminaries out of the way, we turn to a broad overview of government finances.
We’ll start with the government’s annual budget.
All governments face a budget constraint relating annual spending to the annual amount of
revenue they raise. In this way, they are just like all of us: their spending must match their
revenue. Let’s start there:

19
Total Spending = Total Revenue.
Now let’s take another step by separating Total Spending and Total Revenue into the smaller
components that comprise them. We’ll start with Total Revenue.
Total Revenue
Governments have a number of sources of revenue. For the Yukon government, the largest and
most important source of revenue is in the form of transfer payments it receives from the federal
government. As we will see in later sections of this chapter, these transfers typically make up
about 80% of the territory’s total revenue. These transfers arrive in a variety of forms; some are
tied to specific territorial programs and others are unconditional. The largest of these transfers is
known as the Territorial Formula Financing (TFF), which measures the cost of providing public
services, the potential revenue territories can raise, and then fills in any gap between the two.
Much smaller transfers from the federal government come in the form of the Canada Health
Transfer and the Canada Social Transfer and still smaller transfer arrangements. Let’s refer to
all such transfers from the federal government as Federal Transfers.
The next largest source of revenue for the territory is taxation. There are, of course, many forms
of taxation. Governments tax the incomes of individuals and corporations, they impose so-called
“sin taxes” on our purchases of alcohol and tobacco, they tax us when we buy gasoline, they tax
us on the value of property we own, and they impose payroll taxes designed to raise revenue to
support the Canada Pension Plan and Employment Insurance. The federal government and
most provinces, but not the three territorial governments, impose a tax equal to a percentage of
everything we buy, a sales tax. Finally, governments also collect revenue from the sale of
licenses, permits, and fees and from the collection of fines. None of these are quite the same as
taxes but they feel the same nonetheless. Rather than delve into these details we will just refer
to all such forms of revenue as Taxation.
The Yukon budget includes as a source of revenue its share on income earned by Government
Business Enterprises (GBE). These entities are meant to be self-supporting corporations.
Government of Yukon business enterprises include the Yukon Liquor Corporation and the
Yukon Development Corporation.
Governments sometimes work with partners in projects that benefit citizens. The income earned
on these partnerships is inelegantly identified in the Yukon budget as Funding and service
agreements with other parties. To keep things simple, we will combine this source of revenue
with GBE and other smaller sources of revenue into a catch-all category of Other Income.
Governments receive revenue in the form of the income they earn on the financial assets they
own. All governments hold financial assets. One reason for this is that the taxes they receive do
not flow to them at the same time they spend. Financial assets are therefore held to bridge
these gaps. Financial assets are also to be found in the form of investments in government
business enterprises. Governments earn Investment Income on these financial assets.

20
Finally, when all else fails, governments can pay for their spending by borrowing or by selling
financial assets. Governments borrow or sell assets when their other sources of revenue prove
to be insufficient to pay for their Total Spending. In these cases the government is said to suffer
a Deficit. When they borrow, governments sell government-issued bonds. When they raise
revenue in this fashion they must, of course, pay interest on the amount they borrow. This
payment of interest, what we call Debt Service, will appear shortly as one of the components of
Total Spending. Another option for a government is to sell some of its financial assets. When a
government sells financial assets, it of course reduces the amount of Investment Income it
receives.
When the amount of revenue collected by a government is more than sufficient to pay for its
Total Spending the government is said to realize a Surplus. A Surplus requires that the
government make a decision regarding what to do with these excess funds. One possibility is to
repay funds it previously borrowed and so reduce Debt Service. A second possibility is to buy
new financial assets and so, in the future, earn additional Investment Income.
Government Deficits and Surpluses are therefore similar in many respects. Deficits and
Surpluses arise because of an imbalance between Total Spending on the one hand and the
sum of Federal Transfers, Taxation, Income from GBE, Funding and service agreements with
other parties, and Investment Income. A Deficit arises when the imbalance is in one direction
while a Surplus arises when the imbalance is in the opposite direction. Over time, a Deficit
causes Debt Service to increase (if the government borrows) or causes Investment Income to
decrease (if the government sells financial assets). Over time a Surplus causes Debt Service to
decrease (if the government repays old debt) or causes Investment Income to increase (if the
government purchases new financial assets). Deficits and Surpluses therefore have similar, but
opposite implications for Debt Service and Investment Income. When we think of Deficits and
Surpluses we should understand that they are two sides of the same coin.
Let’s record these sources of Total Revenue in our statement of the government’s budget:
Total Spending = Total Revenue
= Federal Transfers + Taxation + Investment Income + Other Income +
Deficit/Surplus.
Now let’s turn to Total Spending.
Total Spending
There are only two broad categories of spending that governments do. Most of the spending
that governments do is called Program Spending. This is what the government spends on
goods and services, including transfers they provide to citizens in the form of pensions, social
assistance, and other forms. The “Big Three” areas of program spending for the Yukon
government are Health and Social Services, Community and Transportation, and Education.

21
These three categories of spending account for about two-thirds of all spending. The other part
of Total Spending has been discussed already; the cost of paying interest on borrowed funds,
what we call Debt Service. Adding this to our statement of the government’s budget we have:
Program Spending + Debt Service
= Federal Transfers + Taxation + Investment Income + Other Income +
Deficit/Surplus.
It is often suggested that governments should “balance the budget.” When governments try to
achieve a budget “balance” they are trying to fund their Total Spending solely with taxation,
federal transfers, other income, and investment income. In other words, the goal of maintaining
a balanced budget is to avoid either a Deficit or a Surplus. If we remove Deficit/Surplus from our
statement of the government’s budget we are therefore left with what must be true for a
balanced budget:
Program Spending + Debt Service
= Federal Transfers + Taxation + Investment Income + Other Income.
This broad strokes description of the government’s budget is built on simple ideas that any
household budgeter can relate to: spending must be paid for. If income is insufficient to pay our
bills we run a deficit. In this case we must either borrow and add to debt or eat into savings by
selling assets. If income is more than sufficient to pay our bills we run a surplus. In this case we
can either repay old debts or add to our savings by purchasing new assets. The government
faces very similar choices as us when it comes to budgeting.
Dealing with Uncertainty
Governments must deal with a problem we must all deal with; namely, our budgets can only
reflect our best guesses about an uncertain future. Sometimes income will be higher than
expected, sometimes lower. The same is true for spending. Unexpected expenses arise and
when they do we must deal with them. Always maintaining a balanced budget – that is, always
exactly equating our spending to our income – is difficult because of the uncertainty over the
size of our incomes and our spending needs. All of us deal with this uncertainty. We do so by
using our savings or by drawing on our line of credit. If spending is unexpectedly larger than
income, we can eat into our savings account or we can draw on our credit and take on debt. On
the other hand, if spending is unexpectedly less than income, we can take the opportunity to
add to our savings or repay debt.
Governments deal with uncertainty in exactly these ways too. If spending is unexpectedly large,
the government either eats into its savings or draws on its credit to borrow. If spending is
unexpectedly less than income the government adds to its savings or repays debt.
Because they have good credit ratings, the line of credit Canadian governments have is with
world financial markets. The Yukon government has an excellent credit rating (currently AA by

22
S&P, a credit rating agency) and as a consequence can borrow money at attractive rates of
interest. Thus, if the government needs to borrow it will not generally have trouble doing so.
Borrowing does, of course, have implications for future budgets because the government will
need to pay more by way of Debt Service. There is also a regulatory borrowing limit set by the
Federal government. Currently, the territory may not borrow in excess of $400 million (Order in
Council P.C. 2012-0280). As of March 31, 2016, just under half of this allowable borrowing
capacity remains available for use.
On the other hand, should spending exceed its other sources of revenue the government can,
like a household, run down its savings. As we will see in a later section, the Yukon government
has considerable savings. When spending exceeds revenues the government can therefore
draw down its own savings. This also comes at a cost. When a government spends its savings,
it reduces the amount of investment income it can earn on those savings. When governments
spend more than they collect by way of taxes they can either borrow funds or run down their
previously accumulated savings. Both of these choices involve a cost.
The uncertainty faced by governments stems from the fact that the economy suffers unexpected
events that cause fluctuations in income and employment; what is commonly referred to as the
business cycle. An economic contraction causes tax revenue to fall and spending on things like
social assistance to increase. If the government’s budget was formerly in balance, it falls into
deficit during a contraction and it must either borrow or dip into savings. An economic expansion
does the opposite. If the budget was formerly in balance during an expansion it moves into
surplus. The government can now either add to its savings or reduce its debt.
The figure below offers a stylistic representation of changes to the government’s budget balance
as it moves through a business cycle.
Figure: Alternative Budget Policies

23
It shows three alternative ways of dealing with the budgetary effects of the cycle. The
government can choose which of these outcomes it obtains by choosing tax rates and the
sensitivity of spending programs to the business cycle. The black wavy line shows the
implication of the government never allowing a budget deficit to occur. To avoid a deficit in all
circumstances, the surplus realized in favourable economic conditions must be large so that the
same tax rates and same spending programs produce no worse than a balanced budget during
unfavourable economic conditions.
Avoiding a deficit in this way has two key implications. The first is that the government will either
save or reduce outstanding debt in all years except those during the deepest part of the
recession. The second implication of budgeting in this way is that it requires the government set
tax rates higher, or design spending programs to be less generous, than would be necessary if
it allowed for deficits to occur. For example, if the government were tolerant of deficits in the
way favoured by some economists, the red wavy line could describe outcomes for the budget
balance. Budget surpluses would be enjoyed during the expansionary part of the cycle and
deficits endured during the contractionary part of the cycle. Appropriate setting of tax rates and
appropriate design of spending programs could cause the surpluses to balance the deficits and
so on average produced a balanced budget. If the government were tolerant of deficits in this
way then taxes would be lower, or spending more generous, than in the case described by the
black line.
This comparison of the red and black wavy lines highlights that all budgeting strategies involve
both good news and bad news. The good news of the “black wavy line” strategy is that it
enables the government to avoid ever accumulating debt (or very quickly pay off debt it may
currently hold). This is attractive because it means avoiding having to pay debt service costs (or
eliminate those costs very quickly). The bad news is that the strategy requires either keeping tax
rates higher or keeping spending lower than would otherwise have been necessary. As
economists like to say, there is no free lunch; everything has a cost.
The budgeting strategy represented by the red wavy line demands a tolerance for deficits during
economic downturns. As the diagram shows, during periods of slower than normal growth the
government budget falls into deficit. During these periods the government must be tolerant of
taking on a good deal of debt or tolerant of running down savings. The amount of debt taken on,
or the amount of savings used up, by this strategy is identified by the sum of the area in blue
and the area in red dots. Adopters of this strategy have to be confident that faster than normal
economic growth will come along to produce surpluses that will enable the repayment of the
debt accrued earlier or the replacement of the savings used up.
Getting the “red line” strategy exactly right is tricky business. Most economists agree that it is
best to err on the side of setting taxes somewhat higher– or keeping spending somewhat less
generous -- than this and so take on less debt (or eat up less savings) during periods of slower
than normal economic growth. Such an intermediate strategy is represented by the blue wavy
line. During periods of slower than normal economic growth, the amount of new debt taken on –
or the amount of savings used up – is identified by the light blue area.

24
The budgeting strategy identified by the blue wavy line is a compromise in that it shaves off a bit
of the good news associated with the red line strategy (taxes need to be higher) but also shaves
off a bit of the bad news (less debt needs to be taken on or less savings need to be used up). It
is also a compromise relative to the black line strategy; taxes are lower or spending higher but
more debt must be taken on (or more savings used up) during economic slowdowns. To
implement the budgeting strategy that yields the blue wavy line, a government must be willing to
take on debt or to dig into savings during periods of slower than normal economic growth.
Figure 1 is clearly a very stylized description of how the government’s budget changes over the
course of a business cycle. The height and depths of the “waves” depend on how sensitive are
the government's revenues and expenditures to changes in economic activity. The more
sensitive are revenues and expenditures, the greater the challenges governments face in trying
to choose tax rates and the design of spending programs in a way that balances the positive
implications for the budget of a boom against the negative consequences of a bust. It is in part
for this reason that governments find value in raising revenue from taxes that are less sensitive
to the economic cycle. By adding such revenue sources to the mix of different types of taxes
utilized by a government, the volatility of the government’s budget imbalance can be reduced
and the challenge of choosing tax rates and spending program design that meet longer term
goals is made easier.
This discussion of how governments can deal with uncertainty has made some simple points
that, again, households can easily relate to: The future is uncertain, and as a result so are
spending commitments and revenue plans. Whether to deal with uncertainty by digging into
savings or by borrowing is a choice that ought to be made by comparing rates of return on
savings versus the cost of borrowing. Borrowing means having to make interest payments while
digging into savings means forgoing the interest earned on savings. Unless interest rates on
these options differ by a noticeable amount, it’s six of one and half dozen of the other. Finally,
moving from one budgeting strategy to another reflects choices about levels of spending versus
levels of income (or, if you are the government, taxation). Moving from the black to the blue to
the red budgeting strategy involves increasing spending without a matching increase in income.
As all households know, and as the figure shows, more spending sounds great but if it is not
matched by additional income then savings disappear or debt piles up. Finally, many of these
challenges are reduced if income can be made more stable and predictable.
Infrastructure Spending
It is frequently suggested that spending on infrastructure should be financed by borrowing as
opposed to taxation. The idea is that spending on infrastructure is an investment with returns to
be enjoyed both now and in the future. To understand the logic of this argument, think of
spending on new roads, new schools and new hospitals. All of these things will benefit
individuals and private companies for decades. Is it fair that current taxpayers be asked to pay
the full cost of these expenditures? If future taxpayers also benefit from these expenditures, we
can cause them to pay their fair share by paying for these projects with borrowed dollars rather
than taxation. The accumulated debt can then be paid by taxpayers in the future.

25
This is a sensible argument and it is one that economists know as the so-called Golden Rule of
government borrowing. The idea is that over the course of a complete business cycle, the only
borrowing that should be done is for investment in infrastructure and the amount that should be
borrowed should be limited by the size of the benefit enjoyed by future, as opposed to current,
taxpayers. In terms of our earlier graphic, applying the Golden Rule involves shifting the red
wavy line down (by increasing spending and/or reducing tax rates) so that the deficits incurred
during periods of slower-than normal growth exceed the surpluses enjoyed during faster-than-
normal growth. At the end of the business cycle, then, the government has more debt than
when it started. So long as the economy continues to grow so that future taxpayers can afford to
make their contributions to current infrastructure spending, this is a sustainable practice.
While the Golden Rule seems eminently sensible, it’s a bit slippery in its application. What
exactly do we mean by “infrastructure”? Roads and hospitals seem like good bets, but how
about the cost of hiring teachers to educate our children? Today’s well-educated kids will surely
benefit future taxpayers, so shouldn’t future taxpayers share in the cost of hiring today’s
teachers? How about moving people out of poverty so their children have a better opportunity to
contribute to society? Surely that is a worthwhile investment that is more than comparable to,
say, the cost of a new road.
Also making application of the Golden Rule difficult is identifying how much infrastructure
spending benefits future as opposed to current taxpayers. Recent research by economists Bev
Dahlby and Michael Smart1 suggests that most of the benefits of infrastructure spending accrue
to current generations of taxpayers with less than 20% accruing to unborn generations. This
allocation of benefits is, however, sensitive to the type of spending and the characteristics of the
jurisdiction in which the spending is taking place.
Economists have suggested that one way of identifying what spending should be financed with
borrowing is to measure the rate of return on that spending. That is, financing infrastructure with
borrowing is justified if the rate of return on that spending exceeds the rate of return that would
have been earned had that borrowed money been left in the private sector. That helps our
thinking on this issue a bit, perhaps, but leaves us with the tricky question of identifying the rate
of return on public projects. What, for example, is the rate of return on ending poverty?
The challenge of questions like these, and the need to limit the temptation for governments to
forever broaden the definition of public infrastructure, have caused economists to suggest that
applications of the Golden Rule be accompanied by broad restrictions on the size of the annual
deficit and the level of public indebtedness justified by infrastructure investments. In the
European Union, for example, the limit that has been used is 3% of GDP. In a review of
Alberta’s budgeting challenges published in 20022 an expert panel suggested the province
should commit to spending on infrastructure not less than 0.9% of the average level of GDP
1 “The Structure and Presentation of Provincial Budgets,” SPP Research Papers, The School of Public Policy, University of Calgary, Volume 8, Issue 25, May 2015 (http://www.policyschool.ca/wp-content/uploads/2016/03/provincial-budgets-dahlby-smart.pdf). 2 “Moving from Good to Great” https://archive.org/details/movingfromgoodto00albe

26
over the previous two years. The exact size of this commitment to infrastructure spending is
undoubtedly sensitive to the conditions of the economy being considered. At least as important
as the actual size of the commitment to spend on infrastructure is the commitment itself. In
particular, it is important that the commitment to spend on infrastructure not be affected by
short-term budgetary issues.
The Government’s Net Debt/Asset Position
To this point we have focused on the government’s annual budget. As we have discussed, even
if a government tries to exactly balance revenues with spending, uncertainty over the state of
the economy means that it is almost guaranteed that it will instead realize a budget imbalance. If
the imbalance is in the form of a surplus, the government will need to decide whether it wishes
to pay down previously accumulated debt or add to financial assets. If the imbalance is in the
form of a deficit, the government will need to decide whether it wishes to add to previously
accumulated debt or sell previously accumulated financial assets. Whatever the choice, it
impacts the governments levels of financial debt and assets.
Governments report their financial liabilities and assets both separately and as a net figure. The
Yukon currently has financial assets that are greater than its financial liabilities. The territory
therefore has positive net assets or, what is the same thing, a negative value of net debt. To put
the size of government financial assets and liabilities into perspective, they are frequently
reported as a percentage of GDP. This is useful because GDP is a broad measure of our
collective income and so our collective ability to carry debt.
Anchoring the Government’s Budget
As we noted earlier, budgeting is challenging because of uncertainty surrounding the amount of
spending that will be required and the amount of revenue that will be collected. The unexpected
events that lead to this uncertainty cause the private economy to experience booms and busts
that may be prolonged or temporary. To deal with this uncertainty over the long term, most
economists advocate that governments adopt a “fiscal anchor” which, as the name implies, is
designed to keep the budget from being pushed too far from a stated goal by unexpected
events.
There are a number of different fiscal anchors that might be considered. They all involve a
trade-off: While they can be effective at keeping a government budget close to some stated
objective, they also tie the hands of governments by limiting their budgetary choices.
A fiscal anchor that is often considered is a balanced budget restriction. In its strictest form, this
anchor demands that governments maintain a balanced budget each year or to correct any
imbalance with an offsetting imbalance the following year. What makes the rule attractive is that
it is simple and relatively easy for citizens to see whether or not it is being obeyed (assuming
budget presentations are transparent).

27
Despite the attraction of the rule being transparent and easy for citizens to evaluate, few
economists would advocate such an anchor. The reason is that it adds volatility to the
government’s budget. For example, in the first year of an unexpected recession a government
would lose tax revenue and be required to make additional social assistance payments. This
would result in a budget deficit. Were the recession to continue for a number of years, the
government would need to respond to the budget deficit by increasing tax rates and making less
generous the income support payments made to those who lost jobs. Such actions are counter-
productive and can worsen the effects of the recession by taking income away from citizens just
when they are most in need.
A more palatable version of the balance budget rule -- one that does not require annual
adjustments to tax rates or the design of transfer programs -- is one that states the budget must
be balanced only over the course of an entire business cycle. We touched upon this rule early in
our discussion of Figure 1. This rule is generally favoured by economists but, as we noted
earlier, the application of such a rule is challenging because the duration and amplitude of
business cycles cannot be predicted with much accuracy. What’s more, the uncertainty over
identifying the timing of a business cycle makes it difficult to determine when budgetary
adjustments need to be made to satisfy the goal of balancing over the cycle. This uncertainty
also makes it difficult for citizens to determine whether the rule is, in fact, being followed.
For these reasons the “balance over the cycle” advice is typically accompanied by a suggestion
to limit the amount of debt accumulated over time. Thus, given all the uncertainty surrounding
the duration and amplitude of a business cycle, it is possible that at the end of the cycle a
government that held tax rates and the design of spending programs steady throughout the
cycle will have made a net addition to (or subtraction from) its accumulated debt. By imposing a
constraint on the amount of debt a government can accumulate over the long term, a rule can
cause a government to make choices with respect to tax rates and the generosity of its
spending programs that limits the debt it accumulates over the course of a business cycle. A
rule concerning the amount of debt that can be accumulated over the long term can in this way
also constrain choices with respect to tax rates and the design of spending programs.
The federal government has seemingly recently imposed upon itself, at least implicitly, a fiscal
anchor that requires it maintain a more or less constant debt/GDP ratio. In a growing economy,
maintaining a constant debt/GDP ratio implies the government budget so as to yield a deficit
each year. The size of the deficit that can be accommodated depends on the trend rate of GDP
growth and the size of its outstanding debt.
To impose such a constraint on its budgeting, any government must first determine what is its
desired debt/GDP ratio. Some years ago the federal government indicated it desired to maintain
a level of net debt equal to 25% of GDP.3 This choice of target was not based on an
3 The date by which that target should be reached has continually changed. The earliest commitment we found was to hit the target by 2011. The latest announcement, made by the previous federal government in 2013, was to hit the target by 2021. The current federal government has not spoken of an explicit target
28
understanding of there being an optimal debt/GDP ratio and the economics profession has not
provided any guidance on what such an optimal ratio might be. Rather, it seemed to be a target
that was low relative to international competitors and would not require a problematic level of
annual interest payments on the debt.
It is important to emphasize that a good fiscal anchor is one that is easily understood and easily
monitored by voters. That is, it should reflect the wishes of citizens but for it to do that, citizens
need to be able to easily verify whether their wishes are being satisfied. This is what makes
defining simple forms of a fiscal anchor -- such as a debt/GDP target -- attractive. But even
simple definitions require transparency in budget reporting. For example, using a debt/GDP ratio
as a fiscal anchor requires a clear statement about the definition of debt to be used in the target.
There is a wide variety of forms that a fiscal anchor can take. A simple and transparent version
of a fiscal anchor might be to simply require the government to restrict the rate of growth in
spending. The general form of these restrictions are called “tax and expenditure limits” and, as
the name implies, constrains the choices governments make with respect to tax and spending
choices. These restrictions can be imposed permanently or for short periods of time. For
example, the government might consider restricting the rate of growth in spending to the
combined rates of growth in population and inflation. In this way, real per capita spending is held
constant perhaps until such time as its budget imbalance is corrected.
Other examples of imposing fiscal anchors on the budget include the decision in Manitoba
where legislation demands a 20% cut to ministerial salaries in every year the provincial budget
is in deficit. Alberta has imposed a different sort of constraint intended to discipline government
spending by restricting the government’s access to revenue. This is the requirement in Alberta
that any proposal for imposing a provincial sales tax be approved by referendum (the Alberta
Taxpayer Protection Act). Those who criticize such restrictions emphasize that they go too far in
the trade-off between imposing fiscal discipline and allowing governments freedom to respond
to unexpected events. In Alberta, for example, most analysts recognize the requirement for a
referendum before allowing the introduction of a provincial sales tax has seriously hurt the
province’s competitiveness by forcing on it an inefficient mix of taxes.
It is also perhaps useful to emphasize that the fiscal anchor can change but the manner in
which it changes is important. The definition of the fiscal anchor might change because, as in
the case of the rule suggested above, some rules may only be designed to guide fiscal policy
choices for a short time or until some other target is met. In these cases, the form of the fiscal
anchor needs to be changed after the intent of the previous rule has been satisfied. However, it
should be a requirement that changing the definition of the fiscal anchor require public or at
least expert consultation. On this, the history of the Government of Alberta’s use of fiscal
anchors is instructive (see Kneebone, 2006)4. The Government of Alberta adopted a series of
fiscal anchors but allowed itself to change the definition of the anchor without public or expert
but has emphasized the importance of maintaining a more or less constant debt ratio at its current level of about 34%. 4 https://www.ctf.ca/ctfweb/Documents/PDF/2006ctj/2006ctj3-kneebone.pdf

29
consultation. The result was a watering-down of the definition of the fiscal anchor until such time
as it had no impact on budgeting.
Priorities and Trade-offs
We end this section with a broad recognition that all institutions, whether in the public or private
sector, face the fact that, in setting out priorities and the means by which they will attempt to
achieve them, the resources [financial and human] required are limited. This scarcity of
resources necessitates making choices or trade-offs among an institution’s goals or objectives.
For a government this will be true irrespective of its current or projected fiscal situation. Even
when in surplus there will be demands to enhance or expand current activities or to add new
initiatives.
It is typical to focus on the trade-offs that governments make with respect to allocating spending
in a budget. However, there are several other sets of choices that are implicit in the expenditure
allocation decisions. Trade-offs also have to be made about the allocation of financial and
human resources among and within program development and design, implementation
processes, the extent and form of the monitoring and assessment of initiatives and the
adjustments made to deal with unexpected problems and/or unintended outcomes.
While most of the attention is paid to the trade-offs on the spending side of a budget, there are
also explicit and implicit choices made on the own-revenue side of the ledger. A decision not to
change taxes, fees or other income-generating sources is part of the broader set of fiscal trade-
offs made by a government. Revenue initiatives can involve changes in rates or fees as well as
decisions about how and to which entities they are applied. Similar to spending
decisions, revenue programs require monitoring and assessment as well as adjustment.
In addition to the challenges of deciding to how to allocate spending [including capital spending]
among a range of alternatives, governments can and do set priorities that are in direct conflict
with one another. That is, initiatives designed to achieve one objective may inhibit achievement
of another. A current obvious example would be government support for mining or energy
development alongside policies designed to encourage reduction of greenhouse gas emissions.
The offsetting impacts can run in both directions in this instance.
A less obvious [and more controversial] example involves significant increases in minimum
wages that, it is argued by many economists, may actually inhibit the intended objective of
reducing income inequality. Another [arguable] conflict would revolve around the adverse impact
on economic growth [a persistent if unstated desire of most governments] of the raising of
corporate or other business income taxes. It is not the intention here to debate the specifics of
these two examples. Rather it is to alert the government and the public to the possibility that
conflicts among policy initiatives may exist but not be obvious to the casual observer. It is
important to note that the particular examples provided also are subject to both analytical and
empirical debate.

30
Where there are conflicts among priorities that are readily recognized, they tend to be resolved
by compromises among the objectives. In the example of the conflict between economic
development and “so-called” green objectives, the compromises may range from the
moderation of regulations for emissions levels as they apply to particular industries to
constraints on the scope or nature of industrial development. The issue of dealing with trade-
offs and dealing with conflicting priorities will be a theme we revisit throughout this report.
This next chapter of this report discusses, in considerable detail, the revenue and expenditure
patterns of the Yukon budget over the past ten years and the projected fiscal position to 2021 in
the absence of deliberate changes in fiscal policy. We will see that there is consideration of the
pressures arising from the markedly higher than national average level of age-adjusted per
capita healthcare commitments going forward. That example serves to remind us that many
fiscal issues arise due to societal constraints and conditions that change only very slowly over
time. Public policies can influence those conditions but can do so only over long time horizons.
A focus on longer-term structural changes in government policies opens up other prospects for
easing the financial and human resource constraints that government faces. These issues will
be a focus of a later chapter of the report. Next, we remain focused on shorter-term issues.

31
Yukon’s Finances: Past, Present, and
Future

32
Yukon’s Finances: Past, Present, and Future
Governments across Canada face difficult budget decisions. Some challenges are common,
such as low and volatile commodity prices or an aging population. But for Yukon these
challenges are further compounded by a need to provide quality public services in smaller
remote communities. In recent years, the financial health of the Yukon government has
materially declined and future projections have raised concern. Absent a strong rebound in
mining sector activity, status-quo tax and spending policies will result in a rate of debt
accumulation that is not sustainable. This report aims to help frame public debate, detail the
territory’s current situation and near- and long-term challenges, and to propose a variety of
options to ensure sustainable territorial finances going forward.
Broadly speaking, our subsequent analysis highlights the following:
● Spending: Most spending items are high, per person, relative to other jurisdictions. This
is often unavoidable, given the unique challenges faced by the territories. But growth of
government, both in terms of employment and spending, relative to the rest of the
economy has been notable. Government spending is now over 50% of territorial GDP,
and there is roughly one job in government for each four Yukoners in 2016. Twenty
years earlier, there was one government job for each six Yukoners. Direct growth of
Yukon government employment (excluding municipal, federal, or aboriginal
governments) accounts for most of this increase. Going forward, rising health costs will
pose a challenge. Since 2009, for example, health spending has increased above what
one would have expected from Yukon’s demographics and per-capita growth observed
elsewhere.
● Taxation: Yukon is a low tax jurisdiction, especially with respect to personal income
taxes and consumption taxes. In fact, Yukon and Nunavut are roughly tied as the lowest
tax jurisdictions in Canada. For perspective, if Yukon adopted the overall tax system of
the NWT -- the next lowest tax jurisdiction -- its revenue would increase by $30 million
per year. Broadening the tax base (or drawing on other tax bases) provides the
opportunity to shrink its future deficits or to reform/lower other taxes.
● Transfers: By far, most Yukon revenues come from the federal government. But the
Territorial Formula Financing (TFF) may not adequately capture the differential effect of
an aging population on territorial costs -- that is, we should expect costs to rise in Yukon
more than in the provinces, for the same demographic changes, yet the Gross
Expenditure Base (GEB) built into the TFF evolves with the provinces.
● Volatility: Income tax revenue is volatile, and highly related to volatility in mining sector
activity. It is important to not allow volatility in the private sector to cause volatility in
public policies. This sometimes occurs when a private sector expansion (contraction)
provides higher (lower) than usual revenues and so encourages changes to tax rates
and spending plans that are not sustainable over the long term. Insulating the budget

33
from private sector volatility can be accomplished in a number of ways, including the
imposition of a “fiscal anchor” in the form of a long-term target for debt, tax rates, or
other goals. Another option is to change the tax mix toward less cyclically sensitive
revenue sources. We show, for example, that Yukon’s consumption tax base is only
weakly related to mining activity. Thus, a tax shift away from income and towards
consumption taxes like an HST can also lower volatility in the government’s budget.
● Infrastructure: Yukon has a small population with a large number of widely dispersed
communities. This makes spending on infrastructure -- both new projects and
maintenance of existing projects -- especially critical. The lack of redundancy to
infrastructure providing electricity makes it especially important that required spending
on infrastructure be protected from short-term budgetary issues.
● The Future:
○ Spending growth has recently exceeded revenue growth. This is not sustainable.
○ There are multiple options to close the projected gap, none of which require
dramatic changes in tax or spending policy so long as their implementation is not
delayed. Delays make inevitable adjustments larger and more painful.
○ Forecasts of future fiscal health and debt levels depend on future mining activity.
Some forecasts point to strong performance in this sector for at least the next
decade and a half. Developing mine projects like Goldcorp’s Coffee Gold mine,
Victoria Gold’s Eagle mine, and Western Copper and Gold’s Casino project are
poised to substantially add to Yukon’s construction and mining activity in the
years to come.
○ But absent such a large positive development, where mining activity grows
substantially after 2020, the debt limit of $400 million (only half of which is
currently available) will likely be reached soon (perhaps by 2020). A prudent
approach to territorial budgeting would be robust to volatile and often unexpected
developments, either positive or negative, in commodity prices and mining
activity.
The Yukon government is responding early to developing fiscal challenges. Early actions to
correct the problem mean there are many more options than would be available otherwise.
We now proceed to understand and quantify the territory’s current fiscal situation and its
potential future. We emphasize throughout that the goals to which Yukon aims are not
predetermined. Government can balance the budget quickly or gradually, it can raise taxes or
lower spending, it can accumulate debt now in anticipation of an improved fiscal position in the
future when the debt can be repaid. These are choices the people of Yukon, through its elected
representatives, must make. Our goal is to make clear the challenges, the potential options, and
the necessary tradeoffs involved.

34
Size of Government
During its public engagement, the panel heard concerns regarding the size and growth of the
Yukon government. The data bear this out. Spending by governments accounted for less than
one-quarter of the territory’s economy in 1980. By 2015, this share had more than doubled to
now account for the majority of economic activity. Yukon and Nunavut are the only two regions
where government spending exceeded 50% of GDP.
There was a common view expressed among Yukoners that the territory is a “two-track”
economy. On one is government and its suppliers, with high and stable incomes and
disproportionately concentrated in Whitehorse. On the other is the private sector and those
living in more remote communities, with far lower and more volatile incomes and standards of
living.

35
Perhaps the dominant concern was that rising
government employment means far more difficulty
among private sector employers, and even local
governments outside Whitehorse, to recruit and
retain talent. The rising share of employment
accounted for by governments, and the Yukon
Government in particular, is clear in the data. Below
we plot the number of jobs in government, across
various levels, relative to the total population of
Yukon.
Altogether, there is roughly one job in government for each four Yukoners in 2016. Twenty
years earlier, there was one government job for each six Yukoners. Put another way, public-
sector employment is 40% of the total Yukon employment. And with rising public sector
employment comes a rising share of overall employee compensation accounted for by the
public sector. In 2016, public-sector employees accounted for just over 50% of total labour
compensation in the territory, up from just over 40% in 1997. Almost all of this growth has been
accounted for by growth at the territorial government level (that is, YG).
What We Heard
“Spending is climbing way too
fast.”
“Fundamentally we have to restrain
growth in spending and increase
revenue sources. Restrain, not
necessarily cut.”

36
The share of compensation accounted for by public-sector employees is larger than the share of
overall employment because, on average, public-sector jobs tend to have higher wages,
salaries, and benefits. To be sure, not all levels of government have high average levels of
compensation. Below we plot average hourly compensation for various government levels in the
Yukon, and also include the overall economy-wide average. Aboriginal government employees
tend to have lower average levels of compensation, and municipal (until recently) tended to earn
close to the economy-wide average. The territorial and federal governments, meanwhile, have
the highest average compensation.

37
To be clear, and this is important to emphasize, these data do not imply that government
employees are paid more than comparable employees in the private-sector. Many high-paying
occupations are in the public sector (doctors being the obvious example) and public-sector
employees tend to have different individual characteristics (such as higher levels of education,
on average). Estimating the difference between public and private sector wages, controlling for
such differences, is beyond the scope of this report and would be very difficult to do for the
Yukon, given the nature of the available data. But, these data do suggest an important option
available to the government is a review of its overall hiring and compensation policies, and
potentially near-term restraint (or freeze) in both. We discuss this option later in the report.
The panel heard from business and other levels of government about the difficulty recruiting and
retaining employees when the Yukon government is growing, and paying, so much. This is a
particularly salient and pressing concern among the communities outside Whitehorse. In some
respects, this is an unavoidable challenge in remote communities. But it highlights that
employment and compensation policies of the central territorial government have spillover
implications, often negative, for businesses and governments elsewhere.
Yukon’s Current Fiscal Challenge
Canada’s three territories face unique fiscal challenges. Small populations spread over many
remote communities increase both the cost of living and of providing government services. And
as populations age, these challenges will grow even more acute.

38
Recently, the Yukon government projected large deficits in the coming years, varying between
$40-60 million dollars or roughly 1.5% of GDP. This is a large change from earlier years where
large surpluses were the norm. But, one must interpret these numbers cautiously. The financial
health of the Yukon government is stronger than its headline deficit projections suggest. There
are a variety of entities that are excluded in such calculations. The full consolidated budget
balance is typically stronger when net income from these entities is included.
There are multiple entities included in the
consolidated budget excluded from the non-
consolidated one. In particular, Yukon College,
Yukon Hospital Corporation, Yukon Housing
Corporation, and other entities each generate
revenue that typically exceed expenses. But this
revenue sometimes takes the form of an
intergovernmental transfer from the Yukon general
government to the entity in question. Of the $170
million in other entity revenue expected for 2017-
18, $120 million is a transfer from the Yukon
government. With other entity expenses of just over $140 million, there is an overall surplus of
close to $27 million. Combined with the small surplus for the general government of $6.5 million
in 2017-18 the consolidated surplus becomes over $33 million. This is the difference between
the red and blue bars below. Over the past five years, the consolidated surplus was just over
$30 million larger than the non-consolidated. If this holds going forward, the projected deficits
are reduced by more than half when presented on a consolidated basis.
What We Heard
“How can a territory grow when
government is the main driver of the
economy?”
“I think we're missing the main
point of just living within our
means.”

39
Nevertheless, there is a marked decline in the fiscal health of the territorial government since
2015. This can be further appreciated by looking at the net financial assets of the government.
Though the plot below excludes external entities, even on a consolidated basis net financial
assets are expected to turn negative by 2021.
This is a large departure from 2015, when on a per capita basis Yukoners enjoyed high levels of
financial assets. To be sure, net debt of 6% of GDP is not unmanageable and Yukon’s balance
sheet is strong. In addition, interest burdens are currently low -- indeed, they are lower per
capita than any of the ten provinces. But rising debt means larger interest payments and
therefore higher taxes or lower levels of public services than would otherwise be the case.
This path of rising debt also means that the Yukon debt limit of $400 million is very likely to be
reached within a few years, perhaps even by 2020. As of March 2016, gross debt of the Yukon
subject to the cap is just over $200 million, leaving less than that available for future borrowing.
As financial assets deplete, future deficits must be financed through debt accumulation. The net
financial assets of the government by March of 2020 are projected to decline by over $240
million, for example, relative to its March 2017 level.
If sensible and gradual changes can be made now, Yukoners will be in a strong, more
sustainable position going forward. Let’s unpack the critical components of the budget.

40
Exploring the Budget
What’s driving this change? Where can Yukon go from here to return to a sustainable path?
What follows is a diagnosis of the current state of Yukon finances, how it has changed in recent
years, how it compares to other jurisdictions, and how it may evolve in the near future.
To begin, the following diagram visualizes the financial ins and outs of the Yukon government.
By far, the largest component of territorial government revenue are transfers from the Federal
government -- especially the Territorial Formula Financing (TFF).
Yukon’s own tax revenue has also paid for a declining share of overall public spending, from
21% in 2012 to less than 16% in 2016. This is mainly due to reductions in income tax revenues
associated with a contraction in the mining sector. We will return to this issue later, but it further
highlights the large and growing importance of the TFF for Yukon finances.
Government Spending Financed by Domestic Sources
2012 2013 2014 2015 2016
Own-Source Revenue, as % of Spending 21.3% 21.4% 20.2% 18.3% 15.7%

41
The Territorial Formula Financing
Let’s start with a brief review of how this transfer is calculated. Like the equalization program for
provinces, the TFF provides for comparable public services at levels of taxation comparable to
southern Canada. In short, the TFF grant is a “gap filler”. It ensures the territory has enough
financial resource to deliver comparable public services if the territory had average levels of
taxation.
At its core, the TFF is fairly simple and its calculation follows a three-step procedure:
1. Estimate the cost of providing public services in Yukon at a level comparable to the
provinces. This is the “gross expenditure base”.
2. Estimate Yukon’s “ability” to raise revenue if it had tax rates set equal to the national
average. (Note: this is not Yukon’s actual revenue, but a hypothetical amount.)
3. The TFF is the difference between (1) and (2), plus an “economic development
incentive”. This incentive is sufficient to allow Yukon to maintain taxes that are 30%
below average.
The details behind each of these steps matters, and we will have more to say on this later, but
the general intuition is sound. To illustrate this further, we graphically depict the TFF calculation
for the current 2017-18 fiscal year below.
It’s important to note here that like equalization, the TFF does not depend on actual
government revenue. The panel heard from some Yukoners who raised concerns that

42
additional revenue raised by the Yukon government would be clawed back by the Federal
government through a lower TFF grant. Though this was the case in prior versions of the TFF
program, it is not the case today. Instead, the TFF estimates what Yukon could raise if it had tax
rates equal to the national average. The actual rates chosen by the Yukon government do not
directly affect the TFF at all.5
The “Economic Development Incentive” is meant to reflect the difficulty of incentivizing
economic development and the higher cost of living in northern Canada. The EDI is currently
worth nearly $100 million to Yukon. To the extent that a territory chooses to have even lower
taxes than the 30% allowed for in the formula, the government will either need other sources of
non-tax income (such as investment income) or must spend less than jurisdictions elsewhere.
To be sure, the Gross Expenditure Base is only a proxy for what public services comparable to
the Canadian average would cost to deliver in the territory. There is scope for changing the way
the GEB is estimated, which we will discuss later in the report.
Currently, Yukon chooses to maintain even lower tax revenues than provided for by the
economic development incentive. Yukon’s fiscal capacity used to determine the TFF for 2017-
18 is just over $300 million. Yukon maintains actual tax and own-source revenue levels of only
about half of this. Most of this is due to below average personal income taxes and the absence
of a general sales tax.
This is not to say raising personal income taxes should or shouldn’t be done -- we will have
more to say on this later -- but the fact remains that Yukon’s policy choice is for lower than
average overall revenues. Unless matched by lower than average spending on public goods
and services, a structural budget deficit is unavoidable.
This introduces an unavoidable tradeoff that Yukoners must face. As populations age,
maintaining public services -- especially in health -- will become increasingly difficult. The TFF
formula thus provides a benchmark to which Yukon tax and spending policies may be
compared. In short, Yukon must either (1) raise 70% of its own fiscal capacity, or (2) provide
below-average levels of public services.
5 There is an indirect effect. Raising tax rates tend to distort and lower economic activity, which shrinks tax bases below what they would otherwise be. In this way, raising a Yukon tax does shrink the TFF grant, but this effect is of second order.

43
For perspective, the difference between Yukon’s 2015-16 revenue and what is expected of the
territory under the TFF is equivalent to a 7% territorial sales tax (harmonized with the Federal
GST). The introduction of a 5% territorial sales tax would bring Yukon up to the equivalent tax
average tax rates as Alberta -- by far the lowest tax province in Canada.
Even during times of high mining activity, and correspondingly high income tax revenues, Yukon
own-source revenue is consistently below the 70% threshold. The highest recently level
approached 66% in 2013-14. This is insufficient to fund comparable levels of public services in
the territory.
Finally, the cost of delivering comparable public services is calculated in a specific way. The so-
called Gross Expenditure Base increases from one year to the next as (1) Yukon’s population
changes and (2) the average national per-person spending by provincial and local governments
changes. If national per-person spending grows by 1% and Yukon’s population grows by 0.5%,
then the TFF’s gross expenditure base increases by 1.5%. There is more nuance to the precise
calculation than this, but at bottom the TFF anchors changes in Yukon’s per-person spending to
the provinces. To the extent that territorial spending grows more slowly, taxes can be lowered
below fiscal capacity; the reverse is also true. Thus, on both the revenue side and the spending
side, Yukon faces clear and binding constraints.

44
Taxes
The TFF formula reveals Yukon raises less revenue than it could. This is not an abstract
concept and low tax levels can be seen in a number of other ways and in the value of specific
tax instruments.
One measure of overall economy-wide tax burdens is the share of a region’s GDP that a
provincial or territorial government claims as tax revenue. The territories are lower than
elsewhere -- Yukon and Nunavut especially -- with taxes around 4.5% of GDP. Part of this is
due to a strong economy, but even per capita levels are relatively lower than elsewhere.
Before exploring specific tax instruments individually, we plot below the effect of adopting the
tax systems elsewhere and its effect on overall territorial government revenue. This is
essentially a measure of Yukon’s overall tax advantage relative to other jurisdictions.

45
If Yukon adopted even Alberta’s low tax system, territorial government revenue would increase
by nearly $40 million. Adopting the systems in any other provinces, revenues would increase
substantially more. Of course, this is not to say that Yukon should increase taxes. But, it
provides important perspective before exploring individual tax instruments.
Income Taxes
Below we list the personal and corporate income tax rates, for the top or bottom tax brackets,
for each province and territory. To better summarize average taxes paid by an individual in each
region, we also plot the average tax rate faced by an individual across a wide range of income
levels. We include both federal and territorial income taxes, as northern regions of Canada
receive additional tax deductions, like the Northern Residents Deduction. It’s clear that, for the
most part, income taxes in Yukon are similar on average to those in Alberta. The Northwest
Territories and Nunavut tend to have lower tax as both have generous refundable tax credits to
compensate for higher living costs in those regions, and Nunavut has a lower top marginal tax
rate.
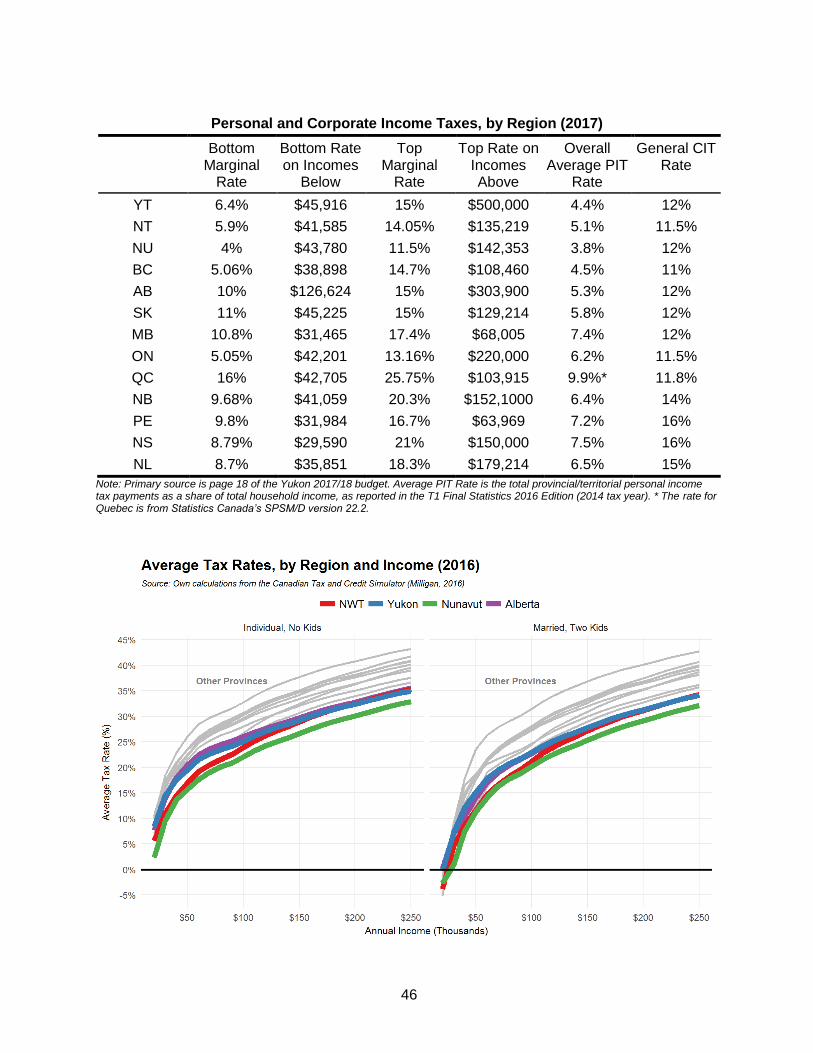
46
Personal and Corporate Income Taxes, by Region (2017)
Bottom Marginal
Rate
Bottom Rate on Incomes
Below
Top Marginal
Rate
Top Rate on Incomes Above
Overall Average PIT
Rate
General CIT Rate
YT 6.4% $45,916 15% $500,000 4.4% 12%
NT 5.9% $41,585 14.05% $135,219 5.1% 11.5%
NU 4% $43,780 11.5% $142,353 3.8% 12%
BC 5.06% $38,898 14.7% $108,460 4.5% 11%
AB 10% $126,624 15% $303,900 5.3% 12%
SK 11% $45,225 15% $129,214 5.8% 12%
MB 10.8% $31,465 17.4% $68,005 7.4% 12%
ON 5.05% $42,201 13.16% $220,000 6.2% 11.5%
QC 16% $42,705 25.75% $103,915 9.9%* 11.8%
NB 9.68% $41,059 20.3% $152,1000 6.4% 14%
PE 9.8% $31,984 16.7% $63,969 7.2% 16%
NS 8.79% $29,590 21% $150,000 7.5% 16%
NL 8.7% $35,851 18.3% $179,214 6.5% 15%
Note: Primary source is page 18 of the Yukon 2017/18 budget. Average PIT Rate is the total provincial/territorial personal income tax payments as a share of total household income, as reported in the T1 Final Statistics 2016 Edition (2014 tax year). * The rate for Quebec is from Statistics Canada’s SPSM/D version 22.2.

47
Though marginal rates are indeed lower in Nunavut, Yukon and the NWT are quite similar
across most income ranges. The NWT average income tax rates are lower primarily due to its
refundable cost of living tax credit. Both it and Nunavut have one, and it can be sizable -- up to
$1,200 in Nunavut and up to $942 for families in the NWT. Yukon has no such credit, though the
carbon tax provides an opportunity to introduce one as it provides an effective way in which
carbon tax revenues can be returned to Yukoners, especially those for whom carbon pricing is
particular burdensome. We will return to this option in more detail in Section 3.
Returning to the personal income tax system overall, what’s the aggregate effect of lower rates
for Yukon government finances? Consider alternative tax systems that exist in the other ten
provinces and two territories. We estimate in the following figure the additional personal income
tax revenue the Yukon government would raise if it adopted the tax rates found in those other
jurisdictions.
Overall, if Yukon personal income tax rates were equal to the national average, revenue would
be roughly $40 million higher. To be sure, this also represents a distinct advantage of all three
territories to attract families and businesses. But this is not the largest source of its tax
advantage, for that we must turn to consumption taxes.
Consumption Taxes
While Yukon does not have a general sales tax levied by the territory, there are a variety of
consumption taxes that Yukoners do pay. Vehicle licensing fees, insurance premium taxes, and
lottery ticket sales are some examples. Overall, in 2015-16 the territory raised just over $10
million from consumption taxes. Compared to other provinces, this is low. By how much would

48
revenues rise if the territory adopted the consumption tax rates equivalent to Canada as a
whole? We display the results, and compare this to other tax bases, below.
For additional perspective, the federal government currently levies a general sales tax in the
territory through its Goods and Services Tax (GST) -- currently set at a rate of 5%. It currently
raises approximately $40 million per year. But, to offset the disproportionate effect this has on
lower income Yukoners, the federal government also provides roughly $3 million in direct
transfers to low income households in the form of the refundable GST Tax Credit. If the territory
were to adopt an HST, with
equally generous provisions for
low income households, each
point would conservatively raise
roughly $7 million.
What We Heard
“An HST would be horribly detrimental to the
vulnerable residents here. It's not going to help
those people at all. A quarterly rebate isn't going to
help people living paycheque to paycheque.”
“I don't think we should consider ourselves immune
from a sales tax. I think it does make some sense as
long as it's directed towards capital investments in
municipalities. It's our capital infrastructure that
drives revenue. It's our pools, our rec centres, etc.”

49
Gasoline and Alcohol Taxes
Taxes on gasoline are low in Yukon --
indeed, they are the lowest in the country.
Below is a comparison, decomposed by
gas tax component.
In addition to low rates, the Yukon
government exempts various activities and
industries from fuel taxes. The exemptions
mean that fuel taxes in the territory raise
roughly two thirds of what they would if
broadly applied, at a cost of about $4 million in foregone revenue. This makes fuel use in Yukon
the lowest taxed of any jurisdiction in Canada by a wide margin.
Starting next year, the Federal carbon tax will begin to change fuel taxation levels across
Canada markedly; we turn to this particular type of fuel tax in the next section. We will also
discuss later the scope for gasoline tax increases by the Yukon government when we explore
options to raise revenue.
Alcohol taxes are not substantially different than most other jurisdictions. Below we plot liquor
monopoly profits, plus taxes from alcohol sales, as a share of total sales of alcohol.
What We Heard
“If you look at it from a different perspective
like how smoking and alcohol affects
people's health, I see no issue with creating
taxes on harmful products. You could focus
on sin taxes.”

50
Carbon Taxes
Finally, recent Federal policy developments will ensure minimum carbon pricing throughout the
country. Yukon, like all northern territories, will face unique challenges here, and careful
consideration must be made about how to best implement a price on carbon.
Yukon will specifically be a “federal backstop region”, where the Federal government
implements the price on carbon -- where combustible fuels will be subject to a charge
proportional to their greenhouse gas emissions when burned -- and the resulting revenues will
flow back into the territory. There are no large emitters in the territory, and most of its electricity
is emissions-free and the bulk of home heating is electric (and virtually exclusively so among
new home construction) the primary way in which the carbon tax will affect the territory is on its
effect on transport fuel. Even so, the magnitudes are not trivial.
A $50 per tonne carbon tax, which will be the eventual carbon tax rate in 2022, raises the price
of retail gasoline by 11.25 cents per litre. For diesel, the price increase is nearly 13.5 cents per
litre. The total amount raised from all priced fuel in the territory will be roughly $25 million by
2022.
How does this compare to current tax
levels? Current excise tax on fuel is 6.2
cents per litre gasoline, 7.2 cents on
diesel, and 1 cent on aviation fuel. For the
average Yukon household, which spends
roughly $2,600 on vehicle fuel per year,
What We Heard
“Carbon taxes are meant to bring about the
behaviour we want - i.e. using incentives.
Anything we can do to shrink the carbon
footprint makes sense.”

51
the additional cost of a $50/t carbon tax will be about $250 per year for fuel. It will also affect
Yukon home owners and business by increasing the price of heating fuel. Though new homes
are, for a few years now, exclusively based on electric heat, roughly two-thirds of Yukon homes
are still based on combustible fuel sources -- primarily heating oil.6 A typical home may use
between 1500 and 2000 litres of heating oil, and a $50 per tonne carbon tax will increase the
price of it by 13.8 cents per litre, for a typical annual cost of $200-250 per year.
In Section 3, we outline various options for the use of this revenue to buffer households from an
increase in overall tax burdens and to ensure Yukon businesses remain competitive.
Health Spending
On the spending side, health and
education are large components -- as they
are everywhere -- but public works and
highway spending is also large -- much
more so than elsewhere. Given the
territory’s small population and large land
area, this isn’t surprising. Given the
importance for the government’s budget,
both today and in the near future, we
provide a particularly detailed look at
health spending in particular to illustrate
the growing pressures an aging population creates.
Health spending is, like everywhere, disproportionately tilted towards older individuals. In
Yukon, however, the extent to which health spending exceeds the national average is especially
pronounced among older individuals. Simply put, it’s expensive to deliver healthcare in the
territories in general but especially expensive to deliver the type of healthcare demanded by
older individuals.
As Yukon has a relatively young population, spending on health is lower than it would otherwise
be if its age and gender profile matched the rest of Canada. It has also grown slower in recent
years than it otherwise would have.
But, this is perhaps not the correct comparison. Consider instead that Yukon’s demographic
profile is and evolves as it actually did, but where age/gender cohort health spending growth
matched the rest of Canada. That is, if the cost of treating your typical 20-24 year old grew 10%
in Canada over some period of time, then let’s imagine growing Yukon’s health spending for that
same cohort at 10%. We plot that below.
6 For more, see http://www.energy.gov.yk.ca/pdf/Shifting-Demand-in-Yukon-Heating.pdf
What We Heard
“We need to know where the spending is
going, is it medication, surgeries, etc. These
will help determine how we work towards
fixing it.”
“We can't even birth children outside
Whitehorse.”

52
By 2014, actual real per capita health spending in Yukon was about $500 per person more than
it would have been if health spending growth (at the age/gender cohort level) matched the rest
of Canada. For perspective, if health spending was $500 per person lower, overall spending on
health by the territorial government would be nearly $20 million less -- which is roughly the
forecasted annual consolidated fiscal deficit in the coming few years.

53
To understand the driving forces behind rising health spending, consider the following estimates
of health spending by age cohort in Yukon and Canada. Not surprisingly, Yukon spends more
than the rest of Canada in all age categories, but this is especially pronounced among the older
age groups.
Some of this reflects the fundamental and unavoidable challenge of delivering healthcare in
remote communities with low population density. The next figure is the same plot as above, but
for Yukon only and adjusted for inflation over time. It shows rising costs since 2004. Health
spending on older Yukoners is rising quickly.
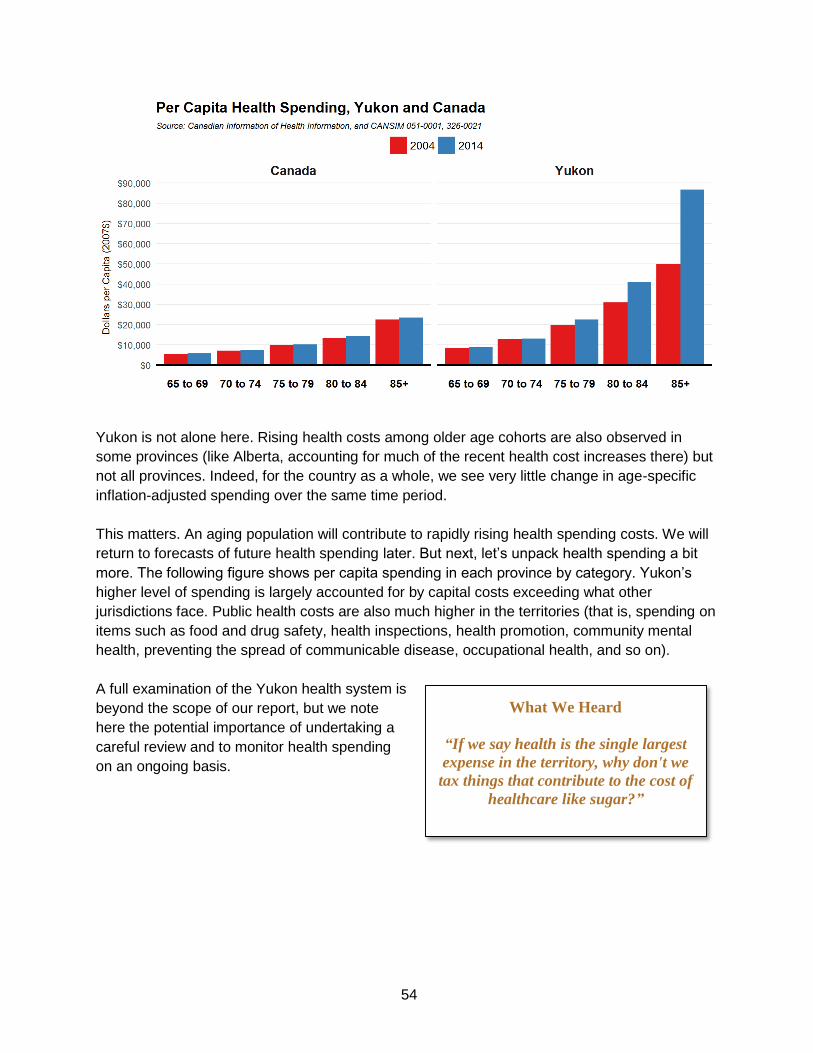
54
Yukon is not alone here. Rising health costs among older age cohorts are also observed in
some provinces (like Alberta, accounting for much of the recent health cost increases there) but
not all provinces. Indeed, for the country as a whole, we see very little change in age-specific
inflation-adjusted spending over the same time period.
This matters. An aging population will contribute to rapidly rising health spending costs. We will
return to forecasts of future health spending later. But next, let’s unpack health spending a bit
more. The following figure shows per capita spending in each province by category. Yukon’s
higher level of spending is largely accounted for by capital costs exceeding what other
jurisdictions face. Public health costs are also much higher in the territories (that is, spending on
items such as food and drug safety, health inspections, health promotion, community mental
health, preventing the spread of communicable disease, occupational health, and so on).
A full examination of the Yukon health system is
beyond the scope of our report, but we note
here the potential importance of undertaking a
careful review and to monitor health spending
on an ongoing basis.
What We Heard
“If we say health is the single largest
expense in the territory, why don't we
tax things that contribute to the cost of
healthcare like sugar?”

55
The Future of Yukon’s Finances
To prepare ourselves to think about
the future of Yukon’s finances, let’s
first consider the recent past. This
is potentially valuable since
changes in government spending
do not come easily. Much of what
government spends is in the form of
wages and salaries and the
provision of services that many
citizens value. In 2015-16, for
example, the latest year for which
we have data, wages and salaries
on personnel accounted for most
spending, with direct transfers to households and businesses a close second.
What We Heard
“I don't think we should be totally averse to deficit
spending. It has been shown to help governments
get back to where they need to be.”
“The economy is just going to continue to
strengthen and this whole process is unnecessary.”

56
Making changes in spending is therefore challenging. The same is true of changes to revenue.
Government collects revenue from citizens and the more revenue that is collected, the less that
remains in the pocket of citizens. Changing taxes is therefore similarly difficult for governments
to introduce as it impacts the incomes of citizens very directly.
The following table shows how key revenue and expenditure categories have changed over the
past 10 years, from 2007 to 2016. Three columns of figures are shown. The first measures the
average annual rate of change in each revenue and expenditure category when these amounts
are measured in nominal dollars. In this column, no adjustment has been made for inflation or
for population growth. The second column of figures shows annual rates of growth in real
dollars; that is, after we have removed the effects of inflation. This adjustment is important
because it removes the effects of inflation and so gives a truer picture of the choices being
made by the government. Finally, the third column of figures shows annual rates of growth in
real per capita dollars. Now we have adjusted for both inflation and for the fact the government
is collecting revenue and providing services to a larger population. Were revenues and
spending constant in real per capita terms (a zero annual rate of growth) this would mean the
government was neither increasing nor decreasing the amount of revenue it collected from each
citizen and the amount of goods and services it was providing to each citizen.

57
Average Annual Growth in Key Revenue and Expenditure Categories, 2007-2016
Nominal dollars
Real dollars Real per capita dollars
Total Revenue 4.9% 3.3% 1.7%
Federal Transfers 5.3 3.7 2.1
Taxes and general revenues 4.3 2.7 1.1
Income from GBE -0.4 -1.9 -3.4
Other -0.1 -1.6 -3.1
Total Expenditure 5.7% 4.1% 2.5%
Health & Social Services 6.0 4.4 2.7
Community and Transportation 6.8 5.2 3.6
Education 4.2 2.6 1.0
General government 3.9 2.4 0.8
Natural Resources 8.7 7.1 5.4
Justice 6.1 4.5 2.9
Business, tourism and culture 2.6 1.0 -0.5
Interest on loans 1.8 0.3 -1.3
These average annual rates of growth are in some way central to identifying the territory’s
current fiscal problem. In particular, the fact that over the past 10 years, total revenues have
grown at a slower rate than total spending is the reason why the financial position of the territory
has deteriorated. But these two values are also important because they show that dramatic
changes to revenue and spending choices are not necessary to resolve the problem. Thus, a
modest slowing in the annual rate of spending growth, a modest increase in the annual rate of
revenue growth, or some combination of these two adjustments, will enable the government to
halt the deterioration of its financial position.
We emphasize this point with a simple exercise that recognizes there is a lot of inertia in
government budgets and so the near future is not likely to look a lot different from the recent
past. The exercise assumes revenue and spending categories grow at rates observed in the
recent past and shows the implications for the budget balance of minor adjustments to those
rates of growth.
Presuming overall nominal GDP growth of about 5% to 2020, even accounting for the expected
drop in 2017, is not unreasonable. Let us therefore presume future revenue growth matches the
4.9% observed since 2007. If government spending also grows continued as in the recent past,
an increasingly worse fiscal situation arises, with spending growing faster than revenues and
deficits growing without end. Instead, consider some alternative scenarios.

58
Restraining the growth rate of spending in any of the major spending categories to not exceed
population plus inflation will ensure sustainable budgets in the future -- with the exception of
education. Thus, some mixture of restraint in all of the above such that spending growth overall
does not exceed 1 to 1.5% in excess of population plus inflation is sufficient.
The clear implication of this simple exercise is that draconian cuts to spending or dramatic
increases in tax rates are not necessary to put the territory’s finances back on a sustainable
footing. Indeed, it is important to stress that when it comes to spending adjustments, for
example, nominal cuts are not required. All that would be required is a slower rate of growth in
nominal spending to more closely match the rates of increase in prices and population.7
Is Yukon on an unsustainable track even if policy changes do not occur? Not necessarily.
Strong real GDP growth beginning in 2019 and onwards, driven mainly from new mining
operations (Coffee Gold, Eagle Gold, and Casino), may help improve the territory’s budget
situation. The Conference Board of Canada expects both the Eagle Gold and Coffee Gold
projects to begin by 2020 and together will add over 310,000 ounces of gold production per year
-- triple Yukon’s 2016 total.8 This will meaningfully boost Yukon’s GDP and employment, which
increases personal and corporate taxes revenues. They expect the territory’s budget to balance
in this scenario, absent other policy changes.
7 It is also important to emphasize that these simple exercises take no consideration of the potential impact of productivity gains in the provision of government services. The potential for such efficiencies is the topic of a later section. 8 Monthly mineral production data, by region, is available at http://sead.nrcan.gc.ca/prod-prod/pclm-monthly.aspx?FileT=201702&Lang=en

59
The Conference Board forecasts also highlight how quickly, and substantially, Yukon’s fiscal
picture can change. Comparing the Board’s Summer 2016 Outlook with its latest 2017 Outlook
is particularly revealing. Many of the options we propose later aim to decouple the territorial
government from such a volatile sector of the economy. While the latest outlook for mining is
bright, and therefore so too is the government’s fiscal picture, unexpected developments in
global commodity prices cannot be discounted.
One complication must be noted. To the extent that workers associated with new mining
projects live on First Nations land, 95% of the worker’s income payments will go towards their
government rather than to the Yukon government. We will have more to say on First Nation
fiscal issues in a later chapter of this report.
It’s further worth noting that even in the less optimistic forecast from the Conference Board’s
2016 report, the debt to GDP ratio in the Yukon is not forecast to exceed that of any province.
To be sure, this is but one forecast, and it would be prudent for Yukoners to ensure government
budgets are set on a sustainable path regardless of developments in the mining industry. And
even in this optimistic scenario the accumulation of debt implied by this forecast will result in the
current $400 million debt limit being potentially breached.

60
Future Health Spending
Using our earlier estimates of
health spending by age group,
coupled with Statistics Canada
demographic projections, we can
construct a forecast of future health
spending due to an aging
population alone. By 2030, Yukon
is set to spend $2,500 more per
person in 2030 than today. An
increase of roughly $90 million in
today’s dollars. And this is only due
to an aging population, and
abstracts from the many other
factors that also contribute to health spending growth.
For a broader forecast, consider the latest Conference Board forecast of Yukon health
spending. This incorporates various other factors that push health costs to increase faster than
overall inflation, such as new and costly health technologies. The forecast is for health spending
to reach well over 40% of the territorial budget by 2030 -- with annual increases averaging 5%
per year -- or 2% per year after adjusting for inflation and population growth.
What We Heard
“There are major issues with health care in the
communities. Astronomical costs of getting people
to Whitehorse and beyond to see a specialist for a
consult. Why can't people use Telehealth for
consults?”
“Massive subsidies provided to long-term care
($35/day). Pretty massive cost.”

61
To ensure budget balance in the face of such rapid increases in health costs, either other
components of spending must grow at more restrained rates or tax revenue growth must
increase.
Volatility of Revenue Sources
Absent tax policy changes, Yukon government revenue is highly dependent on activity in the
mining sector. Exposed to volatile global commodity prices, Yukon mining -- like commodity
industries everywhere -- has been pretty hard hit. Real economic activity in that sector fell by
roughly half between 2013 and 2015. This affects government revenue through corporate and
personal income taxes.
Alternative tax instruments are less susceptible to such movements. To show this, we plot the
volatility of different tax bases over the past few years for which data exists. Specifically, we
calculate the volatility of the tax bases (not actual revenues) of income, property, and
consumption as measured by the “coefficient of variation” of each. This measure of volatility
shows the typical year’s change in the size of each tax base relative to that base’s average
level. Consumption taxes are roughly half as volatile as business income taxes. This is not
unique to Yukon.

62
Volatility of government revenue also makes planning difficult. In fact, not a single projection
since the Yukon government began publishing 5-year forecasts has materialized. We plot this
below. The rapid drop in own-source revenues recently is evident. Had this drop not occurred,
there would be no fiscal problem to deal with. This is the challenge when revenues are tied

63
closely to activity in a volatile sector of the economy. This is not because of any failing on the
part of public servants or lawmakers, but represents a feature of the Yukon tax system.
Budget projections also fail on the spending side. In nearly every year for the past 15, budget
projections of territorial spending have understated the actual growth. To some extent, this may
be due to transfers rising faster than expected (which is also consistently the case) or more
rapid population growth than expected. But, as the following plot makes clear, even as recently
as the 2016-17 budget, spending projections remained relatively flat but in 2017-18 the
projection is for spending growth.
Comparing revenue and spending projections with their actual outcomes reminds us that
sustainable and responsible budgeting requires stable and predictable revenue sources.

64
Summing Up
In this chapter, we have examined the government’s annual budget and its financial position in
the context of what economists understand to be good budgetary and financial choices. Our
focus has been on relatively short-term issues and we have left for the next chapter the potential
for policy changes to influence social and fiscal changes that affect the Yukon economy and the
government's fiscal challenges over a longer term.
We applaud the government for responding quickly to a recent deterioration in the territory’s
finances by investigating options for corrections. Early action is important because the
government faces a rapidly approaching debt limit, making adjustments inevitable. The options
open to the government are more numerous and the size of the fiscal actions are smaller the
sooner concrete steps are taken.
Next, we build on what has so far emphasized near-term challenges for Yukon and in Section 2
turn to examining longer-run considerations. Following that, Section 3 describes in detail options
available to the government for stabilizing its near-term fiscal position and ensuring its long-run
trajectory of economic growth is robust, sustainable, and inclusive.

65
Priorities of the Yukon
Government

66
Priorities of the Yukon Government – Context and
Constraints
Yukon Government Priorities
In its first Throne Speech [April 20, 2017] the Yukon government committed to four key
priorities. In brief, they are:
Build a strong Yukon by creating good jobs in a sustainable economy with a focus on
strengthening and diversifying the economy and protecting the environment
Establish a people-centred approach to wellness to meet the needs of Yukoners
Invest in communities with a focus on community-led approaches
Restore and maintain respectful government-to-government relationships with First
Nation governments
In its subsequent budget, the new government attempted to give effect to these priorities with
several initiatives for each of them. In summary, those initiatives included:
To promote sustainable growth and good jobs – lower the Corporate Income Tax [CIT] ,
enhance tourism marketing, make mining investments, double the budget of the
Regional Economic Development Fund and invest in bridge and highway maintenance
To establish a people-centred approach to wellness – increase expenditures on: youth
programs, health care, addiction treatment, education and skills/training
To invest in communities – make investments in lot development, local infrastructure,
group homes, shelter beds and affordable homeownership
To restore and maintain respectful government-to-government relationships with First
Nations – provide increased funding for the Yukon Forum, Aboriginal women’s
organizations, housing and energy retrofit programs
It is not the purpose of this chapter of the report to assess or to offer advice on either the budget
initiatives chosen or the priorities on which they are based. Rather, the discussion will focus on
the broader context within which the priorities have been set and, in particular, on the
constraints that will affect the capacity to achieve the objectives embedded in the priorities. It
will also offer suggestions to the government on approaches it may wish to consider to mitigate
those constraints and, thereby, enhance the prospects for fulfilling its objectives.
67
In the next section the focus is on the key elements of context and constraints [mainly fiscal but
also demographic, labour market, health & education] Yukon will face not only in the short term
but over the medium- to long-term as well.
Priorities and Context/Constraints
While Yukon faces the types of constraints that all governments deal with, there are two key
characteristics of the territory that differ significantly from those faced by most other jurisdictions
in Canada.
Like the NWT and Nunavut, Yukon has a small population, low population density and remote
location relative to more populous areas/markets. Among other impacts, these features limit the
scope for scale economies [hence cost reductions] and for diversity in government service and
program delivery. It also severely constrains industry structure diversity and economic
development opportunities.
With almost 75% of Yukon’s population concentrated in the Whitehorse area, these scale and
diversity limitations are exacerbated for the communities – First Nations and non-First Nations –
outside of Whitehorse. The challenges, for example, of providing adequate access to and
quality of health care was an issue raised regularly in our consultations.
First Nations constitute a significant proportion [almost 25%] of Yukon’s population; although a
smaller share than in NWT or Nunavut, it is larger than that of any Canadian province. As noted
in another section of the report [First Nations' Fiscal Relations] there are fourteen Yukon First
Nations, of whom eleven have comprehensive land claims agreements [Final Agreements]
that designate settlement land and deal with a range of financial/fiscal matters. Even if it were
not a stated priority of the government, there is an evident need for program choices to be
developed, through discussion and negotiation with each of the First Nations, to respond to the
economic and social challenges faced by their communities.
Frustrations over the slow pace of such developments were frequently raised by First
Nations in our consultations process. As well, the complexities of bilateral and trilateral
interaction of First Nations, Yukon and the federal governments became evident to the Panel
members during those meetings.
The first chapter of this report discusses, in considerable detail, the revenue and expenditure
patterns of the Yukon budget over the past ten years and the projected fiscal position to 2021 in
the absence of deliberate changes in fiscal policy. The discussion in chapter 1 makes it clear
that the Yukon government has legislated mandates and established commitments not only in
healthcare but also in areas such as social services, infrastructure maintenance and education
that significantly limit the scope for new or enhanced initiatives with respect to the government’s
stated priorities.
The options to be considered for achieving balance and greater revenue stability, for the most
part, do not imply a material change in the extent of the fiscal constraints with respect to the

68
government’s priorities. However, decisions about the degree and duration of spending restraint
and/or the utilization of new revenue sources like a carbon tax or a consumption tax could
substantially change the fiscal “pie” to be allocated and, hence, affect the fiscal constraints
under which the Yukon government will function.
In addition to the fiscal options to be contemplated, a focus on longer-term structural changes in
government policies opens up other prospects for easing the financial and human resource
constraints that government faces. Two distinct types of policy changes can be considered.
First, there are specific spending or tax changes that could increase potential economic growth
and, thereby, increase fiscal resources while also improving job and income opportunities for
Yukoners. While subject to debate [mainly] about the size of the impacts, reductions in
corporate income taxes, increases in economic [vs. social] infrastructure investments and
effective spending on enhancement of workers’ skills can increase long-term trend growth in the
economy. These are considered below in the section on Mitigating Constraints and Improving
Trade-Offs – Policies For Improving Trend Growth.
Second, improvements in the design and delivery of government services and programs can
generate improved outcomes at the same or lower costs, thus freeing resources for other uses.
Among the adjustments that could be considered are internal operational changes to improve
public sector efficiency and effectiveness, innovations in program design, delivery and funding
and initiatives to share costs and risks with the private sector especially in the management
[and even ownership] of public sector assets. These are examined in some detail in the section
on Mitigating Constraints and Improving Trade-Offs – Improving Public Sector Efficiency.
There are demographic and labour market factors – e.g., the age profile of the population,
skills/education levels of the workforce and the intensity of labour force attachment -- that can
affect fiscal choices with respect to short-term budget allocations. They can also have an
influence on long-term economic growth that can affect government revenue patterns. For
example, the pressure on health care costs will tend to be more moderate [other things equal]
for a population with a lower average age than other jurisdictions in Canada. On the other hand,
spending on education will tend to be higher for a younger population. Skills/educational
attainment levels and labour force attachment intensity will affect productivity levels and
economic growth potential. Higher levels in each category will tend to imply greater productivity
and enhanced rates of growth.
A high level overview of the high-level demographic and labour market data for Yukon would
suggest that the territory is experiencing less challenging problems than other parts of Canada.
While the population is going to experience increasing average age, it will do so from a younger
baseline than for Canada as a whole. Combined with the comparatively higher employment rate
[and lower unemployment rate], this means that Yukon has a lower dependency ratio than the
Canadian average. With respect to incomes, median total and employment income as well as
household disposable income per capita [in nominal and real terms] are above the norm for the
rest of the country.

69
While Yukon has a younger population than is the case for Canada as a whole, per capita
spending on healthcare is much higher. Much of that will be due to a small population spread
over a large area that inhibits achievement of scale economies in administration and delivery of
services. However, as noted in Chapter 1, the age-adjusted rate of increase in spending on
health is much higher when compared to the Canadian average. This is particularly the case for
older Yukoners, indicating that cost pressures for an aging population will, if the recent trend is
unchanged, be more intense for the territory. This issue is discussed further below.
With respect to healthcare outcomes, it appears that Yukon tracks well below the Canadian
average in some key comparators. For example, in the CIHI list of fifteen indicators of health
status, the territory is below the Canadian average on ten. Of those the most notable are life
expectancy at birth and at age 65 and avoidable deaths [per 100,000 people]. There are several
social determinants of health – alcohol use and smoking in particular – for which the numbers
are worse than the national average. Yukon also ranks below the country norm on two
measures of healthcare efficiency.
It is suggested in Chapter 1 and below in this chapter that a comprehensive health system
review would be very much in order. The current and trend costs of healthcare and the
outcomes data both point to the need for such a review.
With respect to education, the proportion of Yukon’s labour force with some or completed post-
secondary diplomas or degrees is quite similar to the national average [69% compared to
Canada’s 71%]. Hence, at a high level, the educational attainment outcomes for the workforce
overall is about as strong as occurs in the country as a whole.
However, at the public school level of education, there are significant disparities in specific
outcomes such as literacy [reading and writing skills] and numeracy between First Nations [and
other indigenous students] and non-First Nations students as well as between urban and rural
students. In a population in which First Nations and other indigenous peoples make up almost a
third of the total and in which the rural share is more than double the national average [40% vs.
18%], material differences in educational outcomes represent a significant social and economic
cost to society. Fortunately, the Yukon government and its Department of Education appear to
be well aware of the challenges and are continuing to develop mechanisms [including
curriculum design and revised assessment tools] to attempt to ameliorate them. A number of
education agreements with specific First Nations governments have been established.
Mitigating Constraints and Improving Trade-Offs – Policies for
Improving Trend Growth
An increase in the trend growth rate of the economy offers the most significant potential
contribution to reducing fiscal constraints. To the extent that the economy grows at a faster pace
than would otherwise be the case, revenues from business and personal income taxes and from
sales taxes will be higher thus increasing the financial resources to be allocated. As well, the
70
cost pressures of income and in-kind transfers in the social services budget will tend to be
reduced.
There are essentially three factors that will cause, separately or in combination, the economy to
grow at a higher rate on a sustained basis. They are: an increase in the number of people
working, an increase in the amount of capital with which they work and/or an increase in the
efficiency with which these two inputs [labour and capital] are utilized. An increase in the capital
stock and improvements in the quality of both labour and capital inputs are the underpinning for
increases in productivity. Rising productivity, in turn, is the only source of rising living standards
[conventionally measured as income per capita or income per worker].
At the risk of oversimplifying, the quality of labour increases with improvements in skill/education
levels and technological change is the term that captures the various ways in which
improvements in the quality of capital occurs. Technological change includes not only more
effective machinery, equipment and software but also improved processes for producing goods
and services. Technological change [and the innovation that gives rise to it] has been,
historically, the most important source of rising productivity. This is especially so for so-called
transformative or disruptive technological advances such as the information and
communications technology [ICT] “revolution” experienced over the last 30-40 years.
There is a wide range of policies that have been or could be proposed that might enhance
economy-wide productivity. It must be admitted that there is no settled view [analytically or
empirically] on which ones or which combinations “work” let alone on the size of their impact or
the contribution that a given policy may have contributed. There is a vast literature in this area
that is beyond the scope of this report to summarize. Instead the focus will be on three policy
areas mentioned earlier in this chapter – business income tax cuts, infrastructure spending and
skills/education enhancement. The first two are directly controlled by the government and the
third is a major component of the budget.
The decision by the Yukon government to cut business taxes in the most recent budget is
consistent with the widely held view of most economists that such reductions, especially for
larger corporations [to whom the CIT applies], can induce increases in capital investment either
from firms already in the jurisdiction or from those considering a new location. The size of the
relationship between a given tax cut and the resulting impact on investment – the amount of
spending increase per percentage point reduction – is not known with certainty although the
direction of impact is largely agreed upon.
In addition, there is a secondary consequence which is the subject of considerable recent
empirical research. It appears that a significant share of the burden of an increase in corporate
income taxes [or benefit of a reduction] is felt in the compensation of employees in the firms to
whom the tax applies. The explanation for this is that, since capital is more mobile than labour,
an increase [decrease] in business tax rates will discourage [encourage] investment, reducing
[raising] labour productivity and reducing [increasing] workers’ wages.

71
A recent study by two Canadian economists has also shown that the relative magnitude of the
impact [negative or positive] varies across jurisdictions. For example, it appears that a similar-
size increase or decrease in the CIT will have a bigger impact on workers’ compensation in PEI
than in Alberta or Ontario. Although Yukon was not included in the study, the fact that smaller
jurisdictions appear to be more sensitive to CIT changes suggests that the territory is moving in
the right direction by lowering its regular business tax rates. There is likely to be a positive
impact both on investment and on income distribution.
Infrastructure spending by governments can, it is generally asserted, increase private sector
productivity by reducing firms’ operating costs. Better transportation networks [e.g., roads,
bridges, airports] and more efficient [especially lower cost] bulk electricity systems are obvious
examples of infrastructure that can influence firms’ costs. Less obviously, healthcare and
education facilities may also improve private sector performance if the quality of the facilities
themselves – as opposed to the quality of the services delivered from them – improves,
respectively, the health and skill/education levels of workers.
It is important to note that the reference above is to economic rather than what might be called
social infrastructure. As important as community centres and recreational facilities are to the
quality of life in the communities where they are located, they do not generally contribute to
productivity or to long-term economic growth. That is, they do not typically lower firms’ operating
costs or raise the productivity of the workers of those firms. On the other hand, Yukon’s
significant commitment to maintaining and improving its core infrastructure can, at a minimum,
keep firms’ costs from rising, hence making the territory an attractive place for companies to
stay or come.
There is an important caveat to the comments about the consequences of investments in social
infrastructure. While such spending may not directly affect firms' costs/productivity, it is possible
that certain types of social infrastructure developments can influence workers' skills and
productivity. For example, a community centre, by providing alternative activities for young
people, may help to reduce drug and alcohol use/dependency. If this induces greater
educational attainment and stronger labour force attachment, there would be positive long-term
economic growth benefits
The conventional view of education and training as the source of skills enhancement of the
workforce is fundamentally correct. An improvement in the overall level of skills will tend to raise
the level of productivity in the economy. There is an extensive literature – conceptual/analytical
and empirical – on the relationships among education, training, productivity and growth. It
clearly points to a positive impact on productivity levels and growth of higher levels of education
and skills.
However, along the continuum from basic or foundational education [primary/secondary
schooling] to advanced education [post-secondary], specific trades and professional training,
lifelong learning and retraining, there is little guidance for policymakers on where to spend
incremental resources. That is, there is little guidance from research as to whether an extra
72
dollar of spending on skills enhancement is best allocated to pre-school, public school, post-
secondary and advanced training, retraining or remedial training.
A key reason for that is that we have relatively limited comparative information on
education/training outcomes. Exceptions like the Programme for International Student
Assessment [PISA] provide test-based results for student scores regarding proficiency in
reading, math and science. The testing is conducted for countries as well as for sub-national
areas. This allows analysis of trends over time as well as inter- and intra-country comparisons. It
is argued that inferences may be drawn from the approaches used in the highest performing
educational systems for adjustments in the foundational education systems of the poorer
performing regions. However, even if that were true, it does not assist policymakers in resource
allocation decisions across the spectrum of education and training programs and institutions.
Hence, it may be that, with the best of intentions, governments over-allocate to some segments
of the spectrum [e.g., post-secondary institutions] and under-allocate to others [e.g., remedial
training such as functional literacy]
Mitigating Constraints and Improving Trade-Offs – Improving
Public Sector Efficiency
Rather than discuss the wide range of policies that governments have attempted or
contemplated to enhance economy-wide productivity, the previous section focused narrowly on
those policy areas in which the government can apply direct control [business taxes and
economic infrastructure] or in which public sector spending dominates resource allocation
decisions [education and training]. In this section, the focus will primarily be on initiatives that
the government can take to improve the efficiency of its own operations and programs. The
discussion provides a basis for suggesting possible structural changes in policy – from program
design and implementation to assessment and adjustment.
There are three broad approaches to improving productivity/efficiency in the provision of public
services. They comprise own-productivity improvements, ownership and risk management
sharing with the private sector [“partial privatization”] and transfer of ownership and risk by
divesting public assets [“full privatization”]. Each will be discussed in turn.
Internal operational changes to improve public sector efficiency and effectiveness can include
institutional reorganization, skills upgrading of public servants, capital investment and
process/delivery and funding innovations.
Institutional reorganization can take many forms from moving around senior civil servants and
reorganizing departmental mandates to consolidating [and then decentralizing] stakeholder
boards in areas such as healthcare and education. This is the easiest change to undertake and
the least likely to increase efficiency or effectiveness in the operations of government [or of
private sector firms]. This is otherwise referred to as “rearranging the deck chairs”.

73
Upgrading the skills of public servants, like any upgrading or retraining, has the potential to
improve productivity in program development and delivery. Additional postsecondary education
and various types of professional development activities can certainly pay dividends. Effective
improvement is more likely if there is a project or program focus to the upgrading activities
and/or if there is link to other process or service model adjustments.
Capital investment, especially in IT infrastructure and data analytics, can improve service quality
and generate data for monitoring progress in achievement of policy objectives. This is not an
argument for merely upgrading IT infrastructure for its own sake but for spending that is targeted
to enhance program design and delivery. An obvious example is the much sought-after but still
elusive [effective] electronic medical health records infrastructure. On the analytics side, it is
essential for governments to pay much more attention to assessment of the outcomes being
generated by programs and policies rather than to the allocation of inputs.
Innovation in government administrative processes and in delivery of programs and services is
arguably the most important source of potential productivity enhancement in the public sector.
However, because the rewards are highest from innovation, it is also the source of most risk to
both civil servants’ career aspirations and to politicians’ prospects for future electoral success.
There are a variety of typical barriers to process and service delivery innovation in the public
sector. The first is the absence of price signals and of functional incentives to guide behaviour.
That is, with little or no competition from other providers, there are no market-based indicators
[e.g., lower unit costs of specific services] of success or of improvement in program
performance. As a result, with limited and often difficult-to-interpret indicators of outcomes, the
design of appropriate performance incentives is very challenging.
Second, risk of failure and the resultant career impact from novel policy initiatives inhibits
anything but modest, incremental innovations. Material changes in program design or delivery
are usually done in the context of a perceived or real crisis affecting the particular policy area. In
such instances, significant adjustments are often done in haste and reflect inadequate
consideration of consequences both intended and unintended. The latter can be especially
damaging to policy outcomes.
Another, less obvious barrier to successful innovation is the reluctance to provide “sunset”
provisions for programs that are initially intended to be experimental. That is, if a new program
actually is developed on a trial basis, it should have built into it provision to eliminate it after a
specified period of time unless its assessment indicates it should be continued or only modestly
modified. Otherwise an experiment becomes an entitlement.
The barriers mentioned may be relatively easier to overcome if attempts at innovation are not
system-wide but department or even service-specific. Hence, for example, given its dominance
in public spending, innovations in health care delivery and funding are, potentially, the most
fruitful area on which to focus efforts to increase efficiency and reduce unit costs. Several
suggestions for consideration are provided in the next section, Back to Government Priorities –
Policy Change Considerations.

74
Partial privatization, as defined here, involves the transfer of a portion of operational and
financial risk to private sector service providers. Its primary purpose is to reduce costs of
delivery relative to those experienced or expected from internal public sector management and
control. It may also be designed to increase the quality or effectiveness of a program’s services.
This type of “privatization” is often generally referred to as a public-private partnership [P3]
although there are several variations on that theme.
Public-private partnership [P3] initiatives are used most often for large and sometimes complex
infrastructure projects in which there is risk-sharing of costs but asset ownership is ultimately
retained by the government. As defined by PPP Canada, “Public – Private Partnerships (P3s)
are a long-term performance-based approach to procuring public infrastructure where the
private sector assumes a major share of the risks in terms of financing and construction and
ensuring effective performance of the infrastructure, from design and planning, to long-term
maintenance”. In particular, private firms assume most of the [financial] risks of time and cost
overruns, defects in the assets constructed and unplanned maintenance costs. Projects can
have up to five components of design, build, finance, operate and maintain [DBFOM].
In Canada, PPP Canada currently lists 24 projects that range from transit [bus and rail] and
bridge and highway construction to water/wastewater treatment, hydroelectric and social
housing projects. The list also includes an all-season road project in the Northwest Territories
and airport renovation in Iqaluit. Some of the projects are underway and others have still to
finalize private partners.
Of the 24 projects listed by PPP Canada, 16 have all five components [DBFOM]; in 5, the
private firm does not operate the asset and in 1, there is no private financing. The final 2 omit
operation and management. In none of them is there a reference to the revenue from operating
the asset coming from user fees or tolls. The implication is that the fees for management of a
facility will come from general revenues of the government. Hence, user fees or tolls are not a
necessary element of an infrastructure project in which private firms share the operating and
maintenance costs risks with the government.
There are relatively few examples in Canada of joint public-private ventures involving tolls or
fees that cover the costs of operations and maintenance and provide a net return to the private
firm. This concession/lease approach confers time-limited private “ownership” of the assets in
the sense that the facility is run as if it were privately owned and consumers are charged for the
use of its services. Two well-known examples in Canada are the 407 Highway that runs around
Toronto as an alternative to the untolled 401 Highway and the Confederation Bridge between
Prince Edward Island and New Brunswick that replaced one of the ferry services. Both are of
the DBFOM variety of P3 project. In each case, the ownership of the asset will revert to the
provincial government when the lease period has ended.
Another type of partial privatization sometimes gets lumped into the P3 designation but is
essentially different in character and has a longer track record. Governments sometimes will
contract out services to private providers rather than produce them with their own facilities,
equipment and workforce. Usually done for purposes of cost reduction, contracting out can also

75
provide access to specialized expertise that would not be economical to hire. A conventional
example of the latter is the retention of professional consultants to provide analysis and advice.
A rarely used mechanism for improving cost efficiencies and/or quality of government services
is the outright sale or full privatization of government assets. Two well-known examples in
Canada are the sale to private investors of 51% of Ontario’s Hydro One asset and the
privatization of liquor retailing in Alberta. The rationale for full privatization can include one or
more of: monetization of future income streams to fund current infrastructure, improvement in
customer service and reductions in capital and operating costs not attainable through continued
public ownership.
In cases of partial or full privatization the government can and does typically exercise some
control over the delivery of services by private operators. For example, the Alberta government
exercises regulatory authority over the sale of alcohol and collects revenue from consumers
through price mark-ups. The Ontario Energy Board regulates the rates that Hydro One charges
its customers. Increases in the tolls on the Confederation Bridge and Highway 401are limited to
a maximum rate per year in the agreements with the private operators. In P3 contracts,
considerable authority rests with the public sector in monitoring and assessing service quality
and facility maintenance.
Back to the Government’s Priorities – Policy Change
Considerations
This final section will offer suggestions for the government to consider regarding improved
efficiency and effectiveness of its policies especially as they relate to the four categories of
current priorities. It is beyond the scope and time available to do more than draw on the
preceding discussion for support for the suggested actions. Much more analysis would be
necessary to firm up specific recommendations. However, comments on the suggestions,
made during the consultation process, are also reflected in the discussion below. The options
for consideration and further analysis are grouped by priorities to which they can most readily be
attached.
Before proceeding to the suggestions tied to the government’s priorities, there are two
suggestions of a more general nature that the government could consider.
The point is made above that governments should, as rigorously as possible, assess the
programs they deliver as well as the processes used to do so. Particular attention needs to be
paid to policy outcomes rather than to the allocation of inputs that has historically been the bulk
of the analysis in program evaluation. It is encouraging that the Department of Finance is in the
process of increasing its capacity for program evaluation and that the focus is on policy
outcomes. Given the “central services” nature of the work of Finance and/or Treasury
departments, this is an appropriate locus for such work. However, that does not relieve the “line”
departments of the responsibility to utilize their experience and expertise in defining the type of
data required for assessment of outcomes and, as appropriate, engaging in the collection of
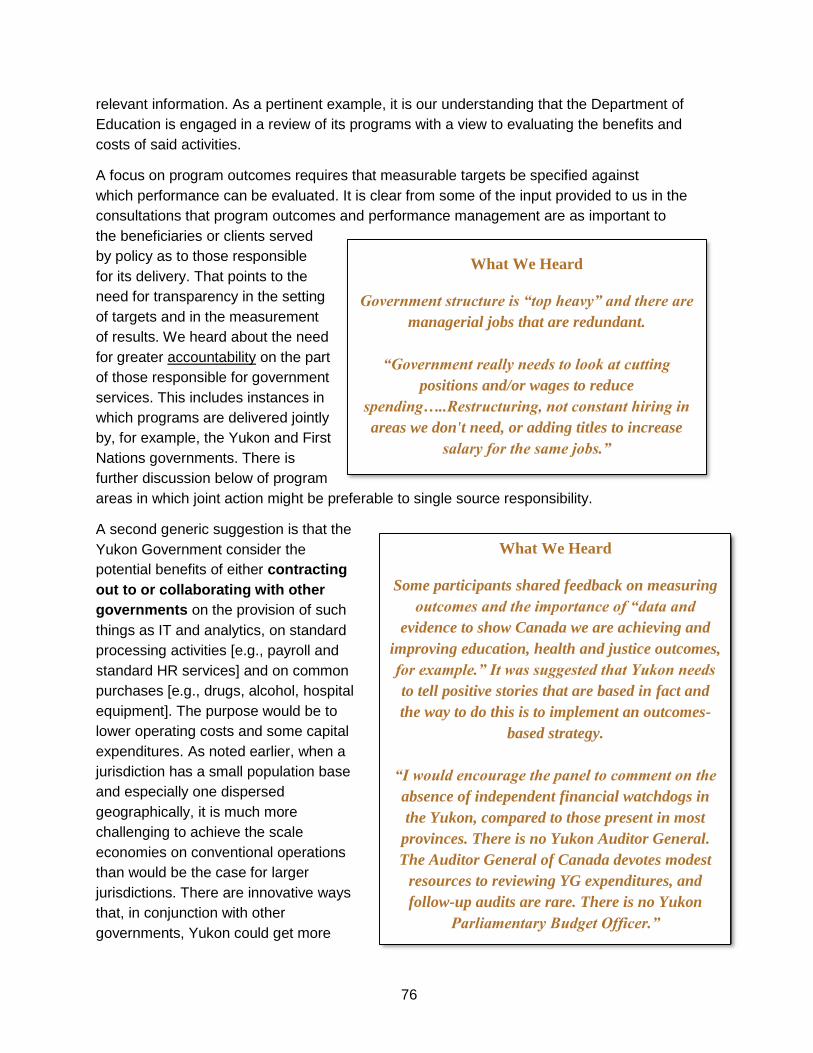
76
relevant information. As a pertinent example, it is our understanding that the Department of
Education is engaged in a review of its programs with a view to evaluating the benefits and
costs of said activities.
A focus on program outcomes requires that measurable targets be specified against
which performance can be evaluated. It is clear from some of the input provided to us in the
consultations that program outcomes and performance management are as important to
the beneficiaries or clients served
by policy as to those responsible
for its delivery. That points to the
need for transparency in the setting
of targets and in the measurement
of results. We heard about the need
for greater accountability on the part
of those responsible for government
services. This includes instances in
which programs are delivered jointly
by, for example, the Yukon and First
Nations governments. There is
further discussion below of program
areas in which joint action might be preferable to single source responsibility.
A second generic suggestion is that the
Yukon Government consider the
potential benefits of either contracting
out to or collaborating with other
governments on the provision of such
things as IT and analytics, on standard
processing activities [e.g., payroll and
standard HR services] and on common
purchases [e.g., drugs, alcohol, hospital
equipment]. The purpose would be to
lower operating costs and some capital
expenditures. As noted earlier, when a
jurisdiction has a small population base
and especially one dispersed
geographically, it is much more
challenging to achieve the scale
economies on conventional operations
than would be the case for larger
jurisdictions. There are innovative ways
that, in conjunction with other
governments, Yukon could get more
What We Heard
Some participants shared feedback on measuring
outcomes and the importance of “data and
evidence to show Canada we are achieving and
improving education, health and justice outcomes,
for example.” It was suggested that Yukon needs
to tell positive stories that are based in fact and
the way to do this is to implement an outcomes-
based strategy.
“I would encourage the panel to comment on the
absence of independent financial watchdogs in
the Yukon, compared to those present in most
provinces. There is no Yukon Auditor General.
The Auditor General of Canada devotes modest
resources to reviewing YG expenditures, and
follow-up audits are rare. There is no Yukon
Parliamentary Budget Officer.”
What We Heard
Government structure is “top heavy” and there are
managerial jobs that are redundant.
“Government really needs to look at cutting
positions and/or wages to reduce
spending…..Restructuring, not constant hiring in
areas we don't need, or adding titles to increase
salary for the same jobs.”
77
output for its spending through a cooperative approach. There already are agreements with BC
and Alberta on aspects of healthcare delivery. Such collaborative ventures could be expanded.
In fairness, a word of caution is in order here. The Maritime and Atlantic Provinces have been
pursuing regional cooperation for over 40 years with what must be described as moderate
success.
During the consultations we heard concerns about and criticisms of policy development and
program delivery of the Yukon government that are relevant to considerations of efficiency
improvements. It was suggested, for example, that there was insufficient attention paid to the
challenges of program implementation. That, it was argued, blunted or even obviated
the effectiveness of well-designed programs. It was also asserted that the design phase of
some policy and program developments was poorly done causing failure and/or waste. It is not
possible for the Panel to assess the extent or the costs of such problems.
However, a greater focus on target setting, performance management and analysis of
outcomes would provide incentives for improved program design and implementation.
A second set of criticisms revolved around the notion that Yukon simply has too
much [territorial] government. This includes the complaint that the bureaucracy is too large [has
too many people], that the Yukon government is delivering programs unilaterally without
adequate involvement of other Yukon governments [First Nations and municipal] and/or that too
many public servants are underemployed or underutilized in their current positions.
Again, assessment of these claims is beyond the scope of the Panel's mandate. However, a few
brief observations are in order.
First, the limited capacity to achieve economies of scale and thus reduce program operating
costs implies that Yukon's public service will tend to be larger on a per capita or per dollar
of GDP basis than will be the case in much larger jurisdictions. However, that does not imply
that the Yukon public service is currently the "correct" size. In fact, in a more extensive
discussion of the size of government in Section 1, the dramatic growth in the public sector’s
share of total employment suggests that there is merit in the concerns expressed by private
sector employers during the consultations. At a minimum, the government should consider
undertaking a comparative analysis of regions with similar population densities to provide
some potentially useful metrics on that issue.

78
With regard to the priority of
promoting sustainable growth
and good jobs, the following are
suggestions for policy initiatives
worth considering.
The reduction in business
taxes – especially the four
percentage point lowering of the
CIT – that was announced in the
recent Budget is well supported
by empirical research discussed
earlier. Suffice it to say that any
policy change that can both
enhance economic growth [by encouraging capital investment] and improve income distribution
[by moderating the burden on workers’ compensation] is an initiative worth pursuing. In fact, the
government may wish to consider further reduction in the corporate tax rates after assessing the
impact of the proposed drop from 15% to 12%.
The case was made earlier that economic infrastructure [e.g., transportation networks, bulk
power generation] can have a positive impact on private sector productivity primarily by
reducing firms’ operating costs. This provides support for the Yukon government’s continuing
commitment to maintaining and improving the territory’s core infrastructure. Because of the
relatively significant financial requirement implied by that objective, it is worth the government’s
considering the P3 option to share the cost and risk associated with infrastructure projects.
The partial privatization of infrastructure developments through public-private partnerships
[P3] isn’t necessarily the best tool for all projects especially ones in which the focus is
essentially maintenance. However, the fiscal benefit of reducing the draw on government
resources and the off-loading of some of the taxpayer risk of project problems merits
examination of the P3 mechanism for larger-scale projects.
The federal government is a potential funding partner in such joint ventures with the private
sector through PPP Canada and/or the new Canada Infrastructure Bank [CIB]. It was noted
above that there are currently 24 infrastructure projects listed by as underway or in the
development phase in which PPP Canada is a partner. None of them requires the charging of
user fees or tolls to customers. Although still in the early stage of being rolled out, the legislation
that created the CIB clearly indicates that infrastructure projects supported by the Bank will
incorporate user fees as a key part of their design. It is likely that such projects will be large-
scale and of sufficient term length that private investors will be attracted to risk investment.
Hence it may be that the PPP Canada mechanism is more appropriate for the Yukon.
What We Heard
Many participants felt that lowering corporate tax is
not a good idea and doesn’t lead to the desired
outcome of more jobs.
Other participants held the opposing view that they’d
like to see business taxes reduced. “The Yukon is a
great place to live and run businesses. But if I keep
getting taxed there is no incentive for me to stay.”

79
There is an extensive discussion in the chapter on Options for Sustainable Finances of the ways
in which a carbon tax may be made revenue neutral. In that chapter and the one on Yukon
Finances, it is suggested that the government consider establishing a consumption tax [and
lowering income taxes] as a way to encourage long-term saving and investment. To help
smooth out the inevitable variability in spending and revenue from the vagaries of the business
cycle, it has been proposed that a sovereign wealth fund be set up to utilize surpluses when
they emerge and draw down on them when a downturn occurs and the budget is heading
towards a deficit.
There is a link between the broader discussion of tax reform, embedded in those sections of
the report, to the sustainable growth and good jobs priority. First, if the reduction in business
income taxes proposed in the recent budget is seen as part of overall tax reform, the possibility
of a consumption tax paired with further reductions in business taxes adds to the incentives for
increased investment. A reduction in personal income taxes combined with a consumption tax
will increase the incentives for household savings. Both are positive for long-run economic
growth and job prospects.
With respect to sustainable growth, irrespective of how the revenues from a carbon tax are
recycled, increasing the price of carbon is being [or should be] primarily done to encourage
changes in behavior that will reduce GHG emissions. If that is accepted, the government should
resist the temptation [and the pressure] to use the revenues to subsidize conservation-related
behavior [such as energy efficiency retrofitting] that the carbon price is meant to foster. So-
called “green” jobs created by such use of the revenue will be at the expense of employment
that might be created in other ways. That is, green jobs are typically not net new to the economy
but are, in effect, recycled from some other activity. The reduction in GHG emissions is the key
component of sustainability in growth, not the jobs purported to be generated by specific uses of
the funds.
In the budget, the government announced a doubling of the amount allocated to the Regional
Economic Development Fund. The Fund is one of 13 economic development programs that
are financed by the Yukon government of which 6 are earmarked for film, sound and media
development. Along with the aforementioned regional fund, the programs include community
development and strategic industries funds as well as investment tax credits for small
businesses, venture loan guarantees, business incentives and enterprise trade support. These
economic development programs are used to help First nations, municipalities, non-profit
organizations and private sector firms.
Business support and economic development programs are ubiquitous in Canada and
elsewhere. However, there are rarely efforts made to generate an inventory of, let alone assess
the outcomes from, such activities. At a minimum, the government should consider comparing
the costs of business support programs to the revenues generated from business
income taxes. Although not a compelling benchmark on its own, it is reasonable to anticipate
that, over time, business tax revenues would exceed business subsidies [and by a reasonable

80
margin]. Although a comprehensive
analysis and evaluation of all 13
economic development programs is
impractical, the government should
further consider a cost-benefit
analysis of a subset of the business
support and economic development
activities. An assessment of whether
the territory is achieving desired outcomes and getting value for the resources spent would
assist in redesigning some programs and eliminating others.
With respect to the establishment of a people-centred approach to wellness, the
government has focused in its budget on healthcare and education and skills/training. Here are
some suggestions for new policy initiatives.
In the chapter on Yukon Finances, there is an extensive discussion of anomalous and
potentially problematic trends in healthcare spending. It was specifically noted that, in recent
years, “actual real per capita health spending in Yukon was about $500 per person more than it
would have been if health spending growth (at the age/gender cohort level) matched the rest of
Canada”. If unchanged, this pattern would put increasing stress on the territory’s fiscal position
as its population ages. The reasons for the significant change in the trend after 2009 needs to
be examined. The first suggestion for the government to consider is a comprehensive review
of the healthcare sector akin to the one done in 2008 focusing on the factors driving costs and
on the quality of the outcomes being delivered to Yukoners.
The Panel heard a lot about Yukon residents' concerns regarding health care. This leads us to
offer some specific suggestions for a healthcare sector review. First,
the significant gaps in certain health indicators between Yukon and other parts of Canada
implies a need to assess both the causes for the differences and the added health and
economic costs that are a result of them. In addition, there should be a particular focus on
the gaps in outcomes between First Nations and non-First Nations communities as well as
between urban and rural communities -- essentially between Whitehorse residents and the rest
of Yukon.
The topic of intergovernmental relations between the Yukon and First Nation governments is
considered at some length below. However, there were three specific concerns raised in the
consultations relating to health care that are appropriately mentioned here. There was
frustration expressed by First Nations, in a number of our meetings, over the pace [or lack of it]
in negotiating the focus of health spending in individual First Nations' communities. Several
noted the need for increased attention to mental health challenges and to addiction
assessment and recovery mechanisms. The overall role of health centres got somewhat mixed
reviews among the communities but two common concerns were the turnover in the personnel
of the centres and the excessive burden placed on individuals working alone in most of them.
What We Heard
“I do think that there should be some heavy
exploration into the theme of integration and
synergies where we do have redundant services
(i.e. back office, clinical, admin, etc.)”

81
The issues raised above should be a part of any review of health care in the Yukon. However,
there is a significant issue that may need to be handled outside such a review. There is a
complexity in the differences among individual indigenous peoples regarding access to and
funding for health care that, arguably, warrants separate consideration. Depending on whether
an individual is status or non-status and/or a resident or not of a First Nation community,
the timeliness of access to health personnel and facilities and the source of funding [federal or
Yukon government] can vary significantly.
The government does not need to wait for the completion of a healthcare review to consider
innovations in the delivery and even funding of its healthcare sector. Among the range of
options for improving public sector efficiency discussed above, the category most likely to
deliver material improvements is innovation in the delivery of programs’ services. Given its
dominance in public spending, innovations in health care delivery and funding is potentially
the most fruitful area on which to focus.
There is a voluminous literature on potential changes on the healthcare system in Canada
including the report in 2015 of the Advisory Panel on Healthcare Innovation, also referred to as
the Naylor Report. A selective reading of that literature should be the task of those involved in
the proposed healthcare review. However, it might be useful to offer some illustrative examples
of innovations – contemplated or instituted -- in several jurisdictions in Canada.
There was a proposal about a decade ago in Ontario to contract out to private firms some
diagnostic work to mobile labs or clinics. The testing would be covered by public funding at
the same rates as apply in hospitals and clinics owned and operated by the government. The
expectation/hope was that diagnostic work could be done around the clock through the entire
week in order to increase access and reduce wait times. Although the proposal was not
accepted, it is one that could be feasible for a jurisdiction in which the population is dispersed
over a large area. While it would not be applicable to acute care needs, mobile facilities might
also be viable for certain types of chronic care requirements in more remote areas of Yukon.
In Nova Scotia, the Conservative government in 2008 established Scotia Surgery, a privately
operated but publicly funded surgical facility that carries out outpatient orthopaedic
surgeries on knees and hips [that is, not hip and knee replacements]. The doctors who do the
surgeries are also allowed to work in the public hospitals in the Halifax area where the clinic is
located. Although the details of the contracts between the government and the clinic are not
public, the contract was renewed with a larger financial commitment by a successor NDP
government and then expanded [from 3 to 5 days a week] by a Liberal government. Its smaller
size, flexible staffing arrangements and cheaper real estate have been acknowledged to result
in lower costs for the surgeries performed compared to the hospitals.

82
The Scotia Surgery model could be
adapted to other types of procedures
such as ophthalmology, plastic surgery
and even hip and knee replacements.
The Yukon government could consider
this type of contracting out for medical
services for which there are long
waiting lists and adequate professional
staff available to operate such a
facility.
Another initiative worth considering,
already widely adopted in most
of urban North America, is the appointment of hospital-only physicians known
as hospitalists. They may be specialists such as internists but, for the most part, are
individuals trained as family physicians who work fulltime in a hospital rather than a clinic. They
are responsible for the full range of medical care – admission, testing and diagnosis, treatment
protocol and discharge – of [primarily] acute care patients who do not have a family doctor or
whose family doctor does not have hospital privileges.
The argued advantages of hospitalist care -- there is some empirical research to support this --
include improved patient safety, increased cost-effectiveness of hospital operations and more
timely access to specialists when required. For primary care physicians who prefer to stick to
clinical work, there is the reduced burden of hospital visits. Hospitalists are salaried rather
than fee-for-service physicians.
A key area of need in the healthcare sector nationally that was identified most recently by the
Naylor Report was for technology transformation through digital health initiatives. A first step in
that direction is to invest in the creation of electronic medical records that, among other
benefits, allows of more effective monitoring of healthcare outcomes. Given the small population
base of Yukon, this is an initiative that might best be pursued as a collaborative effort with other
jurisdictions such as British Columbia and Alberta, with whom Yukon already has healthcare
arrangements.
On the funding side of health care it may well be worth the effort to examine the potential for
relatively low-impact changes to co-pay arrangements in areas such as pharmacare. Given that
total drug requirements and costs tend to rise markedly for older individuals, this will be an
increasingly important issue to address. The levels of co-pay in Yukon appear to be well below
what one finds in many other Canadian jurisdictions. Both equity and fiscal considerations would
justify consideration of income-related cost sharing of drug costs.
There was some discussion, in the consultations process, of the suggestions offered in the
report. For example, several people expressed concern that the [illustrative] delivery innovations
mentioned might ultimately lead to a much larger change in health care – to more private
What We Heard
Participants suggested a number of innovative
ideas about healthcare. Some of these ideas
include healthcare cards with photos (to cut
down on others using Yukon healthcare
benefits), implementing a user pay fee for
hospital visits, increasing taxes for the highest
earners in Yukon, increasing taxes on alcohol
and tobacco and investing more in prevention.

83
delivery -- than would be welcome.
This might be referred to as the "thin
edge of the wedge" concern. However,
the innovations mentioned in the report
are actually quite modest compared to
those that have been introduced in
most European healthcare systems.
For a component of public sector
policy that is likely to be under
mounting fiscal stress, the systemic
changes that may well need to be
contemplated over the next decade
are much more dramatic than the
examples offered here.
Regarding the issue of changes in co-
pay arrangements for pharmacare, two different options were discussed. One involves simply
raising the co-pay levels for patients to those found in other jurisdictions. However, there
was also some interest in the idea of co-pay levels scaled to individual or family incomes. That
is, the percentage of the drug costs paid by the patient would be greater at higher levels of
income. This would deal more directly with the equity elements of co-pay programs.
There is a link between social spending and health outcomes that bears consideration regarding
innovation in healthcare. There is a significant literature on the social determinants of health
which suggests that incremental investments in housing and other aspects of social spending
have a much bigger impact on health outcomes than a marginal dollar spent on health care
facilities and personnel. This is particularly so when that additional dollar is spent on vulnerable
populations.
To put it differently, over the past 20-30 years, provincial and territorial governments have
devoted so much revenue to new hospitals, physicians, and nurses that an extra dollar spent in
these areas appears to have a very limited impact on health outcomes. Recent studies from
Canada, the US and internationally show that reallocating tax dollars -- so there is no impact on
total spending -- from health spending (conventionally defined) to social spending has a positive
effect on key indicators of health and wellness. Thus, governments can perhaps promise better
health outcomes without the need for an increase in aggregate government spending.
The government’s wellness priority focuses on more than healthcare issues and, in particular,
includes education and skills development. The Department of Education is in the process of
measuring financial efficiencies in the delivery of education services in the territory. It also is
committed to undertaking extensive assessment of educational outcomes.
What We Heard
“I believe public health care is a sacred trust.
Any co-pay arrangements would likely become
an insidious slope and the burden would
eventually lead to a bigger and bigger strain on
the users who can pay and these people would
eventually subsidize the large cohort of users
who could not pay.”
Other participants commented that privatization
doesn’t necessarily lead to efficiencies and
worried about the costs of accessing services.

84
One area of education that typically does not get structured and consistent attention in any
jurisdiction is adult functional literacy challenges. Remedial upgrading in basic literacy and
numeracy is often necessary for older workers who need conventional retraining or upgrading.
The Department could assess the outcomes from current approaches to dealing with adult
literacy challenges and consider program design changes to improve those outcomes. There
are currently ten adult literacy programs run by six separate organizations and focused on 3-4
different target groups. This division of labour may well be appropriate but it would be worth
looking at whether the programs can be consolidated and results improved.
The third priority articulated in the Throne Speech and Budget is investing in communities.
There are three suggestions that could be considered by the government to improve program
effectiveness in this area.
In determining the level and timing of the allocation to local infrastructure the government would
be wise to draw a clear distinction between economic and social infrastructure.
Wastewater management and road maintenance are examples of spending in communities on
economic infrastructure. Construction of recreation centres and meeting halls fall under the
rubric of social infrastructure.
It is perfectly reasonable for governments to invest in social infrastructure but it should be done
with the understanding that it does not create [public] capital goods but rather [public]
consumption goods. That is, whatever their merits, social infrastructure does not typically
increase productivity or efficiency for the private sector. However, that is subject to the caveat
mentioned above that, in instances where community infrastructure positively affects workers’
skills and/or labour force attachment, there could be an improvement in labour productivity.
In the chapter on Yukon Finances it is suggested that the government dedicate a specific
percentage of its spending to maintenance and upgrading of infrastructure. Building on that
suggestion, it might be preferable to designate that for economic infrastructure only. If a
sovereign wealth fund is established to “store” budget surpluses as they arise, that could be
the source of investment in social infrastructure. That would avoid the problem of its
competing with the economic infrastructure requirements of the territory.
An overarching argument for the value of widespread adoption of policy assessment and, in
particular, for a focus on evaluation of outcomes should apply to the analysis of social
programs. A specific example of an area in which that would be valuable is the rigorous
examination of the marginal effective tax rate [METR] on social transfers. Several
jurisdictions in Canada have carried out such an analysis and adjusted their cash and in-kind
transfers to reduce the so-called “welfare wall”. If such transfers are reduced at too fast a pace
[taxed away at a high effective rate] as recipients earn income from employment, this can serve
as a significant [and legitimate] disincentive for them to seek employment, especially low wage
and/or part-time work. The “wall” can actually get higher when social program transfers are
raised without an adjustment in the claw-back structure for such payments.

85
As part of a larger reform of the tax structure proposed in the Options chapter, it is suggested
there that carbon tax and/or consumption tax revenue could be recycled in several ways
including incorporating “equity and poverty-alleviation considerations”. Specifically, the
possibility of a working income tax credit instead of a cost-of-living credit is proffered as a
mechanism for advancing distributional equity. In examining such an option, due consideration
will need to be given to how it interacts with existing social programs and, in particular, the
consequences for the METR.
In addition to these three specific policy suggestions for the Yukon government, the Panel heard
suggestions from our meetings with municipal leaders that also warrant consideration. It was
argued that, for certain types of services, the local authorities are better placed to provide them
more efficiently. These include waste management [landfills], water & sewer and local road
maintenance. However, their current grants from the Yukon government are not sufficient to
allow them to take over even if there was a willingness to allow that to happen.
This lead to two proposals that are worth further exploration. First, greater collaboration [e.g.,
outsourcing or joint ventures] with municipal governments in the provision of basic services
along with adjustments to tax sharing arrangements could lead to lower costs of those services.
Second, it was argued that the financing of municipal services might be better done through
user fees rather than through property taxes especially where users straddle property tax
boundaries [i.e., tax rates differ for those in and those just outside the municipality].
The fourth and final priority of the Yukon government is to restore and maintain respectful
government-to-government relationships with First Nations. Given the significant role of the
federal government in an array of government-to-government interactions, the territory’s
aspirations will involve essentially tri-lateral discussions and negotiations over policy decisions
affecting First Nations.
The complexity of tri-government interactions arises in a number of policy-related areas. These
include: taxation and revenue-sharing arrangements; access, funding and program coverage
elements in health care, education and justice; and inter-governmental discussions and
negotiations regarding policy/program design and implementation. Some of that complexity is
discussed in another section of the Report – First Nations' Fiscal Relations in Yukon. It is raised
here to provide part of the context for the discussion of suggestions linked to this priority of the
Yukon government.
The Panel heard a range of issues and concerns during the consultation process that either
provide added context for or are related directly to consideration of structural policy changes
relevant to this particular part of the Report. The summary of some of those discussions offered
here is not meant to be comprehensive. That will be provided in another section of the Report.
In one of our consultations, the Panel was reminded that, over the past 3-4 decades, the
gradual establishment of self-government [referred to by one individual as the process of
“decolonization”] was occurring for both Yukon First Nations and the Government of Yukon. This

86
has meant that their relationship has evolved and adapted through the process of settling fiscal
relations, establishing responsibility for key program areas, negotiating resource developments
and determining infrastructure spending priorities.
In a number of our meetings with First Nations’ representatives, we heard a lot about the
frustration felt over the pace [or lack of it] in all of the policy areas mentioned above but
especially regarding program spending. For example, it was frequently asserted that decisions
about spending on education, health care and justice – the three program areas most frequently
mentioned -- do not properly incorporate the preferences and requirements of individual First
Nations. It was also clear that the ranking of these areas varies among the communities. In one,
the emphasis was on dealing with mental health and addiction challenges while in another there
was a focus on education.
With respect to infrastructure spending we heard two somewhat different concerns. First, the
same frustration over the lack of timeliness in decisions and the absence of adequate
consultation as expressed regarding program spending was echoed for infrastructure policy.
However, it was also suggested by some First Nations’ representatives that what we are calling
economic infrastructure is not necessarily a high priority for their communities. Rather social
infrastructure spending is much more relevant to at least some First Nations.
To mitigate these frustrations, the First Nations articulated a desire for increased involvement in
and responsibility for program and infrastructure spending decision making. Given the
differences among the communities regarding key program needs, more effective sharing of
program responsibility has to be with individual First Nations governments. While an
institution like the Yukon Forum can provide a vehicle for deliberation of overarching common
issues – e.g., natural resource development – it appears unlikely to be an appropriate substitute
for one-on-one government negotiations.
In the consultation sessions with First
Nations government and community
leaders, the issue of the connection of
shared accountability to shared
responsibility for program design and
implementation was raised. The topic
was not discussed at any great length
but should be considered by both First
Nations and the Yukon governments if
progress is made on the expressed
demand for enhanced inclusion in
program decision-making.
A potential barrier to enhanced
sharing was also raised in our
What We Heard
Participants suggested that Government of
Yukon and Yukon First Nations need to work
together collaboratively to deliver services. “In
the spirit of reconciliation, that's something that
would be best to work towards. Let the FNs
manage that for its people,’ and “Reducing
family services would be a good start because
that needs to be moved to FNs to manage child
welfare in the communities rather than the
department managing it.

87
meetings. Several First Nations representatives indicated that the Yukon government needs to
significantly streamline its current processes in deliberations with First Nations. In
particular, it was argued that there are too many Yukon government committees with
overlapping responsibilities dealing in specific program areas. This puts a serious strain on the
capacity of individual First Nations communities to be effectively represented at such meetings
and, if continued, will blunt efforts to evolve joint decision making.
The Panel has no desire to understate the concerns and the frustration expressed by First
Nation governments and communities by offering overly simple policy suggestions. Nor do we
want to downplay the significant challenges of operating in a tri-lateral government context. To
do justice to the range of issues raised in our consultations would require a separate
investigation and report. However, there are several specific suggestions that may be useful to
consider.
While continuing to work on improving the overall fiscal relationships and program development
issues, it may be worth focusing intensive efforts on the collaborative design and delivery of
one key program area in each First Nation. There are clearly articulated differences among
communities in the level of concern about and priority ranking of programs within and across
health, education and justice. If the Yukon government and each First Nation government chose
one specific program with desired outcomes identified and timelines established, discernible
success could be helpful to building the trust and mutual respect that we repeatedly heard was
lacking.
As in other regions of Canada the educational outcomes for First Nations students are well
below those for non-First Nation students. Apart from the obvious social and moral imperatives
to materially improve those relative outcomes, there is a strong economic argument as well. As
already noted, improvements in educational attainment and skills and training levels is a key
ingredient in raising productivity and living standards. If a significant percentage of the
population is not experiencing comparable improvements, this will be a drag on economic
growth. For economic and social reasons as well for the advancement of reconciliation, it is
critical to assess the educational outcomes for indigenous students and to craft, with the
First Nations communities and the federal government, ways to improve those
outcomes.
In the discussion above of the
wellness priority, the suggestion
was made that attention be paid to
the issue of adult functional
literacy. In Canada, functional
literacy deficits are relatively more
pronounced among three distinct
population groups. They are: older
workers especially in [often
declining] traditional resource and
What We Heard
There were challenges identified in First Nations
communities relating to education and they
included attracting and keeping teachers, small
class and school sizes and lack of schools in
communities because of these low numbers. One
participant proposed that, “Parents should educate
their kids at least until they are 6.”

88
manufacturing sectors, [first generation] immigrants and First Nations. The factors affecting
literacy levels vary among the three groups implying the need for remedial literacy programs
that focus on the groups’
differing requirements. The
negative economic and social
consequences arising out of
differing educational
outcomes for First Nations
students is no less pertinent
for variances in functional
literacy between First Nations
adults and their non-indigenous peers. Improvements in the design and delivery of adult
literacy programs should, in particular, focus on the needs of First Nations adults.
There were also several items of note regarding post-secondary education in Yukon arising out
of the consultations. The move to university status for Yukon College was seen as a discernible
commitment to both educate and retain Yukoners [both First Nations and non-First Nations]. It is
hoped that, if residents are able to get their degrees in Yukon rather than going elsewhere, the
prospects of their staying and contributing to economic growth will be enhanced.
There was also strong support for the three main “pillars” of the now-degree granting
institution’s overarching focus. The pillars are Climate Change and Society; Indigenous Self-
Determination and Sustainable Resource Development. These areas of specialization amplify
the importance of Yukon’s commitment to the future of its First Nations’ communities and to its
circumpolar reality. The College already has important relationships with post-secondary
institutions in Canada and the US. Achieving university degree status can only enhance those
interactions.
We also heard a note of caution about the need for a much greater focus, in secondary and
post-secondary education, on preparing students for the future economy of high tech skills,
innovation and automation/robotics. This is especially a concern with respect to First Nations’
students who already suffer a significant education “deficit”. It is critical, it was asserted, that the
gap be narrowed rather than allowed to get larger.
Our meetings with First Nations included discussion with the leadership of First Nation
Development Corporations. These entities were initially established in Yukon by First Nation
governments following the signing of Final Agreements. They are comparable to Development
Corporations operating in a number of First Nation communities across Canada.
While First Nation governments continue to provide services to the residents of their
communities, they also invest in and often directly manage for-profit businesses through their
Development Corporations. Not all of the assets of the Corporations are used to start or expand
What We Heard
“Education is the key to transformative long term
change. A fundamental investment in improving the
education skill gap would make for significant improved
long term outcomes and reduce the costs on justice,
health etc.”

89
business operations. Some
are invested passively
[typically outside of Yukon] as
a way of reducing overall risk
in the Corporations’ portfolios.
However, the Yukon First
Nations Chamber of
Commerce indicated recently
that its member organizations
have realized how sizeable
their combined assets are and
that they are looking at the
potential of a pooled fund that
will invest in projects in Yukon.
The Yukon First Nations Development Corporations could be effective partners not only with
each other but also the Yukon government, the Canadian government and/or private sector
firms in infrastructure projects [economic and social] as well as in for profit joint ventures. In fact,
in the PPP Canada list of its P3 projects, there are two that involve First Nations communities.
In the Kokish River Hydroelectric Project, the ‘Namgis First Nation is partnering with a private
sector firm [Brookfield Renewable] to build a run-of-the-river hydro facility that will sell electricity
to BC Hydro. The federal government is providing a low interest loan to the ‘Namgis First Nation
to allow it to build equity in the project. The All-Season Road Project involves the Tlicho First
Nation partnering with the Government of the Northwest Territories to build an all-season road
to the community of Whati. This is a project that has been studied since the early 1980s. The
federal government will provide up to 25% of project costs.
For future infrastructure projects the Government of Yukon could consider joint ventures,
including public-private partnerships, with First Nations governments along the lines of
the models incorporated in the two PPP Canada projects. It would not have to restrict the
projects to transportation or electricity. although they may be the easiest type to start with. With
potential funding from the federal government’s PPP Canada Fund, the cost to Yukon taxpayers
can be lowered for desirable projects. The Canada Infrastructure Bank projects, under the
current legislation establishing the Bank, would require projects to be ultimately self-funding
through the use of tolls or user fees. That may not be as attractive an alternative for joint
ventures with First Nation governments.
What We Heard
“The DevCorp just went through a strategic plan. We're
looking into tourism, mining, renewable energy, etc. Those
are our big avenues. And then probably real estate. That's a
given.” Other participants stressed “if we're going to look at
mining on our territory, we're going to look at companies that
respect our history, culture and asserted territory.” Another
participant stated that joint ventures between the DevCorp and
YG are desirable in order to keep money in Yukon and in the
traditional territory.

90
Options for Sustainable Yukon
Government Finances

91
Options for Sustainable Finances
With Yukon’s near- and long-term fiscal challenges and opportunities now clarified, we move to
outlining some options that Yukoners and their territorial government may consider. What
follows are specific initiatives and policy changes that reflect four guiding principles: simplicity,
sustainability, equity, and efficiency. And while much analysis has gone into these options, there
is no objectively right or wrong way forward; there are only trade-offs. Our principle goal is
therefore to provide a range of options to help inform a productive public debate. With full
knowledge of the current situation and the pros and cons of the various routes forward,
Yukoners and their elected representatives can make fully informed choices.
Importantly, some of the options that follow may be subject to the Taxpayer Protection Act.
Broadly speaking, this Act constrains the Yukon government’s ability to unilaterally (1) create or
increase an accumulated deficit and (2) introduce new taxes or raise the rate of certain existing
taxes. The current accumulated surplus is nearly $1.4 billion, so there is no reasonable prospect
of the Act being triggered due to the creation of an accumulated deficit. But broader tax reform,
of the type described below, may first require a referendum or other legislative changes. With
this in mind, we take care to fully explore the implications of each option, both the positives and
the negatives. But, we must be clear, the options around changes in income taxes or fuel taxes
that we outline below are specifically protected by the Act. Introducing new taxes is similarly
difficult. Absent other legislative changes or a referendum, addressing the budget shortfall
through spending restraint (or reductions) or through changes in fines and fees becomes
particularly attractive.
We broadly categorize the options according to their time horizons. Our short-term options
address options for improving the currently forecasted budget deficits. Our medium-term options
address clearly identifiable challenges or opportunities facing Yukon in the coming years, such
as changing the territory’s borrowing limit or options to recycle carbon tax revenue. And finally,
our long-term options promote sustainable, efficient, and equitable fiscal and economic policies
going forward.
Near-Term Options to Balance
We propose a variety of routes to improve the currently forecast budget deficits. All options are
based on projections to 2030 and a model of Yukon government finances. We will not describe
too many details here, but the following table lists the various key assumptions that we use in
our baseline budget forecasts.9 Of course, these -- like all projections -- are only as good as the
assumptions behind them. To the extent that own-source revenue grows more quickly than
9 In short, we base these estimates on the Conference Board’s latest outlook for Canada, which includes projections
for provincial and local government spending, population, and GDP. We combine this with population and GDP estimates from the Yukon government’s own 2017-18 economic outlook. These ingredients are sufficient to forecast federal transfers to the Yukon, and we further presume own-source revenues and its fiscal capacity grows with Yukon’s GDP.
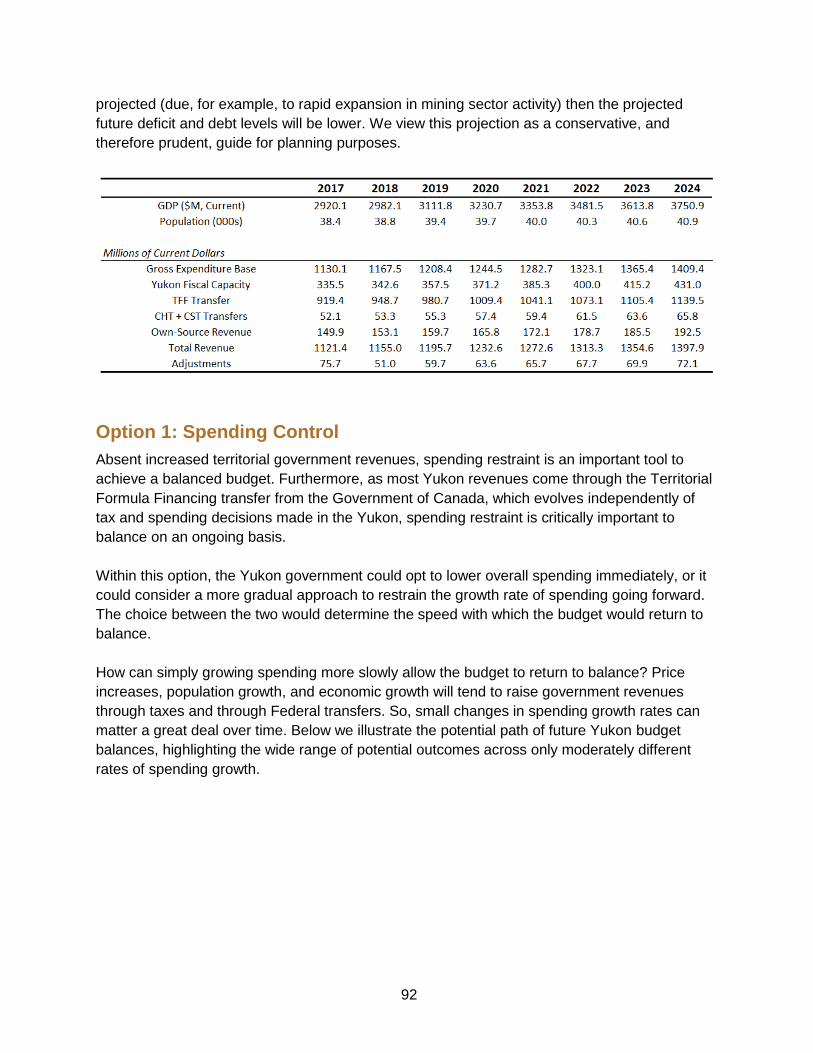
92
projected (due, for example, to rapid expansion in mining sector activity) then the projected
future deficit and debt levels will be lower. We view this projection as a conservative, and
therefore prudent, guide for planning purposes.
Option 1: Spending Control
Absent increased territorial government revenues, spending restraint is an important tool to
achieve a balanced budget. Furthermore, as most Yukon revenues come through the Territorial
Formula Financing transfer from the Government of Canada, which evolves independently of
tax and spending decisions made in the Yukon, spending restraint is critically important to
balance on an ongoing basis.
Within this option, the Yukon government could opt to lower overall spending immediately, or it
could consider a more gradual approach to restrain the growth rate of spending going forward.
The choice between the two would determine the speed with which the budget would return to
balance.
How can simply growing spending more slowly allow the budget to return to balance? Price
increases, population growth, and economic growth will tend to raise government revenues
through taxes and through Federal transfers. So, small changes in spending growth rates can
matter a great deal over time. Below we illustrate the potential path of future Yukon budget
balances, highlighting the wide range of potential outcomes across only moderately different
rates of spending growth.

93
If spending were held to annual
increases of just 1% in nominal terms,
then, as shown by the red line, the
budget would return to balance by 2020
and move into annual surpluses
thereafter. The dark grey area shows the
range of outcomes should spending be
held between 0% and 2% annual
increases. Finally, the light grey area
shows possibilities with more relaxed
spending constraints; allowing between
2% and 2.5% annual growth.
Currently, the government plans for spending growth of approximately 2% per year from now
until 2020/21. If this growth rate is maintained beyond 2020, then the territory is on track to
balance by 2022/23. Balancing sooner requires new revenue measures, or further spending
restraint. For example, to balance by 2020/21 requires spending growth not exceed 1% while a
nominal spending freeze at 2017/18 levels achieves balance by 2019/20.
What We Heard
“Difficult to restrain government spending.
Very little spending is considered non-core.”
“Do a Nielsen-like Task Force on Program
Review and ask Yukoners and front-line
public servants how we can better deliver the
public services they want.”

94
Many Yukoners voiced a preference for
addressing fiscal challenges on the
spending side, rather than introducing
new taxes or raising existing taxes. Some
note that the projected shortfall of the
Yukon Government is equivalent to 3.8%
of spending next fiscal year, and 4.5% of
spending for 2019-20, which are
relatively small shortfalls and well within
the government's ability to address on
the spending side alone. This does not
require outright cuts, but improvements
on the efficiency side of things and
improvements in the overall human
resources management side of
government may be sufficient to close
the projected fiscal gap.
That being said, there may be scope for a close look at spending to find areas where
efficiencies and outright reductions may be available. There are a number of examples the
panel heard of potential areas where a review may be in order.
In fiscal 2017-18, over $7.2 million will be spent on operations and maintenance costs related to
business and industry development programs, for example. A further $1.06 million will be spent
on business incentives related to capital projects. No doubt many such projects satisfy clear
public policy objectives, and potentially link with regional economic development goals (such as
certain micro-loan programs, cellular service expansion projects, Yukon College initiatives, and
so on). But other projects may be less clear in their public policy objectives. For example, many
jurisdictions provide support to the film industry; Yukon is no different. During the current budget
year, over $800,000 is allocated to government Media Development initiatives, the bulk of which
is allocated to film production incentives in the territory. In another line item, the Strategic
Industries Development Fund, budgeted at $800,000 this fiscal year, might also be challenged
on its merits as a useful tool of public policy.
Some Yukoners even raised concerns regarding the existence of whole functional areas of
government. Operation and maintenance costs in the Oil and Gas Resources branch of the
Department of Energy, Mines and Resources exceed $3.5 million this year. Given the limited
scale of oil and gas activity in the territory, the panel heard specific concerns around whether
such regulatory costs are warranted. This is an especially salient issue given oil prices are
projected to remain low for the foreseeable future, which has dramatically lowered the potential
Option: Conduct a comprehensive review of all departments and programs to ensure
government activities are appropriate and achieve value for money.
What We Heard
“You should task government departments
with finding ways to find efficiencies.”
“One of my jobs is to find unnecessary
expenses. I am much more in favour of
finding inefficiencies within government.”
“If spending had been done with more
thought and efficiency, we could save a lot of
money.”

95
for future oil sector growth in the territory. To be sure, the panel is in no position to know
whether or not this spending has benefits that exceed the cost, but it is illustrative of the need
for broader systematic review.
Even within departments and within programs
there may be efficiencies. The panel heard many
anecdotal stories around inappropriate spending
(or spending of little value) as the close of a fiscal
year approached. The so-called “March Madness”
period whereby government units are expected to
spend funds that were budgeted to them, even if
it would make more sense to not do so. The
government could ensure that accounting procedures and budget processes are not needlessly
incentivizing governments staff to spend money at the end of a fiscal year. This also applies to
the government’s relationship with NGOs, which may face similar pressure to spend all funds
within a pre-specified period even if such spending would have less value than waiting.
A related concern often raised with the panel during its engagement period was the lack of
operating and maintenance funding provided along with new capital dollars. Local governments
in particular noted the strain this can place on their budgets. Proper, long run, full-cost
budgeting and careful cost-benefit studies for capital projects could help avoid over-building and
therefore help lower costs.
It is far too large an issue for this panel to
pursue, but the panel suggests the
government review the size and purpose
of its involvement in the housing sector.
A well-functioning housing market is an
essential element of any successful
economy. High housing costs, typically
brought about by a lack of supply, make
it difficult for firms to attract and retain
employees. High housing costs also
threaten those with low incomes with food insecurity, homelessness, and all of the social ills
associated with those outcomes. Getting housing “right” is therefore a key element of public
policy. Yukon certainly faces challenges to establish and maintain a well-functioning housing
market and there is undoubtedly an appropriate role to be played by the Yukon Housing
Corporation. But the public sector needs to guard against inappropriate regulations, restrictions,
and policies that constrain or limit the scope of the private sector in this market. It may be
Option: Ensure accounting procedures and budget processes do not create
incentives to spend money without concern for the value of the goods or services
purchased, especially near the end of a fiscal year.
What We Heard
“We need more Yukon housing.”
“You can have as many jobs created here as
you want, but if there's no housing, these jobs
won't matter.”
What We Heard
“The Yukon Government needs to
refocus on outcomes. It needs to be
results focused, not line-item focused.”

96
appropriate, for example, to clearly limit the responsibilities of the Yukon Housing Corporation to
providing social housing to those otherwise having to devote an unreasonable amount of their
income to housing. In small communities where private development may be limited, providing
the private sector with tax or other incentives may be worth considering as an alternative to
direct interventions by Yukon Housing. The Yukon government may also consider its
involvement as a direct property developer, especially in the Whitehorse region where private
sector firms may be better placed to manage such tasks with greater efficiency and
effectiveness.
Beyond reviewing spending choices within each of the government’s departments, more
dramatic and broader action could take the form of a wage and employment freeze for the
whole of the public sector. Personnel costs approached $460 million for the year ending March
2016, which was 4% higher than those same costs the year prior. For each 1% growth in
personnel costs avoided, total Yukon Government spending falls by $4.6 million below what it
otherwise would be. Sustained over multiple years, efforts to constrain public sector
compensation costs can have material impacts on the overall budget. Though an outright freeze
may be unnecessary, it is an option. These data, and the sentiment expressed by a very large
number of Yukoners during our engagement, motivates the following options.
We will also note the possibility of shifting activities out of YG and into either local governments
or the private sector. We will return to these specific points shortly.
There are also a variety of transfer programs where some Yukoners noted may not be
appropriately targeted and potentially unnecessary. There will be over 8,600 Home Owner
Grants paid, for example, which will refund 50% of the property tax bill up to a maximum of $450
(for seniors, the refund is 75% to a maximum of $500). Overall, this grant is expected to cost
$3.8 million in 2017-18. Given the lack of means testing of this program, and given the relatively
low level of property taxes in the territory already, there may be scope to reduce or eliminate
Option: Review the size and purpose of the Yukon government’s involvement in the
housing sector; explore charging rental rates in Yukon Housing accommodations
that, where appropriate, reflect actual market conditions.
Option: Carefully review public service operations to ensure employment and benefit
levels and growth are well grounded in efficiently delivering public services.
Option: Explore the possibility of more efficient human resource management
policies, to better facilitate the sharing of work across department units and for more
flexible job descriptions.
Option: Implement a public-sector compensation and hiring freeze while broader
human resource reforms are considered.

97
this program. More generally, there are other income support programs that are means tested.
The Pioneer Utility Grant, which will cost $1.95 million for 2017-18, or the Yukon Seniors’
Income Supplement, $1.17 million. There may be an opportunity to consolidate such programs
into a single one.
The above discussion merely collects some of the examples the panel heard from Yukoners,
and shouldn't be taken as a comprehensive list of potential areas for improved efficiency. But
the opportunity for improved efficiency and effectiveness of government programs may be large.
Though spending restraint is an important
option for consideration, we suggest the
government insulate infrastructure
investments from any spending constraint
efforts. In particular, and building on the
discussion in Section 2 of this report, we
place particular emphasis here on economic
infrastructure. A possible approach is to
commit to spending a certain share of GDP
on well-defined infrastructure investments each year. Typically, net capital spending (that is not
funded by third parties) is roughly 7% of Yukon GDP, though fluctuations between 6-8% are not
unusual. The current projection is for a nominal freeze in such spending to 2021, and therefore
a declining share of GDP. There are also innovative funding arrangements available. Increased
use of P3s, partnerships with First Nation Development Corporations, and financing options
through the forthcoming Canada Infrastructure Bank, for example, present unique opportunities
to ensure sufficient Yukon infrastructure investments are made.
Option 2: Increase Revenue
As we discussed in Section 1 of the report, the Territorial Formula Financing (TFF) system
ensures territorial governments can fund public services comparable to southern Canada but at
tax rates that are 30% lower than southern Canada. That is, taxes at roughly Alberta’s level --
which are far below average -- are sufficient to maintain public services in the territories
comparable to the average across southern Canada.
If Yukoners wish to avoid the spending restraint outlined in Option 1, raising revenues is another
option. There are a variety of tools available. We highlight a few potential areas in what follows.
Option: Review the Home Owner Grant, potentially cancelling it or better targeting it
so only those in need receive it.
Option: Review all government grant programs. Eliminate ones that do not achieve
clear public policy objectives. Where possible, consolidate programs meant to
support lower-income into a single program.
What We Heard
“Capital spending is easy to cut back in
the short term, but there will be a big
impact on future generations.”

98
There are a variety of fines and fees
that should be reviewed in Yukon. Of
total government spending in Yukon,
barely over 5% is funded by user
fees. This leaves the burden of
providing public goods to taxpayers
generally, and limits the incentive of
users to appropriately utilize the
services being provided. Low user
fees are also not generally a feature
of the territories generally, with NWT
funding about 10% of consolidated
government spending with fees and Nunavut funding over 17%. Nationally, the average is just
over 13%. If Yukon matched the same 10% share of spending funded by fees as seen in the
NWT, which would still be among the lowest in Canada, it would raise over $60 million -- more
than the projected fiscal imbalance.
Consider camping. There just over 50,000 registered campground nights expected in the 2017-
18 fiscal year, and about 3,400 annual permits issued to Yukon Residents. Total operating and
maintenance spending on Parks by the Department of Environment, which manages the
campgrounds, will be nearly $4.5 million -- not counting a portion of administrative and
corporate services costs of the Department itself -- and an additional $320,000 allocated to
capital projects. Revenue expected from campground permits, meanwhile, is just under
What We Heard
“The Yukon is a great place to live and run
businesses. But if I keep getting taxed there is no
incentive for me to stay.”
“The Yukon Government doesn’t have a revenue
problem, it has a spending problem.”

99
$400,000 over the same time -- less than 10% of the total Parks appropriations. This is also true
for hunting and fishing licenses -- with Wildlife and Fisheries costs expected to be $7.6 million
for 2017-18 and license revenues at less than $674,000.
Spending on such outdoor recreation that far
exceeds revenue is not the norm in other
jurisdictions. Consider British Columbia. In 2014-
15 (the latest year for which detailed statistics are
publicly available), the operations spending of BC
Parks was $32 million and revenues were $20
million. Of total revenues, fully $18 million were from campground fees alone. If Yukon were to
match BC and fund two-thirds of parks spending with user fees, it would raise an additional $2.6
million per year. Yukon could also consider lowering parks spending -- especially in areas such
as unlimited campfire wood -- to close the gap.
There are other examples where fees are out of line with costs. Continuing Care has operating
and maintenance costs of nearly $47 million in 2017-18, and capital costs at $69 million that
same budget year (the latter is primarily related to the Whistle Bend continuing care facility).
Revenues from user fees in such facilities, however, are only $2.5 million -- or roughly 5% of the
cost. In a recent analysis for the Yukon government, operating costs for long-term care facilities
in the territory range from just over $100,000 per year per bed in McDonald Lodge to over
$180,000 per year per bed at Copper Ridge Place. Currently, the government daily rate is $35,
or just over $1,000 per month, which will cover roughly 10% of the cost of the actual service.
This is substantially below the rates charged elsewhere, and most other jurisdictions also
differentiate between those in financial need from those who are not. To be sure, there are
important public health and equity considerations for certain long-term care subsidies. But
providing generous and universal subsidies as Yukon does, regardless of one’s financial need,
may be too much. For perspective, a 10% increase in the current fee raises roughly $250,000
per year.
Option: Raise user fees, fines, and related policies to better reflect costs of providing
goods and services. Independent of the projected fiscal deficits, there is a strong
case to align user fees with costs.
Option: Expand residency requirements for eligibility to long-term care facilities from
the current minimum of one year. Introduce an income or asset test and scale user
fees accordingly. Introduce means-tested fees for home care. For individuals of
means, increase fees to be in line with other jurisdictions.
What We Heard
“Too many things are free, or almost
free, in the Yukon.”

100
A Sales Tax
If broad-based taxes are to be raised, the most cost-effective tool available is a territorial
harmonized sales tax (HST). Each 1% sales tax would raise roughly $7 million, net of expanded
low-income rebates.
Importantly, though an HST provides
revenues to address near-term fiscal
challenges, they tend to growth with the
territory’s GDP. Thus spending growth rates
going forward must still remain under control
so as not to exceed revenue growth. As
populations age, keeping overall spending
growth manageable will require constant
attention.
A common concern raised by Yukoners during the panel’s public engagement touch on three
broad areas. First, sales taxes are seen as regressive – that is, many feel they are a larger
burden on lower income individuals than other types of tax instruments. Second, businesses are
concerned about the loss of customers to suppliers located in, say, Alberta, which doesn’t have
a sales tax. And third, businesses are also concerned about the administrative burden a new tax
would represent. These are important concerns, but are easily addressed if a Yukon sales tax is
fully integrated with the Federal GST. That is, should Yukon adopt a sales tax, it should be an
HST. We will provide much more detail later in the report, but the Federal GST is not regressive,
since credits are provided to low income households to offset the burden from the GST. This
would increase if Yukon adopts an HST. Also, the sales tax charged on purchases by Yukoners
would be at the Yukon sales tax rate – even if ordered from a supplier elsewhere. This invoice-
based system of levying the tax would mitigate concerns over how much business would be lost
to other jurisdictions. Similarly, Yukon businesses selling to other jurisdictions would not be
affected by the Yukon sales tax on those sales. To be sure, some individuals may travel to
Alberta to purchase supplies and transport them back to Yukon on their own, thereby avoiding
the Yukon sales tax. But this is would be the exception, not the rule. Finally, a Yukon HST would
not be a new tax, but a change in the rate of the GST within the territory. There would therefore
be minimal administrative costs on businesses or the Yukon government.
Municipalities raised an additional concern with the panel regarding a sales tax. Currently, they
receive a 100% rebate of Federal Goods and Services Tax paid. In the event that Yukon
imposes new taxes, or changes tax rates, municipalities may be affected and consideration
could be given to policies that would mitigate the impacts. For example, the implementation of
an HST or a carbon tax would result in higher taxes paid by municipalities. Specific credits
similar to the 100% rebate of Federal Goods and Services Tax targeted to municipal
governments may potentially mitigate some of the increased costs.
Option: Implement a territorial sales tax, fully harmonized with the Federal GST.
What We Heard
“I'd be much more interested in
discussing the idea of a government sales
tax AFTER the government has made an
attempt to reduce spending.”

101
But independent of whether an HST is used to increase total Yukon government revenue, there
are strong reasons to consider introducing this tax -- even other taxes are lowered and overall
government revenue is unchanged. We describe the case for broader tax reform in more detail
in our section on long-term options.
Property Taxes and Local Governments
Property tax in Yukon are low relative to most other jurisdictions. Below we plot the average
dollars per person per year in property taxes paid in 2015. Yukon averages about $1,000, lower
than all other jurisdictions except Nunavut and Newfoundland.
Rates vary across locations, and in unincorporated areas where territorial property taxes apply
the rates are between 0.8% and 1%. In the Whitehorse Peripheral area, for example, the rate is
0.8%. But there are also various exemptions available. For the Whitehorse Peripheral area,
23.75% of property is exempt, so the effective tax rate is 0.61%. In the City of Whitehorse,
meanwhile, the property tax rate is 1.114%. The Home Owners Grant, though, changes things
since the total value is capped in nominal terms. In short, property taxes, especially in areas
near municipalities, are potentially far too low. Residents of such rural areas also enjoy the
services being provided and paid for by the nearby municipal government.
Option: Review property tax rates, especially in unincorporated areas near
municipalities. Consider using some of the incremental revenue to increase municipal
grants.

102
There may also be scope to increase the activities of local governments. Yukon has the lowest
footprint of local governments -- in terms of their share of overall consolidated government
spending within the region -- of all the territories, and lower than any province except PEI. In
2015, 7% of all government spending in the Yukon was local. By comparison, local
governments in the NWT were 9% and Nunavut were 10%. If the Yukon government transferred
responsibilities and the requisite funding for certain activities to local governments such that
local governments were also 10%, that would require roughly $40 million shift from YG to local
governments. This is a large increase. For perspective, the total Comprehensive Municipal
Grant program is $18.2 million.
Grants as a share of local government spending are also fairly low in the Yukon relative to other
territories. In both the NWT and Nunavut, the majority of local government spending is funded
by grants from higher-level governments. In Yukon, meanwhile, this share is roughly one-
quarter, which is not too dissimilar to the national average among the provinces.
Option: Explore opportunities for devolution to Yukon local governments, where such
a shift would lower the overall cost of delivering public services. Ensure local
governments have adequate resource to undertake such expanded responsibilities.

103
Alcohol, Tobacco, and Cannabis Taxes
Given the high social and financial costs associated with substance abuse and excess
consumption of alcohol and tobacco, many Yukoners viewed favorably taxes on these items to
help fund healthcare and support programs in the territory.
Alcohol and drug support services spending will be $10.4 million in 2017-18. This funds a
variety of services, from roughly 700 detox admissions per year and 200 counselling service
clients per month. There are also over 130 intensive treatment program admissions. Revenues
from alcohol and tobacco taxes, meanwhile, are expected to be $23 million for that same year.
This additional revenue helps fund Yukon Government overall, and healthcare spending in
particular.
The Yukon government recently increase tobacco taxes in its recent budget and is largely in line
with such tax levels elsewhere in the country. To be sure, the territories face particular
challenges in this area, and there may be scope for additional increases. Costs of support
programs and health services are higher, and the substance abuse concerns may be higher.
The upcoming legalization of cannabis for recreational use creates an opportunity to not only
increase government revenue from taxation on the consumption of a previously illicit product,
but to consider existing taxation and support program policies related to alcohol and tobacco. It
is tough to say by how much excise and sales taxes on cannabis sales will generate, but for
each $1 per gram tax will generate between $500,000 and $1 million per year for Yukon. How
much fiscal space is available depends on production costs and black-market prices. There may
be scope for more than $1 per gram in the Yukon, given generally higher illicit prices than
southern Canada, but potentially higher production costs work against this.
Option: Consider raising alcohol and tobacco taxes, along with a comprehensive
review of cannabis fiscal space. Revenue raised can be used to support additional
community and drug support programs.

104
Other Tax Changes
Currently, Alberta charges a 4% hotel tax
and BC charges a 2% tax (in addition to the
provincial sales tax of 7%). Manitoba
charges a 5% hotel tax. In Alaska, hotel tax
rates vary across communities and range
from 2% to 13%. In Anchorage, for example,
the hotel tax is 12%. The revenue
implications for Yukon are not trivial, nor
would they materially affect the health of the
tourism industry. A conservative estimate is
possible. If there are 2,500 rooms with 60%
average occupancy throughout the year, then there are over half a million occupied hotel nights
in the territory in a year. If the average room goes for $100 per night, then a modest 2% hotel
tax would raise roughly $1,000,000. A 4% hotel tax, as in Alberta, would potentially raise
$2,000,000. The panel also heard concerns in local communities about the rising costs of
providing (and maintaining) public goods and services.
Not everyone pays the same taxes on
fuel. Off-road commercial activities in
areas such as mining, tourism, logging,
sawmills, hunting, farming, fishing and
trapping are exempt from the territory’s
fuel tax. There are also exemptions for
fuel used for heating. For the 2017-18
fiscal year, such exemptions cost the
Yukon government roughly $4 million. Some exemptions may be defensible on equity grounds -
- especially for heating fuel in remote communities or on fuel used for traditional hunting, fishing,
or trapping activities. But exempting fuel used in certain commercial or industrial operations may
be less defensible. As one Yukoner noted, “a tax exemption is a subsidy.” To the extent that
there is a strong public policy argument to subsidize any particular industry, a more transparent
(and less distortionary) way to do so is by providing a direct cash transfer rather than
incentivizing the burning of fuel.
Option: Consider introducing a Yukon-wide Hotel Tax. Funds may be used in close
collaboration with local communities and industry to support Yukon communities,
enhancing the experience visitors and improving the standard of living of residents.
What We Heard
“Why would you not implement a hotel tax?”
“A lot of tourists go to places around the
world and there's a 5 or 10 dollar charge and
they don't bat an eye. I think we need the
same thing here and we should call it an
infrastructure levy.”
What We Heard
“Bring an end to subsidizing oil, gas, and
propane usage in the Yukon.”
“A tax exemption is a subsidy.”

105
Option 3: Combine New Revenues with Spending Restraint
If both new revenue measures and spending restraint are undertaken in concert, then balance
can be achieved earlier with more equitably distributed costs. For a sense of the magnitudes,
the time to a balanced budget under various combinations of sales tax rates and spending
growth rates is as follows:
● If spending grows at 2%, a 4% sales tax would allow balance by 2020/21.
● If spending grows at 1.5%, a 4% sales tax would allow for balance by 2019/20.
● If spending grows at 0.5%, a 2% sales tax would allow for balance by 2019/20.
A combination approach is also the prudent course, especially given the unpredictable nature of
Yukon income tax revenue and mining sector activity. If future fiscal years evolve as expected,
then income tax reductions funded by the Yukon portion of the HST can be introduced.
Option 4: Wait and See
While it is prudent to take action now to ensure
sustainable finances in the future, it is not a foregone
conclusion that Yukon’s fiscal outlook is grim. The
Conference Board of Canada, in its latest Territorial
Outlook Economic Forecast (Summer 2017), expects
mining activity to grow, and large-scale construction
activity to begin as early as 2018. They anticipate
personal and corporate income tax revenue to enjoy
double digit growth from 2018 through to 2021, adding nearly $31 million more to Yukon coffers
than income taxes generated in 2017-18. This is a more optimistic scenario than both the
government’s projection and our own. In addition, the Conference Board anticipates the TFF
grant from the Government of Canada to grow to over $1.04 billion in 2020-21, which is roughly
$30 million more than the forecast we use in our projections. This is, in part, due to faster
Option: Reduce the number of fuel tax exemptions to commercial activities. That is,
where possible, broaden the fuel tax base and charge the same tax rate on fuel use
regardless of the commercial activity.
Option: The additional revenue raised by broadening the fuel tax base could be
recycled in any number of ways, though the feedback received by the panel suggests
it be used to increase local infrastructure initiatives.
What We Heard
“In my experience, you do
nothing you get nothing.”

106
population growth also due to expanding mining sector activity. If their outlook pans out, Yukon
will remain in surplus and its balance sheet will gradually strengthen.
To be sure, even if their revenue projections hold, the benefits of the medium- and longer-term
reforms we discuss next are still strong. But if these revenue projections do not materialize,
Yukon’s fiscal situation will become more difficult to solve later. Modest action now can ensure
Yukon’s financial situation is sustainable, regardless of either mining sector activity or other
changes in the territory’s fiscal situation beyond the government’s immediate control.
Medium-Term Options
Here we describe medium term challenges, opportunities and upcoming policy changes that
Yukon should consider.
Index the Borrowing Limit to GDP
The Federal government imposes a limit on the total borrowing allowed by the Yukon
government. It and its crown-corporations (like the Yukon Hospital Corporation and other
entities) cannot collectively borrow more than $400 million. Borrowing limits may be sensible,
but as the Yukon economy grows, so too does the government's ability to responsibly carry and
service debt. Currently, the fixed nominal borrowing limit does not reflect this and represents a
gradually tightening limit.
A sensible alternative would be for Yukon to work with the Federal government to index the
territory’s borrowing limit to some function of the size of its economy. As the economy grows, so
too could its borrowing limit. In the event GDP shrinks, the borrowing limit could remain fixed in
nominal terms until the level of GDP returns. The specific details behind how the borrowing limit
is tied to Yukon economy would be subject to further analysis and negotiation.
What level of debt-to-GDP is appropriate? The DBRS -- a credit rating agency -- for example
uses a 15% debt/GDP ratio as one of its threshold metrics separating AAA from AA rated
government debt. To be sure, other ratios may be reasonably chosen but using this ratio for
illustrative purposes, the following table illustrates the projected path of future debt limits in
dollars both under the current limit and a possible 15% debt/GDP limit.
Option: Index the Yukon government’s borrowing limit to increase along with the size
of the territory’s economy. The indexing formula could reflect some moving average,
or other mechanisms to ensure economic volatility does not adversely affect the
government’s fiscal planning.

107
Current Debt Limit ($400 Million)
Proposed Debt Limit 15% of GDP
Year Nominal ($M) Share of GDP Nominal ($M) Share of GDP
2015 $400 14.8% $406 15.0%
2020 400 12.4 485 15.0
2025 400 10.3 584 15.0
2030 400 8.6 699 15.0
To be sure, projecting future GDP is difficult, especially in an economy with a high level of
resource dependency, but the general result is sound: indexing the debt limit to GDP allows the
nominal value of debt to grow along with a government’s ability to carry and service it. A fixed
nominal debt limit of $400 million is a limit that declines through time as a share of the economy.
Currently, this limit is on track to fall to less than 10% of GDP by the end of the next decade.
In addition to mirroring certain credit rating agency criteria, a 15% debt/GDP limit is also
appropriate for Yukon given its near-term fiscal challenges. If spending growth doesn’t
appreciably exceed 2% per year, then the debt limit should not be reached in the foreseeable
future -- although it likely gets very close with spending growth at this level. This forecast may
change, however, as new capital plans are developed by the government or by quasi-
government entities such as the Yukon Development Corporation or the Yukon Housing
Corporation, whose borrowing counts against the government borrowing limit.

108
In any case, this option is not overly time sensitive. Given the many liquid financial assets at the
Yukon government’s disposal (in the form of cash, portfolio investments, and so on), there is
time to negotiate this change with the Government of Canada.
In the event that the borrowing limit cannot be indexed or increased, achieving a balanced
budget for the 2021/22 fiscal year, and potentially earlier, becomes a necessary and binding
target. In effect, combined with judicious use of capital borrowing, total net expenditure growth
of no more than 1.5% per year is required and less would be prudent. Indexing the limit provides
the government with flexibility in dealing with its near-term challenges, and does not expose
Yukon taxpayers or the Government of Canada to undue financial risks.
Implement a Revenue Neutral Carbon Tax
An important decision facing the
government is how to recycle revenue
from the upcoming Federal carbon tax.
Carbon pricing, like all policy action to
address greenhouse gas emissions, has
economic costs. But a wealth of evidence
over decades of research heavily favours
market mechanisms, like carbon pricing,
as the most cost-effective tools available to
governments.10
The core of the argument for pricing as the least-cost option is as follows. There are countless
thousands of choices available to individual households and businesses to lower greenhouse
gas emissions. But their costs differ, and not all should be undertaken. The benefits of lowering
emissions are the avoided environmental consequences. Each tonne we do not emit means a
slightly lower contribution to global climate change. And this can be valued. Environment
Canada’s review of the evidence points to a “social cost of carbon” of roughly $40 per tonne,
though this grows through time and approaches $50 per tonne by 2025.11 Actions that can avoid
emitting a tonne at a lower cost than this are worth undertaking -- they have benefits that
outweigh their costs -- but actions that cost more than this should be avoided.
The trouble for governments is that identifying the truly least-cost options to lower emissions is
difficult to do in a centralized fashion. After all, many small decisions by individuals, by families,
and by businesses are available to very cheaply lower emissions. Consider minor behavioural
changes or the installation of smart thermostats, for example. But governments face an
information problem. Governments typically do not know what those small decisions may be, or
when they do or do not make sense given an individual’s personal circumstances. And even if
they did know, it would be administratively infeasible to induce those choices be made. Instead,
10 A comprehensive and authoritative review of this evidence is available from Canada’s EcoFiscal Commission:
https://ecofiscal.ca/wayforward/ 11 For more, see http://ec.gc.ca/cc/default.asp?lang=En&n=BE705779-1
What We Heard
“With the carbon tax, I understand it's a
sensitive issue, but give some consideration
to levying the fees and giving it back to
municipalities or programs.”
109
putting a price on carbon provides an incentive to everyone in the economy to lower emissions if
it makes sense to do so. Carbon pricing thus leverages the decentralized power of markets to
achieve society’s environmental goals at a lower cost than centralized government decisions.
But a few critical design principles are necessary to ensure carbon pricing is indeed the least-
cost approach.
First, carbon pricing should not add to less efficient policy, such as regulations, but instead
replace them. For example, various regulations on business or subsidies to low-emissions
projects can cost more per tonne of GHGs abated than the choices made by individuals when
faced with a price on emissions. Thus, an important option to consider is reviewing pre-existing
regulations with an eye to eliminate them in areas covered by a carbon price.
Second, and of greater immediate concern, is that carbon pricing not be principally a means of
raising government revenue. Enacting a carbon price need not actually increase the overall size
of government or the tax burden on households or businesses if other taxes are lowered by an
equal offsetting amount. Ideally, carbon pricing presents an opportunity to shift the burden of
taxes towards things we want less of -- such as emissions -- and away from things we want
more of -- like income. To the extent that governments have various initiatives -- environmental
or otherwise -- that require funding, there are more efficient tools than carbon taxes to raise
those funds, such as broad-based sales taxes like an HST.
But economic efficiency is not the only consideration. Low income households are
disproportionately burdened by carbon pricing as energy intensive goods become more
expensive. Governments can help offset this additional burden by providing direct cash
transfers. To ensure the incentive to lower emissions is not undermined, such direct transfers
must be lump-sum and not a refund of taxes paid or in any way related to a particular
household’s consumption choices.
A possible package of policies to recycle carbon revenue that balances equity and efficiency
concerns may be the following,
1. A universal cost-of-living credit of $300 per year.
2. Lowering personal income taxes by 20-25% across the board; and,
3. Lower corporate income taxes by 20-25%.
The specific combination of income tax brackets and rates could also be adjusted to achieve the
20-25% reduction. To illustrate, current personal income tax rates range from 6.4% to 15% and
Option: Adopt tax rate reductions and refundable tax credits to ensure the federal
carbon tax is fully revenue-neutral, carefully balancing equity and efficiency
considerations.

110
these could be lowered to roughly between 5% and 12%. The corporate rate could be lowered
from its current rate of 12% to between 9 and 10%. Further analysis will refine these estimates,
but they add to roughly $25 million by 2022 when fully phased-in or roughly equivalent to a $50/t
carbon tax. They can easily be phased in with annual increments between now and 2022, timed
to coincide with the planned annual increase in the federal carbon price.
This option is also equitable in the sense of benefiting Yukoners by roughly the same
proportion, regardless of their level of income. Specifically, the value of the cost-of-living credit
and income tax reductions combined will be around 2 to 2.5% of total income.
The aggregate cost of the cost-of-living credits funded through the carbon tax will depend on
their scope and generosity. There are roughly 28,000 tax filers in Yukon. If all those who earn
below, say, $50,000 are provided $300 per year (similar to Alberta’s rebate), then just over half
of all Yukon filers would qualify and total payments would be roughly $4.5 million per year -- or a
third of the total carbon tax revenue. If the rebate is universal, as suggested above, the cost
would grow to over $8 million. Other means of recycling the revenue include lower personal and
corporate income tax reductions. To lower personal and corporate taxes by 10% will cost just
under $7 million. The government is therefore able to have a fully revenue neutral carbon tax by
decreasing income taxes by about 20-25% across the board for individual Yukoners and
businesses, and provide the $300 universal cost-of-living tax credit.
There are many alternative options for recycling the carbon tax revenue, and the above
illustrates a simple, equitable, and economically efficient option. For example, instead of 20-
25% lower income tax rates, we could lower them by 10% across the board and increase the
personal exemption to roughly $20,000. This higher personal exemption would mean roughly

111
6,500 Yukoners would pay no income tax at all, and would further lower personal income taxes
paid by all remaining filers by over $500 per year. We note, however, that this would not be as
efficient as lower tax rates, since the broader productivity and economic gains that come from
lower personal income taxes come primarily from lower rates not just the dollars in people's
pockets. The lower rates increase the incentive to work, for example, and may increase Yukon’s
GDP by more than increasing the basic exemption would.
There may also be specific considerations for certain sectors or geographic regions that will be
disproportionately burdened by carbon pricing. Allowing for lower income tax reductions to fund
larger cost-of-living credits to these remote locations or less advantaged communities may be a
sensible option. For example, BC provides supplementary credit of $200 per year to individuals
living outside of its major urban centres. Yukon may consider a similar credit to residents
outside of Whitehorse, at an overall cost of just over half a million dollars per year per $100.
To be sure, there are many other pressing issues and priorities facing Yukon municipalities and
businesses where revenue from carbon pricing may be useful. The panel heard from prominent
business leaders and local government officials that a revenue-neutral carbon tax may not be
their preferred option. The business leaders called for increased energy efficiency grants to help
emissions- and energy-intensive operations lower their carbon tax liability, while municipal
leaders called for increased grants to support the rising costs of adapting to climate change.
Though perhaps not the most economically efficient option, as we argue above, using carbon
tax revenue may be a politically feasible means of increasing government spending in certain
priorities areas raised by business and municipal leaders. We caution, though, that the views of
these business leaders may not be broadly representative.
Review Resource Sector Policies
Yukoners own the territory’s natural resources. The Yukon government and various First Nation
governments manage these resources on behalf of Yukoners and have a full claim to the value
of those resources. Royalties are not taxes. Instead, they are how owners of a natural resource
extract its value when extraction and production is done by another party. An ideal system is
one where any producer that would find it profitable to extract a resource absent a royalty
system remains in operation under the royalty system. That is, royalties should not be the cause
of any particular producer shutting down operations.
The current fee structure should be viewed less like a royalty and more as an administrative fee
to recover certain costs associated with necessary support functions of government. In fiscal-
year 2017-18, for example, there is $257,000 budgeted for the Yukon Placer Secretariat and,
while this is largely fully funded by the $0.375 per ounce royalty, the government is incurring
Option: Use carbon tax revenue to fund additional grants to improve the energy
efficiency of households, businesses, and local and aboriginal governments, or to
help offset the rising local adaptation costs as the climate changes.

112
direct costs over and above this single line item. In this same year, the gold fee is expected to
net $255,000. But there are other modest costs, such as producing maps and charts, work by
the Geological Survey, or the $120,000 in direct transfers to the Klondike Placer Miners’
Association in the 2017-18 fiscal year.
There may be scope to review the per ounce fee, even modestly, to cover such costs. But a
more comprehensive review may be in order.
The current system in Yukon is one
with potentially questionable equity
implications. With such a low royalty,
there are two concerns: (1) over-
extraction of the resource, where even
inefficient producers may find it
worthwhile to operate; and (2) the
resource value is captured by
producers rather than the resource
owners (Yukoners as a whole). To be sure, the first concern may be addressed using other
instruments, such as the number of licenses issued. But the second concern is more difficult.
The current royalty system is equivalent to the government transferring the value of the
extracted gold to producers. That is, it is equivalent to the government optimally extracting some
share of the resource value that Yukoners own and then providing a government transfer to
miners on the order of potentially millions of dollars. To the extent that this is acceptable to
Yukoners on equity grounds, then the case to increase royalties diminishes. Dawson, after all,
may be a region of Yukon where Yukoners and their government feel the resource’s value is
best deployed. But even if this were the case, the government could commit all royalty revenues
to a fund for use on community related initiatives in the Dawson area -- perhaps in close
partnership with the municipal government there.
Option: Undertake a comprehensive review of resource-sector policies, with a
particular emphasis on ensuring fair and efficient royalty rates, fee structures, permit
and licensing costs, tax exemptions, and minimum work requirements.
What We Heard
“The placer industry is a wealth generator in the
Dawson area, we employ, and spend and spread
around much more per ounce than a
conventional hard rock gold mine; but we do
operate on vastly thinner margins.”

113
Compared to other jurisdictions,
Yukon’s placer royalties are low. In
BC, the mineral tax on placer gold is
0.5% of sales. With a market price of,
say, $1,500 per ounce (used for
illustration purposes), this is $7.50 per
ounce -- or 20 times higher than
Yukon’s royalty. In Alberta, the tax rate
is even higher at 5% -- or 200 times
higher than Yukon’s. It is difficult to estimate to what extent Yukon government revenue would
increase under these alternative tax regimes, since not all producers may find it profitable to
continue operations if faced with a royalty rate equivalent to Alberta’s, for example. But, putting
that aside to illustrate magnitudes, if Yukon adopted BC’s tax rate, placer royalty revenues
would increase by roughly $400,000; and if Yukon adopted Alberta’s, over $4 million.
But simply increasing the per-ounce placer royalty rate is not the only (and indeed perhaps not
even advisable) option.
There are alternatives that do not put at risk placer mining -- which is a core concern of the
industry. Increasing the per-ounce royalty risks shutting down marginal producers whose
margins are rather thin. This can be avoided with a royalty levied on the net income of placer
miners. This is how Alaska (a state with a slightly larger placer mining industry than Yukon)
structures its placer royalties. If Yukon were to adopt Alaska’s system, some (potentially many)
placer miners would pay less while others would pay more.
What We Heard
“If government is concerned about balancing its
revenues and expenditures, then we should look
at ways we can benefit more from mining
industries.”

114
It works by defining a threshold level of profit below which no royalties are paid. As a producer’s
profit increases, the per-ounce royalties increase. Put another way, each producer would pay a
share (say, 10%) of profit in excess of the threshold. One could even have scaled rates that
increase with an operation’s profit, much like the progressive income tax system.
But placer miners already pay
personal and corporate income taxes,
does that mean a net-income based
royalty regime is unfair? On its face, it
may strike some as taxing a particular
set of businesses differently than
others. But royalties are not taxes.
They are the means by which
governments extract the value of the
resources that are rightfully owned by
Yukoners. When an owner sells an
asset, the proceeds are not a “tax”
that the owner places on the buyer. In the same way, some of the mining profit reflects the value
of the resource itself -- which is owned by Yukoners.
Regarding larger-scale mining operations in the Yukon, there is no obvious case to increase
change these rates as, according to recent analysis by PwC, payments by larger mining
operations exceed most other jurisdictions.
What We Heard
“What about land leases? In our submission to
Panel we compared YG's land lease rates with
those of BC. Ours are laughably low in
comparison. It is the cost of doing business in BC
and companies are not going broke doing it. They
are used to paying this in BC.”
“The government needs to be brave.”

115
Beyond royalties, there are many license and registration fees paid by miners that are low
relative to other jurisdictions. To register a mining claim in Yukon, one need only pay $10 per
claim (with an additional $2 for a tag). BC fees are significantly higher. There, fees vary by the
size of the claim. For the average size of a Yukon claim, BC registration fees are roughly 2x-4x
higher. There are also low requirements for the amount of work to be done on a claim to keep it
active. Yukon could increase those requirements as well. Coal lease rates are also lower than
elsewhere, with annual license rents varying between $0.05 to $0.20 per acre, depending on the
year. In BC, for comparison, the fee is $7 per hectare or $2.84 per acre. The list goes on. These
low fees should be reviewed and potentially increased.
Finally, many Yukoners expressed concern around the relatively high number of fly-in and fly-
out workers at large-scale mining operations in Yukon. The income taxes paid by these workers
will, for the most part, accrue to the province of their residence, not Yukon. To address this
problem, the NWT has implemented a payroll tax that is levied on worker incomes in the
territory. For residents, such a payroll tax could be deductible from Yukon personal income
taxes paid. This would be mean no increased tax burden for Yukon workers, but a portion of
out-of-territory worker earnings could be appropriately captured by the Yukon government.
Option: Explore the possibility of a Yukon payroll tax on out-of-territory workers at
large-scale mining operations.

116
Support for Societies
A remarkable characteristic of Yukon is the large number of non-governmental organizations
(NGO’s) or “societies” that operate in the territory. According to a report by the Auditor General
of Canada released in March 2017, there are approximately 730 active societies registered in
Yukon. In 2014-15, the Yukon government provided $40 million in support to approximately 300
of these societies. In return for this funding, societies deliver public services related to
recreational, cultural, scientific, community, social, or charitable purposes. Societies are
intended to help the Government of Yukon achieve its objectives presumably in a way that is
more cost-effective than can be done otherwise.
The Department of Community
Services is responsible for
administering the incorporation and
dissolution of societies and for
ensuring compliance with reporting
requirements. As societies are funded
by transfers, the Department of
Finance also plays an important
monitoring role.
One of the findings of the Auditor
General was that greater effort needed to be made to ensure funding was tied to effective
results. The response of government departments to the Auditor General’s report indicates
greater efforts would be made in this regard. While it is clearly too early to report on that
progress, the panel did hear during consultations with representatives of societies that there is
considerable and close scrutiny of their budgets. Monitoring budgets is clearly important but
equally important is the measurement and evaluation of results. Performance indicators, defined
by appropriate metrics and goals, can be used to determine whether societies are meeting the
objectives they have been funded to meet. Funding approximately 300 societies in a territory
with a population as small as Yukon’s suggests there are opportunities for efficiencies that come
from larger scale efforts.
Collaboration with Local Governments
As part of Yukon government priorities, there has been a commitment to invest in communities
with a focus on community-led approaches. We have already discussed the possibility of
changing property tax payments or devolving certain responsibilities to municipal and aboriginal
Option: Review, compare, and assess the performance of government-funded
societies. Encourage opportunities for cost-saving amalgamations or dissolution of
under-performing societies.
What We Heard
“Instead of paying a lot of money in-house or to
consultants give those opportunities to NGOs.”
“Many instances of NGOs delivering
programming, and finding out government was
moving to replicate those programs/services at a
higher cost.”
117
governments. We note here particular issue around infrastructure financing and collaboration
with local governments.
The Yukon government provides base funding to municipalities through the operation of the
Municipal Finance and Community Grants Act. The base funding provides core funding for
operations and a contribution to infrastructure. Municipalities raise revenues through property
taxes and services fees. However, the municipalities largely rely on the Yukon and federal
governments to provide funding for new infrastructure, or to replace ageing infrastructure.
Municipalities receive and allocation of Gas Tax Funds that can be used to build infrastructure.
Other funding sources such as Build Canada Funding are accessed on a proposal driven basis
and subject to prioritization with competing projects Yukon wide.
Indirect effects of new infrastructure are increased operating costs and regulatory burdens with
no supplementary increase in the Municipal Grant. Consequently, municipalities feel the
increase pressure to raise additional revenue, or reduce services, or defer maintenance, and or
capital replacement. It may be effective to have a formalized joint priority setting with Yukon,
municipalities and First Nation Governments so that opportunities to cooperate on joint
infrastructure projects may occur resulting in savings for both parties in respect of capital
expenditures and operations and maintenance costs.
If the option for spending constraint is considered, the impact on the operation of the Municipal
Finance and Community Grants Act should be reviewed in the context of the fiscal pressures
facing municipalities and potential options for mitigation considered.
Other Medium-Term Options
To ensure the territory is on its strongest possible fiscal and economic footing, a number of
additional options should be considered. To be clear, additional analysis or internal capacity
building may be required prior to undertaking any of the following.
There are a variety of arms-length entities operating various aspects of Yukon government
operations. The fully fiscal picture of the territorial government finances are materially different
when presented on a non-consolidated versus consolidated basis. Fully consolidated numbers
exist for each budget’s current fiscal year, but projections into the near future are presented only
in non-consolidated form. This masks the full and complete picture of the territory’s fiscal
situation necessary to identify and overcome near-term challenges as they arise.
Option: Improve comprehensiveness and transparency of territorial budgeting to
include fully consolidated books and projections.
118
A comprehensive review was last undertaken in 2008, though as the analysis in Section 1
makes clear much has changed since.12 As populations age, ensuring health costs are
sustainable is increasingly important. A detailed review of health spending or broader health
operations is beyond the scope and mandate of the Financial Advisory Panel, but the data we
have presented and analyzed in this report points clearly to healthcare as an important area of
government operations where efficiencies and effectiveness could be improved. We noted
earlier the large potential scope to increase fees for certain types of care, for example. A more
comprehensive review may also uncover savings by shifting patients out of hospital beds and
into more appropriate – and lower cost – facilities.
The TFF formula links Yukon’s “expenditure base” (an estimate of the level of public services
that would be comparable to the national average) to growth of government spending nationally.
This effectively ties the TFF base to expenditure increases in southern Canada. Based in health
spending data by age and region from the Canadian Institute for Health Information, we roughly
estimate Yukon will experience an average of 0.5% per year higher health spending increases
than the country as a whole, even holding fixed the per-capita spending in real terms. As health
is about 30% of Yukon’s total, it should arguably be entitled to an annual increment of 0.15% to
the GEB, or roughly $1.5-$2 million per year in growth over and above what it would otherwise
receive. Further analysis to refine potential changes to the TFF system, in close cooperation
with the other territories, the provinces, and the federal government, will be important. A renewal
of both the federal Equalization and TFF programs is set for 2019, with negotiations among First
Ministers before then, which provides an ideal opportunity to explore changes to the TFF to
ensure territorial finances are sustainable well into the future.
12 The final report of the 2008 review is at http://www.hss.gov.yk.ca/pdf/yukon_health_care_review.pdf.
Option: Undertake a thorough review of the Yukon health system, with a particular
emphasis on ensuring cost efficiencies are fully exploited, and that outcomes reflect
such spending.
Option: In partnership with the federal government, explore changes to the Federal
TFF grant to reflect the disproportionate burden an aging population places on health
services in the territories. Such a change may distinguish healthcare services from
other public services in the formula and include a “health cost increment” to reflect
the differential cost increases associated with aging territorial populations.

119
Long-Term General Tax Reform
Moving beyond the territory’s near-term challenges, broader reform can create sustainable long-
run benefits for Yukon in general, and for its government, its economy, and its citizens in
particular. Specifically, Yukoners may consider a broad reform that shifts taxes away from
income and productivity and towards consumption. This will improve the efficiency of Yukon’s
economy, provide funds to create or enlarge a cost-of-living credit, dampen the volatility of
government revenue, lower its reliance on mining sector activity, improve the predictability of
future government revenue, enhance the incentive to work, to save, and to invest, and better
extract value from visitors to Yukon.
Before discussing the details behind such a shift, some background discussion is in order
around a clear “fiscal anchor” to ensure a robust financial situation well into the future.
Anchoring the Budget to Long-Term Goals
The adoption of a fiscal anchor is intended to ensure that short-term shocks do not permanently
push the government off the path leading to a long-term goal. A long-term goal might be a
targeted debt/GDP ratio or a net asset position. It is important that citizens be consulted on
establishing the definition of the fiscal anchor (to get buy-in) and that citizens be able to easily
observe whether the government’s fiscal choices are moving it toward or away from meeting the
anchor. This demands budget transparency.
Yukon has for a long time maintained net assets rather than, like most other jurisdictions, net
debt. Currently, net assets are about 3.5% of the Yukon GDP, but the ratio is falling. To
maintain the current net asset ratio of 3.5% it will need to ensure annual budget surpluses in the
future. A gradual adjustment toward correcting its forecast budget imbalance suggests that may
not be possible in the immediate future but it remains a possible goal for the future.
Alternatively, the territory may want to target a debt/GDP ratio. Were it to do so, the adjustments
to revenue and spending growth rates will be different from what is required to settle to a net
asset ratio. Importantly, targeting a net debt/GDP ratio means the government could plan for
annual budget deficits. One option to implement this would be to index the borrowing limit to
GDP growth, as we earlier suggested for other reasons.
But, ultimately, it is important to not allow volatility in the private sector to cause volatility in
public policies. This sometimes occurs when a private sector expansion (contraction) provides
higher (lower) than usual revenues and so encourages changes to tax rates and spending plans
that are not sustainable over the long term. Insulating the budget from private sector volatility
can be accomplished with the imposition of a fiscal anchor that defines a well-specified fiscal
target to be achieved over the long-term.

120
In Yukon, government revenue and spending are indeed volatile because income tax revenue is
linked to activity in the mining sector, which is itself both large and volatile. Indeed, over the past
decade-and-a-half, total own-source revenue for Yukon did not meet prior expectations. And
recently, the unexpected changes in own-source revenue were on the downside -- as
depressed commodity prices have led to a severe contraction in mining sector activity.
This matters. Unexpected increases in revenue tend to manifest themselves as unplanned
increases in spending. In almost every budget for well over a decade, total expenditures exceed
what was projected and planned for in prior budgets. We plot this below.
Option: Explore clearly defined and broadly acceptable targets to which Yukon’s
fiscal policy may be anchored. Clear metrics for acceptable deficits, debt, revenue,
and spending levels are important when a government’s fiscal situation is exposed to
unpredictable shocks, as Yukon’s is through mining sector activity.

121
A well-specified fiscal target for the government can take many forms. A target for the debt/GDP
ratio is one example. Another is to target the size of financial assets with the goal of creating a
sovereign wealth fund capable of earning the government a relatively stable stream of
investment income. The purpose of a fiscal anchor of this sort is to prevent the government from
making tax and spending choices with long-run budgetary implications that are inconsistent with
the territory’s long-term goals.
A successful fiscal anchor is one that is widely accepted as appropriate by citizens. There is
“buy-in” from the public. The process of defining the fiscal anchor requires a discussion of the
tradeoffs inherent in budgeting. Constraining the government to a long-term target for the debt
ratio, for example, means governments must impose fiscal discipline in the form of annual deficit
targets and this, in turn, limits the scope for new spending and/or tax cuts. If there is public buy-
in to satisfying the long-term target, fiscal discipline is easier to impose and less likely to impose
political costs.
A successful fiscal anchor is also easily understood, easily measured, and easily observed.
These characteristics are desirable as it limits the potential for adjustments being made to the
long-term goal to satisfy short-term problems.
Selecting Tax Instruments
Regardless of the fiscal anchor one has in mind, raising revenues requires taxes. But not all
taxes are created equal, and understanding the pros and cons of each instrument is critical to
making smart budget decisions.
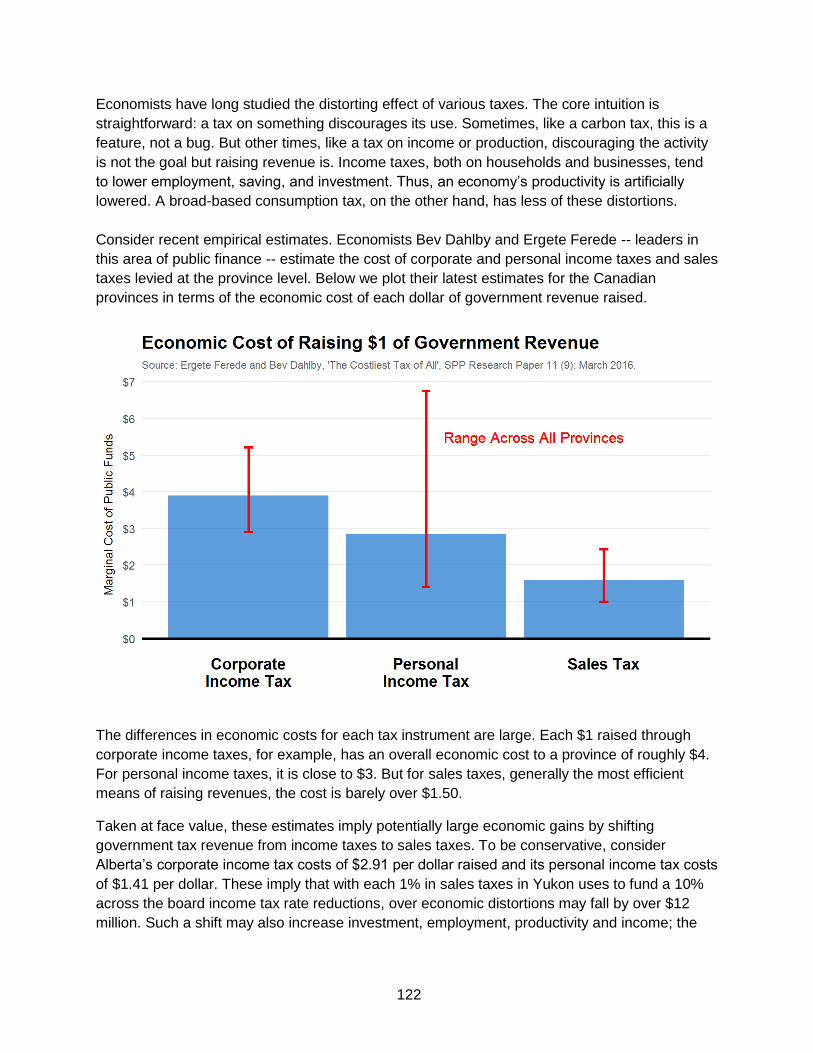
122
Economists have long studied the distorting effect of various taxes. The core intuition is
straightforward: a tax on something discourages its use. Sometimes, like a carbon tax, this is a
feature, not a bug. But other times, like a tax on income or production, discouraging the activity
is not the goal but raising revenue is. Income taxes, both on households and businesses, tend
to lower employment, saving, and investment. Thus, an economy’s productivity is artificially
lowered. A broad-based consumption tax, on the other hand, has less of these distortions.
Consider recent empirical estimates. Economists Bev Dahlby and Ergete Ferede -- leaders in
this area of public finance -- estimate the cost of corporate and personal income taxes and sales
taxes levied at the province level. Below we plot their latest estimates for the Canadian
provinces in terms of the economic cost of each dollar of government revenue raised.
The differences in economic costs for each tax instrument are large. Each $1 raised through
corporate income taxes, for example, has an overall economic cost to a province of roughly $4.
For personal income taxes, it is close to $3. But for sales taxes, generally the most efficient
means of raising revenues, the cost is barely over $1.50.
Taken at face value, these estimates imply potentially large economic gains by shifting
government tax revenue from income taxes to sales taxes. To be conservative, consider
Alberta’s corporate income tax costs of $2.91 per dollar raised and its personal income tax costs
of $1.41 per dollar. These imply that with each 1% in sales taxes in Yukon uses to fund a 10%
across the board income tax rate reductions, over economic distortions may fall by over $12
million. Such a shift may also increase investment, employment, productivity and income; the

123
Yukon government will see an incremental increase in its tax revenues even if the tax shift is
mechanically revenue neutral.
Some qualifications are worth noting. These estimates are for the provinces and Yukon may
have different values. Mining sector activity may be much lumpier and more difficult to shift than
investment generally, so the distortionary effect of corporate income taxes may be lower than
the average province. Indeed, Alberta -- a region with large lumpy investments in the oil and gas
sector -- has the lower marginal cost of public funds estimates for corporate taxes, at under $3.
Also note that eliminating income taxes and shifting entirely to sales taxes may not be optimal
according to these estimates. Changing rates will themselves change the distortionary effect of
taxes. Ideally, we should want the marginal cost of public funds to be equalized across
instruments. So while a shift is likely efficiency enhancing, eliminating income taxes in general
may not be.
It must also be noted that these estimates reflect changes in tax bases in response to changes
in tax rates. This may reflect shifting of incomes for accounting and tax purposes, and therefore
not entirely reflect changes in real economic activity. There remains an ongoing and active
research literature investigating the effect of changes in tax policy. One must approach such
estimates with care, and carefully distinguish studies of national government tax changes from
sub-national ones.
There are also considerations beyond economic costs and efficiency.
First, some tax instruments are more volatile than others. For Yukon, the relevant question is
which tax bases are more correlated to the mining sector. The correlation between personal and
corporate income tax revenues and overall mineral production in Yukon is very strong, and
much stronger than their correlation to GDP. Indeed, since 2010 corporate income taxes are
entirely unrelated to GDP and its variation is entirely explained by mining sector activity. The
estimated tax base of the territory for the TFF formula, on the other hand, is only weakly related
to mining activity but almost perfectly tied to overall GDP growth. So, current Yukon revenue
sources are tightly connected to a volatile sector while the overall tax base, measured by its
estimated fiscal capacity, is much less so. This is primarily because of the consumption tax
base and its relative insensitivity to mining sector activity and stability over the business cycle.

124
Second, due to the Yukon’s unavoidable
reliance on TFF transfers for most of its
revenues, we have to consider how GDP
growth affects the TFF relative to other
sources. As illustrated above, higher
GDP means higher fiscal capacity, which
decreases the TFF transfer.
Unfortunately, actual revenue raised by
the Yukon government through its own
taxes is not guaranteed to fully offset this
reduction in the TFF.
Typically, each $1 billion in additional
GDP is associated with $110 million increase in the territory’s measured fiscal capacity. The
TFF presumes the territory will raise 70% of this, or $77 million. How much Yukon will raise
through its own taxes depends on the nature of the GDP growth. As mentioned earlier, most
current revenue sources are tied tightly to the mining sector. If GDP growth is due to increased
mining sector activity, then Yukon’s own-source revenues will tend to grow more than the drop
in the TFF transfer. But, if growth is broad-based, own-source revenue increases by less. This
leads to a counterintuitive and potentially concerning result: broad-based economic growth
causes a larger deficit in Yukon because own-source revenues do not fully offset lower TFF
transfers. A switch to an HST and away from income taxes will help dampen this effect and
ensure Yukon’s finances are sustainable.
What We Heard
“If there's a sales tax, I can see a lot of my
colleagues lose a lot of sales to Alberta
overnight.”
“Sales tax is, without a doubt, going to affect
retail sales in the territory drastically.”

125
Third, visitors to Yukon pay sales taxes but not income taxes. This can potentially matter a great
deal to the territory. Visitors to Yukon spend roughly $300 million per year. Relative to the
territory’s economy, this is very large. We estimate a territorial HST would, conservatively, raise
roughly one-quarter of its revenue from visitors.13 Each point of an HST would raise roughly $2
million from visitors, and these funds could be used to provide tax credits or rate reductions to
Yukoners.14 A shift away from taxes on income and productivity and towards consumption is
therefore a tax cut to the average Yukoner, though total government revenue remains
unchanged.
Fourth, a shift away from income taxes and towards consumption taxes will improve the
incentive for Yukoners to save and invest for the future. As populations age, retirement planning
becomes increasingly important. Taxing income less when it is earned, and more when it is
spent, increases the returns to savings. Similarly, corporate income taxes tend to lower the
return to investing, by taxing the profit associated with investment activities, while consumption
taxes do not. Importantly, if it chooses to implement a sales tax, we would suggest Yukon adopt
an HST -- where Yukon effectively requests an increase in the federal government’s GST, with
the excess revenue given to the territory -- and not a PST as in BC or Saskatchewan. In those
provinces, the PST is levied on many business inputs, which distorts production decisions of
firms and lowers overall economic productivity. The most efficient consumption taxes apply only
13 The largest source of government revenue from tourism activities in Canada is taxes on final products, like the
GST and HST. A recent change to federal tax policy also eliminates the refund previously available to foreign tourists on GST payments made on their accommodation and tour packages. 14 If the full $300 million in non-resident visitor spending is subject to the HST, the potential share of total HST
payments paid by non-residents rises to roughly 40%. This is substantial. For comparison, Philip Bazel and Jack Mintz estimate a similar share for Alberta of only 10% (see “Enhancing the Alberta Tax Advantage with a Harmonized Sales Tax”, SPP Research Paper 29 (6): Sept 2013).

126
to final goods and services consumed, not to intermediate inputs purchased within the
production process.
Finally, as with any policy change, there are equity implications that should be addressed. A
shift away from income taxes and towards sales taxes can be regressive. Low income
households, after all, pay sales taxes on the goods and services they buy, but tend not to pay
very much in income taxes -- if any at all. Boosting the low-income sales tax credit, which is
currently a feature of the federal GST, can mitigate this concern. To see this, we plot estimates
for the net GST tax burden by average annual household income below. As structured,
Canada’s GST system is not regressive.
All of the above suggests a shift towards consumption taxes would improve the performance of
Yukon’s economy, dampen the volatility of government revenue and reliance on mining sector
activity, improve the predictability of future government revenue, and better extract value from
visitors to Yukon. And, if structured carefully, an HST need not increase the overall tax burden
of Yukoners. Indeed, fully recycled through tax credits or rate reductions elsewhere it will
actually be revenue negative.
Option: Explore the opportunity to shift taxes away from income and productivity and
towards consumption. Sales taxes, while unpopular due to their visibility, could fund
reductions in income taxes that could increase economic efficiency, lower
government revenue volatility, and better extract value from visitors to Yukon.

127
Options for a Tax Shift: How to Recycle HST Revenue
There is much that could be done with
revenues from a 5% sales tax, and it need not
increase the overall tax burden of Yukoners.
Many other taxes could be dramatically
lowered, cost-of-living credits expanded, and
most importantly of all, visitors to the Yukon will
contribute substantially to such a revenue
source.
Visitors spend over $300 million per year in
Yukon. Not all of this is on goods or services
subject to the sales tax (groceries, for example,
are example) but if two-thirds is covered, say, then visitors end up paying roughly one-quarter of
the total potential sales tax revenue earned by the government. That money can then be used
to lower the tax burden of Yukoners directly. For example, half of it could be allocated to
enhanced cost-of-living credits (equivalent to over $100 per adult Yukoner) and the remaining
half could accumulate into a savings fund to ensure future sustainability of territorial finances.
While there are many potential variations, we illustrate a specific reform below that a 5% sales
tax could fund.
○ Raise the personal exemption to $20,000, ensuring 6,500 Yukoners pay no
income taxes at all.
○ Reduce the number of income tax brackets from five to three:
i. 6% on incomes between $20,000 and $100,000
ii. 8% on incomes between $100,000 and $150,000
iii. 10% on incomes between $150,000 and above
○ Lower the general corporate income tax rate to 10%.15
○ Phase in a cost-of-living tax credit to enhance the $300 provided by the carbon
tax to a maximum of $500 per person. Credits would scale with income, as the
NWT credit does, to this maximum.
i. The credit would be calibrated to cost no more than $7 million.
ii. Equity and poverty-alleviation considerations can also take priority here.
Instead of a cost-of-living credit like NWT’s, a working income tax credit
system could be funded instead for the same cost. Benefits would scale
15 Harmonizing the top personal and the general corporate tax rate may be desirable, as many sole proprietor
businesses are subject to the PIT and not the CIT.
What We Heard
“Doesn't shifting taxes from income to
consumption just hurt poor people?”
“I'm a fan of consumption taxes, and I
would go with the corresponding
lowering of income taxes.”
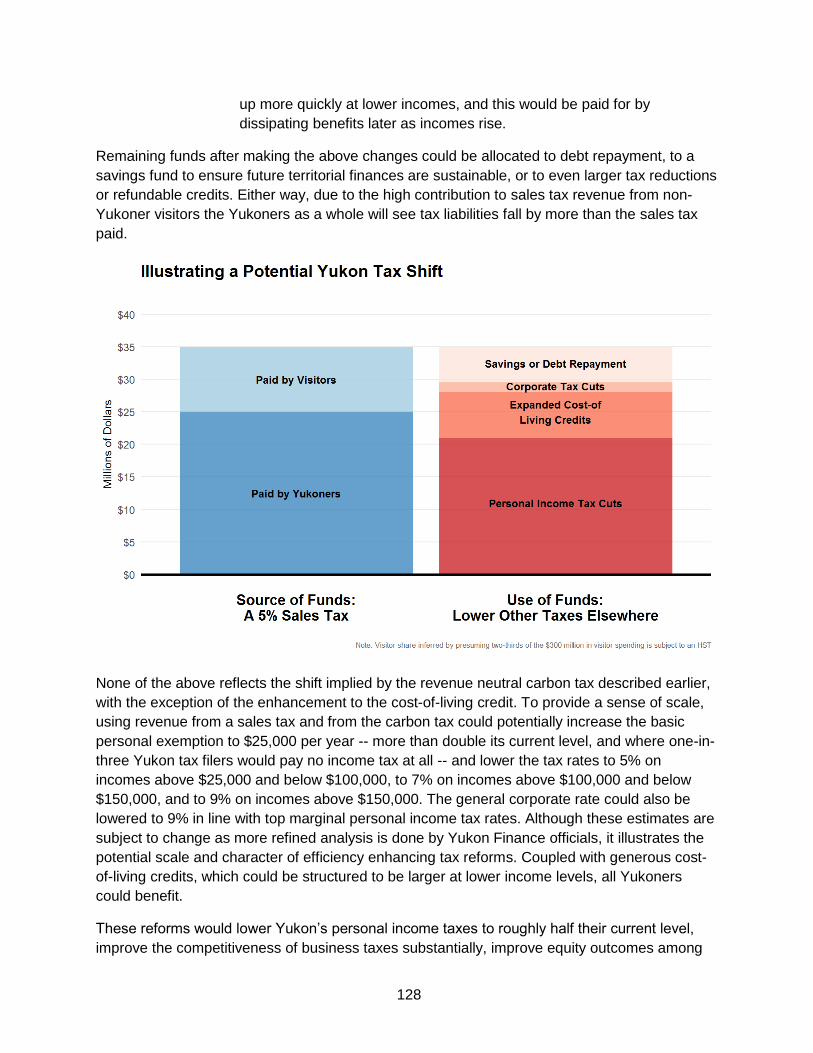
128
up more quickly at lower incomes, and this would be paid for by
dissipating benefits later as incomes rise.
Remaining funds after making the above changes could be allocated to debt repayment, to a
savings fund to ensure future territorial finances are sustainable, or to even larger tax reductions
or refundable credits. Either way, due to the high contribution to sales tax revenue from non-
Yukoner visitors the Yukoners as a whole will see tax liabilities fall by more than the sales tax
paid.
None of the above reflects the shift implied by the revenue neutral carbon tax described earlier,
with the exception of the enhancement to the cost-of-living credit. To provide a sense of scale,
using revenue from a sales tax and from the carbon tax could potentially increase the basic
personal exemption to $25,000 per year -- more than double its current level, and where one-in-
three Yukon tax filers would pay no income tax at all -- and lower the tax rates to 5% on
incomes above $25,000 and below $100,000, to 7% on incomes above $100,000 and below
$150,000, and to 9% on incomes above $150,000. The general corporate rate could also be
lowered to 9% in line with top marginal personal income tax rates. Although these estimates are
subject to change as more refined analysis is done by Yukon Finance officials, it illustrates the
potential scale and character of efficiency enhancing tax reforms. Coupled with generous cost-
of-living credits, which could be structured to be larger at lower income levels, all Yukoners
could benefit.
These reforms would lower Yukon’s personal income taxes to roughly half their current level,
improve the competitiveness of business taxes substantially, improve equity outcomes among

129
Yukoners, leverage the territory’s vibrant tourism sector, improve the stability and predictability
of government revenues, and allow the territory to begin accumulating sustainable fiscal
reserves.
Limited Reform: A Savings Fund
But even without a switch to consumption
taxes, the way in which income taxes are
treated in the budget can help improve
stability and predictability of the Yukon
tax system. Specifically, it could consider
introducing a savings fund. Years where
income tax revenues come in above a
benchmark set in the prior year (which
could evolve with GDP, for example), the
excess is deposited into a savings fund.
Years where income tax revenues come in below the benchmark, the fund is depleted. The
benchmark could be adjusted to ensure no net deposits or withdrawals occur within some set
period of time, say five years. Going forward, budgets wouldn’t include PIT/CIT line items as
they currently do, but a “personal income taxes for budget purposes” and “corporate income
taxes for budget purposes”. (Modelled along the lines of the Alberta Prentice-budget for
resource revenues.)
Option: Dampen government revenue volatility by creating a savings fund to smooth
out positive and negative revenue shocks over time. Specifically, use prior-year
budget projections or a clear fiscal anchor to define a level of revenue above which
excess dollars are saved, rather than spent.
What We Heard
“I would go with a savings fund. There are
really good years sometimes. Instead of
spending all that money that year, put it away
for a rainy day. You do it in your personal
life. Why doesn't government do it?”

130
First Nations’ Fiscal Relations in
Yukon

131
First Nations’ Fiscal Relations in Yukon As part of Yukon Government priorities, there have been commitments to pursue further
reconciliation with Yukon First Nations and to restore and maintain respectful government-to-
government relationships with First Nation governments.
Of the fourteen Yukon First Nations, eleven have Final Agreements. These are constitutionally
protected comprehensive land claim settlement agreements signed by the First Nation, Yukon
and Canada. The Final Agreements typically define First Nation rights within traditional
territories, designate settlement land to be owned by the First Nation, provide for the First
Nation’s participation in the stewardship of natural and heritage resources, and deal with
financial matters such as taxation, financial compensation, resource royalty sharing, and
economic development measures. They also each provide for the establishment of Self-
Government Agreements (discussed below).
The First Nations which have Final Agreements are:
First Nation of Na-Cho Nyak Dün in Mayo,
Champagne & Aishihik First Nations in Haines Junction,
Vuntut Gwitchin First Nation in Old Crow,
Teslin Tlingit Council in Teslin,
Little Salmon-Carmacks First Nation in Carmacks,
Selkirk First Nation in Pelly Crossing,
Kluane First Nation in Burwash Landing,
Ta’an Kwach’an Council in Whitehorse,
Tr’ondek Hwech’in First Nation in Dawson City,
Kwanlin Dün First Nation in Whitehorse. and
Carcross Tagish First Nation in Carcross.
First Nations that do not have Final Agreements or Self-Government Agreements are:
Liard First Nation in Watson Lake
Ross River Dena Council in Ross River
White River First Nation in Beaver Creek
Yukon and the Kaska (Liard First Nation, Ross River Dena Council, Daylu Dena Council, Dease
River First Nation and Kwadacha Nation) have entered into a Framework Agreement to
establish Government-to-Government negotiations to define their relationship, facilitate
economic development and capacity building, establish collaborative land and resource
management, and address social and cultural impacts from land and resource development.
First Nations that have traditional territory in Yukon and Transboundary land claim settlement
agreements include the Gwich’in Tribal Council and the Inuvialuit of the Northwest Territories.

132
The Self-Government Agreements
Each First Nation which has a Final Agreement also has a Self-Government Agreement (SGA)
with Canada and Yukon. The SGA establishes the First Nation as a legal entity and recognizes
the First Nation as a government with law-making powers.
To enable the First Nation to exercise its jurisdiction and deliver programs and services to its
citizens within Yukon, each SGA contains several provisions addressing the First Nation’s fiscal
relations, as a government, with the governments of Canada and Yukon.
These include provision for a Financial Transfer Agreement (FTA) between Canada and the
First Nation. The FTA is structured in the same manner as Yukon’s TFF and has substantially
the same purpose; that is, to enable the First Nation to provide public services within its
jurisdiction at a level reasonably comparable to those prevailing in Yukon, at reasonably
comparable levels of taxation.
The SGAs also recognize that the First Nation has the power to enact laws in relation to direct
taxation. This power runs within the First Nation’s Settlement Land. It can be exercised in
relation to its citizens and, with the agreement of Canada, to other persons and entities within
Settlement Land.
The First Nation tax power is concurrent with Canada and Yukon’s tax powers. The SGAs
therefore also provide for co-ordination between the governments in relation to the exercise of
the First Nation power. This enables the governments to prevent additions to the overall tax
burden within Settlement Land and provide for harmonized taxation regimes. The exception is a
provision which obliges Yukon to share its property tax room where the First Nation exercises its
jurisdiction or assumes responsibility for the delivery of local services and wishes to exercise its
property tax power.
First Nation Personal Income Tax
Self-Governing First Nations have enacted laws in relation to Personal Income Tax. Yukon and
Canada both currently share 95% of their personal income tax room with Self-Governing First
Nations in respect of individuals resident for tax purposes within that particular First Nation’s
Settlement Land. The tax room sharing agreement with Canada is ongoing; the sharing
agreement with Yukon is time-limited and due in the earliest cases to expire in 2019. Tax is
collected in respect of those individuals by Canada and remitted to the First Nation under tax
collection agreements.
The Federal-Provincial Fiscal Arrangements Act (Canada) provides that the personal income
tax revenues shared with Self-Governing First Nations in the Yukon will be excluded from the
calculation of Territorial Formula Financing. In effect, Canada provides a backstop to Yukon for
the sharing of Yukon’s personal income tax room.

133
The personal income tax sharing agreements between Yukon and Self Governing First Nations
provide that, if the Yukon government conducts public consultations on personal income tax
policy, Yukon also will consult directly with these First Nations.
Options to reduce personal income taxes or implement new or increased personal tax credits
will have an impact on Yukon First Nation personal income tax revenues. Self Governing First
Nations Personal Income Tax revenues will decrease by 95% of the change. The impact of the
change could be significant for a First Nation in the context of its total own source revenues and
government budget.
First Nation Goods and Services Tax
Self-Governing First Nations also have enacted laws in relation Goods and Services Tax (GST).
Canada shares with each First Nation 100% of its GST room in Yukon that is attributable by an
agreed formula to individuals resident within that First Nation’s Settlement Land. The First
Nation GST is collected by Canada and remitted to the First Nation under a tax collection
agreement. Canada has discretion to set a new sharing ratio if the proceeds from the First
Nation GST exceed a certain measure.
Options to implement a Yukon HST may not reduce First Nation own source revenue if there is
no change to personal income taxes. However, if the implementation of a HST is considered in
coordination with a reduction in personal income taxes rates, or changes to personal income tax
credits, then the impact on Self-Governing First Nations’ own source revenues should be
considered. Whether Yukon would share its HST room with First Nations on the same basis as
Canada shares its GST room is a policy issue.
Other First Nation Taxes
Self-Governing First Nations have proposed that Yukon enter into tax room or tax revenue
sharing agreements in respect of Yukon corporation income tax, tobacco tax, fuel oil tax, liquor
tax and property tax. These arrangements could take the narrow approach adopted in respect
of personal income tax or the wider approach, with its deemed attribution to reflect the
contribution to the overall Yukon tax base from taxpayers situate within Settlement Land, as
adopted by Canada in respect of GST.
These proposals have not been accepted by the current Yukon government for negotiation.
Unlike personal income tax sharing, the Federal-Provincial Fiscal Arrangements Act does not
exclude the sharing of these other tax bases from the calculation of Yukon’s fiscal capacity for
TFF purposes.
Further discussion with Canada with respect to the treatment of the tax bases involved for the
purposes of both the TFF and FTAs appears to be required to provide for the sharing of Yukon
tax room or tax revenue sharing.

134
First Nation Governments as Yukon Taxpayers
Self-Governing Yukon First Nations are taxpayers in respect of Yukon direct taxes other than
income tax.
In the event that Yukon imposes new taxes, or changes tax rates, Yukon First Nation
governments may be affected. For example, the implementation of a HST or a carbon tax would
result in higher taxes paid by First Nation Governments. Specific credits similar to the 100%
rebate of Federal Goods and Services Tax provided to First Nation Governments may mitigate
some of the increased costs. Whether it is appropriate that Self-Governing Yukon First Nations
be required to pay Yukon tax on their government property and purchases is a policy issue for
Yukon and the First Nations to consider.
Resource Revenue Sharing
Chapter 23 of the Final Agreements provides for the sharing by Yukon of Crown Royalty, as
defined in Chapter 23, with Yukon First Nations. This is an integral part of the land claim
settlement, predicated on the devolution from Canada to Yukon of administration and control
over Yukon’s mineral resources. That devolution has now occurred with Self-Governing Yukon
First Nation support.
Chapter 23 requires Yukon to share with Self-Governing First Nations an amount equal to 50%
of the first two million dollars of Crown Royalty received by Yukon, plus 10% of any additional
amount, after first deducting Yukon’s costs for collection and an offset taken by Canada when
calculating the TFF and the amount of any Yukon First Nation Royalty, as also defined in
Chapter 23. The aggregate amount of Crown Royalty shared, if distributed equally among First
Nation individuals, cannot exceed the Canadian average per capita income.
Any increase in Crown Royalty levied by Yukon on mines and minerals should result in an
increase in the aggregate amount payable under Chapter 23 to Self-Governing Yukon First
Nations, all other things being equal.
Some Self Governing First Nations are concerned that certain royalties levied by Yukon are too
low and that the scope of resource revenues liable to be shared under Chapter 23 is too narrow
to provide a meaningful incentive to support Yukon economic expansion through resource
development in their respective traditional territories.
The options for sustainable
finances includes a review of the
Yukon mining royalty and tax
regime to determine if resource
rents are being efficiently extracted.
Such a review may address some
of the First Nations’ concerns that
certain royalties are levied at too low of a rate.
What We Heard
“Any activities occurring on … First Nation
traditional territory should provide benefits to the
… First Nation.”

135
Infrastructure Funding
Yukon First Nation governments do
not receive directly from Canada
any transfer of targeted
infrastructure funds. Canada’s
funding is transferred to Yukon
under several mandates, each with
their own duration.
Gas Tax Funds are federal excise
tax dollars provided to Yukon on an ongoing basis to support infrastructure spending.
Gas Tax Funding is allocated among Yukon, municipalities, unincorporated communities and
First Nations. The First Nation share is 25%, which is then further allocated among the First
Nations by an agreed formula. This effectively provides each First Nation with an individual
account held by Yukon. The account can be accessed on an application basis for eligible
projects, as approved by Yukon and Canada.
All other federal infrastructure funding is delivered to Yukon for specified periods under
mandates approved in successive federal budgets. There is no allocation for the benefit of First
Nation governments. Access to funding is managed by Yukon on a proposal-driven, project-by-
project basis.
The First Nation governments are of the view that there should be certainty as to the allocation
of federal infrastructure funds to First Nation Governments, whether by way of direct
arrangements with Canada or, if delivered to Yukon, by way of arrangements with Yukon. First
Nation governments would then be able to plan to ensure their priorities are be addressed.
It may be effective to have joint priority setting with Yukon and First Nation governments and,
where applicable, municipalities, so that opportunities to cooperate on joint projects may occur
resulting in savings for both parties in respect of capital expenditures and operations and
maintenance costs.
Consideration should be given to a more coordinated approach to infrastructure planning with
First Nation Governments. There have been successful examples of First Nation entities
building infrastructure in collaboration with Yukon, and this approach could be further enhanced
and explored for future infrastructure projects as outlined in Mitigating Constraints and
Improving Trade-Offs – Improving Public Sector Efficiency.
What We Heard
Some participants expressed frustration at the
feeling that government is still “the big brother”
when it come to funding and expressed the desire
to be more connected with the Department of
Finance.

136
Government-to-Government Fiscal Relationships with First
Nation Governments
The Final Agreements and Self-
Government Agreements contain
provisions which provide
opportunities for the First Nations
and Yukon, as parties to those
Agreements, to address the
exercise of their respective
authorities, as to both the revenue
base and program and service spending of their governments. These provisions facilitate
bilateral negotiations. First Nations may join together from time to time, depending on the topic,
for these discussions.
In addition, the Yukon Forum is established pursuant to the Cooperation in Governance Act.
The Yukon Forum members are the Premier, the Grand Chief of the Council of Yukon First
Nations and the Chief of each Self-Governing First Nation that is a signatory to the
Memorandum of Understanding on Co-operation in Governance in Yukon. The meetings are to
occur at least four times per year to discuss issues of common concern. Working groups may
be established to examine issues, make recommendations, or carry out any other task assigned
by the Yukon Forum. In May of 2017, the Yukon Forum made a declaration to create a joint
five-year action plan that identifies common priorities and ensure a clear plan for implementation
options that are collaborative and transparent. The list of joint priority items included fiscal
relations as a priority focusing on three items:
1. Trilateral (First Nations, Yukon and Canada) fiscal matters,
2. Infrastructure funding including housing, and
3. Resource Revenue Sharing, including implementation of Chapter 23 (Resource Royalty
Sharing) of the Final Agreements.
A third forum provides for discussion of trilateral matters. The Intergovernmental Forum
provides an opportunity for Canada, Yukon, and Self-Governing First Nations to affirm their
partnerships around the implementation of Final and Self-Government Agreements, discuss
areas of mutual interest, and advance intergovernmental relationships. The Premier, Minister of
Indigenous and Northern Affairs, Council of Yukon First Nations Grand Chief and Chiefs from
the Self-Governing First Nations attend the Forum. Any matters of significance to the three
levels of government may be considered.
Yukon, in reviewing the options for sustainable finances, should consider along with First Nation
governments what forum(s) best enables discussion of the potential impact these options may
have on First Nation government finances and what the policy options might be to address
those potential impacts. The appropriate forum may provide a mechanism for ongoing
collaboration on fiscal matters of mutual concern.
What We Heard
“I think we need to get together at one table and
talk about these issues and look each other in the
eye about these social issues and solving hem. And
it hasn’t been there so far.”