Embed Size (px)
Citation preview

YUMA ELEMENTARY SCHOOL DISTRICT NO. 1 COMPREHENSIVE ANNUAL FINANCIAL REPORT
FOR THE FISCAL YEAR ENDED JUNE 30, 2010
_____________________________ 450 Sixth Street – Yuma, Arizona 85364-2973

YUMA ELEMENTARY SCHOOL DISTRICT NO. 1
YUMA, ARIZONA
COMPREHENSIVE ANNUAL FINANCIAL REPORT FOR THE FISCAL YEAR ENDED JUNE 30, 2010
Issued by: Business and Finance Department

YUMA ELEMENTARY SCHOOL DISTRICT NO. 1
TABLE OF CONTENTS
INTRODUCTORY SECTION Page Letter of Transmittal i ASBO Certificate of Excellence vii GFOA Certificate of Achievement viii Organization Chart ix List of Principal Officials x FINANCIAL SECTION INDEPENDENT AUDITORS’ REPORT 1 MANAGEMENT’S DISCUSSION AND ANALYSIS (MD&A)
(Required Supplementary Information) 5 BASIC FINANCIAL STATEMENTS
Government-Wide Financial Statements:
Statement of Net Assets 18 Statement of Activities 19
Fund Financial Statements: Balance Sheet – Governmental Funds 22 Reconciliation of the Balance Sheet –
Governmental Funds to the Statement of Net Assets 25 Statement of Revenues, Expenditures and Changes in Fund Balances –
Governmental Funds 26 Reconciliation of the Statement of Revenues, Expenditures and
Changes in Fund Balances – Governmental Funds to the Statement of Activities 28
Statement of Net Assets – Proprietary Funds 29 Statement of Revenues, Expenses and Changes in Fund Net Assets –
Proprietary Funds 30

YUMA ELEMENTARY SCHOOL DISTRICT NO. 1
TABLE OF CONTENTS (Cont’d)
FINANCIAL SECTION (Cont’d) Page BASIC FINANCIAL STATEMENTS (Concl’d)
Statement of Cash Flows – Proprietary Funds 31 Statement of Fiduciary Assets and Liabilities 32
Notes to Financial Statements 33
SCHEDULE OF REVENUES, EXPENDITURES AND CHANGES IN FUND BALANCES – BUDGET AND ACTUAL (Required Supplementary Information)
General Fund 54 Classroom Site Fund 55 Note to Required Supplementary Information 56
COMBINING AND INDIVIDUAL FUND FINANCIAL STATEMENTS AND SCHEDULES Other Major Governmental Funds Schedule of Revenues, Expenditures and
Changes in Fund Balances – Budget and Actual: Unrestricted Capital Outlay Fund 60 Debt Service Fund 61
Non-Major Governmental Funds: Combining Balance Sheet – All Non-Major Governmental Funds –
By Fund Type 64
Combining Statement of Revenues, Expenditures and Changes in Fund Balances – All Non-Major Governmental Funds – By Fund Type 65
Non-Major Special Revenue Funds:
Combining Balance Sheet 68 Combining Statement of Revenues, Expenditures and
Changes in Fund Balances 74

YUMA ELEMENTARY SCHOOL DISTRICT NO. 1
TABLE OF CONTENTS (Concl’d)
FINANCIAL SECTION (Concl’d) Page COMBINING AND INDIVIDUAL FUND FINANCIAL STATEMENTS AND
SCHEDULES (Concl’d)
Combining Schedule of Revenues, Expenditures and Changes in Fund Balances – Budget and Actual 82
Non-Major Capital Projects Funds:
Combining Balance Sheet 104 Combining Statement of Revenues, Expenditures and Changes in
Fund Balances 106 Combining Schedule of Revenues, Expenditures and Changes in
Fund Balances – Budget and Actual 108
Internal Service Funds: Combining Statement of Net Assets 114 Combining Statement of Revenues, Expenses and Changes in
Fund Net Assets 115 Combining Statement of Cash Flows 116
Agency Funds: Combining Statement of Fiduciary Assets and Liabilities 118 Combining Statement of Changes in Fiduciary Assets and Liabilities 119
STATISTICAL SECTION Financial Trends:
Net Assets by Component 123 Expenses, Program Revenues, and Net (Expense)/Revenue 124 General Revenues and Total Changes in Net Assets 126 Fund Balances – Governmental Funds 128

YUMA ELEMENTARY SCHOOL DISTRICT NO. 1
TABLE OF CONTENTS (Concl’d)
STATISTICAL SECTION (Concl’d) Page Governmental Funds Revenues 129
Governmental Funds Expenditures and Debt Service Ratio 130 Other Financing Sources and Uses and Net Changes in Fund Balances – Governmental Funds 132
Revenue Capacity:
Assessed Value and Estimated Actual Value of Taxable Property 133 Direct and Overlapping Property Tax Rates 134 Principal Property Taxpayers 135 Property Tax Levies and Collections 136
Debt Capacity:
Outstanding Debt by Type 137 Direct and Overlapping Governmental Activities Debt 138 Legal Debt Margin Information 139
Demographic and Economic Information:
County-Wide Demographic and Economic Statistics 140 Principal Employers 141
Operating Information: Full-Time Equivalent District Employees by Type 142 Operating Statistics 144 Capital Assets Information 145

(This page intentionally left blank)

INTRODUCTORY SECTION

(This page intentionally left blank)

GOVERNING BOARD
Greg Wilkinson Joseph Melchionne Maureen Irr Catherine Nicewander Gary Wright
450 W. Sixth Street Yuma, Arizona 85364-2973 Phone: 928.502.4303 Fax: 928.783.7807 Darwin J. Stiffler, Superintendent Kerry Jones, Chief Financial Officer
December 20, 2010 Citizens and Governing Board Yuma Elementary School District No. 1 450 Sixth Street Yuma, AZ 85364-2973 State law mandates that school districts required to undergo an annual single audit publish a complete set of financial statements presented in conformity with accounting principles generally accepted in the United States of America and audited in accordance with auditing standards generally accepted in the United States by a certified public accounting firm licensed in the State of Arizona. Pursuant to that requirement, we hereby issue the comprehensive annual financial report of the Yuma Elementary School District No. 1 (District) for the fiscal year ended June 30, 2010. This report consists of management’s representations concerning the finances of the District. Consequently, management assumes full responsibility for the completeness and reliability of all of the information presented in this report. To provide a reasonable basis for making these representations, management of the District has established a comprehensive internal control framework that is designed both to protect the District’s assets from loss, theft, or misuse and to compile sufficient reliable information for the preparation of the District’s financial statements in conformity with accounting principles generally accepted in the United States of America. Because the cost of internal controls should not outweigh their benefits, the District’s comprehensive framework of internal controls has been designed to provide reasonable rather than absolute assurance that the financial statements will be free of material misstatement. As management, we assert that, to the best of our knowledge and belief, this financial report is complete and reliable in all material respects. The District’s financial statements have been audited by Heinfeld, Meech & Co., P.C., a certified public accounting firm. The goal of the independent audit was to provide reasonable assurance that the financial statements of the District for the fiscal year ended June 30, 2010, are free of material misstatement. The independent audit involved examining, on a test basis, evidence supporting the amounts and disclosures in the financial statements; assessing the accounting principles used and significant estimates made by management; and evaluating the overall financial statement presentation. The independent auditors concluded, based upon the audit, that there was a reasonable basis for rendering an unqualified opinion that the District’s financial statements for the fiscal year ended June 30, 2010, are fairly presented in conformity with accounting principles generally accepted in the United States of America. The independent auditors’ report is presented as the first component of the financial section of this report.

ii
The independent audit of the financial statements of the District was part of a broader, federally mandated Single Audit as required by the provisions of the Single Audit Act Amendments of 1996 and U.S. Office of Management and Budget Circular A-133, Audits of States, Local Governments and Non-Profit Organizations designed to meet the special needs of federal grantor agencies. The standards governing Single Audit engagements require the independent auditor to report not only on the fair presentation of the financial statements, but also on the District’s internal controls and compliance with legal requirements, with special emphasis on internal controls and legal requirements involving the administration of federal awards. These reports are available in a separately issued Single Audit Reporting Package. Accounting principles generally accepted in the United States of America require that management provide a narrative introduction, overview, and analysis to accompany the basic financial statements in the form of Management’s Discussion and Analysis (MD&A). This letter of transmittal is designed to complement the MD&A and should be read in conjunction with it. The District’s MD&A can be found immediately following the report of the independent auditors. PROFILE OF THE DISTRICT The Yuma Elementary School District No. 1 is one of ten public school districts located in Yuma County, Arizona. It provides a program of public education from kindergarten through grade eight, with a student enrollment of approximately 9,925 students. The District’s Governing Board is organized under Section 15-321 of the Arizona Revised Statutes (A.R.S.). Management of the District is independent of other state or local governments. The County Treasurer collects taxes for the District, but exercises no control over its expenditures/expenses. The membership of the Governing Board consists of five members elected by the public. Under existing statutes, the Governing Board’s duties and powers include, but are not limited to, the acquisition, maintenance and disposition of school property; the development and adoption of a school program; and the establishment, organization and operation of schools. The Board also has broad financial responsibilities, including the approval of the annual budget, and the establishment of a system of accounting and budgetary controls. The financial reporting entity consists of a primary government and its component units. A component unit is a legally separate entity that must be included in the reporting entity in conformity with generally accepted accounting principles. The District is a primary government because it is a special-purpose government that has a separately elected governing body, is legally separate, and is fiscally independent of other state or local governments. Furthermore, there are no component units combined with the District for financial statement presentation purposes, and the District is not included in any other governmental reporting entity. Consequently, the District’s financial statements include only the funds of those organizational entities for which its elected governing board is financially accountable. The District’s major operations include education, student transportation, construction and maintenance of District facilities, and food services.

iii
The District is an independent governmental entity located in Southwestern Yuma County, Arizona and encompasses over 2,200 square miles, including the central portion of the City of Yuma, Arizona. The annual expenditure budget serves as the foundation for the District’s financial planning and control. The objective of these budgetary controls is to ensure compliance with legal provisions embodied in the annual expenditure budget approved by the District’s Governing Board. The expenditure budget is prepared by fund for all Governmental Funds, and includes function and object code detail for the General Fund and some Special Revenue and Capital Projects Funds. The legal level of budgetary control (that is, the level at which expenditures cannot exceed the appropriated amount) is established at the individual fund level for all funds. Funds that are not required to legally adopt a budget may have overexpenditures of budgeted funds. The budget for these funds is simply an estimate and does not prevent the District from exceeding the budget as long as the necessary revenue is earned. The District is not required to prepare an annual budget of revenue; therefore, a deficit budgeted fund balance may be presented. However, this does not affect the District’s ability to expend monies. FACTORS AFFECTING FINANCIAL CONDITION The information presented in the financial statements is perhaps best understood when it is considered from the broader perspective of the specific environment within which the District operates. Local Economy. Once dependent upon an agricultural-based economy, the economic base of Yuma County has diversified through the location of service, wholesale and retail trade and light industry. Today, the County's economy is based on government, light manufacturing, tourism, and agriculture. Located within Yuma are the U.S. Marine Corps Air Station (MCAS), the U.S. Army Yuma Proving Ground (YPG) and the Goldwater Gunnery Range, which are adjacent to Yuma and within the County. Yuma Proving Ground is one of the largest military installations in the world. YPG is situated in western Yuma County and southwestern La Paz County approximately 30 miles (north-east of the city of Yuma, the proving ground is used for testing military equipment and encompasses 1,307.8 square miles in the northwestern Sonoran Desert. Munitions and artillery systems are tested in an area almost completely removed from urban encroachment and noise concerns. Restricted airspace amounts to over 2,000 square miles. Nearly 3000 people, mostly civilian, work at the proving ground. Yuma Proving Ground is the largest single employer of civilians in the county with a total economic impact of over $430 million annually. The General Motors Desert Proving Ground - Yuma was officially opened at the proving ground in late July 2009. The new facility is a partnership between General Motors and the Army that allows Army automotive testers at the proving ground to test Army wheeled vehicles at the General Motors facility on a year-round basis. It is estimated that the track can be used to test about 80 percent of the Army's wheeled vehicle fleet.
iv
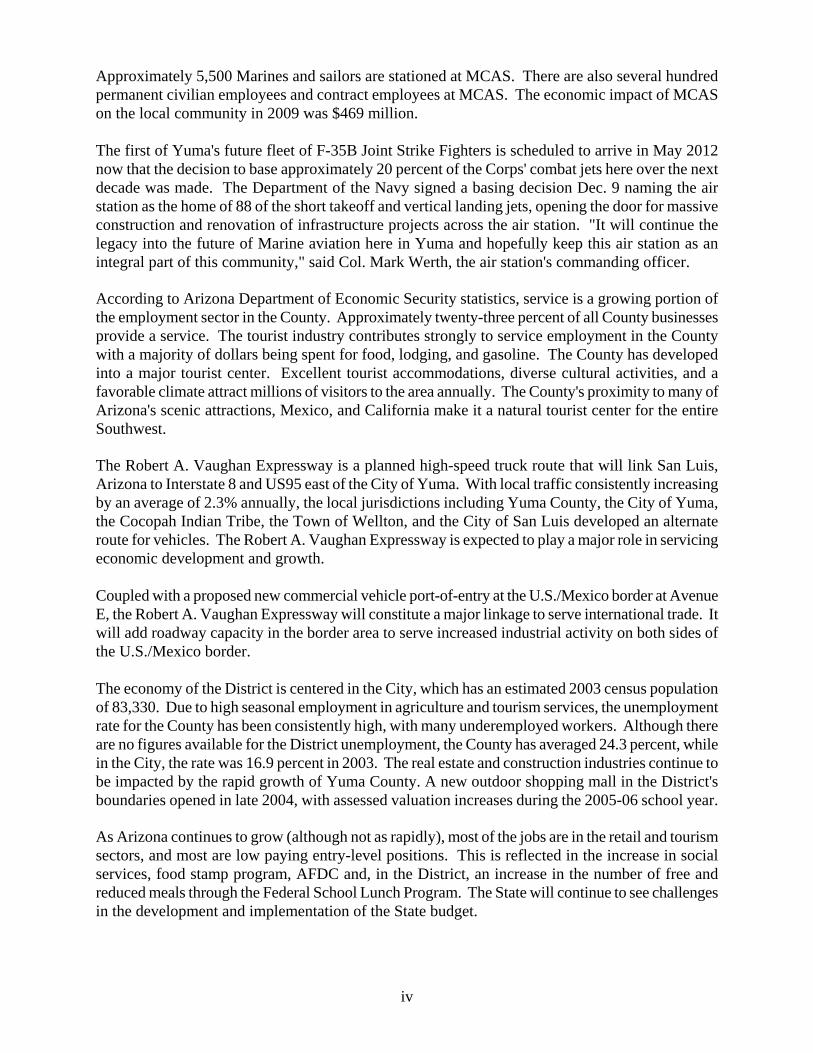
Approximately 5,500 Marines and sailors are stationed at MCAS. There are also several hundred permanent civilian employees and contract employees at MCAS. The economic impact of MCAS on the local community in 2009 was $469 million. The first of Yuma's future fleet of F-35B Joint Strike Fighters is scheduled to arrive in May 2012 now that the decision to base approximately 20 percent of the Corps' combat jets here over the next decade was made. The Department of the Navy signed a basing decision Dec. 9 naming the air station as the home of 88 of the short takeoff and vertical landing jets, opening the door for massive construction and renovation of infrastructure projects across the air station. "It will continue the legacy into the future of Marine aviation here in Yuma and hopefully keep this air station as an integral part of this community," said Col. Mark Werth, the air station's commanding officer. According to Arizona Department of Economic Security statistics, service is a growing portion of the employment sector in the County. Approximately twenty-three percent of all County businesses provide a service. The tourist industry contributes strongly to service employment in the County with a majority of dollars being spent for food, lodging, and gasoline. The County has developed into a major tourist center. Excellent tourist accommodations, diverse cultural activities, and a favorable climate attract millions of visitors to the area annually. The County's proximity to many of Arizona's scenic attractions, Mexico, and California make it a natural tourist center for the entire Southwest. The Robert A. Vaughan Expressway is a planned high-speed truck route that will link San Luis, Arizona to Interstate 8 and US95 east of the City of Yuma. With local traffic consistently increasing by an average of 2.3% annually, the local jurisdictions including Yuma County, the City of Yuma, the Cocopah Indian Tribe, the Town of Wellton, and the City of San Luis developed an alternate route for vehicles. The Robert A. Vaughan Expressway is expected to play a major role in servicing economic development and growth. Coupled with a proposed new commercial vehicle port-of-entry at the U.S./Mexico border at Avenue E, the Robert A. Vaughan Expressway will constitute a major linkage to serve international trade. It will add roadway capacity in the border area to serve increased industrial activity on both sides of the U.S./Mexico border. The economy of the District is centered in the City, which has an estimated 2003 census population of 83,330. Due to high seasonal employment in agriculture and tourism services, the unemployment rate for the County has been consistently high, with many underemployed workers. Although there are no figures available for the District unemployment, the County has averaged 24.3 percent, while in the City, the rate was 16.9 percent in 2003. The real estate and construction industries continue to be impacted by the rapid growth of Yuma County. A new outdoor shopping mall in the District's boundaries opened in late 2004, with assessed valuation increases during the 2005-06 school year. As Arizona continues to grow (although not as rapidly), most of the jobs are in the retail and tourism sectors, and most are low paying entry-level positions. This is reflected in the increase in social services, food stamp program, AFDC and, in the District, an increase in the number of free and reduced meals through the Federal School Lunch Program. The State will continue to see challenges in the development and implementation of the State budget.

v
Long-term Financial Planning. The State of Arizona is currently facing a 10-15% budget shortfall over the next two fiscal years ending June 30, 2012, which will have a significant but currently unknown negative effect on the District's operating and capital budgets for these two years. Due to these declines in State revenues, the District expects at least a 5% reduction in its revenue and expenditure budget through 2010-11. Projected enrollment for fiscal year 2010-11 is estimated at 9,990 students. The average of school building is 34 years. There are no significant construction or maintenance projects anticipated. The District continues to be a participant in an innovative consortium representing four separate educational institutions; Northern Arizona University, Arizona Western College, Yuma Union High School District and our District. By using creativity and hard work, the communities served by these four agencies will see increased value in the programs and services offered to them by the use of the K-20 campus concept. The main departments that are shared are the Materials Management Consortium, Technology Consortium and the Yuma Schools Transportation Consortium. Major initiatives of the District. Yuma School District One is in the process of completing a new strategic plan. Administrators, teachers, students, parents, business and community leaders, and other stakeholders contributed thousands of hours to the development of District One's new strategic plan. Goals and priorities have been developed based on a High Performance Model framework. Leaders at all levels, core values, customer focus, and systems thinking are the four drivers within the model that promote the achievement of continuous improvement over time. District One's Vision "ONE Community Pursuing Excellence" and the goals and priorities in the strategic plan will be used to align all systems and levels of the organization towards common goals. The new strategic plan is especially critical for prioritizing programs during this period of declining resources. The District is also developing the infrastructure and capacity to provide online learning throughout Arizona. The District has purchased Plato software to form the core curriculum for online learning and is discussing utilizing Northern Arizona University/Arizona Western College’s online learning framework for this initiative. AWARDS AND ACKNOWLEDGMENT Awards. The Association of School Business Officials International (ASBO) awarded a Certificate of Excellence in Financial Reporting to the District for its comprehensive annual financial report for the fiscal year ended June 30, 2009. This was the seventeenth consecutive year that the District has received this prestigious award. In addition, the Government Finance Officers Association (GFOA) awarded a Certificate of Achievement for Excellence in Financial Reporting to the District for its comprehensive annual financial report for the fiscal year ended June 30, 2009. In order to be awarded these certificates, the District published an easily readable and efficiently organized comprehensive annual financial report. This report satisfied both accounting principles generally accepted in the United States of America and applicable legal requirements. These certificates are valid for a period of one year only. We believe that our current comprehensive annual financial report continues to meet the programs’ requirements and we are submitting it to ASBO and GFOA to determine its eligibility for the fiscal year 2009-10 certificates.

vi
Acknowledgments. The preparation of the comprehensive annual financial report on a timely basis was made possible by the dedicated service of the entire staff of the business and finance department. Each member of the department has our sincere appreciation for the contributions made in the preparation of this report. In closing, without the leadership and support of the Governing Board of the District, preparation of this report would not have been possible. Respectfully submitted, Kerry Jones Chief Financial Officer
vii

viii

ix
Yuma Elementary District One Organization Chart
x
YUMA ELEMENTARY SCHOOL DISTRICT NO. 1
LIST OF PRINCIPAL OFFICIALS
GOVERNING BOARD
Greg Wilkinson President
Maureen Irr Catherine Nicewander Clerk Member
Joseph Melchionne Gary V. Wright Member Member
ADMINISTRATIVE STAFF
Darwin Stiffler, Superintendent
Tom Hurt, Associate Superintendent for School Improvement
Duane Sheppard, Associate Superintendent for Curriculum and Instruction
Kerry Jones, Chief Financial Officer
Kriss Rico, Director of Administrative Services

FINANCIAL SECTION

(This page intentionally left blank)

INDEPENDENT AUDITORS’ REPORT Governing Board Yuma Elementary School District No. 1 We have audited the accompanying financial statements of the governmental activities, each major fund, and the aggregate remaining fund information of the Yuma Elementary School District No. 1 (District), as of and for the year ended June 30, 2010, which collectively comprise the District’s basic financial statements as listed in the table of contents. These financial statements are the responsibility of the District’s management. Our responsibility is to express opinions on these financial statements based on our audit. We conducted our audit in accordance with auditing standards generally accepted in the United States of America and the standards applicable to financial audits contained in Government Auditing Standards, issued by the Comptroller General of the United States. Those standards require that we plan and perform the audit to obtain reasonable assurance about whether the financial statements are free of material misstatement. An audit includes examining, on a test basis, evidence supporting the amounts and disclosures in the financial statements. An audit also includes assessing the accounting principles used and the significant estimates made by management, as well as evaluating the overall financial statement presentation. We believe that our audit provides a reasonable basis for our opinions. In our opinion, the financial statements referred to above present fairly, in all material respects, the respective financial position of the governmental activities, each major fund, and the aggregate remaining fund information of the Yuma Elementary School District No. 1, as of June 30, 2010, and the respective changes in financial position and cash flows, where applicable, thereof for the year then ended in conformity with accounting principles generally accepted in the United States of America. In accordance with Government Auditing Standards, we have also issued our report dated December 20, 2010, on our consideration of the Yuma Elementary School District No. 1’s internal control over financial reporting and on our tests of its compliance with certain provisions of laws, regulations, contracts, and grant agreements and other matters. The purpose of that report is to describe the scope of our testing of internal control over financial reporting and compliance and the results of that testing, and not to provide an opinion on the internal control over financial reporting or on compliance. That report is an integral part of an audit performed in accordance with Government Auditing Standards and should be considered in assessing the results of our audit.
10120 N. Oracle Road Tucson, Arizona 85704
Tel (520) 742-2611 Fax (520) 742-2718
HEINFELD, MEECH & CO., P.C. CERTIFIED PUBLIC ACCOUNTANTS
TUCSON • PHOENIX • FLAGSTAFF www.heinfeldmeech.com

Page 2
Accounting principles generally accepted in the United States of America require that the management’s discussion and analysis on pages 5 through 14 and budgetary comparison information on pages 54 through 56 be presented to supplement the basic financial statements. Such information, although not a part of the basic financial statements, is required by the Governmental Accounting Standards Board, who considers it to be an essential part of financial reporting for placing the basic financial statements in an appropriate operational, economic, or historical context. We have applied certain limited procedures to the required supplementary information in accordance with auditing standards generally accepted in the United States of America, which consisted of inquiries of management about the methods of preparing the information and comparing the information for consistency with management’s responses to our inquiries, the basic financial statements, and other knowledge we obtained during our audit of the basic financial statements. We do not express an opinion or provide any assurance on the information because the limited procedures do not provide us with sufficient evidence to express an opinion or provide any assurance. Our audit was conducted for the purpose of forming opinions on the financial statements that collectively comprise the District’s financial statements as a whole. The accompanying supplementary information such as the introductory section, combining and individual fund financial statements and schedules, and statistical section are presented for purposes of additional analysis and are not a required part of the financial statements. The combining and individual fund financial statements are the responsibility of management and were derived from and relate directly to the underlying accounting and other records used to prepare the financial statements. The information has been subjected to the auditing procedures applied in the audit of the financial statements and certain additional procedures, including comparing and reconciling such information directly to the underlying accounting and other records used to prepare the financial statements or to the financial statements themselves, and other additional procedures in accordance with auditing standards generally accepted in the United States of America. In our opinion, the information is fairly stated in all material respects in relation to the financial statements as a whole. The introductory and statistical sections have not been subjected to the auditing procedures applied in the audit of the basic financial statements and, accordingly, we do not express an opinion or provide any assurance on them. HEINFELD, MEECH & CO., P.C. Certified Public Accountants December 20, 2010

Page 3
MANAGEMENT’S DISCUSSION AND ANALYSIS (MD&A) (Required Supplementary Information)

Page 4
(This page intentionally left blank)

YUMA ELEMENTARY SCHOOL DISTRICT NO. 1 MANAGEMENT’S DISCUSSION AND ANALYSIS (MD&A)
YEAR ENDED JUNE 30, 2010
Page 5
As management of the Yuma Elementary School District No. 1 (District), we offer readers of the District’s financial statements this narrative overview and analysis of the financial activities of the District for the current fiscal year. We encourage readers to consider the information presented here in conjunction with additional information that we have furnished in our letter of transmittal, which can be found in the introductory section of this report. FINANCIAL HIGHLIGHTS
The District’s total net assets of governmental activities increased $7.7 million which
represents a 14 percent increase from the prior fiscal year as a result of efforts by the District to reduce current year expenses and maximize budget and cash carryforward for future year expenses.
General revenues accounted for $56.8 million in revenue, or 76 percent of all current fiscal
year revenues. Program specific revenues in the form of charges for services and grants and contributions accounted for $17.5 million or 24 percent of total current fiscal year revenues.
The District had approximately $66.5 million in expenses related to governmental activities,
a decrease of 12 percent from the prior fiscal year due primarily to staffing reductions, utility conservation and other budget reduction measures due to state budget cuts.
Among major funds, the General Fund had $48.8 million in current fiscal year revenues,
which primarily consisted of state aid and property taxes, and $42.8 million in expenditures. The General Fund’s fund balance increase from a deficit of $1.7 million at the prior fiscal year end to $4.2 million at the end of the current fiscal year was due to efforts by the District to reduce current year expenditures and maximize budget and cash carryforward for future year expenditures.

YUMA ELEMENTARY SCHOOL DISTRICT NO. 1 MANAGEMENT’S DISCUSSION AND ANALYSIS (MD&A)
YEAR ENDED JUNE 30, 2010
Page 6
OVERVIEW OF FINANCIAL STATEMENTS This discussion and analysis are intended to serve as an introduction to the District’s basic financial statements. The District’s basic financial statements comprise three components: 1) government-wide financial statements, 2) fund financial statements, and 3) notes to the financial statements. This report also contains other supplementary information in addition to the basic financial statements themselves. Government-wide financial statements. The government-wide financial statements are designed to provide readers with a broad overview of the District’s finances, in a manner similar to a private-sector business. The accrual basis of accounting is used for the government-wide financial statements. The statement of net assets presents information on all of the District’s assets and liabilities, with the difference between the two reported as net assets. Over time, increases or decreases in net assets may serve as a useful indicator of whether the financial position of the District is improving or deteriorating. The statement of activities presents information showing how the District’s net assets changed during the most recent fiscal year. All changes in net assets are reported as soon as the underlying event giving rise to the change occurs, regardless of the timing of related cash flows. Thus, revenues and expenses are reported in this statement for some items that will only result in cash flows in future fiscal periods (e.g., uncollected taxes and earned but unused compensated absences). The government-wide financial statements outline functions of the District that are principally supported by property taxes and intergovernmental revenues. The governmental activities of the District include instruction, support services, operation and maintenance of plant services, student transportation services, operation of non-instructional services, and interest on long-term debt. Fund financial statements. A fund is a grouping of related accounts that is used to maintain control over resources that have been segregated for specific activities or objectives. The District uses fund accounting to ensure and demonstrate compliance with finance-related legal requirements. All of the funds of the District can be divided into three categories: governmental funds, proprietary funds, and fiduciary funds.
Governmental funds. Governmental funds are used to account for essentially the same functions reported as governmental activities in the government-wide financial statements. However, unlike the government-wide financial statements, governmental fund financial statements used the modified accrual basis of accounting and focus on near-term inflows of spendable resources, as well as on balances of spendable resources available at the end of the fiscal year. Such information may be useful in evaluating the District’s near-term financing requirements.

YUMA ELEMENTARY SCHOOL DISTRICT NO. 1 MANAGEMENT’S DISCUSSION AND ANALYSIS (MD&A)
YEAR ENDED JUNE 30, 2010
Page 7
OVERVIEW OF FINANCIAL STATEMENTS (Concl’d) Because the focus of governmental funds is narrower than that of the government-wide financial statements, it is useful to compare the information presented for governmental funds with similar information presented for governmental activities in the government-wide financial statements. By doing so, readers may better understand the long-term impact of the District’s near-term financing decision. Both the governmental fund balance sheet and the governmental fund statement of revenues, expenditures and changes in fund balances provide a reconciliation to facilitate this comparison between governmental funds and governmental activities. Information is presented separately in the governmental fund balance sheet and in the governmental fund statement of revenues, expenditures and changes in fund balances for the General, Classroom Site, Unrestricted Capital Outlay, and Debt Service Funds, all of which are considered to be major funds. Data from the other governmental funds are combined into a single, aggregated presentation. Individual fund data for each of these non-major governmental funds is provided in the form of combining statements and schedules. Proprietary funds. The District maintains one type of proprietary fund. The internal service funds are an accounting device used to accumulate and allocate costs internally among the District’s various functions. The District uses its internal service funds to account for 1) the Transportation Consortium Fund, which accounts for the operation of transportation services to other governmental entities and District funds on a cost reimbursement basis and 2) the Intergovernmental Agreements Fund, which accounts for other financial activities related to agreements with other governments where the District is the fiscal agent. The internal service funds are combined into a single, aggregated presentation in the proprietary fund financial statements. The proprietary fund financial statements are reported on the accrual basis of accounting. Fiduciary funds. Fiduciary funds are used to account for resources held for the benefit of parties outside the District. Fiduciary funds are not reflected in the government-wide financial statements because the resources of those funds are not available to support the District’s own programs. Due to their custodial nature, fiduciary funds do not have a measurement focus and are reported on the accrual basis of accounting.
Notes to the financial statements. The notes provide additional information that is essential to a full understanding of the data provided in the government-wide and fund financial statements. The notes to the financial statements can be found immediately following the basic financial statements. Other information. In addition to the basic financial statements and accompanying notes, this report also presents certain required supplementary information concerning the District’s budget process. The District adopts an annual expenditure budget for all governmental funds. A schedule of revenues, expenditures and changes in fund balances – budget and actual has been provided for the General Fund and major Special Revenue Fund as required supplementary information.
YUMA ELEMENTARY SCHOOL DISTRICT NO. 1 MANAGEMENT’S DISCUSSION AND ANALYSIS (MD&A)
YEAR ENDED JUNE 30, 2010
Page 8
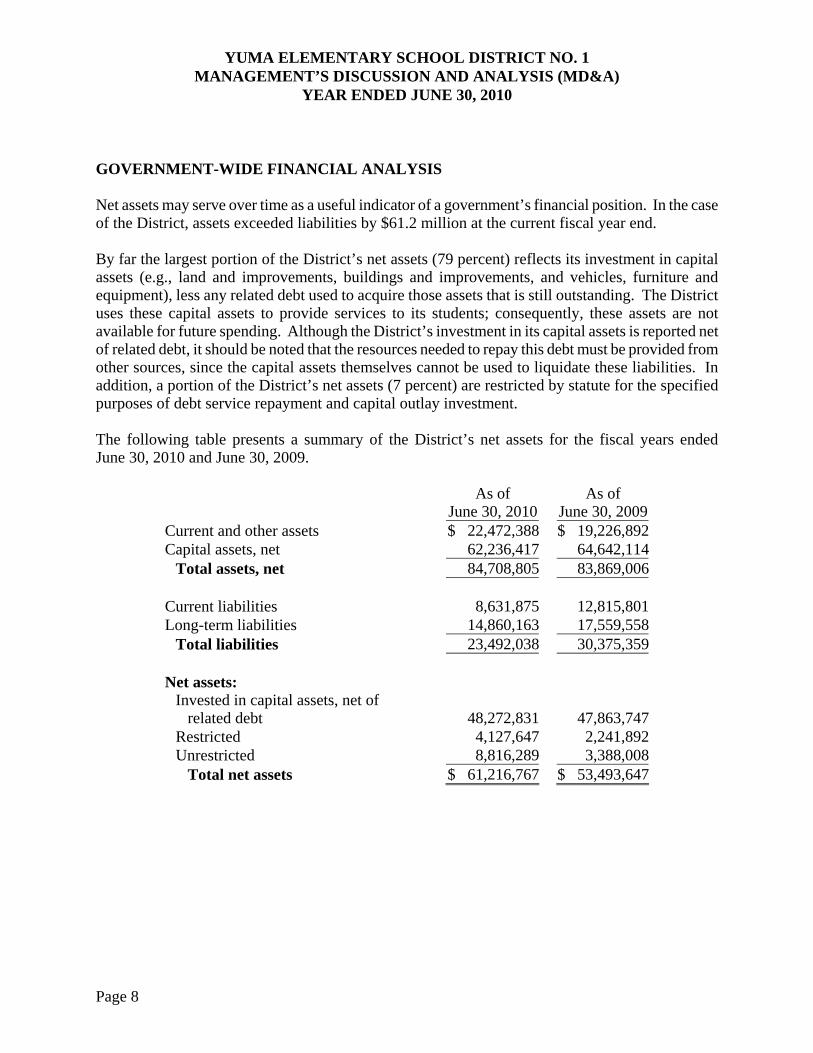
GOVERNMENT-WIDE FINANCIAL ANALYSIS Net assets may serve over time as a useful indicator of a government’s financial position. In the case of the District, assets exceeded liabilities by $61.2 million at the current fiscal year end. By far the largest portion of the District’s net assets (79 percent) reflects its investment in capital assets (e.g., land and improvements, buildings and improvements, and vehicles, furniture and equipment), less any related debt used to acquire those assets that is still outstanding. The District uses these capital assets to provide services to its students; consequently, these assets are not available for future spending. Although the District’s investment in its capital assets is reported net of related debt, it should be noted that the resources needed to repay this debt must be provided from other sources, since the capital assets themselves cannot be used to liquidate these liabilities. In addition, a portion of the District’s net assets (7 percent) are restricted by statute for the specified purposes of debt service repayment and capital outlay investment. The following table presents a summary of the District’s net assets for the fiscal years ended June 30, 2010 and June 30, 2009.
As of
June 30, 2010 As of
June 30, 2009 Current and other assets $ 22,472,388 $ 19,226,892Capital assets, net 62,236,417 64,642,114
Total assets, net 84,708,805 83,869,006 Current liabilities 8,631,875 12,815,801Long-term liabilities 14,860,163 17,559,558
Total liabilities 23,492,038 30,375,359 Net assets:
Invested in capital assets, net of related debt 48,272,831 47,863,747
Restricted 4,127,647 2,241,892Unrestricted 8,816,289 3,388,008
Total net assets $ 61,216,767 $ 53,493,647

YUMA ELEMENTARY SCHOOL DISTRICT NO. 1 MANAGEMENT’S DISCUSSION AND ANALYSIS (MD&A)
YEAR ENDED JUNE 30, 2010
Page 9
GOVERNMENT-WIDE FINANCIAL ANALYSIS (Cont’d) At the end of the current fiscal year the District reported positive balances in all three categories of net assets. The same situation held true for the prior fiscal year. The District’s financial position is the product of several financial transactions including the net result of activities, the acquisition and payment of debt, the acquisition and disposal of capital assets, and the depreciation of capital assets. The following are significant current year transactions that had an impact on the Statement of Net Assets.
The principal retirement of $2.4 million of bonds and $414,781 of lease principal. The addition of $1.1 million in capital assets through school improvements and purchases of
vehicles, furniture and equipment. The disposal of $412,059 of improvements and equipment.
Changes in net assets. The District’s total revenues for the current fiscal year were $74.2 million. The total cost of all programs and services was $66.5 million. The following table presents a summary of the changes in net assets for the fiscal years ended June 30, 2010 and June 30, 2009.
Fiscal Year Ended
June 30, 2010
Fiscal Year Ended
June 30, 2009Revenues:
Program revenues: Charges for services $ 1,123,753 $ 1,520,152 Operating grants and contributions 15,707,155 15,921,875 Capital grants and contributions 658,563 425,800
General revenues: Property taxes 13,753,527 13,866,971 Investment income 80,926 79,958 Unrestricted county aid 984,150 Unrestricted state aid 38,203,111 43,084,517 Unrestricted federal aid 3,729,033 406,311 Total revenues 74,240,218 75,305,584
Expenses: Instruction 35,226,598 41,511,092 Support services – students and staff 7,435,370 8,247,852 Support services – administration 6,626,303 6,627,549 Operation and maintenance of plant services 7,324,094 9,138,417 Student transportation services 4,425,531 4,381,081 Operation of non-instructional services 4,781,711 4,969,641 Interest on long-term debt 697,491 831,330
Total expenses 66,517,098 75,706,962 Change in net assets $ 7,723,120 $ (401,378)

YUMA ELEMENTARY SCHOOL DISTRICT NO. 1 MANAGEMENT’S DISCUSSION AND ANALYSIS (MD&A)
YEAR ENDED JUNE 30, 2010
Page 10
GOVERNMENT-WIDE FINANCIAL ANALYSIS (Cont’d)
The following are significant current year transactions that have had an impact on the change in net assets.
County aid increased $984,150 due to the expiration of suspension of county equalization. Unrestricted state aid decreased $4.9 million due to reductions in state equalization pursuant to
HB 2006 Section 14. Unrestricted federal aid increased $3.3 million due to funding under the American Recovery and
Reinvestment Act (ARRA) of 2009. Instruction expenses decreased $6.3 million due primarily to staffing reductions and other budget
reduction measures due to state budget cuts. Support services and staff decreased $812,482 due to staffing reductions and other budget
reduction measures due to state budget cuts. Operation and maintenance of plant services decreased $1.8 million due to a reduction in
technology related expenses that were funded through E-rate. Additionally, the District was able to reduce energy costs at two sites, which resulted in a decrease of approximately $400,000.
The following table presents the cost of the seven major District functional activities: instruction, support services – students and staff, support services – administration, operation and maintenance of plant services, student transportation services, operation of non-instructional services and interest on long-term debt. The table also shows each function’s net cost (total cost less charges for services generated by the activities and intergovernmental aid provided for specific programs). The net cost shows the financial burden that was placed on the State and District’s taxpayers by each of these functions.
Fiscal Year 2009-10 Expenses
53%
11%
10%
11%
7%
1%7%
Instruction Support services - students and staff
Support services - administration Operation and maintenance of plant services
Student transportation services Operation of non-instructional services
Interest on long-term debt
Fiscal Year 2008-09 Expenses
7% 1%6%
12%
9%
11%
54%

YUMA ELEMENTARY SCHOOL DISTRICT NO. 1 MANAGEMENT’S DISCUSSION AND ANALYSIS (MD&A)
YEAR ENDED JUNE 30, 2010
Page 11
GOVERNMENT-WIDE FINANCIAL ANALYSIS (Concl’d)
Year Ended June 30, 2010 Year Ended June 30, 2009
Total
Expenses
Net (Expense)/ Revenue
Total Expenses
Net (Expense)/ Revenue
Instruction $ 35,226,598 $(27,671,373) $ 41,511,092 $(32,383,968)Support services – students and staff 7,435,370 (3,458,682) 8,247,852 (5,548,287)Support services – administration 6,626,303 (6,002,660) 6,627,549 (6,270,564)Operation and maintenance of plant services 7,324,094 (7,250,643) 9,138,417 (8,548,671)Student transportation services 4,425,531 (4,332,549) 4,381,081 860,025 Operation of non-instructional services 4,781,711 385,771 4,969,641 103,942 Interest on long-term debt 697,491 (697,491) 831,330 (831,330)
Total $ 66,517,098 $(49,027,627) $ 75,706,962 $(52,618,853)
The cost of all governmental activities this year was $66.5 million.
Federal and State governments and charges for services subsidized certain programs with grants and contributions and other local revenues of $17.5 million.
Net cost of governmental activities of $49.0 million was financed by general revenues, which are made up of primarily property taxes of $13.8 million and state aid of $38.2 million. State Fiscal Stabilization revenues were $3.7 million.
FINANCIAL ANALYSIS OF THE DISTRICT’S FUNDS As noted earlier, the District uses fund accounting to ensure and demonstrate compliance with finance-related legal requirements. Governmental funds. The focus of the District’s governmental funds is to provide information on near-term inflows, outflows, and balances of spendable resources. Such information is useful in assessing the District’s financing requirements. In particular, unreserved fund balance may serve as a useful measure of the District’s net resources available for spending at the end of the fiscal year. The financial performance of the District as a whole is reflected in its governmental funds. As the District completed the year, its governmental funds reported a combined fund balance of $9.8 million, an increase of $9.1 million due primarily to efforts by the District to reduce current year expenditures and maximize budget and cash carryforward for future year expenditures.

YUMA ELEMENTARY SCHOOL DISTRICT NO. 1 MANAGEMENT’S DISCUSSION AND ANALYSIS (MD&A)
YEAR ENDED JUNE 30, 2010
Page 12
FINANCIAL ANALYSIS OF THE DISTRICT’S FUNDS (Concl’d) The General Fund comprises 42 percent of the total fund balance. Approximately $3.9 million, or 94 percent of the General Fund’s fund balance constitutes unreserved fund balance. The remaining fund balance of $257,070 is reserved for inventory and it is not available for spending because it has already been committed. The General Fund is the principal operating fund of the District. The increase in fund balance of $5.9 million to $4.2 million as of fiscal year end was a result of staffing reductions, utility conservation and other budget reductions as part of a determined effort by the District to reduce current year expenditures and maximize budget and cash carryforward for future year expenditures General Fund revenues increased $3.6 million as a result of the rollover by the state of fiscal year 2009 equalization payments to fiscal year 2010. General Fund expenditures decreased $5.5 million. This was a result of staffing and budget reductions. The Classroom Site Fund had $2.3 million revenue consisting primarily of state grants and expenditures of $1.9 million. The Classroom Site Fund’s fund balance increased $357,728 to a deficit of $1.0 million at current fiscal year end. The District expects to eliminate this deficit through substantially reducing the amount paid to each instructor. The Debt Service Fund had $3.1 million in revenue consisting primarily of property taxes and expenditures consisting of current year debt payments of $3.3 million. The Debt Service Fund’s fund balance decreased $112,793 to $83,803 at current fiscal year end. The Unrestricted Capital Outlay Fund had $3.1 million in revenue consisting primarily of state funding and expenditures of $1.5 million. The Unrestricted Capital Outlay Fund’s fund balance increased $1.6 million to $2.7 at current fiscal year end due to the transfer of an additional $1.1 million in budget capacity from the Maintenance and Operation Fund (M&O) to the Unrestricted Capital Outlay Fund. This reduced the M&O Fund carryover to 4% of the Revenue Control Limit, the maximum permitted by statute. Proprietary funds. Unrestricted net assets of the Internal Service Funds at the end of the fiscal year amounted to $305,496. Operating expenses exceeded operating revenues by $106,541. BUDGETARY HIGHLIGHTS Over the course of the year, the District revised the General Fund annual expenditure budget due to unanticipated lower costs associated with restructuring staffing in different areas and energy cost savings. The difference between the original budget and the final amended budget was a $615,290 decrease, or one percent.
YUMA ELEMENTARY SCHOOL DISTRICT NO. 1 MANAGEMENT’S DISCUSSION AND ANALYSIS (MD&A)
YEAR ENDED JUNE 30, 2010
Page 13
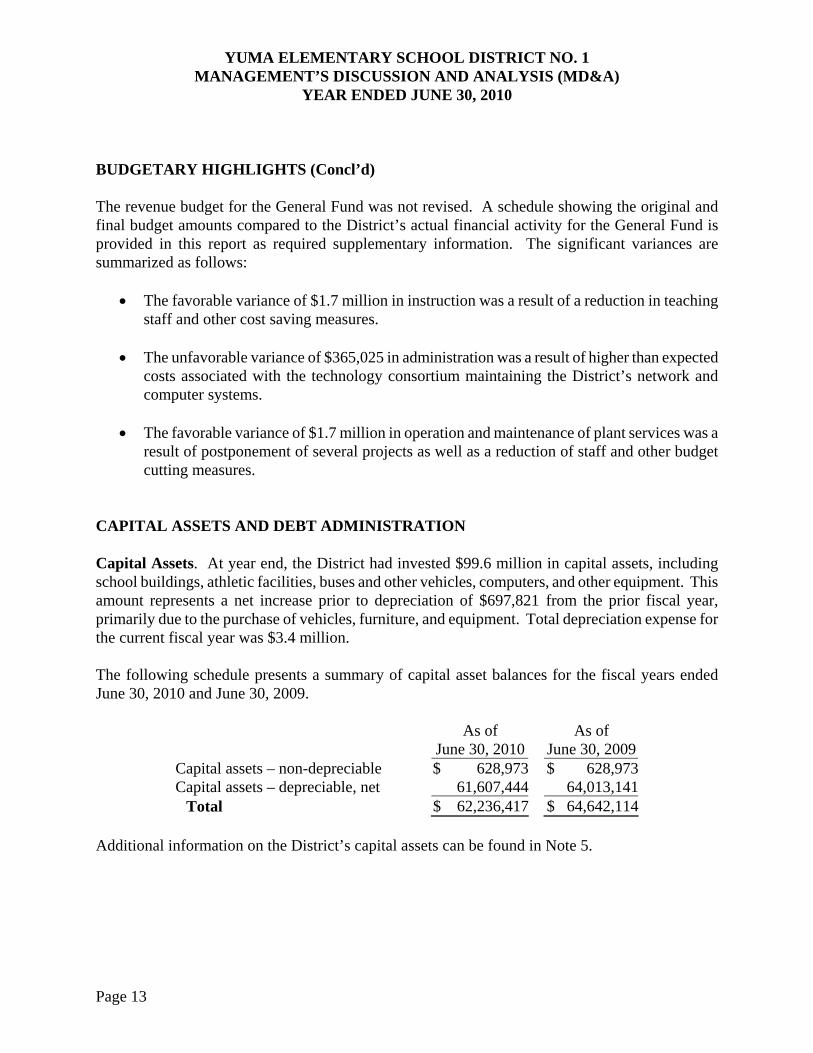
BUDGETARY HIGHLIGHTS (Concl’d) The revenue budget for the General Fund was not revised. A schedule showing the original and final budget amounts compared to the District’s actual financial activity for the General Fund is provided in this report as required supplementary information. The significant variances are summarized as follows:
The favorable variance of $1.7 million in instruction was a result of a reduction in teaching staff and other cost saving measures.
The unfavorable variance of $365,025 in administration was a result of higher than expected
costs associated with the technology consortium maintaining the District’s network and computer systems.
The favorable variance of $1.7 million in operation and maintenance of plant services was a
result of postponement of several projects as well as a reduction of staff and other budget cutting measures.
CAPITAL ASSETS AND DEBT ADMINISTRATION Capital Assets. At year end, the District had invested $99.6 million in capital assets, including school buildings, athletic facilities, buses and other vehicles, computers, and other equipment. This amount represents a net increase prior to depreciation of $697,821 from the prior fiscal year, primarily due to the purchase of vehicles, furniture, and equipment. Total depreciation expense for the current fiscal year was $3.4 million. The following schedule presents a summary of capital asset balances for the fiscal years ended June 30, 2010 and June 30, 2009.
As of
June 30, 2010As of
June 30, 2009 Capital assets – non-depreciable $ 628,973 $ 628,973 Capital assets – depreciable, net 61,607,444 64,013,141
Total $ 62,236,417 $ 64,642,114 Additional information on the District’s capital assets can be found in Note 5.

YUMA ELEMENTARY SCHOOL DISTRICT NO. 1 MANAGEMENT’S DISCUSSION AND ANALYSIS (MD&A)
YEAR ENDED JUNE 30, 2010
Page 14
CAPITAL ASSETS AND DEBT ADMINISTRATION (Concl’d) Debt Administration. At year end, the District had $14.0 million in long-term debt outstanding, $2.9 million due within one year. This represents a net decrease of $2.8 million. The District’s general obligation bonds are subject to two limits; the Constitutional debt limit (total debt limit) on all general obligation bonds (up to 15 percent of the total secondary assessed valuation) and the statutory debt limit on Class B bonds (the greater of 5 percent of the total secondary assessed valuation or $1,500 per student). The current total debt limitation for the District is $146.0 million which is more than the District’s total outstanding general obligation. The Class B debt limit is $49.0 million. The District does not have any Class B debt. Additional information on the District’s long-term debt can be found in Notes 6 through 8. ECONOMIC FACTORS AND NEXT YEAR’S BUDGET AND RATES Many factors were considered by the District’s administration during the process of developing the fiscal year 2010-11 budget. Among them:
Fiscal year 2009-10 budget balance carry forward (estimated $1,850,000). Decline in average daily membership. Estimated 5 percent budget reduction due to the State of Arizona’s deficit.
Also considered in the development of the budget is the local economy and inflation of the surrounding area. Budgeted expenditures in the General Fund decreased one percent to $45.5 million in fiscal year 2010-11. State aid and property taxes are expected to be the primary funding sources. No new programs were added to the 2010-11 budget. CONTACTING THE DISTRICT’S FINANCIAL MANAGEMENT This financial report is designed to provide our citizens, taxpayers, and investors and creditors with a general overview of the District’s finances and to demonstrate the District’s accountability for the resources it receives. If you have questions about this report or need additional information, contact the Business and Finance Department, Yuma Elementary School District No. 1, 450 West Sixth Street, Yuma, Arizona 85364-2973.

Page 15
BASIC FINANCIAL STATEMENTS

Page 16
(This page intentionally left blank)

Page 17
GOVERNMENT-WIDE FINANCIAL STATEMENTS

YUMA ELEMENTARY SCHOOL DISTRICT NO. 1STATEMENT OF NET ASSETS
JUNE 30, 2010
Governmental Activities
ASSETSCurrent assets: Cash and investments Property taxes receivable Accounts receivable Interest receivable Due from governmental entities Inventory, at cost Total current assets
Noncurrent assets: Deferred charges Land Land improvements Buildings and improvements Vehicles, furniture and equipment Accumulated depreciation Total noncurrent assets Total assets
LIABILITIESCurrent liabilities: Overdraft of cash on deposit Accounts payable Compensated absences payable Accrued interest payable Unearned revenues Obligations under capital leases Bonds payable Total current liabilities
Noncurrent liabilities: Non-current portion of long-term obligations Total non-current liabilities Total liabilities
NET ASSETSInvested in capital assets, net of related debtRestricted for: Debt service Capital outlayUnrestricted Total net assets
$ 8,639,041 2,495,728
188,547 11,967
10,524,175 548,072
22,407,530
64,858 628,973
2,687,171 79,166,138 17,144,181
(37,390,046)62,301,275 84,708,805
7,185,040 967,865 312,185 322,059 156,911 302,401
2,605,713 11,852,174
11,639,864 11,639,864 23,492,038
48,272,831
281,320 3,846,327 8,816,289
$ 61,216,767
The notes to the financial statements are an integral part of this statement.
Page 18

YUMA ELEMENTARY SCHOOL DISTRICT NO. 1STATEMENT OF ACTIVITIESYEAR ENDED JUNE 30, 2010
Program Revenues
Net (Expense)Revenue
and Changesin Net Assets
Functions/Programs ExpensesCharges for
Services
Operating Grants and
Contributions
Capital Grants and
ContributionsGovernmental
ActivitiesGovernmental activities: Instruction Support services - students and staff Support services - administration Operation and maintenance of plant services Student transportation services Operation of non-instructional services Interest on long-term debt Total governmental activities
$ 35,226,598 $ 352,021 $ 6,544,641 $ 658,563 $ (27,671,373)7,435,370 3,976,688 (3,458,682)6,626,303 623,643 (6,002,660)7,324,094 47,528 25,923 (7,250,643)4,425,531 92,982 (4,332,549)4,781,711 724,204 4,443,278 385,771
697,491 (697,491) $ 66,517,098 $ 1,123,753 $ 15,707,155 $ 658,563 (49,027,627)
General revenues: Taxes: Property taxes, levied for general purposes Property taxes, levied for debt service Property taxes, levied for capital outlay Investment income Unrestricted county aid Unrestricted state aid Unrestricted federal aid Total general revenues
Changes in net assets
Net assets, beginning of year
Net assets, end of year
9,806,589 3,219,114
727,824 80,926
984,150 38,203,111
3,729,033 56,750,747
7,723,120
53,493,647
$ 61,216,767
The notes to the financial statements are an integral part of this statement.
Page 19

Page 20
(This page intentionally left blank)

Page 21
FUND FINANCIAL STATEMENTS

YUMA ELEMENTARY SCHOOL DISTRICT NO. 1BALANCE SHEET - GOVERNMENTAL FUNDS
JUNE 30, 2010
General Classroom Site Debt ServiceASSETSCash and investmentsProperty taxes receivableAccounts receivableInterest receivableDue from governmental entitiesInventory, at cost Total assets
LIABILITIES AND FUND BALANCESLiabilities: Overdraft of cash on deposit Accounts payable Deferred revenues Bonds payable Bond interest payable Total liabilities
Fund balances (deficits): Reserved for inventory Unreserved: Undesignated Unreserved reported in: Special revenue funds Capital projects funds Total fund balances
Total liabilities and fund balances
$ $ $ 2,691,636 1,844,933 517,456
11,967
8,011,805 562,354 257,070
$ 10,125,775 $ 562,354 $ 3,209,092
$ 4,520,910 $ 1,597,421 $ 646,334 9,206 808,492 197,517
2,605,713 322,059
5,975,736 1,606,627 3,125,289
257,070
3,892,969 (1,044,273) 83,803
4,150,039 (1,044,273) 83,803
$ 10,125,775 $ 562,354 $ 3,209,092
The notes to the financial statements are an integral part of this statement.
Page 22

Unrestricted Capital Outlay
Non-Major Governmental
Funds
Total Governmental
Funds
$ 2,167,588 $ 3,769,939 $ 8,629,163 119,758 13,581 2,495,728
149,999 149,999 11,967
509,731 1,302,272 10,386,162 33,932 291,002
$ 2,797,077 $ 5,269,723 $ 21,964,021
$ $ 970,586 $ 7,088,917 20,569 249,866 925,975 44,407 204,003 1,254,419
2,605,713 322,059
64,976 1,424,455 12,197,083
33,932 291,002
2,732,101 5,664,600
2,747,226 2,747,226 1,064,110 1,064,110
2,732,101 3,845,268 9,766,938
$ 2,797,077 $ 5,269,723 $ 21,964,021
Page 23

Page 24
(This page intentionally left blank)

Total governmental fund balances 9,766,938$
Amounts reported for governmental activities in the Statement of Net Assets are different because:
Capital assets used in governmental activities are not financialresources and, therefore, are not reported in the funds.
Governmental capital assets 99,626,463$ Less accumulated depreciation (37,390,046) 62,236,417
Some revenues will not be available to pay for current periodexpenditures and, therefore, are deferred in the funds.
Property taxes 973,395Intergovernmental 124,113 1,097,508
Deferred items related to the net cost of issuance of bondsare amortized over the life of the associated bond issue in the government-wide statements but not reported in the funds. 64,858
The Internal Service Funds are used by management to account forservices provided to other governmental entities and District funds. The assetsand liabilities of the Internal Service Fund are included in the Statement of Net Assets. 305,496
Long-term liabilities are not due and payable in the currentperiod and, therefore, are not reported in the funds.
Other post-employment healthcare benefits payable (413,021)Compensated absences payable (483,556)Obligations under capital leases (302,873)Bonds payable (11,055,000) (12,254,450)
Net assets of governmental activities 61,216,767$
YUMA ELEMENTARY SCHOOL DISTRICT NO. 1RECONCILIATION OF THE BALANCE SHEET - GOVERNMENTAL FUNDS
TO THE STATEMENT OF NET ASSETSJUNE 30, 2010
Page 25
The notes to the financial statements are an integral part of this statement.

YUMA ELEMENTARY SCHOOL DISTRICT NO. 1STATEMENT OF REVENUES, EXPENDITURES AND CHANGES IN FUND BALANCES -
GOVERNMENTAL FUNDSYEAR ENDED JUNE 30, 2010
General Classroom Site Debt ServiceRevenues: Other local Property taxes State aid and grants Federal aid, grants and reimbursements Total revenues
Expenditures: Current - Instruction Support services - students and staff Support services - administration Operation and maintenance of plant services Student transportation services Operation of non-instructional services Capital outlay Debt service - Interest and fiscal charges Principal retirement Total expenditures
Excess (deficiency) of revenues over expenditures
Other financing sources (uses): Transfer in Transfer out Total other financing sources (uses)
Changes in fund balances
Fund balances (deficits), beginning of year, as restated
(Decrease) in reserve for inventory
Fund balances (deficits), end of year
$ 1,031,443 $ 3,992 $ 20,805 9,446,575 3,117,085
34,603,929 2,291,441 3,729,033
48,810,980 2,295,433 3,137,890
23,868,519 1,851,556 2,477,633 40,920 5,679,553 45,229 6,973,607 3,644,191
178,248
644,970 2,605,713
42,821,751 1,937,705 3,250,683
5,989,229 357,728 (112,793)
5,989,229 357,728 (112,793)
(1,749,610) (1,402,001) 196,596
(89,580)
$ 4,150,039 $ (1,044,273) $ 83,803
The notes to the financial statements are an integral part of this statement.
Page 26

Unrestricted Capital Outlay
Non-Major Governmental
Funds
Total Governmental
Funds
$ 75,391 $ 1,469,286 $ 2,600,917 614,118 94,244 13,272,022
2,372,138 1,467,079 40,734,587 15,727,313 19,456,346
3,061,647 18,757,922 76,063,872
5,961,957 31,682,032 4,800,046 7,318,599 752,388 6,477,170 275,302 7,248,909 196,767 3,840,958 4,516,901 4,695,149
1,038,101 802,789 1,840,890
38,109 683,079 414,781 3,020,494
1,490,991 17,306,150 66,807,280
1,570,656 1,451,772 9,256,592
610,756 610,756 (610,756) (610,756)
1,570,656 1,451,772 9,256,592
1,161,445 2,433,575 640,005
(40,079) (129,659)
$ 2,732,101 $ 3,845,268 $ 9,766,938
Page 27

Net changes in fund balances - total governmental funds 9,126,933$
Amounts reported for governmental activities in the Statement of Activities are different because:
Governmental funds report the portion of capital outlay for capitalized assets as expenditures. However, in the Statement of Activities, the costs of those assets are allocated over theirestimated useful lives as depreciation expense.
Expenditures for capitalized assets 1,092,884$ Less current year depreciation (3,393,232) (2,300,348)
Some revenues in the Statement of Activities that do not provide current financialresources are not reported as revenues in the funds.
Property taxes 481,505Intergovernmental (2,263,776) (1,782,271)
Repayments of long-term debt principal are expenditures in the governmental funds, but the repayment reduces long-term liabilities in the Statement ofNet Assets.
Capital lease principal retirement 414,781 Bond principal retirement 2,605,713 3,020,494
Some expenses reported in the Statement of Activities do not require the use ofcurrent financial resources and, therefore, are not reported as expenditures in governmental funds.
Other post-employment healthcare benefits (201,098) Deferred charges on issuance of debt (14,412)Loss on disposal of capital assets (105,349)Compensated absences 85,712 (235,147)
Internal Service Funds are used by management to account for services provided to other governmental entities and District funds.The changes in net assets of the Internal Service Funds is reported with governmental activities in the Statement of Activities. (106,541)
Change in net assets in governmental activities 7,723,120$
YUMA ELEMENTARY SCHOOL DISTRICT NO. 1RECONCILIATION OF THE STATEMENT OF REVENUES, EXPENDITURES AND CHANGES
IN FUND BALANCES - GOVERNMENTAL FUNDS TO THE STATEMENT OF ACTIVITIESYEAR ENDED JUNE 30, 2010
Page 28
The notes to the financial statements are an integral part of this statement.

YUMA ELEMENTARY SCHOOL DISTRICT NO. 1STATEMENT OF NET ASSETS
PROPRIETARY FUNDSJUNE 30, 2010
Governmental Activities:
Internal Service Funds
ASSETSCurrent assets: Cash and investments Accounts receivable Due from governmental entities Inventory, at cost Total assets
LIABILITIESCurrent liabilities: Overdraft of cash on deposit Accounts payable Total liabilities
NET ASSETSUnrestricted Total net assets
$ 9,878 38,548
138,013 257,070 443,509
96,123 41,890
138,013
305,496 $ 305,496
The notes to the financial statements are an integral part of this statement.
Page 29

YUMA ELEMENTARY SCHOOL DISTRICT NO. 1STATEMENT OF REVENUES, EXPENSES, AND CHANGES IN FUND NET ASSETS
PROPRIETARY FUNDSFOR THE YEAR ENDED JUNE 30, 2010
Governmental Activities:
Internal Service Funds
Operating revenues: Charges for services Total operating revenues
Operating expenses: Cost of services Total operating expenses
Changes in net assets
Total net assets, beginning of year
Total net assets, end of year
$ 8,487,420 8,487,420
8,593,961 8,593,961
(106,541)
412,037
$ 305,496
The notes to the financial statements are an integral part of this statement.
Page 30

YUMA ELEMENTARY SCHOOL DISTRICT NO. 1STATEMENT OF CASH FLOWS - PROPRIETARY FUNDS
FOR THE YEAR ENDED JUNE 30, 2010
GovernmentalActivities: Internal
Service FundIncrease in Cash and Cash Equivalents
Cash flows from operating activities:Cash received for services $ 8,606,075Cash payments to employees for services (6,348,303)Cash payments to suppliers for goods and services (2,223,285)
Net cash provided by operating activities 34,487
Cash flows from noncapital financing activities:Interfund borrowing (24,609)
Net cash used for noncapital financing activities (24,609)
Net increase in cash and cash equivalents 9,878
Cash and cash equivalents, beginning of year
Cash and cash equivalents, end of year $ 9,878
Reconciliation of Operating Income to Net Cash Used for Operating Activities.
Operating loss $ (106,541)Adjustments to reconcile operating loss to net cash used for operating activities:
Depreciation expense
Changes in assets and liabilities:Decrease in accounts receivable 5,369Decrease in due from governmental entities 153,204Decrease in inventory 89,580Decrease in accounts payable (63,208)Decrease in unearned revenue (43,917)
Total adjustments 141,028
Net cash provided by operating activities $ 34,487
Page 31The notes to the financial statements are an integral part of this statement.

YUMA ELEMENTARY SCHOOL DISTRICT NO. 1STATEMENT OF FIDUCIARY ASSETS AND LIABILITIES
JUNE 30, 2010
AgencyASSETSCash and investments Total assets
LIABILITIESDeposits held for othersDue to student groups Total liabilities
$ 807,308 $ 807,308
685,543 121,765
$ 807,308
The notes to the financial statements are an integral part of this statement.
Page 32

YUMA ELEMENTARY SCHOOL DISTRICT NO. 1 NOTES TO FINANCIAL STATEMENTS
JUNE 30, 2010
Page 33
NOTE 1 – SUMMARY OF SIGNIFICANT ACCOUNTING POLICIES
The financial statements of the Yuma Elementary School District No. 1 (District) have been prepared in conformity with accounting principles generally accepted in the United States of America as applied to government units. The Governmental Accounting Standards Board (GASB) is the accepted standard-setting body for establishing governmental accounting and financial reporting principles. The more significant of the District’s accounting policies are described below.
A. Reporting Entity
The Governing Board is organized under Section 15-321 of the Arizona Revised Statutes (A.R.S.). Management of the District is independent of other state or local governments. The County Treasurer collects taxes for the District, but exercises no control over its expenditures/expenses.
The membership of the Governing Board consists of five members elected by the public. Under existing statutes, the Governing Board’s duties and powers include, but are not limited to, the acquisition, maintenance and disposition of school property; the development and adoption of a school program; and the establishment, organization and operation of schools.
The Board also has broad financial responsibilities, including the approval of the annual budget, and the establishment of a system of accounting and budgetary controls.
The financial reporting entity consists of a primary government and its component units. A component unit is a legally separate entity that must be included in the reporting entity in conformity with generally accepted accounting principles. The District is a primary government because it is a special-purpose government that has a separately elected governing body, is legally separate, and is fiscally independent of other state or local governments. Furthermore, there are no component units combined with the District for financial statement presentation purposes and the District is not included in any other governmental reporting entity. Consequently, the District’s financial statements include only the financial activity of the organizational entities for which its elected governing board is financially accountable. The District’s major operations include education, student transportation, construction and maintenance of District facilities, and food services. B. Government-Wide and Fund Financial Statements
The government-wide financial statements (i.e., the statement of net assets and the statement of activities) present financial information about the District as a whole. The reported information includes all of the nonfiduciary activities of the District. For the most part, the effect of internal activity has been removed from these statements. These statements are to distinguish between the governmental and business-type activities of the District. Governmental activities normally are supported by taxes and intergovernmental revenues, and are reported separately from business-type activities, which rely to a significant extent on fees and charges for support. The District does not have any business-type activities.

YUMA ELEMENTARY SCHOOL DISTRICT NO. 1 NOTES TO FINANCIAL STATEMENTS
JUNE 30, 2010
Page 34
NOTE 1 – SUMMARY OF SIGNIFICANT ACCOUNTING POLICIES (Cont’d)
The statement of activities demonstrates the degree to which the direct expenses of a given function or segment are offset by program revenues. Direct expenses are those that are clearly identifiable with a specific function or segment. Program revenues include 1) charges to customers or applicants who purchase, use, or directly benefit from goods, services, or privileges provided by a given function or segment and 2) grants and contributions that are restricted to meeting the operational or capital requirements of a particular function or segment. Taxes, unrestricted Federal, State and County aid, and other items not included among program revenues are reported instead as general revenues.
Separate financial statements are provided for governmental funds, proprietary funds, and fiduciary funds, even though the latter are excluded from the government-wide financial statements. Major individual governmental funds are reported as separate columns in the fund financial statements.
C. Measurement Focus, Basis of Accounting, and Financial Statement Presentation
Government-Wide Financial Statements – The government-wide financial statements are reported using the economic resources measurement focus and the accrual basis of accounting. Revenues are recorded when earned and expenses are recorded when a liability is incurred, regardless of the timing of related cash flows. Property taxes are recognized as revenues in the year for which they are levied. Grants and similar items are recognized as revenue as soon as all eligibility requirements imposed by the grantor or provider have been met. As a general rule, the effect of internal activity has been eliminated from the government-wide financial statements; however, the effects of interfund services provided and used between functions are reported as expenses and program revenues at amounts approximating their external exchange value.
Fund Financial Statements – Governmental fund financial statements are reported using the current financial resources measurement focus and the modified accrual basis of accounting. Revenues are recognized as soon as they are both measurable and available. Revenues are considered to be available when they are collectible within the current period or soon enough thereafter to pay liabilities of the current period. For this purpose, the District considers revenues to be available if they are collected within 60 days of the end of the current fiscal period. Expenditures generally are recorded when a liability is incurred, as under accrual accounting. However, debt service resources are provided during the current year for payment of long-term debt principal and interest due early in the following year (not to exceed one month) and, therefore, the expenditures and related liabilities have been recognized. Compensated absences are recorded only when payment is due.

YUMA ELEMENTARY SCHOOL DISTRICT NO. 1 NOTES TO FINANCIAL STATEMENTS
JUNE 30, 2010
Page 35
NOTE 1 – SUMMARY OF SIGNIFICANT ACCOUNTING POLICIES (Cont’d) Property taxes, Federal, State and County aid, tuition and investment income associated with the current fiscal period are all considered to be susceptible to accrual and have been recognized as revenues of the current fiscal period. Food services and miscellaneous revenues are not susceptible to accrual because generally they are not measurable until received in cash. Grants and similar awards are recognized as revenue as soon as all eligibility requirements imposed by the grantor or provider have been met. Deferred revenues also when resources are received by the District before it has legal claim to them, as when grant monies are received prior to meeting all eligibility requirements imposed by the provider. Delinquent property taxes and other receivables that will not be collected within the available period have been reported as deferred revenue on the governmental fund financial statements. When both restricted and unrestricted resources are available for use, it is the District’s policy to use restricted resources first, then unrestricted resources as they are needed.
The focus of governmental fund financial statements is on major funds rather than reporting funds by type. Each major fund is presented in a separate column. The internal service funds are presented in a single column on the face of the proprietary fund statements. Non-major funds are aggregated and presented in a single column. Fiduciary funds are reported by fund type. The District reports the following major governmental funds:
General Fund – The General Fund is the District’s primary operating fund. It accounts for all resources used to finance District maintenance and operations except those required to be accounted for in other funds. It is described as the Maintenance and Operation Fund by A.R.S. Classroom Site Fund – The Classroom Site Fund accounts for the financial activity for the portion of state sales tax collections and permanent state school fund earnings as approved by the voters in 2000. Unrestricted Capital Outlay Fund – The Unrestricted Capital Outlay Fund accounts for transactions relating to the acquisition of capital items. Debt Service Fund – The Debt Service Fund accounts for the accumulation of resources for, and the payment of, long-term debt principal, interest and related costs.
YUMA ELEMENTARY SCHOOL DISTRICT NO. 1 NOTES TO FINANCIAL STATEMENTS
JUNE 30, 2010
Page 36
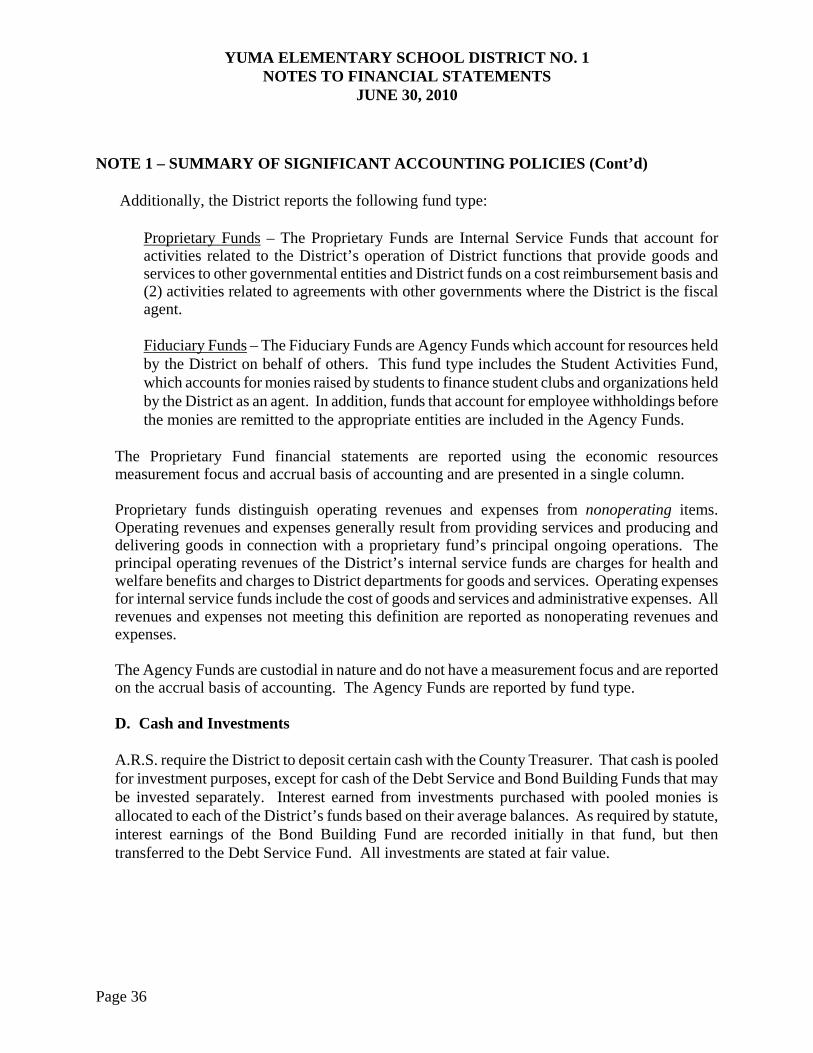
NOTE 1 – SUMMARY OF SIGNIFICANT ACCOUNTING POLICIES (Cont’d) Additionally, the District reports the following fund type:
Proprietary Funds – The Proprietary Funds are Internal Service Funds that account for activities related to the District’s operation of District functions that provide goods and services to other governmental entities and District funds on a cost reimbursement basis and (2) activities related to agreements with other governments where the District is the fiscal agent. Fiduciary Funds – The Fiduciary Funds are Agency Funds which account for resources held by the District on behalf of others. This fund type includes the Student Activities Fund, which accounts for monies raised by students to finance student clubs and organizations held by the District as an agent. In addition, funds that account for employee withholdings before the monies are remitted to the appropriate entities are included in the Agency Funds.
The Proprietary Fund financial statements are reported using the economic resources measurement focus and accrual basis of accounting and are presented in a single column. Proprietary funds distinguish operating revenues and expenses from nonoperating items. Operating revenues and expenses generally result from providing services and producing and delivering goods in connection with a proprietary fund’s principal ongoing operations. The principal operating revenues of the District’s internal service funds are charges for health and welfare benefits and charges to District departments for goods and services. Operating expenses for internal service funds include the cost of goods and services and administrative expenses. All revenues and expenses not meeting this definition are reported as nonoperating revenues and expenses. The Agency Funds are custodial in nature and do not have a measurement focus and are reported on the accrual basis of accounting. The Agency Funds are reported by fund type. D. Cash and Investments
A.R.S. require the District to deposit certain cash with the County Treasurer. That cash is pooled for investment purposes, except for cash of the Debt Service and Bond Building Funds that may be invested separately. Interest earned from investments purchased with pooled monies is allocated to each of the District’s funds based on their average balances. As required by statute, interest earnings of the Bond Building Fund are recorded initially in that fund, but then transferred to the Debt Service Fund. All investments are stated at fair value.

YUMA ELEMENTARY SCHOOL DISTRICT NO. 1 NOTES TO FINANCIAL STATEMENTS
JUNE 30, 2010
Page 37
NOTE 1 – SUMMARY OF SIGNIFICANT ACCOUNTING POLICIES (Cont’d) E. Investment Income
Investment income is composed of interest, dividends, and net changes in the fair value of applicable investments. Investment income is included in other local revenues in the fund financial statements and in nonoperating revenues in the proprietary fund financial statements.
F. Receivables and Payables Activity between funds that is representative of lending/borrowing arrangements outstanding at the end of the fiscal year is referred to as either “due to/from other funds” (i.e., the current portion of interfund loans) or “advances to/from other funds” (i.e., the non-current portion of interfund loans). All other outstanding balances between funds are reported as “due to/from other funds.”
All receivables, including property taxes receivable, are shown net of an allowance for uncollectibles. Property tax levies are obtained by applying tax rates against either the primary assessed valuation or the secondary assessed valuation. Primary and secondary valuation categories are composed of the exact same properties. However, the primary category limits the increase in property values to 10% from the previous year, while there is no limit to the increase in property values for secondary valuation. Override and debt service tax rates are applied to the secondary assessed valuation and all other tax rates are applied to the primary assessed valuation.
The County levies real property taxes on or before the third Monday in August, which become due and payable in two equal installments. The first installment is due on the first day of October and becomes delinquent after the first business day of November. The second installment is due on the first day of March of the next year and becomes delinquent after the first business day of May. The billings are considered past due after these dates, at which time the applicable property is subject to penalties and interest.
The County also levies various personal property taxes during the year, which are due the second Monday of the month following receipt of the tax notice, and become delinquent 30 days thereafter. Pursuant to A.R.S., a lien against assessed real and personal property attaches on the first day of January preceding assessment and levy; however according to case law, an enforceable legal claim to the asset does not arise.

YUMA ELEMENTARY SCHOOL DISTRICT NO. 1 NOTES TO FINANCIAL STATEMENTS
JUNE 30, 2010
Page 38
NOTE 1 – SUMMARY OF SIGNIFICANT ACCOUNTING POLICIES (Cont’d) G. Inventory All inventories are valued at cost using the first-in/first-out (FIFO) cost method. Inventories consist of expendable supplies held for consumption. Inventories are recorded as expenses when consumed in the government-wide financial statements and as expenditures when purchased in the fund financial statements. The United States Department of Agriculture (USDA) commodity portion of the food services inventory consists of food donated by the USDA. It is valued at estimated market prices paid by the USDA.
H. Prepaid Items
Certain payments to vendors reflect costs applicable to future accounting periods and are recorded as prepaid items in both the government-wide and fund financial statements. Prepaid items are recorded as expenses when consumed in the government-wide financial statements. Prepaid items are recorded as expenditures when purchased in the fund financial statements and are offset by a reserve of fund balance.
Prepaid items at year end were immaterial and therefore not included on the fund or government-wide financial statements. I. Capital Assets
Capital assets, which include land and improvements; buildings and improvements; vehicles, furniture, and equipment; and construction in progress, are reported in the government-wide financial statements.
Capital assets are defined by the District as assets with an initial, individual cost in excess of $5,000 and an estimated useful life of more than one year. Such assets are recorded at historical cost, or estimated historical cost if purchased or constructed. Donated capital assets are recorded at the estimated fair market value at the date of donation. The costs of normal maintenance and repairs that do not add to the value of the asset or materially extend the life of the asset are not capitalized.
Capital assets are depreciated using the straight line method over the following estimated useful lives:
Land improvements 20 - 50 years Buildings and improvements 10 - 60 years Vehicles, furniture and equipment 5 - 25 years

YUMA ELEMENTARY SCHOOL DISTRICT NO. 1 NOTES TO FINANCIAL STATEMENTS
JUNE 30, 2010
Page 39
NOTE 1 – SUMMARY OF SIGNIFICANT ACCOUNTING POLICIES (Cont’d) J. Compensated Absences
The District’s employee vacation and sick leave policies generally provide for granting vacation and sick leave with pay. Vacation leave vests with employees at the employees’ regular rate of pay. Sick leave benefits vest with employees who have attained the age of fifty, completed ten consecutive years of service, and accumulated 80 points under provisions of the Arizona State Retirement System (ASRS), at the rate of $37.50 per day. The current and long-term liabilities, including related benefits, for accumulated vacation and sick leave are reported on the government-wide financial statements. A liability for these amounts is reported in governmental funds only if they have matured, for example, as a result of employee leave, resignations and retirements. Generally, resources from the General Fund are used to pay for compensated absences.
K. Long-term Obligations
In the government-wide financial statements and in the fund financial statements, proprietary fund types in the fund financial statements, long-term debt and other long-term obligations are reported as liabilities on the statement of net assets. Bond premiums and discounts, as well as issuance costs and the difference between the requisition price and the net carrying amount of the old debt, are deferred and amortized over the life of the bonds using the straight line method over the term of the related debt. In the fund financial statements, governmental fund types recognize bond premiums and discounts, as well as bond issuance costs, during the current period. The face amount of debt issued is reported as other financing sources. Premiums received on debt issuances are reported as other financing sources while discounts on debt issuances are reported as other financing uses. Issuance costs, whether or not withheld from the actual debt proceeds received, are reported as debt service expenditures.
L. Fund Equity
In the fund financial statements, governmental funds report reservations of fund balance for amounts that are not available for expenditures or are legally restricted by outside parties for use for a specific purpose.

YUMA ELEMENTARY SCHOOL DISTRICT NO. 1 NOTES TO FINANCIAL STATEMENTS
JUNE 30, 2010
Page 40
NOTE 1 – SUMMARY OF SIGNIFICANT ACCOUNTING POLICIES (Concl’d) M. Interfund Activity Flows of cash from one fund to another without a requirement for repayment are reported as interfund transfers. Interfund transfers between governmental funds are eliminated in the Statement of Activities. Interfund transfers in the fund financial statements are reported as other financing sources/uses in governmental funds and after nonoperating revenues/expenses in proprietary funds. N. Estimates The preparation of the financial statements in conformity with accounting principles generally accepted in the United States of America requires management to make estimates and assumptions that affect the amounts reported in the financial statements and accompanying notes. Actual results may differ from those estimates.
NOTE 2 – STEWARDSHIP, COMPLIANCE AND ACCOUNTABILITY
Individual Deficit Fund Balance – At year end, the Classroom Site Fund, a major governmental fund, reported a deficit in fund balance of $1,044,273. The deficit arose during the year and prior years as a result of the funding of salary commitments based on State established budget limits rather than available cash. The District plans reduce spending in future years to eliminate the deficit. Excess Expenditures Over Budget – At year end, the District had expenditures in funds that exceeded the budgets, however, this does not constitute a violation of any legal provisions.
NOTE 3 – CASH AND INVESTMENTS A.R.S. authorize the District to invest public monies in the State Treasurer’s local government investment pools, the County Treasurer’s investment pool, obligations of the U.S. Government and its agencies, obligations of the State and certain local government subdivisions, interest-bearing savings accounts and certificates of deposit, collateralized repurchase agreements, certain obligations of U.S. corporations, and certain other securities. The statutes do not include any requirements for credit risk, custodial credit risk, concentration of credit risk, interest rate risk, or foreign currency risk for the District’s investments.

YUMA ELEMENTARY SCHOOL DISTRICT NO. 1 NOTES TO FINANCIAL STATEMENTS
JUNE 30, 2010
Page 41
NOTE 3 – CASH AND INVESTMENTS (Concl’d) Custodial Credit Risk – Deposits. Custodial credit risk is the risk that in the event of bank failure the District’s deposits may not be returned to the District. The District does not have a deposit policy for custodial credit risk. At year end, the carrying amount of the District’s deposits was $66,246 and the bank balance was $1,174,884. At year end, all of the District’s deposits were covered by Federal depository insurance or were guaranteed under the transaction account guarantee component of the Temporary Liquidity Guarantee Program. The State Treasurer’s pools are external investment pools, the Local Government Investment Pool (Pool 5) and Local Government Investment Pool-Government (Pool 7), with no regulatory oversight. The pools are not required to register (and are not registered) with the Securities and Exchange Commission. The fair value of each participant’s position in the State Treasurer investment pools approximates the value of the participant’s shares in the pool and the participants’ shares are not identified with specific investments. No regulatory oversight is provided for the County Treasurer’s investment pool and that pool’s structure does not provide for shares. At year end, the District’s investments consisted of the following.
Average Maturities Fair Value County Treasurer’s investment pool 132 days $ 9,380,103
In addition, negative cash balances in the treasurer’s pooled accounts at year end of $7.2 million have been reported as overdraft with the County Treasurer. Interest Rate Risk. The District does not have a formal investment policy that limits investment maturities as a means of managing its exposure to fair value losses arising from increasing interest rates.
Credit Risk. The District has no investment policy that would further limit its investment choices. As of year end, the District’s investment in the County Treasurer’s investment pool did not receive a credit quality rating from a national rating agency. Custodial Credit Risk – Investments. The District’s investment in the County Treasurer’s investment pool represents a proportionate interest in the pool’s portfolio; however, the District’s portion is not identified with specific investments and is not subject to custodial credit risk.

YUMA ELEMENTARY SCHOOL DISTRICT NO. 1 NOTES TO FINANCIAL STATEMENTS
JUNE 30, 2010
Page 42
NOTE 4 – RECEIVABLES
Receivable balances, net of allowance for uncollectibles, have been disaggregated by type and presented separately in the financial statements with the exception of due from governmental entities. Due from governmental entities, net of allowance for uncollectibles, as of year end for the District’s individual major funds and non-major governmental funds in the aggregate, were as follows.
General
Fund Classroom Site Fund
Unrestricted Capital
Outlay Fund
Non-Major Governmental
and Other Funds
Due from other governmental entities: Due from Federal government $ $ $ $ 1,149,009 Due from State government 7,935,969 562,354 509,731 153,263 Due from other districts 75,836 138,013
Net due from governmental entities $8,011,805 $ 562,354 $ 509,731 $ 1,440,285
Governmental funds report deferred revenue in connection with receivables for revenues that are not considered to be available to liquidate liabilities of the current period. Governmental funds also defer revenue recognition in connection with resources that have been received, but not yet earned. At the end of the current fiscal year, the various components of deferred revenue reported in the governmental funds were as follows.
Unavailable UnearnedDelinquent property taxes receivable (General Fund) $ 725,762 $ Delinquent property taxes receivable (Debt Service Fund) 197,517 Delinquent property taxes receivable (Unrestricted Capital
Outlay Fund) 44,407 Delinquent property taxes receivable (Non-Major
Governmental Funds) 5,709Grant drawdowns prior to meeting all eligibility requirements
(Non-Major Governmental Funds) 156,911Measurable but unavailable revenues (General Fund) 82,730Measurable but unavailable revenues (Non-Major
Governmental Funds) 41,383
Total deferred revenue for governmental funds $ 1,097,508 $ 156,911

YUMA ELEMENTARY SCHOOL DISTRICT NO. 1 NOTES TO FINANCIAL STATEMENTS
JUNE 30, 2010
Page 43
NOTE 5 – CAPITAL ASSETS
A summary of capital asset activity for the current fiscal year follows.
Governmental Activities Beginning Balance Increase Decrease
Ending Balance
Capital assets, not being depreciated: Land $ 628,973 $ $ $ 628,973
Total capital assets, not being depreciated 628,973 628,973 Capital assets, being depreciated:
Land improvements 2,647,538 39,633 2,687,171 Buildings and improvements 79,119,877 156,427 110,166 79,166,138 Vehicles, furniture and equipment 16,540,249 896,824 292,892 17,144,181
Total capital assets being depreciated 98,307,664 1,092,884 403,058 98,997,490 Less accumulated depreciation for:
Land improvements (1,663,386) (68,486) (1,731,872)Buildings and improvements (24,718,585) (2,002,132) (44,722) (26,675,995)Vehicles, furniture and equipment (7,912,552) (1,322,614) (252,987) (8,982,179)
Total accumulated depreciation (34,294,523) (3,393,232) (297,709) (37,390,046)
Total capital assets, being depreciated, net 64,013,141 (2,300,348) 105,349 61,607,444 Governmental activities capital assets, net $64,642,114 $ (2,300,348) $ 105,349 $ 62,236,417
Depreciation expense was charged to governmental functions as follows.
Instruction $2,761,208 Support services – students and staff 18,173 Support services – administration 53,784 Operation and maintenance of plant services 98,448 Student transportation services 421,567 Operation of non-instructional services 40,052 Total depreciation expense – governmental activities $3,393,232

YUMA ELEMENTARY SCHOOL DISTRICT NO. 1 NOTES TO FINANCIAL STATEMENTS
JUNE 30, 2010
Page 44
NOTE 6 – OBLIGATIONS UNDER CAPITAL LEASES
The District has acquired vehicles and equipment under the provisions of long-term lease agreements classified as capital leases. These lease agreements qualify as capital leases for accounting purposes and, therefore, have been recorded at the present value of their future minimum lease payments as of the inception date. Revenues from the Unrestricted Capital Outlay Fund, a major governmental fund, are used to pay the capital lease obligations.
The assets acquired through capital leases that meet the District’s capitalization threshold are as follows.
Governmental
Activities Asset:
Vehicles and equipment $ 2,036,182 Less: Accumulated depreciation 941,792
Total $ 1,094,390
The future minimum lease obligations and the net present value of these minimum lease payments as of year end were as follows.
Year Ending June 30: Governmental
Activities 2011 $ 318,762 2012 484
Total minimum lease payments 319,246 Less: amount representing interest 16,373 Present value of minimum lease payments $ 302,873 Due within one year $ 302,401

YUMA ELEMENTARY SCHOOL DISTRICT NO. 1 NOTES TO FINANCIAL STATEMENTS
JUNE 30, 2010
Page 45
NOTE 7 – GENRAL OBLIGATIONS BONDS PAYABLE
Bonds payable at year end, consisted of the following outstanding general obligation bonds and supplemental interest certificates. The bonds are both callable and noncallable with interest payable semiannually. Property taxes from the Debt Service Fund are used to pay bonded debt.
Purpose
Original Amount Issued
Interest Rates Maturity
Outstanding Principal
June 30, 2010 Due Within One Year
Governmental activities: Refunding Bonds and Supplemental
Interest Certificates, Series 2001 $12,080,000 5.00% 7/1/10-14 $ 11,795,713 $ 740,713Refunding Bonds and Supplemental
Interest Certificates, Series 2004 5,760,000
2.875% 7/1/10 1,865,000 1,865,000 Total $ 13,660,713 $ 2,605,713
Annual debt service requirements to maturity on general obligation bonds at year end are summarized as follows.
Governmental Activities Year ending June 30: Principal Interest
2011 $ 2,605,713 $ 601,0592012 2,575,000 493,625 2013 2,725,000 361,125 2014 2,860,000 221,500 2015 3,000,000 75,000
Total $ 13,660,713 $ 1,752,309
In prior years, the District defeased certain general obligation and other bonds by placing the proceeds of new bonds in an irrevocable trust to provide for all future debt service payments on the defeased bonds. Accordingly, the trust account assets and the liability for the defeased bonds are not included in the District’s financial statements. At year end, $1,830,000 of defeased bonds are still outstanding.

YUMA ELEMENTARY SCHOOL DISTRICT NO. 1 NOTES TO FINANCIAL STATEMENTS
JUNE 30, 2010
Page 46
NOTE 8 – CHANGES IN LONG-TERM LIABILITIES
Long-term liability activity for the current fiscal year was as follows.
Beginning Balance Additions Reductions
Ending Balance
Due WithinOne Year
Governmental activities: Bonds payable $16,060,713 $ $ 2,400,000 $ 13,660,713 $ 2,605,713Obligations under capital leases 717,654 414,781 302,873 302,401 Compensated absences payable 569,268 335,409 421,121 483,556 312,185 Other post-employment
healthcare benefits payable 211,923 201,098 413,021 Governmental activity long-term
liabilities $17,559,558 $ 536,507 $ 3,235,902 $ 14,860,163 $ 3,220,299 NOTE 9 – INTERFUND RECEIVABLES, PAYABLES, AND TRANSFERS
At year end, interfund balances were as follows. Interfund transfers – Transfers of $610,756 between funds were used to move Federal grant funds restricted for indirect costs to the Indirect Costs Fund, a non-major governmental fund.
NOTE 10 – FUND RECLASSIFICATION
The July 1, 2009, fund balance of the Total Governmental Funds and net assets of the Proprietary Funds do not agree to the prior year financial statements due to the reclassification of the activity reported in the Consortium Fund in prior years to Internal Service Funds.
Governmental Funds
Total Governmental
Fund Proprietary
Funds Net Assets/Fund balance, June 30, 2009
as previously reported $ 1,052,042 $ Reclassification (412,037) 412,037 Net Assets/Fund balance, July 1, 2009, as restated $ 640,005 $ 412,037

YUMA ELEMENTARY SCHOOL DISTRICT NO. 1 NOTES TO FINANCIAL STATEMENTS
JUNE 30, 2010
Page 47
NOTE 11 – CONTINGENT LIABILITIES
Compliance – Amounts received or receivable from grantor agencies are subject to audit and adjustment by grantor agencies, principally the Federal government. Any disallowed claims, including amounts already collected, may constitute a liability of the applicable funds. The amount, if any, of expenditures/expenses that may be disallowed by the grantor cannot be determined at this time, although the District expects such amounts, if any, to be immaterial.
Lawsuits – The District is a defendant in various lawsuits. Although the outcome of these lawsuits is not presently determinable, in the opinion of the District’s counsel, the resolution of these matters will not have a material adverse effect on the financial condition of the District.
NOTE 12 – RISK MANAGEMENT
The District is exposed to various risks of loss related to torts; theft of, damage to, and destruction of assets; errors and omissions; injuries to employees; and natural disasters. The District was unable to obtain general property and liability insurance at a cost it considered to be economically justifiable. Therefore, the District joined the Arizona School Risk Retention Trust, Inc. (ASRRT). ASRRT is a public entity risk pool currently operating as a common risk management and insurance program for school districts and community colleges in the State. The District pays an annual premium to ASRRT for its general insurance coverage. The agreement provides that ASRRT will be self-sustaining through member premiums and will reinsure through commercial companies for claims in excess of specified amounts.
The District was unable to obtain insurance for workers’ health at a cost considered to be economically justifiable. Therefore, the District joined the Yuma Area Benefits Consortium, together with other entities in the area. The consortium is a public entity risk pool that accounts for the risk financing of certain benefits and losses, for its four member entities. Under this program, the Consortium produces coverage for up to a maximum of $85,000 for each employee health claim. The District pays annual premiums based on actuarial estimates of the amounts needed to pay prior and current year claims. The Consortium uses reinsurance agreements to reduce its exposure to large losses. The District continues to carry commercial insurance for workers’ compensation insurance. Settled claims resulting from these risks have not exceeded commercial insurance coverage in any of the past three fiscal years.

YUMA ELEMENTARY SCHOOL DISTRICT NO. 1 NOTES TO FINANCIAL STATEMENTS
JUNE 30, 2010
Page 48
NOTE 13 – JOINTLY GOVERNED ORGANIZATIONS
Yuma Education Consortium – The District is a participant in the Yuma Education Consortium which is a transportation services, materials management (purchasing and warehousing) services, and computer services consortium. The Yuma Education Consortium is an association of the District Governing Board, the Yuma Union High School District No. 70 Governing Board, the Yuma/La Paz Counties Community College District and the Arizona Board of Regents for Northern Arizona University. The organization was formed, through an intergovernmental agreement, to promote the efficient and maximum use of available educational and transportation resources. The governing committee of the Yuma Education Consortium consists of two representatives from each of the member organizations.
Computer Services – Yuma Union High School District No. 70 is the fiscal agent for the Yuma Educational Computer Services Consortium. The District paid the Yuma Educational Computer Services Consortium $1.25 million for computer services provided during the year.
Transportation Services – The District is the fiscal agent for the Yuma Schools Transportation Center. The District received $8.5 million from other governmental entities for transportation services provided during the year. Materials Management Services – Yuma Union High School District No. 70 is the fiscal agent for the Yuma Education Materials Management Consortium (YEMMC). The District paid YEMMC $243,000 for materials management services provided during the year.
NOTE 14 – RETIREMENT PLAN
Plan Description – The District contributes to a cost-sharing, multiple-employer defined benefit pension plan; a cost-sharing multiple employer defined benefit health care plan; and a cost-sharing, multiple-employer defined benefit long-term disability plan, all of which are administered by the Arizona State Retirement System (ASRS). The ASRS (through its Retirement Fund) provides retirement (i.e., pension), death, and survivor benefits; the Health Benefit Supplement Fund provides health insurance premium benefits (i.e., a monthly subsidy); and the Long-Term Disability Fund provides long-term disability benefits. Benefits are established by state statute. The System is governed by the Arizona State Retirement System Board according to the provisions of A.R.S. Title 38, Chapter 5, Article 2.
The System issues a comprehensive annual financial report that includes financial statements and required supplementary information. The most recent report may be obtained by writing the System, 3300 North Central Avenue, P.O. Box 33910, Phoenix, Arizona 85067-3910 or by calling (602) 240-2000 or (800) 621-3778.

YUMA ELEMENTARY SCHOOL DISTRICT NO. 1 NOTES TO FINANCIAL STATEMENTS
JUNE 30, 2010
Page 49
NOTE 14 – RETIREMENT PLAN (Concl’d)
Funding Policy – The Arizona State Legislature establishes and may amend active plan members’ and the District’s contribution rates. For the current fiscal year, active ASRS members were required by statute to contribute at the actuarially determined rate of 9.40 percent (9.00 percent for retirement and 0.40 percent for long-term disability) of the members’ annual covered payroll and the District was required by statute to contribute at the actuarially determined rate of 9.40 percent (8.34 percent for retirement, 0.66 percent for health insurance premium, and 0.40 percent for long-term disability) of the members’ annual covered payroll.
The District’s contributions for the current and two preceding years, all of which were equal to the required contributions, were as follows.
Retirement
Fund
Health Benefit
Supplement Fund
Long-Term Disability
Fund Year ending June 30:
2010 $ 1,813,609 $ 143,523 $ 86,984 2009 3,301,558 396,683 206,606 2008 3,559,048 464,224 221,059
NOTE 15 – OTHER POSTEMPLOYMENT BENEFITS
Under the provisions of Governmental Accounting Standards Board (GASB) Statement No. 45 Accounting and Financial Reporting by Employers for Postemployment Benefits Other Than Pensions from an accrual accounting perspective, the cost of postemployment healthcare benefits generally should be associated with the periods in which the cost occurs, rather than in the future year when it will be paid. As such, the District recognizes the cost of postemployment benefits in the year when the employee services are received, reports the accumulated liability from prior years and provides information useful in assessing potential demands on the District’s future cash flows. Recognition of the liability accumulated from prior years will be phased in over 30 years, commencing with the 2009 liability.

YUMA ELEMENTARY SCHOOL DISTRICT NO. 1 NOTES TO FINANCIAL STATEMENTS
JUNE 30, 2010
Page 50
NOTE 15 – OTHER POSTEMPLOYMENT BENEFITS (Cont’d) Plan Description – Under authority of the Governing Board, the District provides postretirement insurance (health and dental) benefits, for certain retirees and their dependents, in accordance with the Yuma Area Benefit Consortium Plan. The plan is a multiple-employer defined benefit plan administered by the Yuma Area Benefit Consortium. The District contributes the full cost of retiree coverage (less any ASRS subsidy) for eligible employees. Eligible retirees are those former employees retired prior to fiscal year 2004-05 and are 50 years or older with at least 10 years of service with the District. To maintain retiree eligibility, the retiree is required to perform one day of substitute service with the District each year, with pay. For former employees who retire after fiscal year 2004-05 with 10 years of consecutive years of full-time satisfactory service with the District and retire with the ASRS, to maintain retiree eligibility, the retiree is required to perform three days substitute service with the District each year, without pay. For the current fiscal year, the District contributed $1.1 million for these benefits. The District’s regular insurance providers underwrite the retiree policies. Retirees may not convert the benefit into an in-lieu payment to secure coverage under independent plans. A separate financial report is issued for the plan and can be obtained by contacting Arizona Western College; Vice President for Administrative Services; P.O. Box 929; Yuma, Arizona 85366-0929; or by calling (928) 344-7515. The number of participants as of the effective date of the biannual OPEB valuation, follows.
Participants Active employees 615 Retired employees 136
Total 751 Funding Policy – The District currently pays for postemployment benefits on a pay-as-you-go basis. Although the District is studying the establishment of a trust that would be used to accumulate and invest assets necessary to pay for the accumulated liability, these financial statements assume that pay-as-you-go funding will continue.

YUMA ELEMENTARY SCHOOL DISTRICT NO. 1 NOTES TO FINANCIAL STATEMENTS
JUNE 30, 2010
Page 51
NOTE 15 – OTHER POSTEMPLOYMENT BENEFITS (Cont’d)
Annual OPEB Cost and Net OPEB Obligation – The District’s annual OPEB cost is calculated based on the annual required contribution (ARC) of the District, an amount actuarially determined in accordance with the parameters of GASB Statement No. 45. The ARC represents a level of funding that, if paid on an ongoing basis, is projected to cover normal costs each year and amortize any unfunded actuarial liabilities (or funding excess) over a period not to exceed 30 years. The following table shows the components of the District’s annual OPEB cost for the year, the amount actually contributed to the plan, and changes in the District’s net OPEB obligation.
Annual required contribution $ 1,311,936 Interest on net OPEB obligation Adjustment to annual required contribution Annual OPEB cost (expense) 1,311,936 Contributions made (1,110,838)Increase in net OPEB obligation 201,098 Net OPEB obligation – beginning of year 211,923 Net OPEB obligation – end of year $ 413,021
The District’s annual OPEB cost, the percentage of annual OPEB cost contributed to the plan, and the net OPEB obligation for the current fiscal year and the preceding year is as follows.
Fiscal Year Ended
Annual OPEB Cost
Contributed
Percentage of Annual OPEB
Cost ContributedNet OPEB Obligation
June 30, 2010 $ 1,110,838 85% $ 413,021 June 30, 2009 1,100,013 84% 211,923
Actuarial Methods and Assumptions – Projections of benefits for financial reporting purposes are based on the substantive plan (the plan as understood by the employer and the plan members) and include the types of benefits provided at the time of each valuation and the historical pattern of sharing of benefit cost between the employer and plan members to that point. The actuarial methods and assumptions used include techniques that are designed to reduce the effects of short-term volatility in actuarial accrued liabilities and the actuarial value of assets, consistent with the long-term perspective of the calculations. Amounts determined and the funded status of the plan and the annual required contributions of the District are subject to continual revision as actual amounts are compared with past expectations and new estimates are made about the future. The more significant actuarial assumptions and methods used in the calculation of the employer contributions for the current fiscal year were as follows.

YUMA ELEMENTARY SCHOOL DISTRICT NO. 1 NOTES TO FINANCIAL STATEMENTS
JUNE 30, 2010
Page 52
NOTE 15 – OTHER POSTEMPLOYMENT BENEFITS (Concl’d)
Valuation date July 1, 2008 Actuarial cost method Projected unit cost, 30 years,
level amortization (open) Remaining amortization period 28 years as of July 1, 2010 Discount rate 5% per annum Projected salary increases N/A Health care cost trend rate:
Medical and Prescription Drug 6% graded down to an ultimate rate of 4%
ASRS subsidy increases None Inflation rate 3%
Schedule of Funding Progress – The following schedule of funding progress presents multiyear trend information about whether the actuarial value of plan assets is increasing or decreasing over time relative to the actuarial accrued liability for benefits. The District implemented GASB Statement No. 45 in the prior fiscal year; therefore, only the 2008 biannual actuarial valuation schedule is included as it is effective for two years.
Actuarial Valuation
Date
Actuarial Value of Assets
(a)
Actuarial Accrued
Liability (AAL) - [Entry Age]
(b) Unfunded AAL (UAAL) (b-a)
Funded Ratio (a/b)
Covered Payroll
(c)
UAAL as a Percentage of Covered
Payroll ((b-1)/c)
July 1, 2008 $ $ 13,712,316 $ 13,712,316 % $45,866,116 29.9%

Page 53
SCHEDULE OF REVENUES, EXPENDITURES AND CHANGES IN FUND BALANCES – BUDGET AND ACTUAL
(Required Supplementary Information)

YUMA ELEMENTARY SCHOOL DISTRICT NO. 1SCHEDULE OF REVENUES, EXPENDITURES AND
CHANGES IN FUND BALANCES - BUDGET AND ACTUAL - GENERAL FUNDYEAR ENDED JUNE 30, 2010
Budgeted Amounts
Original FinalNon-GAAP
Actual
Variance with Final Budget
Positive (Negative)
Revenues: Other local Property taxes State aid and grants Federal aid, grants and reimbursements Total revenues
Expenditures: Regular education Instruction Support services - students and staff Support services - administration
Operation and maintenance of plant services Operation of non-instructional services Total regular education
Special education Instruction Support services - students and staff
Operation and maintenance of plant services Total special education
Pupil transportation Student transportation services Total pupil transportation
Total expenditures
Change in fund balances
Fund balances (deficits), July 1, 2009
(Decrease) in reserve for inventoryIncrease in reserve for prepaid items
Fund balances, June 30, 2010
$ 1,000,000 $ 1,000,000 $ 1,031,443 $ 31,443 9,450,000 9,450,000 9,446,575 (3,425)
34,620,000 34,620,000 34,603,929 (16,071)3,732,000 3,732,000 3,729,033 (2,967)
48,802,000 48,802,000 48,810,980 8,980
22,115,944 22,475,659 20,791,133 1,684,526 885,259 952,409 887,309 65,100
6,204,476 5,314,528 5,679,553 (365,025)
7,536,577 8,686,000 6,968,829 1,717,171 16,883 170,183 178,248 (8,065)
36,759,139 37,598,779 34,505,072 3,093,707
3,435,279 3,337,118 3,307,386 29,732 1,756,376 1,628,418 1,590,324 38,094
2,731 4,500 4,778 (278)5,194,386 4,970,036 4,902,488 67,548
3,529,296 3,529,296 3,644,191 (114,895)3,529,296 3,529,296 3,644,191 (114,895)
45,482,821 46,098,111 43,051,751 3,046,360
3,319,179 2,703,889 5,759,229 3,055,340
(1,749,610) (1,749,610)
(89,580) (89,580) 230,000 230,000
$ 3,319,179 $ 2,703,889 $ 4,150,039 $ 1,446,150
See accompanying notes to this schedule.
Page 54

YUMA ELEMENTARY SCHOOL DISTRICT NO. 1SCHEDULE OF REVENUES, EXPENDITURES AND
CHANGES IN FUND BALANCES - BUDGET AND ACTUAL - CLASSROOM SITE YEAR ENDED JUNE 30, 2010
Budgeted Amounts
Original Final Actual
Variance with Final Budget
Positive (Negative)
Revenues: Other local State aid and grants Total revenues
Expenditures: Current - Instruction Support services - students and staff Support services - administration Total expenditures
Change in fund balances
Fund balances (deficits), July 1, 2009
Fund balances (deficits), June 30, 2010
$ $ $ 3,992 $ 3,992 3,270,000 3,270,000 2,291,441 (978,559)3,270,000 3,270,000 2,295,433 (974,567)
2,392,418 2,815,235 1,851,556 963,679 50,613 52,123 40,920 11,203
233,277 233,277 45,229 188,048 2,676,308 3,100,635 1,937,705 1,162,930
593,692 169,365 357,728 188,363
(1,402,001) (1,402,001)
$ 593,692 $ 169,365 $ (1,044,273) $ (1,213,638)
See accompanying notes to this schedule.
Page 55

YUMA ELEMENTARY SCHOOL DISTRICT NO. 1 NOTE TO REQUIRED SUPPLEMENTARY INFORMATION
JUNE 30, 2010
Page 56
NOTE 1 – BUDGETARY BASIS OF ACCOUNTING
The adopted budget of the District is prepared on a basis consistent with accounting principles generally accepted in the United States of America except a portion of fiscal year 2010-11 insurance payments were charged against the fiscal year 2009-10 budget. Consequently, the following adjustment was necessary to present actual expenditures and increase in reserve for prepaid items on a budgetary basis in order to provide a meaningful comparison.
Total
Expenditures
Increase in Reserve for
Prepaid Items Statement of Revenues, Expenditures and Changes
in Fund Balances – Governmental Funds $ 42,821,751 $ Fiscal year 2010-11 insurance payments charged
against fiscal year 2009-10 budget 230,000 230,000Schedule of Revenues, Expenditures and Changes in
Fund Balances – Budget and Actual – General Fund $ 43,051,751 $ 230,000

Page 57
COMBINING AND INDIVIDUAL FUND FINANCIAL STATEMENTS
AND SCHEDULES

Page 58
(This page intentionally left blank)

Page 59
OTHER MAJOR GOVERNMENTAL FUND SCHEDULE OF REVENUES, EXPENDITURES AND CHANGES IN
FUND BALANCES - BUDGET AND ACTUAL
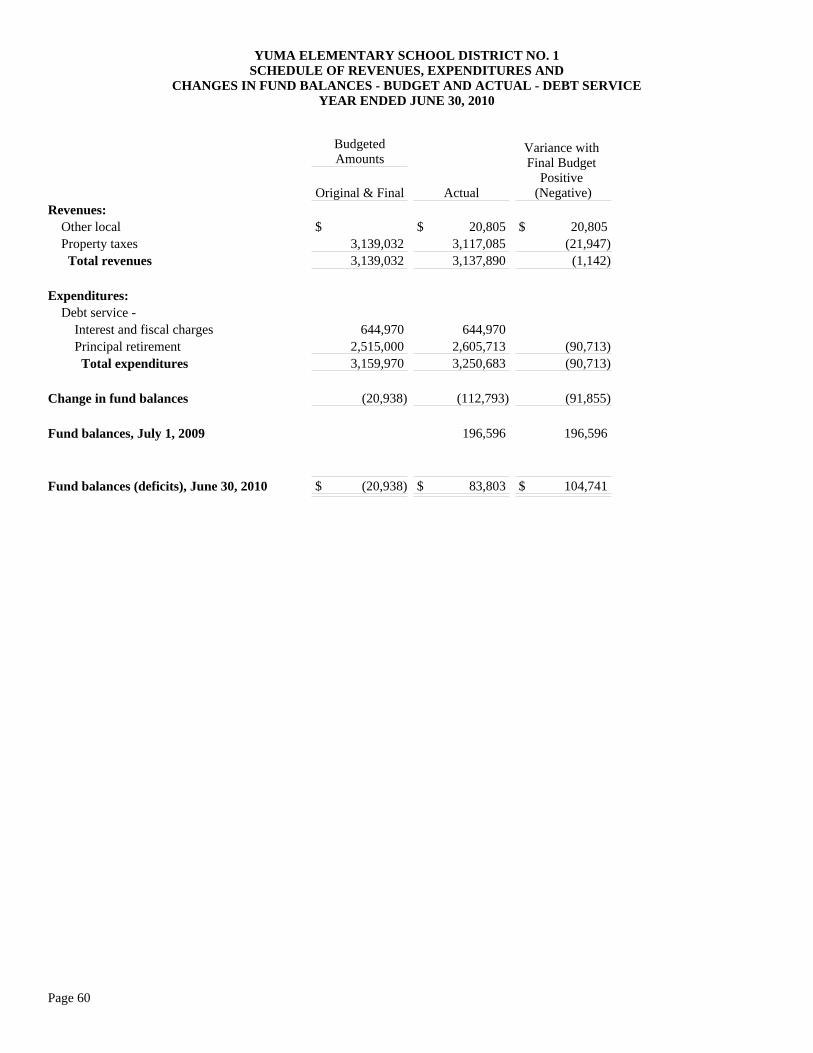
YUMA ELEMENTARY SCHOOL DISTRICT NO. 1SCHEDULE OF REVENUES, EXPENDITURES AND
CHANGES IN FUND BALANCES - BUDGET AND ACTUAL - DEBT SERVICEYEAR ENDED JUNE 30, 2010
BudgetedAmounts
Original & Final Actual
Variance with Final Budget
Positive (Negative)
Revenues: Other local Property taxes Total revenues
Expenditures: Debt service - Interest and fiscal charges Principal retirement Total expenditures
Change in fund balances
Fund balances, July 1, 2009
Fund balances (deficits), June 30, 2010
$ $ 20,805 $ 20,805 3,139,032 3,117,085 (21,947)3,139,032 3,137,890 (1,142)
644,970 644,970 2,515,000 2,605,713 (90,713)3,159,970 3,250,683 (90,713)
(20,938) (112,793) (91,855)
196,596 196,596
$ (20,938) $ 83,803 $ 104,741
Page 60

YUMA ELEMENTARY SCHOOL DISTRICT NO. 1SCHEDULE OF REVENUES, EXPENDITURES AND
CHANGES IN FUND BALANCES - BUDGET AND ACTUAL - UNRESTRICTED CAPITAL OUTLAYYEAR ENDED JUNE 30, 2010
BudgetedAmounts
Original & Final Actual
Variance with Final Budget
Positive (Negative)
Revenues: Other local Property taxes State aid and grants Total revenues
Expenditures: Capital outlay Debt service - Interest and fiscal charges Principal retirement Total expenditures
Change in fund balances
Fund balances, July 1, 2009
Fund balances (deficits), June 30, 2010
$ 60,000 $ 75,391 $ 15,391 615,000 614,118 (882)
2,375,000 2,372,138 (2,862)3,050,000 3,061,647 11,647
3,363,568 1,038,101 2,325,467
38,109 38,109 414,781 414,781
3,816,458 1,490,991 2,325,467
(766,458) 1,570,656 2,337,114
1,161,445 1,161,445
$ (766,458) $ 2,732,101 $ 3,498,559
Page 61

Page 62
(This page intentionally left blank)
Page 63
NON-MAJOR GOVERNMENTAL FUNDS

YUMA ELEMENTARY SCHOOL DISTRICT NO. 1COMBINING BALANCE SHEET - ALL NON-MAJOR GOVERNMENTAL FUNDS - BY FUND TYPE
JUNE 30, 2010
Special Revenue Capital Projects
TotalNon-Major
Governmental Funds
ASSETSCash and investmentsProperty taxes receivableAccounts receivableDue from governmental entitiesInventory, at cost Total assets
LIABILITIES AND FUND BALANCESLiabilities: Overdraft of cash on deposit Accounts payable Deferred revenues Total liabilities
Fund balances: Reserved for inventory Unreserved: Undesignated Total fund balances
Total liabilities and fund balances
$ 2,761,443 $ 1,008,496 $ 3,769,939 13,581 13,581
149,999 149,999 1,245,090 57,182 1,302,272
33,932 33,932 $ 4,190,464 $ 1,079,259 $ 5,269,723
$ 970,586 $ $ 970,586 240,426 9,440 249,866 198,294 5,709 204,003
1,409,306 15,149 1,424,455
33,932 33,932
2,747,226 1,064,110 3,811,336 2,781,158 1,064,110 3,845,268
$ 4,190,464 $ 1,079,259 $ 5,269,723
Page 64

YUMA ELEMENTARY SCHOOL DISTRICT NO. 1COMBINING STATEMENT OF REVENUES, EXPENDITURES AND CHANGES IN FUND BALANCES -
ALL NON-MAJOR GOVERNMENTAL FUNDS - BY FUND TYPEYEAR ENDED JUNE 30, 2010
Special Revenue Capital Projects
TotalNon-Major
Governmental Funds
Revenues: Other local Property taxes State aid and grants Federal aid, grants and reimbursements Total revenues
Expenditures: Current - Instruction Support services - students and staff Support services - administration Operation and maintenance of plant services Student transportation services Operation of non-instructional services Capital outlay Total expenditures
Excess (deficiency) of revenues over expenditures
Other financing sources (uses): Transfer in Transfer out Total other financing sources (uses)
Change in fund balances
Fund balances, beginning of year, as restated
(Decrease) in reserve for inventory
Fund balances, end of year
$ 1,452,454 $ 16,832 $ 1,469,286 94,244 94,244
1,076,483 390,596 1,467,079 15,727,313 15,727,313 18,256,250 501,672 18,757,922
5,961,957 5,961,957 4,800,046 4,800,046
752,388 752,388 275,302 275,302 196,767 196,767
4,516,901 4,516,901 750,880 51,909 802,789
17,254,241 51,909 17,306,150
1,002,009 449,763 1,451,772
610,756 610,756 (610,756) (610,756)
1,002,009 449,763 1,451,772
1,819,228 614,347 2,433,575
(40,079) (40,079)
$ 2,781,158 $ 1,064,110 $ 3,845,268
Page 65

Page 66
NON-MAJOR SPECIAL REVENUE FUNDS The following non-major Special Revenue Funds are maintained by the District. Arizona Revised Statutes (A.R.S.) And the Uniform System of Financial Records (USFR) require the establishment of these funds for the specified financial activities. Instructional Improvement - to account for the activity of monies received from gaming revenue. Compensatory Instruction - to account for monies received for programs in addition to normal classroom instruction to improve the English proficiency of current English language learners. Title I Grants - to account for financial assistance received for the purpose of improving the teaching and learning of children failing, or most at-risk of failing, to meet challenging State academic standards. Professional Development and Technology Grants - to account for financial assistance received to increase student academic achievement through improving teacher quality. Title IV Grants - to account for financial assistance received for chemical abuse awareness programs and expanding projects that benefit educational and health needs of the communities. Promote Informed Parent Choice - to account for financial assistance received to promote parent choices in the education of their students. Limited English and Immigrant Students - to account for financial assistance received for educational services and costs for limited English and immigrant children. Special Education Grants - to account for supplemental financial assistance received to provide a free, appropriate public education to disabled children. Homeless Education - to account for financial assistance received for the needs of homeless children. Medicaid Reimbursement - to account for reimbursements related to specific health services provided to eligible students. Other Federal Projects - to account for financial assistance received for other supplemental federal projects. Early Childhood Block Grant - to account for financial assistance received for preschool education. Chemical Abuse Prevention Programs - to account for financial assistance received for chemical abuse awareness programs. Gifted - to account for financial assistance received for programs for gifted students.

Page 67
Other State Projects - to account for financial assistance received for other State projects. School Plant - to account for proceeds from the sale or lease of school property. Food Service - to account for the financial activity of school activities that have as their purpose the preparation and serving of regular and incidental meals and snacks in connection with school functions. Civic Center - to account for monies received from the rental of school facilities for civic activities. Community School - to account for activity related to academic and skill development for all citizens. Auxiliary Operations - to account for activity arising from bookstore, athletic and miscellaneous District related operations. Extracurricular Activities Fees Tax Credit - to account for activity related to monies collected in support of extracurricular activities to be taken as a tax credit by the tax payer in accordance with A.R.S. §43-1089.01. Gifts and Donations - to account for activity related to gifts, donations, bequests and private grants made to the District. Fingerprint - to account for activity of fingerprinting employees as mandated by the State. Insurance Proceeds - to account for the monies received from insurance claims. Textbooks - to account for monies received from students to replace or repair lost or damaged textbooks. Litigation Recovery - to account for monies received for and derived from litigation. Indirect Costs - to account for monies transferred from Federal projects for administrative costs. Grants and Gifts to Teachers - to account for grants and gifts under $1,500 received from private sources that are designated for use by a teacher for instructional purposes. School Bus Advertisement - to account for monies received from the sale of advertising space on school buses.

YUMA ELEMENTARY SCHOOL DISTRICT NO. 1COMBINING BALANCE SHEET - NON-MAJOR SPECIAL REVENUE FUNDS
JUNE 30, 2010
Instructional Improvement
Compensatory Instruction Title I Grants
Professional Development
and Technology Grants
ASSETSCash and investmentsAccounts receivableDue from governmental entitiesInventory, at cost Total assets
LIABILITIES AND FUND BALANCESLiabilities: Overdraft of cash on deposit Accounts payable Deferred revenues Total liabilities
Fund balances: Reserved for inventory Unreserved: Undesignated Total fund balances
Total liabilities and fund balances
$ 437,355 $ 140,544 $ $
96,081 667,100 141,451
$ 533,436 $ 140,544 $ 667,100 $ 141,451
$ $ $ 609,840 $ 135,944 57,260 5,507 140,544 140,544 667,100 141,451
533,436 533,436
$ 533,436 $ 140,544 $ 667,100 $ 141,451
Page 68

Title IV Grants
Limited English and Immigrant
StudentsSpecial
Education GrantsHomeless Education
Medicaid Reimbursement
Other Federal Projects
$ $ $ $ $ 187,468 $ 41,383
1,434 46,327 67,542 94 13,114 139,095
$ 1,434 $ 46,327 $ 67,542 $ 94 $ 200,582 $ 180,478
$ 1,434 $ 31,098 $ 53,081 $ 94 $ $ 139,095 15,229 14,461 41,383
1,434 46,327 67,542 94 180,478
200,582 200,582
$ 1,434 $ 46,327 $ 67,542 $ 94 $ 200,582 $ 180,478
(Continued)
Page 69

YUMA ELEMENTARY SCHOOL DISTRICT NO. 1COMBINING BALANCE SHEET - NON-MAJOR SPECIAL REVENUE FUNDS
JUNE 30, 2010(Continued)
GiftedOther State
Projects School Plant Food ServiceASSETSCash and investmentsAccounts receivableDue from governmental entitiesInventory, at cost Total assets
LIABILITIES AND FUND BALANCESLiabilities: Overdraft of cash on deposit Accounts payable Deferred revenues Total liabilities
Fund balances: Reserved for inventory Unreserved: Undesignated Total fund balances
Total liabilities and fund balances
$ 314 $ 89,274 $ 66,175 $ 822,315 56,469 72,852 33,932
$ 314 $ 89,274 $ 66,175 $ 985,568
$ $ $ $ 73,221 43,743
314 16,053 314 89,274 43,743
33,932
66,175 907,893 66,175 941,825
$ 314 $ 89,274 $ 66,175 $ 985,568
Page 70

Civic CenterCommunity
SchoolAuxiliary Operations
Extracurricular Activities Fees
Tax CreditGifts and Donations Fingerprint
$ 26,551 $ 124,466 $ 2,500 $ 91,867 $ 88,567 $ 136 29,336
$ 26,551 $ 153,802 $ 2,500 $ 91,867 $ 88,567 $ 136
$ $ $ $ $ $
26,551 153,802 2,500 91,867 88,567 136 26,551 153,802 2,500 91,867 88,567 136
$ 26,551 $ 153,802 $ 2,500 $ 91,867 $ 88,567 $ 136
(Continued)
Page 71

YUMA ELEMENTARY SCHOOL DISTRICT NO. 1COMBINING BALANCE SHEET - NON-MAJOR SPECIAL REVENUE FUNDS
JUNE 30, 2010(Concluded)
Insurance Proceeds Textbooks
Litigation Recovery Indirect Costs
ASSETSCash and investmentsAccounts receivableDue from governmental entitiesInventory, at cost Total assets
LIABILITIES AND FUND BALANCESLiabilities: Overdraft of cash on deposit Accounts payable Deferred revenues Total liabilities
Fund balances: Reserved for inventory Unreserved: Undesignated Total fund balances
Total liabilities and fund balances
$ 254,544 $ 31,722 $ 61,321 $ 333,999 22,811
$ 277,355 $ 31,722 $ 61,321 $ 333,999
$ $ $ $ 31,005 31,005
277,355 31,722 61,321 302,994 277,355 31,722 61,321 302,994
$ 277,355 $ 31,722 $ 61,321 $ 333,999
Page 72
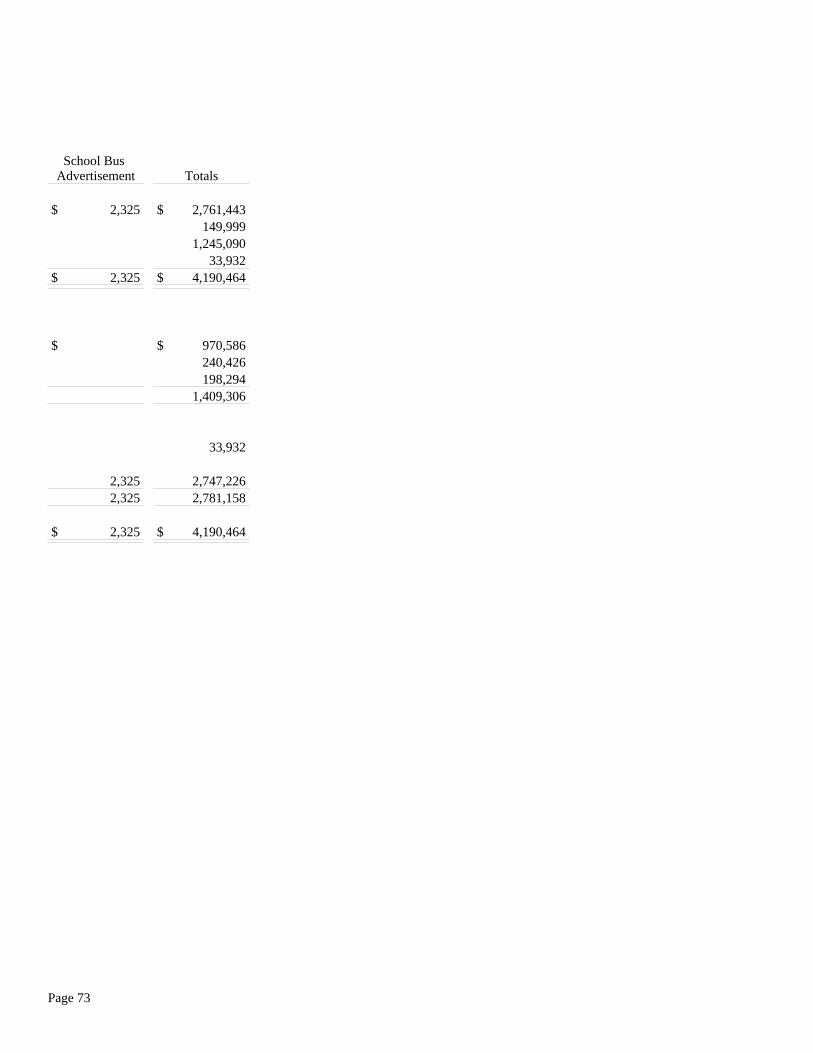
School Bus Advertisement Totals
$ 2,325 $ 2,761,443 149,999 1,245,090 33,932
$ 2,325 $ 4,190,464
$ $ 970,586 240,426 198,294 1,409,306
33,932
2,325 2,747,226 2,325 2,781,158
$ 2,325 $ 4,190,464
Page 73

YUMA ELEMENTARY SCHOOL DISTRICT NO. 1COMBINING STATEMENT OF REVENUES, EXPENDITURES AND CHANGES IN FUND BALANCES -
NON-MAJOR SPECIAL REVENUE FUNDSYEAR ENDED JUNE 30, 2010
Instructional Improvement
Compensatory Instruction Title I Grants
Revenues: Other local State aid and grants Federal aid, grants and reimbursements Total revenues
Expenditures: Current - Instruction Support services - students and staff Support services - administration Operation and maintenance of plant services Student transportation services Operation of non-instructional services Capital outlay Total expenditures
Excess (deficiency) of revenues over expenditures
Other financing sources (uses): Transfer in Transfer out Total other financing sources (uses)
Change in fund balances
Fund balances, beginning of year
(Decrease) in reserve for inventory
Fund balances, end of year
$ $ $ 344,115 274,056
5,831,044 344,115 274,056 5,831,044
192,508 204,777 3,146,816 45,853 55,669 1,823,687
292,882 250 13,610 58,551 194,077
238,361 274,056 5,516,263
105,754 314,781
(314,781) (314,781)
105,754
427,682
$ 533,436 $ $
Page 74

Professional Development
and Technology Grants Title IV Grants
Promote Informed Parent
Choice
Limited English and Immigrant
StudentsSpecial
Education GrantsHomeless Education
$ $ $ $ $ $
853,806 48,643 482 416,740 2,768,938 3,849 853,806 48,643 482 416,740 2,768,938 3,849
33,819 1,386,498 1,629 761,884 47,302 356,750 806,382
38,889 4,011 14,264 15,765 11,334 2,000
8,738 5,045 422,449 809,511 47,302 415,390 2,640,927 3,629
44,295 1,341 482 1,350 128,011 220
(44,295) (1,341) (482) (1,350) (128,011) (220)(44,295) (1,341) (482) (1,350) (128,011) (220)
$ $ $ $ $ $
(Continued)
Page 75
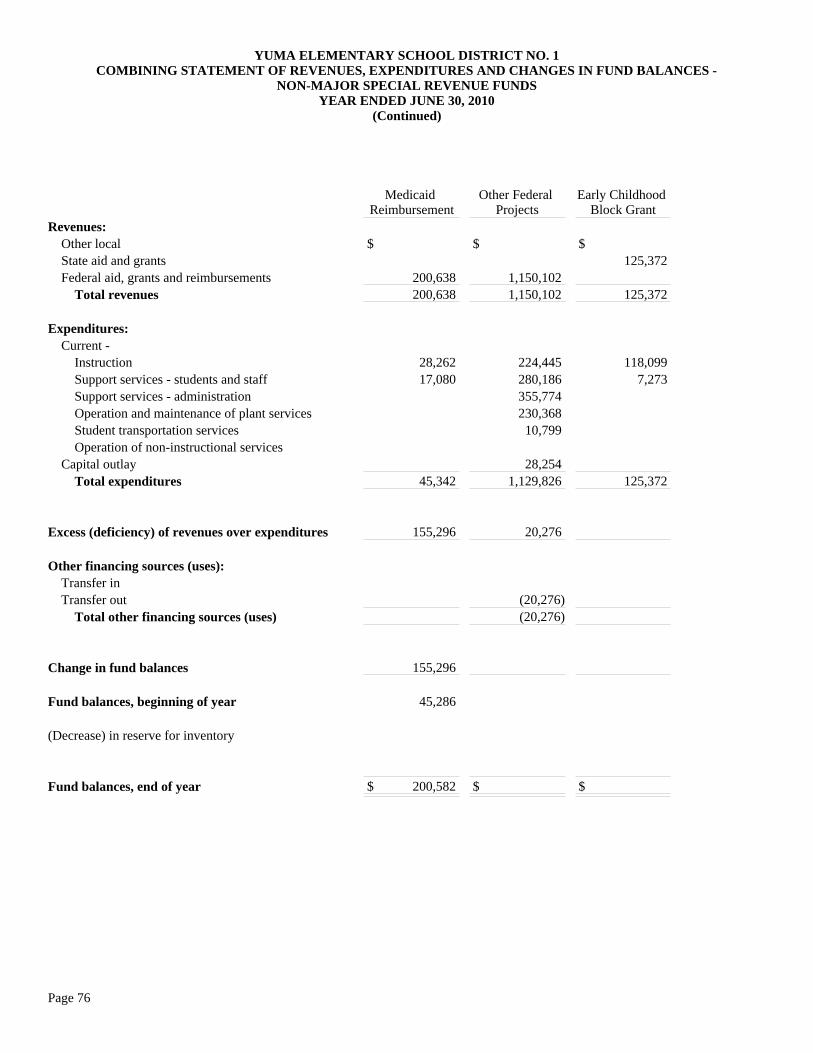
YUMA ELEMENTARY SCHOOL DISTRICT NO. 1COMBINING STATEMENT OF REVENUES, EXPENDITURES AND CHANGES IN FUND BALANCES -
NON-MAJOR SPECIAL REVENUE FUNDSYEAR ENDED JUNE 30, 2010
(Continued)
Medicaid Reimbursement
Other Federal Projects
Early Childhood Block Grant
Revenues: Other local State aid and grants Federal aid, grants and reimbursements Total revenues
Expenditures: Current - Instruction Support services - students and staff Support services - administration Operation and maintenance of plant services Student transportation services Operation of non-instructional services Capital outlay Total expenditures
Excess (deficiency) of revenues over expenditures
Other financing sources (uses): Transfer in Transfer out Total other financing sources (uses)
Change in fund balances
Fund balances, beginning of year
(Decrease) in reserve for inventory
Fund balances, end of year
$ $ $ 125,372
200,638 1,150,102 200,638 1,150,102 125,372
28,262 224,445 118,099 17,080 280,186 7,273
355,774 230,368 10,799 28,254
45,342 1,129,826 125,372
155,296 20,276
(20,276) (20,276)
155,296
45,286
$ 200,582 $ $
Page 76

Chemical Abuse Prevention Programs Gifted
Other State Projects School Plant Food Service Civic Center
$ $ $ $ 3,255 $ 710,920 $ 44,271 4,345 3,547 325,048
4,370,517 4,345 3,547 325,048 3,255 5,081,437 44,271
22,226 5,999 4,345 3,547 299,878
542 2,402 33,402 4,516,901 72,761
4,345 3,547 325,048 4,589,662 39,401
3,255 491,775 4,870
(100,000) (100,000)
3,255 391,775 4,870
62,920 590,129 21,681
(40,079)
$ $ $ $ 66,175 $ 941,825 $ 26,551
(Continued)
Page 77

YUMA ELEMENTARY SCHOOL DISTRICT NO. 1COMBINING STATEMENT OF REVENUES, EXPENDITURES AND CHANGES IN FUND BALANCES -
NON-MAJOR SPECIAL REVENUE FUNDSYEAR ENDED JUNE 30, 2010
(Continued)
Community School
Auxiliary Operations
Extracurricular Activities Fees
Tax CreditRevenues: Other local State aid and grants Federal aid, grants and reimbursements Total revenues
Expenditures: Current - Instruction Support services - students and staff Support services - administration Operation and maintenance of plant services Student transportation services Operation of non-instructional services Capital outlay Total expenditures
Excess (deficiency) of revenues over expenditures
Other financing sources (uses): Transfer in Transfer out Total other financing sources (uses)
Change in fund balances
Fund balances, beginning of year
(Decrease) in reserve for inventory
Fund balances, end of year
$ 310,105 $ 13,285 $ 137,457
82,554 392,659 13,285 137,457
401,584 13,285 102,886 114 194
3,483 37,756 6,741
405,067 13,285 147,691
(12,408) (10,234)
(12,408) (10,234)
166,210 2,500 102,101
$ 153,802 $ 2,500 $ 91,867
Page 78

Gifts and Donations Fingerprint
Insurance Proceeds Textbooks
Litigation Recovery Indirect Costs
$ 92,307 $ 1,704 $ 72,274 $ 3,234 $ 61,321 $
92,307 1,704 72,274 3,234 61,321
61,752 17,372 8,580 281,516
1,992 44,034 8,686
7,439 36,030
5,595 7,220 83,366 1,992 51,936 17,372 325,550
8,941 (288) 20,338 (14,138) 61,321 (325,550)
610,756 610,756
8,941 (288) 20,338 (14,138) 61,321 285,206
79,626 424 257,017 45,860 17,788
$ 88,567 $ 136 $ 277,355 $ 31,722 $ 61,321 $ 302,994
(Continued)
Page 79

YUMA ELEMENTARY SCHOOL DISTRICT NO. 1COMBINING STATEMENT OF REVENUES, EXPENDITURES AND CHANGES IN FUND BALANCES -
NON-MAJOR SPECIAL REVENUE FUNDSYEAR ENDED JUNE 30, 2010
(Concluded)
School Bus Advertisement Totals
Revenues: Other local State aid and grants Federal aid, grants and reimbursements Total revenues
Expenditures: Current - Instruction Support services - students and staff Support services - administration Operation and maintenance of plant services Student transportation services Operation of non-instructional services Capital outlay Total expenditures
Excess (deficiency) of revenues over expenditures
Other financing sources (uses): Transfer in Transfer out Total other financing sources (uses)
Change in fund balances
Fund balances, beginning of year
(Decrease) in reserve for inventory
Fund balances, end of year
$ 2,321 $ 1,452,454 1,076,483 15,727,313
2,321 18,256,250
5,961,957 4,800,046 752,388 275,302 196,767 4,516,901 750,880 17,254,241
2,321 1,002,009
610,756 (610,756)
2,321 1,002,009
4 1,819,228
(40,079)
$ 2,325 $ 2,781,158
Page 80

Page 81
(This page intentionally left blank)

YUMA ELEMENTARY SCHOOL DISTRICT NO. 1COMBINING SCHEDULE OF REVENUES, EXPENDITURES AND CHANGES IN
FUND BALANCES - BUDGET AND ACTUAL - NON-MAJOR SPECIAL REVENUE FUNDSYEAR ENDED JUNE 30, 2010
Instructional Improvement
Budget Actual
Variance - Positive
(Negative)Revenues: Other local State aid and grants Federal aid, grants and reimbursements Total revenues
Expenditures: Current - Instruction Support services - students and staff Support services - administration Operation and maintenance of plant services Student transportation services Operation of non-instructional services Capital outlay Total expenditures
Excess (deficiency) of revenues over expenditures
Other financing sources (uses): Transfer in Transfer out Total other financing sources (uses)
Change in fund balances
Fund balances, July 1, 2009
(Decrease) in reserve for inventory
Fund balances (deficits), June 30, 2010
$ $ $ 345,000 344,115 (885)
345,000 344,115 (885)
500,000 192,508 307,492 45,853 (45,853)
500,000 238,361 261,639
(155,000) 105,754 260,754
(155,000) 105,754 260,754
427,682 427,682
$ (155,000) $ 533,436 $ 688,436
Page 82

Compensatory Instruction Title I Grants
Budget Actual
Variance - Positive
(Negative) Budget Actual
Variance - Positive
(Negative)
$ $ $ $ $ $ 35,000 274,056 239,056
8,129,634 5,831,044 (2,298,590)35,000 274,056 239,056 8,129,634 5,831,044 (2,298,590)
204,777 (204,777) 4,458,072 3,146,816 1,311,256 55,669 (55,669) 2,583,605 1,823,687 759,918
414,925 292,882 122,043 354 250 104
13,610 (13,610) 82,949 58,551 24,398
274,948 194,077 80,871 274,056 (274,056) 7,814,853 5,516,263 2,298,590
35,000 (35,000) 314,781 314,781
(314,781) (314,781) (314,781) (314,781)
35,000 (35,000)
$ 35,000 $ $ (35,000) $ $ $
(Continued)
Page 83

YUMA ELEMENTARY SCHOOL DISTRICT NO. 1COMBINING SCHEDULE OF REVENUES, EXPENDITURES AND CHANGES IN
FUND BALANCES - BUDGET AND ACTUAL - NON-MAJOR SPECIAL REVENUE FUNDSYEAR ENDED JUNE 30, 2010
(Continued)
Professional Development and Technology Grants
Budget Actual
Variance - Positive
(Negative)Revenues: Other local State aid and grants Federal aid, grants and reimbursements Total revenues
Expenditures: Current - Instruction Support services - students and staff Support services - administration Operation and maintenance of plant services Student transportation services Operation of non-instructional services Capital outlay Total expenditures
Excess (deficiency) of revenues over expenditures
Other financing sources (uses): Transfer in Transfer out Total other financing sources (uses)
Change in fund balances
Fund balances, July 1, 2009
(Decrease) in reserve for inventory
Fund balances (deficits), June 30, 2010
$ $ $
708,915 853,806 144,891 708,915 853,806 144,891
625,518 761,884 (136,366)31,928 38,889 (6,961)
7,174 8,738 (1,564)664,620 809,511 (144,891)
44,295 44,295
(44,295) (44,295) (44,295) (44,295)
$ $ $
Page 84

Title IV Grants Promote Informed Parent Choice
Budget Actual
Variance - Positive
(Negative) Budget Actual
Variance - Positive
(Negative)
$ $ $ $ $ $
40,000 48,643 8,643 1,000 482 (518)40,000 48,643 8,643 1,000 482 (518)
518 518 38,659 47,302 (8,643)
38,659 47,302 (8,643) 518 518
1,341 1,341 482 482
(1,341) (1,341) (482) (482) (1,341) (1,341) (482) (482)
$ $ $ $ $ $
(Continued)
Page 85

YUMA ELEMENTARY SCHOOL DISTRICT NO. 1COMBINING SCHEDULE OF REVENUES, EXPENDITURES AND CHANGES IN
FUND BALANCES - BUDGET AND ACTUAL - NON-MAJOR SPECIAL REVENUE FUNDSYEAR ENDED JUNE 30, 2010
(Continued)
Limited English and Immigrant Students
Budget Actual
Variance - Positive
(Negative)Revenues: Other local State aid and grants Federal aid, grants and reimbursements Total revenues
Expenditures: Current - Instruction Support services - students and staff Support services - administration Operation and maintenance of plant services Student transportation services Operation of non-instructional services Capital outlay Total expenditures
Excess (deficiency) of revenues over expenditures
Other financing sources (uses): Transfer in Transfer out Total other financing sources (uses)
Change in fund balances
Fund balances, July 1, 2009
(Decrease) in reserve for inventory
Fund balances (deficits), June 30, 2010
$ $ $
342,500 416,740 74,240 342,500 416,740 74,240
27,775 33,819 (6,044)292,991 356,750 (63,759)
3,294 4,011 (717)
12,947 15,765 (2,818)
4,143 5,045 (902)341,150 415,390 (74,240)
1,350 1,350
(1,350) (1,350) (1,350) (1,350)
$ $ $
____________*The Homeless Education Fund was included in the District's budget, however, the budget was -0-.
Page 86

Special Education Grants Homeless Education
Budget Actual
Variance - Positive
(Negative) Budget* Actual
Variance - Positive
(Negative)
$ $ $ $ $ $
3,947,672 2,768,938 (1,178,734) 3,849 3,849 3,947,672 2,768,938 (1,178,734) 3,849 3,849
2,005,338 1,386,498 618,840 1,629 (1,629)1,166,297 806,382 359,915
20,631 14,264 6,367
16,393 11,334 5,059 2,000 (2,000)
611,002 422,449 188,553 3,819,661 2,640,927 1,178,734 3,629 (3,629)
128,011 128,011 220 220
(128,011) (128,011) (220) (220)(128,011) (128,011) (220) (220)
$ $ $ $ $ $
(Continued)
Page 87

YUMA ELEMENTARY SCHOOL DISTRICT NO. 1COMBINING SCHEDULE OF REVENUES, EXPENDITURES AND CHANGES IN
FUND BALANCES - BUDGET AND ACTUAL - NON-MAJOR SPECIAL REVENUE FUNDSYEAR ENDED JUNE 30, 2010
(Continued)
Medicaid Reimbursement
Budget Actual
Variance - Positive
(Negative)Revenues: Other local State aid and grants Federal aid, grants and reimbursements Total revenues
Expenditures: Current - Instruction Support services - students and staff Support services - administration Operation and maintenance of plant services Student transportation services Operation of non-instructional services Capital outlay Total expenditures
Excess (deficiency) of revenues over expenditures
Other financing sources (uses): Transfer in Transfer out Total other financing sources (uses)
Change in fund balances
Fund balances, July 1, 2009
(Decrease) in reserve for inventory
Fund balances (deficits), June 30, 2010
$ $ $
200,638 200,638 200,638 200,638
81,030 28,262 52,768 48,970 17,080 31,890
130,000 45,342 84,658
(130,000) 155,296 285,296
(130,000) 155,296 285,296
45,286 45,286
$ (130,000) $ 200,582 $ 330,582
Page 88

Other Federal Projects Early Childhood Block Grant
Budget Actual
Variance - Positive
(Negative) Budget Actual
Variance - Positive
(Negative)
$ $ $ $ $ $ 319,972 125,372 (194,600)
480,209 1,150,102 669,893 480,209 1,150,102 669,893 319,972 125,372 (194,600)
91,368 224,445 (133,077) 301,410 118,099 183,311 114,059 280,186 (166,127) 18,562 7,273 11,289 144,829 355,774 (210,945)
93,779 230,368 (136,589)4,396 10,799 (6,403)
11,502 28,254 (16,752)459,933 1,129,826 (669,893) 319,972 125,372 194,600
20,276 20,276
(20,276) (20,276) (20,276) (20,276)
$ $ $ $ $ $
(Continued)
Page 89

YUMA ELEMENTARY SCHOOL DISTRICT NO. 1COMBINING SCHEDULE OF REVENUES, EXPENDITURES AND CHANGES IN
FUND BALANCES - BUDGET AND ACTUAL - NON-MAJOR SPECIAL REVENUE FUNDSYEAR ENDED JUNE 30, 2010
(Continued)
Chemical Abuse Prevention Programs
Budget Actual
Variance - Positive
(Negative)Revenues: Other local State aid and grants Federal aid, grants and reimbursements Total revenues
Expenditures: Current - Instruction Support services - students and staff Support services - administration Operation and maintenance of plant services Student transportation services Operation of non-instructional services Capital outlay Total expenditures
Excess (deficiency) of revenues over expenditures
Other financing sources (uses): Transfer in Transfer out Total other financing sources (uses)
Change in fund balances
Fund balances, July 1, 2009
(Decrease) in reserve for inventory
Fund balances (deficits), June 30, 2010
$ $ $ 5,559 4,345 (1,214)
5,559 4,345 (1,214)
5,559 4,345 1,214
5,559 4,345 1,214
$ $ $
Page 90

Gifted Other State Projects
Budget Actual
Variance - Positive
(Negative) Budget Actual
Variance - Positive
(Negative)
$ $ $ $ $ $ 35,000 3,547 (31,453) 321,003 325,048 4,045
35,000 3,547 (31,453) 321,003 325,048 4,045
21,949 22,226 (277)35,000 3,547 31,453 296,147 299,878 (3,731)
535 542 (7)2,372 2,402 (30)
35,000 3,547 31,453 321,003 325,048 (4,045)
$ $ $ $ $ $
(Continued)
Page 91

YUMA ELEMENTARY SCHOOL DISTRICT NO. 1COMBINING SCHEDULE OF REVENUES, EXPENDITURES AND CHANGES IN
FUND BALANCES - BUDGET AND ACTUAL - NON-MAJOR SPECIAL REVENUE FUNDSYEAR ENDED JUNE 30, 2010
(Continued)
School Plant
Budget Actual
Variance - Positive
(Negative)Revenues: Other local State aid and grants Federal aid, grants and reimbursements Total revenues
Expenditures: Current - Instruction Support services - students and staff Support services - administration Operation and maintenance of plant services Student transportation services Operation of non-instructional services Capital outlay Total expenditures
Excess (deficiency) of revenues over expenditures
Other financing sources (uses): Transfer in Transfer out Total other financing sources (uses)
Change in fund balances
Fund balances, July 1, 2009
(Decrease) in reserve for inventory
Fund balances (deficits), June 30, 2010
$ 3,000 $ 3,255 $ 255
3,000 3,255 255
1,000 1,000
1,000 1,000
2,000 3,255 1,255
2,000 3,255 1,255
62,920 62,920
$ 2,000 $ 66,175 $ 64,175
Page 92

Food Service Civic Center
Budget Actual
Variance - Positive
(Negative) Budget Actual
Variance - Positive
(Negative)
$ 684,137 $ 710,920 $ 26,783 $ 40,000 $ 44,271 $ 4,271
4,205,863 4,370,517 164,654 4,890,000 5,081,437 191,437 40,000 44,271 4,271
5,786 5,999 (213)
32,214 33,402 (1,188)
4,920,734 4,516,901 403,833 79,266 72,761 6,505
5,000,000 4,589,662 410,338 38,000 39,401 (1,401)
(110,000) 491,775 601,775 2,000 4,870 2,870
(100,000) (100,000) (100,000) (100,000)
(210,000) 391,775 601,775 2,000 4,870 2,870
590,129 590,129 21,681 21,681
(40,079) (40,079)
$ (210,000) $ 941,825 $ 1,151,825 $ 2,000 $ 26,551 $ 24,551
(Continued)
Page 93

YUMA ELEMENTARY SCHOOL DISTRICT NO. 1COMBINING SCHEDULE OF REVENUES, EXPENDITURES AND CHANGES IN
FUND BALANCES - BUDGET AND ACTUAL - NON-MAJOR SPECIAL REVENUE FUNDSYEAR ENDED JUNE 30, 2010
(Continued)
Community School
Budget Actual
Variance - Positive
(Negative)Revenues: Other local State aid and grants Federal aid, grants and reimbursements Total revenues
Expenditures: Current - Instruction Support services - students and staff Support services - administration Operation and maintenance of plant services Student transportation services Operation of non-instructional services Capital outlay Total expenditures
Excess (deficiency) of revenues over expenditures
Other financing sources (uses): Transfer in Transfer out Total other financing sources (uses)
Change in fund balances
Fund balances, July 1, 2009
(Decrease) in reserve for inventory
Fund balances (deficits), June 30, 2010
$ 400,000 $ 310,105 $ (89,895)
82,554 82,554 400,000 392,659 (7,341)
413,414 401,584 11,830
3,586 3,483 103
417,000 405,067 11,933
(17,000) (12,408) 4,592
(17,000) (12,408) 4,592
166,210 166,210
$ (17,000) $ 153,802 $ 170,802
Page 94

Auxiliary Operations Extracurricular Activities Fees Tax Credit
Budget Actual
Variance - Positive
(Negative) Budget Actual
Variance - Positive
(Negative)
$ 13,000 $ 13,285 $ 285 $ 125,000 $ 137,457 $ 12,457
13,000 13,285 285 125,000 137,457 12,457
13,285 (13,285) 69,664 102,886 (33,222)77 114 (37)
131 194 (63)25,564 37,756 (12,192)
4,564 6,741 (2,177) 13,285 (13,285) 100,000 147,691 (47,691)
13,000 (13,000) 25,000 (10,234) (35,234)
13,000 (13,000) 25,000 (10,234) (35,234)
2,500 2,500 102,101 102,101
$ 13,000 $ 2,500 $ (10,500) $ 25,000 $ 91,867 $ 66,867
(Continued)
Page 95

YUMA ELEMENTARY SCHOOL DISTRICT NO. 1COMBINING SCHEDULE OF REVENUES, EXPENDITURES AND CHANGES IN
FUND BALANCES - BUDGET AND ACTUAL - NON-MAJOR SPECIAL REVENUE FUNDSYEAR ENDED JUNE 30, 2010
(Continued)
Gifts and Donations
Budget Actual
Variance - Positive
(Negative)Revenues: Other local State aid and grants Federal aid, grants and reimbursements Total revenues
Expenditures: Current - Instruction Support services - students and staff Support services - administration Operation and maintenance of plant services Student transportation services Operation of non-instructional services Capital outlay Total expenditures
Excess (deficiency) of revenues over expenditures
Other financing sources (uses): Transfer in Transfer out Total other financing sources (uses)
Change in fund balances
Fund balances, July 1, 2009
(Decrease) in reserve for inventory
Fund balances (deficits), June 30, 2010
$ 90,000 $ 92,307 $ 2,307
90,000 92,307 2,307
29,629 61,752 (32,123)4,117 8,580 (4,463)
3,569 7,439 (3,870)
2,685 5,595 (2,910)40,000 83,366 (43,366)
50,000 8,941 (41,059)
50,000 8,941 (41,059)
79,626 79,626
$ 50,000 $ 88,567 $ 38,567
Page 96

Fingerprint Insurance Proceeds
Budget Actual
Variance - Positive
(Negative) Budget Actual
Variance - Positive
(Negative)
$ 1,500 $ 1,704 $ 204 $ 70,000 $ 72,274 $ 2,274
1,500 1,704 204 70,000 72,274 2,274
3,000 1,992 1,008 8,362 8,686 (324)
34,687 36,030 (1,343)
6,951 7,220 (269)3,000 1,992 1,008 50,000 51,936 (1,936)
(1,500) (288) 1,212 20,000 20,338 338
(1,500) (288) 1,212 20,000 20,338 338
424 424 257,017 257,017
$ (1,500) $ 136 $ 1,636 $ 20,000 $ 277,355 $ 257,355
(Continued)
Page 97

YUMA ELEMENTARY SCHOOL DISTRICT NO. 1COMBINING SCHEDULE OF REVENUES, EXPENDITURES AND CHANGES IN
FUND BALANCES - BUDGET AND ACTUAL - NON-MAJOR SPECIAL REVENUE FUNDSYEAR ENDED JUNE 30, 2010
(Continued)
Textbooks
Budget Actual
Variance - Positive
(Negative)Revenues: Other local State aid and grants Federal aid, grants and reimbursements Total revenues
Expenditures: Current - Instruction Support services - students and staff Support services - administration Operation and maintenance of plant services Student transportation services Operation of non-instructional services Capital outlay Total expenditures
Excess (deficiency) of revenues over expenditures
Other financing sources (uses): Transfer in Transfer out Total other financing sources (uses)
Change in fund balances
Fund balances, July 1, 2009
(Decrease) in reserve for inventory
Fund balances (deficits), June 30, 2010
$ 3,000 $ 3,234 $ 234
3,000 3,234 234
13,000 17,372 (4,372)
13,000 17,372 (4,372)
(10,000) (14,138) (4,138)
(10,000) (14,138) (4,138)
45,860 45,860
$ (10,000) $ 31,722 $ 41,722
Page 98

Litigation Recovery Indirect Costs
Budget Actual
Variance - Positive
(Negative) Budget Actual
Variance - Positive
(Negative)
$ 60,000 $ 61,321 $ 1,321 $ $ $
60,000 61,321 1,321
100,000 100,000 302,659 281,516 21,143
47,341 44,034 3,307
100,000 100,000 350,000 325,550 24,450
(40,000) 61,321 101,321 (350,000) (325,550) 24,450
610,756 610,756
610,756 610,756
(40,000) 61,321 101,321 (350,000) 285,206 635,206
17,788 17,788
$ (40,000) $ 61,321 $ 101,321 $ (350,000) $ 302,994 $ 652,994
(Continued)
Page 99

YUMA ELEMENTARY SCHOOL DISTRICT NO. 1COMBINING SCHEDULE OF REVENUES, EXPENDITURES AND CHANGES IN
FUND BALANCES - BUDGET AND ACTUAL - NON-MAJOR SPECIAL REVENUE FUNDSYEAR ENDED JUNE 30, 2010
(Concluded)
Grants and Gifts to Teachers
Budget Actual
Variance - Positive
(Negative)Revenues: Other local State aid and grants Federal aid, grants and reimbursements Total revenues
Expenditures: Current - Instruction Support services - students and staff Support services - administration Operation and maintenance of plant services Student transportation services Operation of non-instructional services Capital outlay Total expenditures
Excess (deficiency) of revenues over expenditures
Other financing sources (uses): Transfer in Transfer out Total other financing sources (uses)
Change in fund balances
Fund balances, July 1, 2009
(Decrease) in reserve for inventory
Fund balances (deficits), June 30, 2010
$ 10,000 $ $ (10,000)
10,000 (10,000)
1,000 1,000
1,000 1,000
9,000 (9,000)
9,000 (9,000)
$ 9,000 $ $ (9,000)
Page 100

School Bus Advertisement Totals
Budget Actual
Variance - Positive
(Negative) Budget Actual
Variance - Positive
(Negative)
$ 2,000 $ 2,321 $ 321 $ 1,501,637 $ 1,452,454 $ (49,183)1,061,534 1,076,483 14,949
17,855,793 15,727,313 (2,128,480)2,000 2,321 321 20,418,964 18,256,250 (2,162,714)
30,000 30,000 8,149,953 5,961,957 2,187,996 5,532,220 4,800,046 732,174
666,483 752,388 (85,905)137,212 275,302 (138,090)184,091 196,767 (12,676)
4,921,734 4,516,901 404,833 1,002,235 750,880 251,355
30,000 30,000 20,593,928 17,254,241 3,339,687
(28,000) 2,321 30,321 (174,964) 1,002,009 1,176,973
610,756 610,756 (610,536) (610,756) (220)
(610,536) 610,536
(28,000) 2,321 30,321 (785,500) 1,002,009 1,787,509
4 4 1,819,228 1,819,228
(40,079) (40,079)
$ (28,000) $ 2,325 $ 30,325 $ (785,500) $ 2,781,158 $ 3,566,658
Page 101

Page 102
(This page intentionally left blank)

Page 103
NON-MAJOR CAPITAL PROJECTS FUNDS The following non-major Capital Projects Funds are maintained by the District. Arizona Revised Statutes (A.R.S.) and the Uniform System of Financial Records (USFR) require the establishment of these funds for the specified financial activities. Adjacent Ways - to account for monies received to finance improvements of public ways adjacent to school property. Soft Capital Allocation - to account for transactions relating to the acquisition of short-term capital items required to meet academic adequacy standards. Condemnation - to account for proceeds from right-of-way settlements and sales by condemnation or threat of condemnation. Deficiencies Correction - to account for monies received from the School Facilities Board that are used to correct deficiencies in square footage and in quality of facilities and equipment. Building Renewal - to account for monies received from the School Facilities Board that are used for infrastructure or for major upgrades, repairs, or renovations to areas, systems or buildings that will maintain or extend their useful life. New School Facilities - to account for monies received from the School Facilities Board to be used for constructing new school facilities and purchasing land for new school sites.
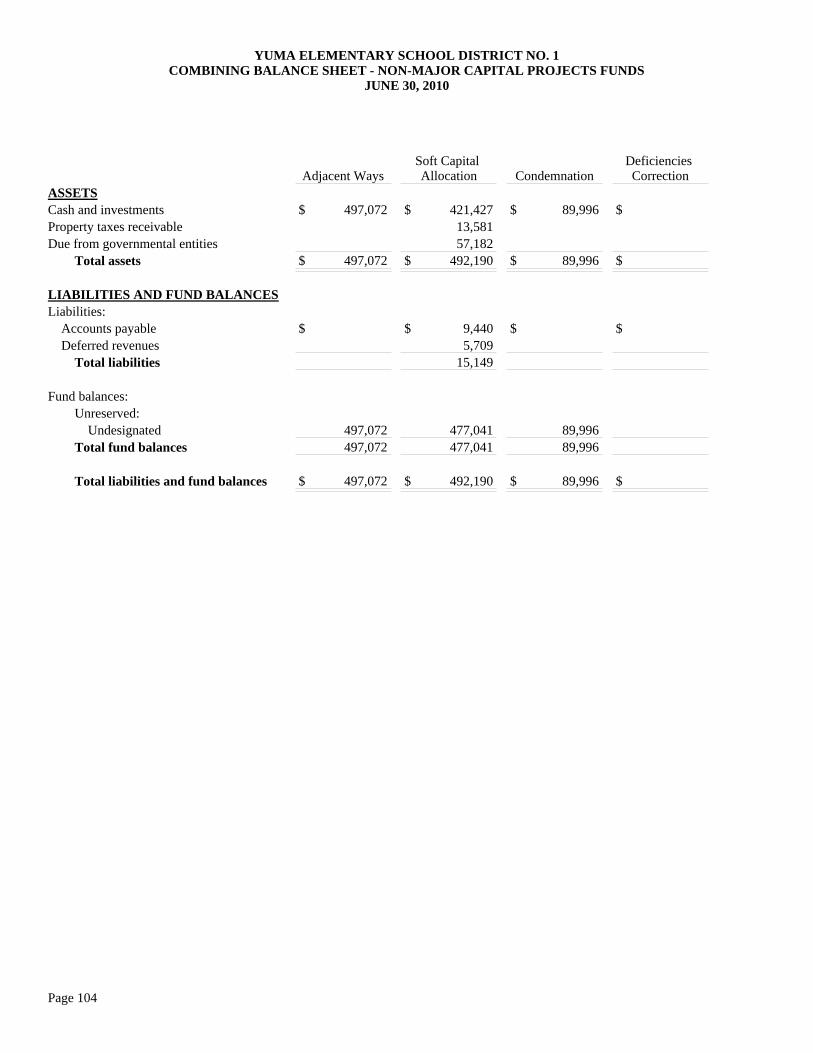
YUMA ELEMENTARY SCHOOL DISTRICT NO. 1COMBINING BALANCE SHEET - NON-MAJOR CAPITAL PROJECTS FUNDS
JUNE 30, 2010
Adjacent WaysSoft Capital Allocation Condemnation
Deficiencies Correction
ASSETSCash and investmentsProperty taxes receivableDue from governmental entities Total assets
LIABILITIES AND FUND BALANCESLiabilities: Accounts payable Deferred revenues Total liabilities
Fund balances: Unreserved: Undesignated Total fund balances
Total liabilities and fund balances
$ 497,072 $ 421,427 $ 89,996 $ 13,581 57,182
$ 497,072 $ 492,190 $ 89,996 $
$ $ 9,440 $ $ 5,709 15,149
497,072 477,041 89,996 497,072 477,041 89,996
$ 497,072 $ 492,190 $ 89,996 $
Page 104

New School Facilities Totals
$ 1 $ 1,008,496 13,581 57,182
$ 1 $ 1,079,259
$ $ 9,440 5,709 15,149
1 1,064,110 1 1,064,110
$ 1 $ 1,079,259
Page 105

YUMA ELEMENTARY SCHOOL DISTRICT NO. 1COMBINING STATEMENT OF REVENUES, EXPENDITURES AND CHANGES IN FUND BALANCES -
NON-MAJOR CAPITAL PROJECTS FUNDSYEAR ENDED JUNE 30, 2010
Adjacent WaysSoft Capital Allocation Condemnation
Revenues: Other local Property taxes State aid and grants Total revenues
Expenditures: Capital outlay Total expenditures
Change in fund balances
Fund balances, beginning of year
Fund balances, end of year
$ 4,307 $ 8,871 $ 3,559 16,083 78,161
390,596 20,390 477,628 3,559
46,519 46,519
20,390 431,109 3,559
476,682 45,932 86,437
$ 497,072 $ 477,041 $ 89,996
Page 106

Building Renewal
New School Facilities Totals
$ 95 $ $ 16,832 94,244 390,596
95 501,672
5,390 51,909 5,390 51,909
(5,295) 449,763
5,295 1 614,347
$ $ 1 $ 1,064,110
Page 107
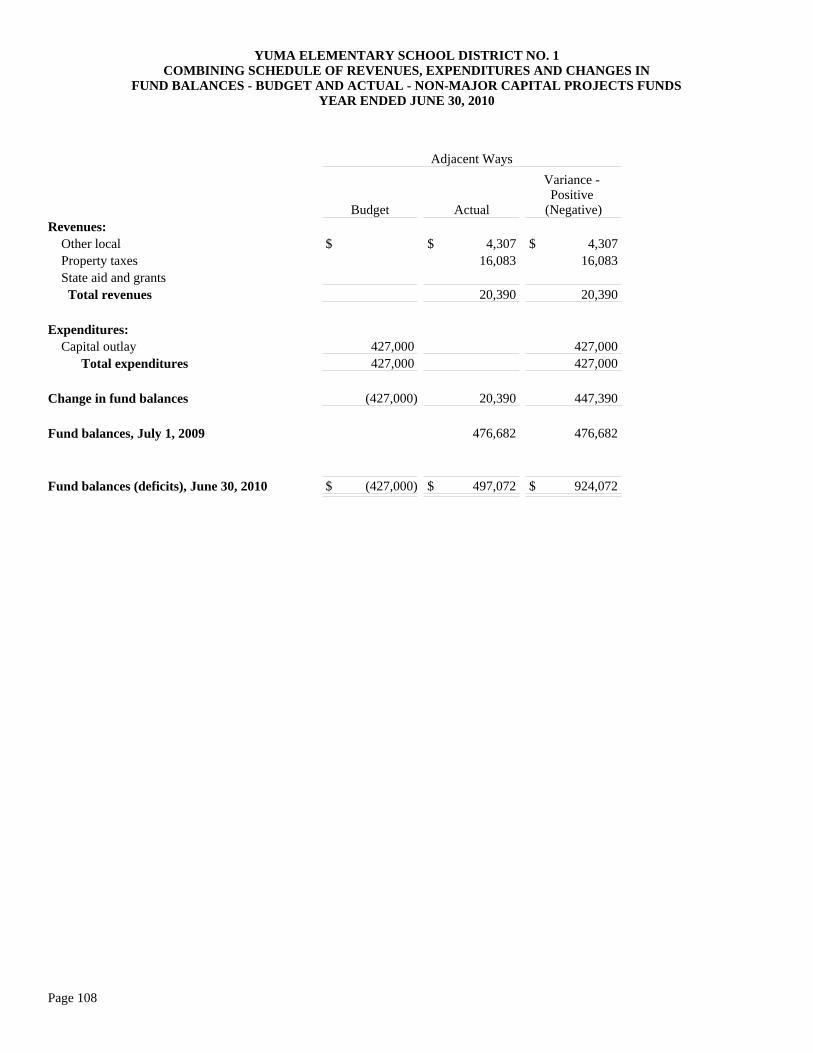
YUMA ELEMENTARY SCHOOL DISTRICT NO. 1COMBINING SCHEDULE OF REVENUES, EXPENDITURES AND CHANGES IN
FUND BALANCES - BUDGET AND ACTUAL - NON-MAJOR CAPITAL PROJECTS FUNDSYEAR ENDED JUNE 30, 2010
Adjacent Ways
Budget Actual
Variance - Positive
(Negative)Revenues: Other local Property taxes State aid and grants Total revenues
Expenditures: Capital outlay Total expenditures
Change in fund balances
Fund balances, July 1, 2009
Fund balances (deficits), June 30, 2010
$ $ 4,307 $ 4,307 16,083 16,083
20,390 20,390
427,000 427,000 427,000 427,000
(427,000) 20,390 447,390
476,682 476,682
$ (427,000) $ 497,072 $ 924,072
Page 108

Soft Capital Allocation Condemnation
Budget Actual
Variance - Positive
(Negative) Budget Actual
Variance - Positive
(Negative)
$ 7,000 $ 8,871 $ 1,871 $ 3,000 $ 3,559 $ 559 60,125 78,161 18,036
414,875 390,596 (24,279)482,000 477,628 (4,372) 3,000 3,559 559
614,654 46,519 568,135 80,000 80,000 614,654 46,519 568,135 80,000 80,000
(132,654) 431,109 563,763 (77,000) 3,559 80,559
45,932 45,932 86,437 86,437
$ (132,654) $ 477,041 $ 609,695 $ (77,000) $ 89,996 $ 166,996
(Continued)
Page 109

YUMA ELEMENTARY SCHOOL DISTRICT NO. 1COMBINING SCHEDULE OF REVENUES, EXPENDITURES AND CHANGES IN
FUND BALANCES - BUDGET AND ACTUAL - NON-MAJOR CAPITAL PROJECTS FUNDSYEAR ENDED JUNE 30, 2010
(Concluded)
Building Renewal
Budget Actual
Variance - Positive
(Negative)Revenues: Other local Property taxes State aid and grants Total revenues
Expenditures: Capital outlay Total expenditures
Change in fund balances
Fund balances, July 1, 2009
Fund balances (deficits), June 30, 2010
$ $ 95 $ 95
95 95
168,652 5,390 163,262 168,652 5,390 163,262
(168,652) (5,295) 163,357
5,295 5,295
$ (168,652) $ $ 168,652
____________*The New School Facilities Fund was included in the District's budget, however, the budget was -0-.
Page 110

New School Facilities Totals
Budget* Actual
Variance - Positive
(Negative) Budget Actual
Variance - Positive
(Negative)
$ $ $ $ 10,000 $ 16,832 $ 6,832 60,125 94,244 34,119
414,875 390,596 (24,279) 485,000 501,672 16,672
1,290,306 51,909 1,238,397 1,290,306 51,909 1,238,397
(805,306) 449,763 1,255,069
1 1 614,347 614,347
$ $ 1 $ 1 $ (805,306) $ 1,064,110 $ 1,869,416
Page 111

Page 112
(This page intentionally left blank)

Page 113
INTERNAL SERVICE FUNDS Transportation Consortium - accounts for the operation of transportation services provided to other governmental entities and District funds on a cost reimbursement basis Intergovernmental Agreements - accounts for financial activities related to agreements with other governments where the District is the fiscal agent.

YUMA ELEMENTARY SCHOOL DISTRICT NO. 1COMBINING STATEMENT OF NET ASSETS - ALL INTERNAL SERVICE FUNDS
JUNE 30, 2010
Transportation Consortium
Intergovernmental Agreements Totals
ASSETSCurrent assets: Cash and investments Accounts receivable Due from governmental entities Inventory, at cost Total assets
LIABILITIESCurrent liabilities: Overdraft of cash on deposit Accounts payable Total liabilities
NET ASSETSUnrestricted Total net assets
$ $ 9,878 $ 9,878 38,548 38,548
138,013 138,013 257,070 257,070 433,631 9,878 443,509
$ 96,123 $ $ 96,123 41,890 41,890
138,013 138,013
295,618 9,878 305,496 $ 295,618 $ 9,878 $ 305,496
Page 114

YUMA ELEMENTARY SCHOOL DISTRICT NO. 1COMBINING STATEMENT OF REVENUES, EXPENSES, AND CHANGES IN FUND NET ASSETS -
ALL INTERNAL SERVICE FUNDSFOR THE YEAR ENDED JUNE 30, 2010
Transportation Consortium
Intergovernmental Agreements Totals
Operating revenues: Charges for services Total operating revenues
Operating expenses: Cost of services Total operating expenses
Change in net assets
Total net assets, beginning of year, as restated
Total net assets, end of year
$ 8,475,419 $ 12,001 $ 8,487,420 8,475,419 12,001 8,487,420
8,583,179 10,782 8,593,961 8,583,179 10,782 8,593,961
(107,760) 1,219 (106,541)
403,378 8,659 412,037
$ 295,618 $ 9,878 $ 305,496
Page 115

YUMA ELEMENTARY SCHOOL DISTRICT NO. 1COMBINING STATEMENT OF CASH FLOWS
ALL INTERNAL SERVICE FUNDSFOR THE YEAR ENDED JUNE 30, 2010
Inter-Transportation governmentalConstortium Agreements Totals
Increase in Cash and Cash Equivalents
Cash flows from operating activities:Cash received for services $ 8,594,074 $ 12,001 $ 8,606,075Cash payments to employees for services (6,347,647) (656) (6,348,303)Cash payments to suppliers for goods and services (2,213,159) (10,126) (2,223,285)
Net cash provided by operating activities 33,268 1,219 34,487
Cash flows used for noncapital financing activities:Interfund borrowing (33,268) 8,659 (24,609)
Net cash used for noncapital financing activities (33,268) 8,659 (24,609)
Net increase in cash and cash equivalents 9,878 9,878
Cash and cash equivalents, beginning of year
Cash and cash equivalents, end of year $ $ 9,878 $ 9,878
Reconciliation of Operating Income to Net CashProvided by Operating Activities
Operating income $ (107,760) $ 1,219 $ (106,541)
Adjustments to reconcile operating income to net cash provided by operating activities:
Changes in assets and liabilities:Decrease in accounts receivable 5,369 5,369Decrease in due from governmental entities 153,204 153,204Decrease in inventory 89,580 89,580Decrease in accounts payable (63,208) (63,208)Decrease in unearned revenue (43,917) (43,917)
Total adjustments 141,028 141,028
Net cash provided by operating activities $ 33,268 $ 1,219 $ 34,487
Page 116

Page 117
AGENCY FUNDS Student Activities - to account for monies raised by students to finance student clubs and organizations but held by the District as an agent. Employee Withholding - to account for voluntary deductions temporarily held by the District as an agent. Payroll Tax Withholding - to account for employee payroll deductions held by the District as an agent.

YUMA ELEMENTARY SCHOOL DISTRICT NO. 1COMBINING STATEMENT OF FIDUCIARY ASSETS AND LIABILITIES
ALL AGENCY FUNDSJUNE 30, 2010
Student Activities
Employee Withholding
Payroll Tax Withholding Totals
ASSETSCash and investments Total assets
LIABILITIESDeposits held for othersDue to student groups Total liabilities
$ 121,765 $ 678,861 $ 6,682 $ 807,308 $ 121,765 $ 678,861 $ 6,682 $ 807,308
678,861 6,682 685,543 121,765 121,765
$ 121,765 $ 678,861 $ 6,682 $ 807,308
Page 118
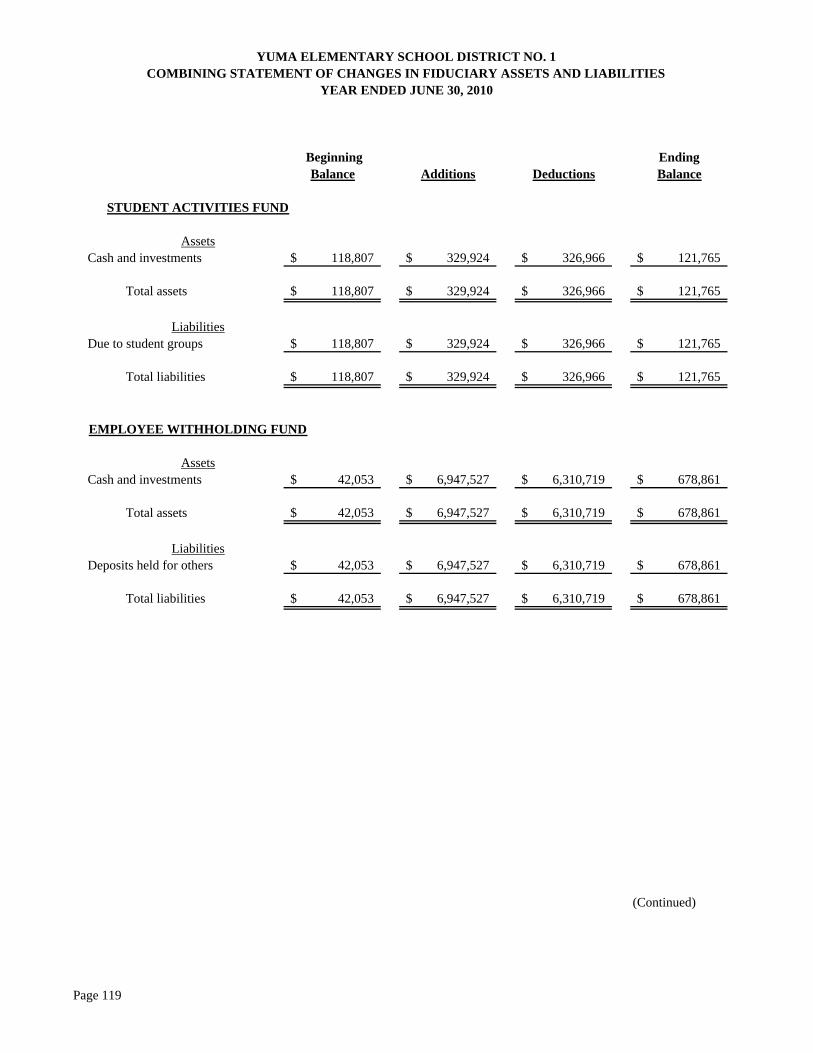
Beginning EndingBalance Additions Deductions Balance
STUDENT ACTIVITIES FUND
AssetsCash and investments 118,807$ 329,924$ 326,966$ 121,765$
Total assets 118,807$ 329,924$ 326,966$ 121,765$
LiabilitiesDue to student groups 118,807$ 329,924$ 326,966$ 121,765$
Total liabilities 118,807$ 329,924$ 326,966$ 121,765$
EMPLOYEE WITHHOLDING FUND
AssetsCash and investments 42,053$ 6,947,527$ 6,310,719$ 678,861$
Total assets 42,053$ 6,947,527$ 6,310,719$ 678,861$
LiabilitiesDeposits held for others 42,053$ 6,947,527$ 6,310,719$ 678,861$
Total liabilities 42,053$ 6,947,527$ 6,310,719$ 678,861$
(Continued)
YUMA ELEMENTARY SCHOOL DISTRICT NO. 1COMBINING STATEMENT OF CHANGES IN FIDUCIARY ASSETS AND LIABILITIES
YEAR ENDED JUNE 30, 2010
Page 119
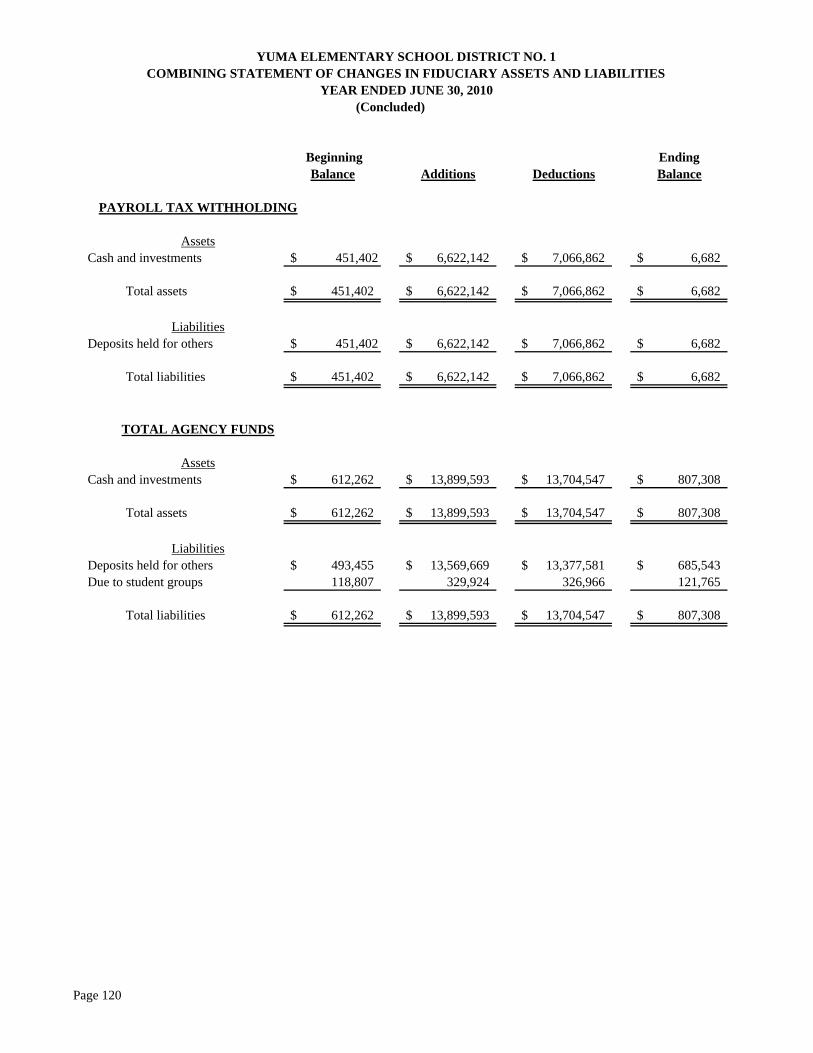
(Concluded)
Beginning EndingBalance Additions Deductions Balance
PAYROLL TAX WITHHOLDING
AssetsCash and investments 451,402$ 6,622,142$ 7,066,862$ 6,682$
Total assets 451,402$ 6,622,142$ 7,066,862$ 6,682$
LiabilitiesDeposits held for others 451,402$ 6,622,142$ 7,066,862$ 6,682$
Total liabilities 451,402$ 6,622,142$ 7,066,862$ 6,682$
TOTAL AGENCY FUNDS
AssetsCash and investments 612,262$ 13,899,593$ 13,704,547$ 807,308$
Total assets 612,262$ 13,899,593$ 13,704,547$ 807,308$
LiabilitiesDeposits held for others 493,455$ 13,569,669$ 13,377,581$ 685,543$ Due to student groups 118,807 329,924 326,966 121,765
Total liabilities 612,262$ 13,899,593$ 13,704,547$ 807,308$
COMBINING STATEMENT OF CHANGES IN FIDUCIARY ASSETS AND LIABILITIESYEAR ENDED JUNE 30, 2010
YUMA ELEMENTARY SCHOOL DISTRICT NO. 1
Page 120

Page 121
STATISTICAL SECTION
The statistical section presents financial statement trends well as detailed financial and operational information not available elsewhere in the report. The statistical section is intended to enhance the reader’s understanding of the information presented in the financial statements, notes to the financial statements, and other supplementary information presented in this report. The statistical section is comprised of the five categories of statistical information presented below.
Financial Trends
These schedules contain information on financial trends to help the reader understand how the District’s financial position and financial activities have changed over time.
Revenue Capacity
These schedules contain information to help the reader assess the factors affecting the District’s ability to generate revenue.
Debt Capacity
These schedules present information to help the reader evaluate the District’s current levels of outstanding debt as well as assess the District’s ability make debt payments and/or issue additional debt in the future.
Demographic and Economic Information These schedules present various demographic and economic indicators to help the reader understand the environment in which the District’s financial activities take place and to help make comparisons with other school districts.
Operating Information
These schedules contain information about the District’s operations and various resources to help the reader draw conclusions as to how the District’s financial information relates to the services provided by the District.

Page 122
(This page intentionally left blank)

2010 2009 2008 2007 2006Net Assets:
Invested in capital assets, net of related debt 48,272,831$ 47,863,747$ 46,001,308$ 42,944,537$ 39,792,502$ Restricted 4,127,647 2,241,892 2,034,359 2,812,096 2,912,449 Unrestricted 8,816,289 3,388,008 5,859,360 4,014,670 3,399,734
Total net assets 61,216,767$ 53,493,647$ 53,895,027$ 49,771,303$ 46,104,685$
2005 2004 2003 2002 2001Net Assets:
Invested in capital assets, net of related debt 35,323,348$ 32,718,875$ 29,815,557$ 25,283,133$ 24,339,425$ Restricted 2,795,045 3,606,473 2,093,248 1,349,765 1,239,067 Unrestricted 2,869,849 1,783,276 4,085,920 4,899,249 5,224,830
Total net assets 40,988,242$ 38,108,624$ 35,994,725$ 31,532,147$ 30,803,322$
Source: The source of this information is the District's financial records.
YUMA ELEMENTARY SCHOOL DISTRICT NO. 1NET ASSETS BY COMPONENT
LAST TEN FISCAL YEARS
Fiscal Year Ended June 30
(Accrual basis of accounting)
Page 123

2010 2009 2008 2007 2006
Instruction 35,226,598$ 41,511,092$ 42,824,714$ 41,830,766$ 41,901,577$ Support services - students and staff 7,435,370 8,247,852 10,670,712 11,135,861 11,888,748 Support services - administration 6,626,303 6,627,549 8,290,035 7,402,919 7,345,396 Operation and maintenance of plant services 7,324,094 9,138,417 8,309,975 8,506,845 7,370,955 Student transportation services 4,425,531 9,601,363 9,552,365 8,758,175 9,134,818 Operation of non-instructional services 4,781,711 4,969,641 5,253,686 4,816,402 4,688,602 Interest on long-term debt 697,491 831,330 975,295 1,092,456 1,289,496
Total expenses 66,517,098 80,927,244 85,876,782 83,543,424 83,619,592
Program RevenuesCharges for services:
Instruction 352,021 679,583 462,064 458,476 500,240Student transportation services 5,202,280 5,305,734 3,904,579 5,843,529Operation of non-instructional services 724,204 821,544 814,607 929,356 993,178Other activities 47,528 37,027 52,189 412,008 246,083
Operating grants and contributions 15,634,394 15,921,875 18,183,586 18,552,017 17,810,018 Capital grants and contributions 731,324 425,800 470,628 983,953 1,798,420
Total program revenues 17,489,471 23,088,109 25,288,808 25,240,389 27,191,468
Net (Expense)/Revenue (49,027,627)$ (57,839,135)$ (60,587,974)$ (58,303,035)$ (56,428,124)$
Page 124 (Continued)
LAST TEN FISCAL YEARS(Accrual basis of accounting)
Fiscal Year Ended June 30
Expenses
YUMA ELEMENTARY SCHOOL DISTRICT NO. 1EXPENSES, PROGRAM REVENUES, AND NET (EXPENSE)/REVENUE

2005 2004 2003 2002 2001Expenses
Instruction 39,342,335$ 37,496,923$ 35,449,097$ 35,234,254$ 29,904,559$ Support services - students and staff 9,066,209 6,997,125 6,715,505 4,855,973 4,475,274 Support services - administration 6,874,039 6,308,480 5,973,094 5,249,768 6,531,962 Operation and maintenance of plant services 7,036,285 6,011,218 6,544,670 6,866,678 5,451,778 Student transportation services 7,974,818 7,148,591 6,909,377 9,306,529 8,149,758 Operation of non-instructional services 4,410,470 4,217,018 4,113,486 4,188,450 4,264,936 Interest on long-term debt 1,291,447 1,492,108 1,493,555 1,591,594 1,718,066
Total expenses 75,995,603 69,671,463 67,198,784 67,293,246 60,496,333
Program RevenuesCharges for services:
Instruction 413,546 299,849 1,008,263 464,985 1,049,496Student transportation services 4,908,513 4,130,242 2,686,456 5,854,005 5,781,968Operation of non-instructional services 955,858 982,813 871,162 983,531 837,110Other activities 332,479 313,548 761,080 119,103 976,270
Operating grants and contributions 15,289,055 11,868,551 11,506,071 10,038,211 8,896,549Capital grants and contributions 545,929 391,067 132,536 1,182,395 1,343,121
Total program revenues 22,445,380 17,986,070 16,965,568 18,642,230 18,884,514
Net (Expense)/Revenue (53,550,223)$ (51,685,393)$ (50,233,216)$ (48,651,016)$ (41,611,819)$
Source: The source of this information is the District's financial records.Note:
Page 125 (Concluded)
(Accrual basis of accounting)LAST TEN FISCAL YEARS
Student transportation services expenses and charges for services: Student transportation services are not comparable to prior years due to a reclassification of funds in fiscal year 2010.
YUMA ELEMENTARY SCHOOL DISTRICT NO. 1EXPENSES, PROGRAM REVENUES, AND NET (EXPENSE)/REVENUE

2010 2009 2008 2007 2006
Net (Expense)/Revenue (49,027,627)$ (57,839,135)$ (60,587,974)$ (58,303,035)$ (56,428,124)$
General Revenues: Taxes:
Property taxes, levied for general purposes 9,806,589 9,819,129 11,228,363 10,641,011 11,217,872 Property taxes, levied for debt service 3,219,114 3,074,212 3,213,555 2,839,653 2,990,801Property taxes, levied for capital outlay 727,824 973,630 312,434 319,146 1,991,094
Investment income/(loss) 80,926 79,958 207,614 137,381 92,742Unrestricted county aid 984,150 20,353 738,334Unrestricted state aid 38,203,111 43,084,517 49,511,408 47,794,578 46,903,672Unrestricted federal aid 3,729,033 406,311 238,324 217,531 128,824
Total general revenues 56,750,747 57,437,757 64,711,698 61,969,653 64,063,339
Changes in Net Assets 7,723,120$ (401,378)$ 4,123,724$ 3,666,618$ 7,635,215$
Page 126 (Continued)
YUMA ELEMENTARY SCHOOL DISTRICT NO. 1GENERAL REVENUES AND TOTAL CHANGES IN NET ASSETS
LAST TEN FISCAL YEARS(Accrual basis of accounting)
Fiscal Year Ended June 30

2005 2004 2003 2002 2001
Net (Expense)/Revenue (53,550,223)$ (51,685,393)$ (50,233,216)$ (48,651,016)$ (41,611,819)$
General Revenues: Taxes:
Property taxes, levied for general purposes 7,623,237 8,757,700 9,638,591 9,809,630 8,822,851 Property taxes, levied for debt service 3,260,865 3,571,306 3,548,046 2,935,908 3,113,855Property taxes, levied for capital outlay 1,060,722 888,050 1,096,735 871,302 205,181
Investment income/(loss) 241,356 53,936 (39,124) 162,801 180,005Unrestricted county aid 752,376 778,928 770,073 757,600 761,008Unrestricted state aid 42,614,369 40,028,068 39,578,060 34,937,625 31,601,319Unrestricted federal aid 168,593 187,406 167,379 187,332 229,023
Total general revenues 55,721,518 54,265,394 54,759,760 49,662,198 44,913,242
Changes in Net Assets 2,171,295$ 2,580,001$ 4,526,544$ 1,011,182$ 3,301,423$
Source: The source of this information is the District's financial records.Notes: 1) In fiscal year 2003, investment income includes an investment loss suffered in the participation of the Local Government Investment Pool.
2) The Arizona State Legislature suspended county equalization payments to school districts for fiscal years 2006-07 through 2008-09.
(Concluded)
Page 127
GENERAL REVENUES AND TOTAL CHANGES IN NET ASSETSLAST TEN FISCAL YEARS(Accrual basis of accounting)
YUMA ELEMENTARY SCHOOL DISTRICT NO. 1

2010 2009 2008 2007 2006General Fund:
Reserved 257,070$ 346,650$ 357,281$ 307,628$ 235,180$ Unreserved 3,892,969 (2,096,260) 1,001,827 (580,594) (1,232,393)
Total General Fund 4,150,039$ (1,749,610)$ 1,359,108$ (272,966)$ (997,213)$
All Other Governmental Funds:Reserved 33,932$ 416,662$ 416,709$ 426,161$ 441,107$ Unreserved, reported in:
Special revenue funds 1,702,953 412,602 1,761,094 1,431,669 1,250,672 Capital projects funds 3,796,211 1,775,792 1,721,180 2,629,179 2,271,381 Debt service fund 83,803 196,596 306,910 180,669 465,040
Total all other governmental funds 5,616,899$ 2,801,652$ 4,205,893$ 4,667,678$ 4,428,200$
2005 2004 2003 2002 2001General Fund:
Reserved 432,085$ 345,087$ 427,023$ 659,580$ 786,977$ Unreserved (1,835,727) 390,364 544,004 989,722 585,611
Total General Fund (1,403,642)$ 735,451$ 971,027$ 1,649,302$ 1,372,588$
All Other Governmental Funds:Reserved 379,301$ 467,532$ 417,936$ 309,194$ 89,326$ Unreserved, reported in:
Special revenue funds 1,426,298 279,270 681,766 1,927,715 2,602,620 Capital projects funds 2,121,128 3,206,958 1,657,232 1,089,883 1,297,169 Debt service fund 586,967 358,808 384,402 (370,231) (205,628)
Total all other governmental funds 4,513,694$ 4,312,568$ 3,141,336$ 2,956,561$ 3,783,487$
Source: The source of this information is the District's financial records.
YUMA ELEMENTARY SCHOOL DISTRICT NO. 1FUND BALANCES - GOVERNMENTAL FUNDS
Fiscal Year Ended June 30
LAST TEN FISCAL YEARS(Modified accrual basis of accounting)
Page 128

2010 2009 2008 2007 2006Federal sources:
Federal grants 11,356,796$ 9,926,495$ 12,665,215$ 14,392,165$ 14,020,805$ Impact Aid 377,138 406,311 238,324 217,531 128,824 National School Lunch Program 4,370,517 4,252,039 4,238,728 4,373,612 3,945,675 ARRA State Fiscal Stablization 3,351,895
Total federal sources 19,456,346 14,584,845 17,142,267 18,983,308 18,095,304
State sources:State equalization assistance 37,366,663 38,046,297 43,787,820 42,386,945 37,128,803 State grants 732,368 1,894,226 676,439 740,378 760,550 School Facilities Board 425,573 1,508,690 4,498,450 Other revenues 2,635,556 3,252,812 5,201,583 4,361,466 4,813,896
Total state sources 40,734,587 43,193,335 50,091,415 48,997,479 47,201,699
Local sources:Property taxes 13,272,022 13,526,434 14,693,861 13,823,388 16,443,020 County aid 984,150 20,353 738,334 Food service sales 710,919 799,392 814,607 817,560 913,701 Investment income/(loss) 80,926 79,958 207,614 137,381 92,742 Other revenues 824,922 9,964,294 11,093,861 9,281,955 10,234,884
Total local sources 15,872,939 24,370,078 26,809,943 24,080,637 28,422,681
Total revenues 76,063,872$ 82,148,258$ 94,043,625$ 92,061,424$ 93,719,684$
2005 2004 2003 2002 2001Federal sources:
Federal grants 11,258,619$ 8,169,705$ 7,298,041$ 6,293,725$ 5,223,642$ Impact Aid 168,593 187,406 167,379 187,332 229,023 National School Lunch Program 3,817,527 3,456,738 3,380,571 3,207,594 3,205,889
Total federal sources 15,244,739 11,813,849 10,845,991 9,688,651 8,658,554 State sources:
State equalization assistance 35,818,846 34,758,541 33,007,647 32,050,944 30,643,384 State grants 766,434 778,501 974,793 832,907 652,375 School Facilities Board 3,238,112 2,511,451 3,949,681 777,497 815,110 Other revenues 3,961,823 2,525,508 2,612,548 2,865,846 1,103,151
Total state sources 43,785,215 40,574,001 40,544,669 36,527,194 33,214,020 Local sources:
Property taxes 11,793,444 13,333,154 14,379,449 13,674,754 12,075,922 County aid 752,376 778,928 770,073 757,600 761,008 Food service sales 870,542 904,448 871,162 983,531 835,383 Investment income/(loss) 241,356 53,896 (39,124) 158,146 175,759 Other revenues 8,706,344 8,405,965 7,183,432 6,499,853 7,918,320
Total local sources 22,364,062 23,476,391 23,164,992 22,073,884 21,766,392 Total revenues 81,394,016$ 75,864,241$ 74,555,652$ 68,289,729$ 63,638,966$
Source: The source of this information is the District's financial records.Notes: 1) In fiscal year 2003, investment income includes an investment loss suffered in the participation of the Local Government Investment Pool.
2) The Arizona State Legislature suspended county equalization payments to school districts for fiscal years 2006-07 through 2008-09.3) Other revenues is not comparable to prior years due to a reclassification of funds in fiscal year 2010.
Fiscal Year Ended June 30
YUMA ELEMENTARY SCHOOL DISTRICT NO. 1GOVERNMENTAL FUNDS REVENUES
LAST TEN FISCAL YEARS(Modified accrual basis of accounting)
Page 129

2010 2009 2008 2007 2006
Expenditures:Current -
Instruction 31,682,032$ 37,736,144$ 39,516,300$ 37,438,876$ 36,528,163$ Support services - students and staff 7,318,599 8,177,199 10,580,605 11,126,060 11,783,831 Support services - administration 6,477,170 6,546,299 7,849,792 7,455,432 7,009,468 Operation and maintenance of plant services 7,248,909 8,975,996 8,147,755 8,253,307 7,260,674 Student transportation services 3,840,958 12,412,972 12,969,308 12,328,029 12,431,554 Operation of non-instructional services 4,695,149 4,872,503 5,057,420 4,817,123 4,651,536
Capital outlay 1,840,890 3,036,754 3,728,656 6,002,351 9,062,259 Debt service -
Claims and judgments 176,089 Interest, premium and fiscal charges 683,079 816,918 960,883 1,078,044 1,275,084 Principal retirement 3,020,494 3,899,665 4,102,818 3,979,799 3,855,163 Payment to refunded bond escrow agent Bond issuance costs
Total expenditures 66,807,280$ 86,650,539$ 92,913,537$ 92,479,021$ 93,857,732$
Expenditures for capitalized assets 1,092,884$ 1,666,580$ 2,160,913$ 3,599,499$ 5,948,236$
Debt service as a percentage ofnoncapital expenditures 6% 6% 6% 6% 6%
Page 130 (Continued)
YUMA ELEMENTARY SCHOOL DISTRICT NO. 1GOVERNMENTAL FUNDS EXPENDITURES AND DEBT SERVICE RATIO
Fiscal Year Ended June 30
LAST TEN FISCAL YEARS(Modified accrual basis of accounting)

2005 2004 2003 2002 2001
Expenditures:Current -
Instruction 33,920,917$ 32,903,446$ 31,818,581$ 31,897,166$ 26,938,516$ Support services - students and staff 8,826,184 6,883,510 6,649,681 4,665,590 4,281,037 Support services - administration 6,352,193 5,921,808 5,148,372 4,937,650 5,651,422 Operation and maintenance of plant services 6,593,915 5,924,502 6,368,237 6,132,373 5,291,927 Student transportation services 10,449,309 9,932,630 9,777,092 8,632,589 7,579,155 Operation of non-instructional services 4,391,544 4,129,163 4,090,020 4,162,108 4,228,592
Capital outlay 9,849,964 9,654,649 7,352,142 5,325,025 4,910,757 Debt service -
Claims and judgmentsInterest, premium and fiscal charges 1,277,035 1,477,696 1,479,143 1,369,039 1,718,066 Principal retirement 3,686,496 2,779,140 2,770,422 2,629,203 2,638,004 Payment to refunded bond escrow agent 146,996 Bond issuance costs 237,381
Total expenditures 85,347,557$ 79,606,544$ 75,453,690$ 70,135,120$ 63,237,476$
Expenditures for capitalized assets 5,694,269$ 6,569,377$ 4,879,940$ 2,288,861$ 1,833,116$
Debt service as a percentage ofnoncapital expenditures 6% 6% 6% 6% 7%
Source: The source of this information is the District's financial records.Note: Student transportation services expenditures are not comparable to prior years due to a reclassification of funds in fiscal year 2010.
Page 131 (Concluded)
YUMA ELEMENTARY SCHOOL DISTRICT NO. 1GOVERNMENTAL FUNDS EXPENDITURES AND DEBT SERVICE RATIO
LAST TEN FISCAL YEARS(Modified accrual basis of accounting)

2010 2009 2008 2007 2006
Excess (deficiency) of revenues over expenditures 9,256,592$ (4,502,281)$ 1,130,088$ (417,597)$ (138,048)$
Other financing sources (uses):Issuance of refunding bondsPremium on sale of bondsCapital lease agreements 1,323,820 594,082 Transfers in 610,756 378,964 948,658 657,119 298,830 Transfers out (610,759) (378,964) (948,658) (657,119) (298,830) Payment to refunded bond escrow agent
Total other financing sources (3) - - 1,323,820 594,082
Changes in fund balances 9,256,589$ (4,502,281)$ 1,130,088$ 906,223$ 456,034$
2005 2004 2003 2002 2001
Excess (deficiency) of revenues over expenditures (3,953,541)$ (3,742,303)$ (898,038)$ (1,845,391)$ 401,490$
Other financing sources (uses):Issuance of refunding bonds 12,065,713 Premium on sale of bonds 794,842 Capital lease agreements 2,016,807 4,710,299 592,319 965,327 66,654 Transfers in 568,892 638,928 615,366 174,908 252,142 Transfers out (568,892) (638,928) (615,366) (174,908) (252,142) Payment to refunded bond escrow agent (12,623,174)
Total other financing sources 2,016,807 4,710,299 592,319 1,202,708 66,654
Changes in fund balances (1,936,734)$ 967,996$ (305,719)$ (642,683)$ 468,144$
Source: The source of this information is the District's financial records.
YUMA ELEMENTARY SCHOOL DISTRICT NO. 1OTHER FINANCING SOURCES AND USES AND NET CHANGES IN FUND BALANCES - GOVERNMENTAL FUNDS
LAST TEN FISCAL YEARS
Fiscal Year Ended June 30
(Modified accrual basis of accounting)
Page 132

FiscalYear Less: Total Taxable Total Estimated
Ended Residential Commercial Personal Tax Exempt Assessed Direct Actual June 30 Property Property Property Real Property Valuation Rate Value
2010 577,247,282$ 443,646,562$ 90,646,044$ 138,302,401$ 973,237,487$ 1.90 8,497,441,162$ 11.45 %2009 983,611,577 2.16 8,011,355,164 12.282008 741,463,792 2.66 6,004,856,311 12.352007 636,879,948 2.74 4,892,390,009 13.02 2006 475,658,502 3.91 3,718,231,058 12.79 2005 439,602,720 3.05 3,404,514,792 12.91 2004 423,114,455 3.42 3,250,920,187 13.02 2003 401,919,400 3.99 3,098,652,878 12.97 2002 368,415,708 4.07 2,894,202,834 12.732001 357,306,637 4.03 2,778,979,504 12.86
Source:Note: Total taxable assessed valuation is displayed by major component beginning with fiscal year ended June 30, 2010.
YUMA ELEMENTARY SCHOOL DISTRICT NO. 1ASSESSED VALUE AND ESTIMATED ACTUAL VALUE OF TAXABLE PROPERTY
LAST TEN FISCAL YEARS
Ratio of
The source of this information is the State and County Abstract of the Assessment Roll, Arizona Department of Revenue.
Net Assessed to EstimatedActual Value
Real Property
Page 133

Fiscal Year County Flood Community City Yuma
Ended Free Control College of UnionJune 30 County Library District District Yuma District Primary Secondary Total
2010 1.75 0.73 0.29 0.32 1.47 2.16 1.58 0.32 1.90 2009 1.88 0.77 0.32 1.99 1.56 2.67 1.82 0.34 2.16 2008 2.02 0.91 0.35 2.18 1.67 3.27 2.10 0.56 2.66 2007 2.14 0.91 0.35 2.37 1.73 3.01 1.98 0.76 2.74 2006 2.32 0.57 0.35 2.36 1.87 3.02 2.75 1.16 3.91 2005 2.32 0.57 0.35 2.08 1.87 3.07 1.79 1.26 3.05 2004 2.32 0.50 0.35 2.08 1.87 3.07 2.05 1.37 3.42 2003 2.32 0.50 0.35 2.08 1.86 3.54 2.56 1.43 3.99 2002 2.32 0.50 0.35 2.10 1.92 3.31 2.82 1.25 4.07 2001 2.32 0.50 0.35 2.10 1.99 0.00 2.49 1.54 4.03
YUMA ELEMENTARY SCHOOL DISTRICT NO. 1DIRECT AND OVERLAPPING PROPERTY TAX RATES
LAST TEN FISCAL YEARS
Source:
Overlapping Rates
District Direct Rates
The source of this information is the Property Tax Rates and Assessed Values, Arizona Tax Research Foundation.
Page 134

Secondary Assessed Valuation
Secondary Assessed Valuation
Arizona Public Service Company 59,410,706$ 6.10 % 23,320,714$ 6.33 %Wal-Mart Stores Inc. 9,756,210 1.00 Southwest Gas Corporation 8,213,268 0.84 3,094,692 0.84 Yuma Palms 1031 Delaware LLC 8,126,035 0.83 Qwest Communications 8,007,705 0.82 10,684,056 2.90 Union Pacific Railroad 6,067,138 0.62 1,915,762 0.52 Dole Fresh Vegetables 4,545,438 0.47 4,420,988 1.20 SFRR LP DBA Kinder Morgan Energy Partnership 3,750,015 0.39 Yuma Cogeneration Associates 3,704,190 0.38 Far West Water & Sewer, Inc. 3,573,079 0.37 Underhill Transfer Co. of Arizona 2,936,287 0.30 Imperial Irrigation District 2,936,287 0.30 Santa Fe Pacific Pipelines 2,726,276 0.74 Level 3 Communications HPI-FW West Partners Three 1,657,871 0.45 Weyerhauser Paper Company 2,210,494 0.60 San Diego Gas 2,063,128 0.56 Dayton-Hudson MN Corporation 1,547,346 0.42
Total 121,026,358$ 12.44 % 53,641,327$ 14.56 %
Source: The source of this information is the Yuma County Assessor's records.
YUMA ELEMENTARY SCHOOL DISTRICT NO. 1PRINCIPAL PROPERTY TAXPAYERS
CURRENT FISCAL YEAR AND NINE YEARS AGO
Percentage of District's Net
Assessed Valuation
Percentage of District's Net
Assessed Valuation
2002
Taxpayer
2010
Page 135

FiscalYear Taxes Levied Collections in
Ended for the Subsequent June 30 Fiscal Year Amount Fiscal Years Amount
2010 13,523,073$ 11,281,538$ 83.42 % $ 11,281,538$ 83.42 %2009 13,889,594 13,190,270 94.97 508,795 13,699,065 98.632008 14,836,455 14,320,194 96.52 497,315 14,817,509 99.872007 13,790,944 13,492,957 97.84 288,018 13,780,975 99.932006 16,552,230 16,125,255 97.42 418,237 16,543,492 99.952005 12,254,106 11,793,444 96.24 456,120 12,249,564 99.962004 13,011,955 12,588,042 96.74 312,554 12,900,596 99.142003 13,484,421 12,877,478 95.50 606,943 13,484,421 100.002002 12,300,177 11,816,159 96.06 484,018 12,300,177 100.002001 11,805,980 11,346,552 96.11 459,428 11,805,980 100.00
Source: The source of this information is the Yuma County Treasurer's records.Notes: 1) Amounts collected are on a cash basis.
2) Unsecured personal property taxes are not included in this schedule because the dates of the monthly rolls vary each year. On the average, 90% of unsecured property taxes are collected within 90 days after the due date.
of LevyPercentage
of LevyPercentage
Fiscal Year of the LevyCollected within the
of the Current Fiscal Year
YUMA ELEMENTARY SCHOOL DISTRICT NO. 1PROPERTY TAX LEVIES AND COLLECTIONS
LAST TEN FISCAL YEARS
Collected to the End
Page 136

Fiscal Less:Year General Amounts Percentage of Percentage of Percentage of
Ended Obligation Restricted for Estimated Per Capital Estimated Per Personal June 30 Bonds Principal Total Actual Value Capita Leases Total Actual Value Capita Income
2010 13,660,713$ 2,605,713$ 11,055,000$ 0.13 % $ 122 302,873$ 11,357,873$ 0.13 % 126$ N/A %2009 16,060,713 2,400,000 13,660,713 0.17 151 717,654 14,378,367 0.18 159 2.97 2008 18,400,713 2,340,000 16,060,713 0.27 178 2,217,319 18,278,032 0.30 202 4.23 2007 20,620,713 2,220,000 18,400,713 0.38 213 3,980,137 22,380,850 0.46 259 5.49 2006 22,750,713 2,130,000 20,620,713 0.55 243 4,416,116 25,036,829 0.67 295 6.56 2005 24,785,713 2,035,000 22,750,713 0.67 271 5,547,197 28,297,910 0.83 337 7.94 2004 26,100,713 1,315,000 24,785,713 0.76 297 5,181,886 29,967,599 0.92 360 9.12 2003 27,890,713 1,790,000 26,100,713 0.84 321 1,390,727 27,491,440 0.89 338 8.30 2002 29,680,713 1,755,000 27,925,713 0.96 360 1,312,728 29,238,441 1.01 377 9.82 2001 31,102,950 1,712,950 29,390,000 1.06 393 1,221,604 30,611,604 1.10 409 11.53
Source: The source of this information is the District's financial records.
General Obligation Bonds Total Outstanding Debt
YUMA ELEMENTARY SCHOOL DISTRICT NO. 1OUTSTANDING DEBT BY TYPE
LAST TEN FISCAL YEARS
Page 137

Estimated EstimatedPercentage Amount
Debt Applicable to Applicable toOutstanding School District School District
Yuma/La Paz Counties Community College District 73,480,000$ 66.25 % 48,680,500$ Yuma Union High School District No. 70 51,975,000 100.00 51,975,000
Subtotal, Overlapping Debt 100,655,500
Direct:Yuma Elementary School District No. 1 11,357,873
Total Direct and Overlapping Debt 112,013,373$
Source:
Note:District's secondary assessed valuation as a percentage of the secondary assessed valuation of the overlapping jurisdiction.
Estimated percentage of debt outstanding applicable to the District is calculated based on the
The source of this information is the District's records and the State and County Abstract of the Assessment Arizona Department of Revenue and the applicable governmental unit.
YUMA ELEMENTARY SCHOOL DISTRICT NO. 1DIRECT AND OVERLAPPING GOVERNMENTAL ACTIVITIES DEBT
JUNE 30, 2010
Governmental Unit
Page 138

Class B Bond Legal Debt Margin Calculation for Fiscal Year 2010: Legal Debt Margin Calculation for Fiscal Year 2010:Secondary assessed valuation 973,237,487$ Secondary assessed valuation 973,237,487$ Debt limit (5% of assessed value) 48,661,874 Debt limit (15% of assessed value) 145,985,623 Debt applicable to limit NONE Debt applicable to limit 11,055,000 Legal debt margin 48,661,874$ Legal debt margin 134,930,623$
2010 2009 2008 2007 2006
Debt limit 145,985,623$ 147,541,737$ 111,219,569$ 95,531,992$ 71,348,775$
Total net debt applicable to limit 11,055,000 13,660,713 16,060,713 18,400,713 20,620,713
Legal debt margin 134,930,623$ 133,881,024$ 95,158,856$ 77,131,279$ 50,728,062$
Total net debt applicable to the limit as a percentage of debt limit 8% 9% 14% 19% 29%
2005 2004 2003 2002 2001
Debt limit 65,940,408$ 63,467,168$ 60,287,910$ 55,262,356$ 53,595,996$
Total net debt applicable to limit 22,750,713 24,785,713 26,100,713 27,925,713 29,390,000
Legal debt margin 43,189,695$ 38,681,455$ 34,187,197$ 27,336,643$ 24,205,996$
Total net debt applicable to the limit as a percentage of debt limit 35% 39% 43% 51% 55%
Source: The source of this information is the District's financial records. Note: The District's general obligation bonds are subject to two limits; the constitutional debt limit (total debt limit) on all general
obligation bonds and the statutory debt limit on class B bonds. The calculations of the debt margin are presented in detail for the current fiscal year only.
YUMA ELEMENTARY SCHOOL DISTRICT NO. 1LEGAL DEBT MARGIN INFORMATION
LAST TEN FISCAL YEARS
Fiscal Year Ended June 30
Page 139
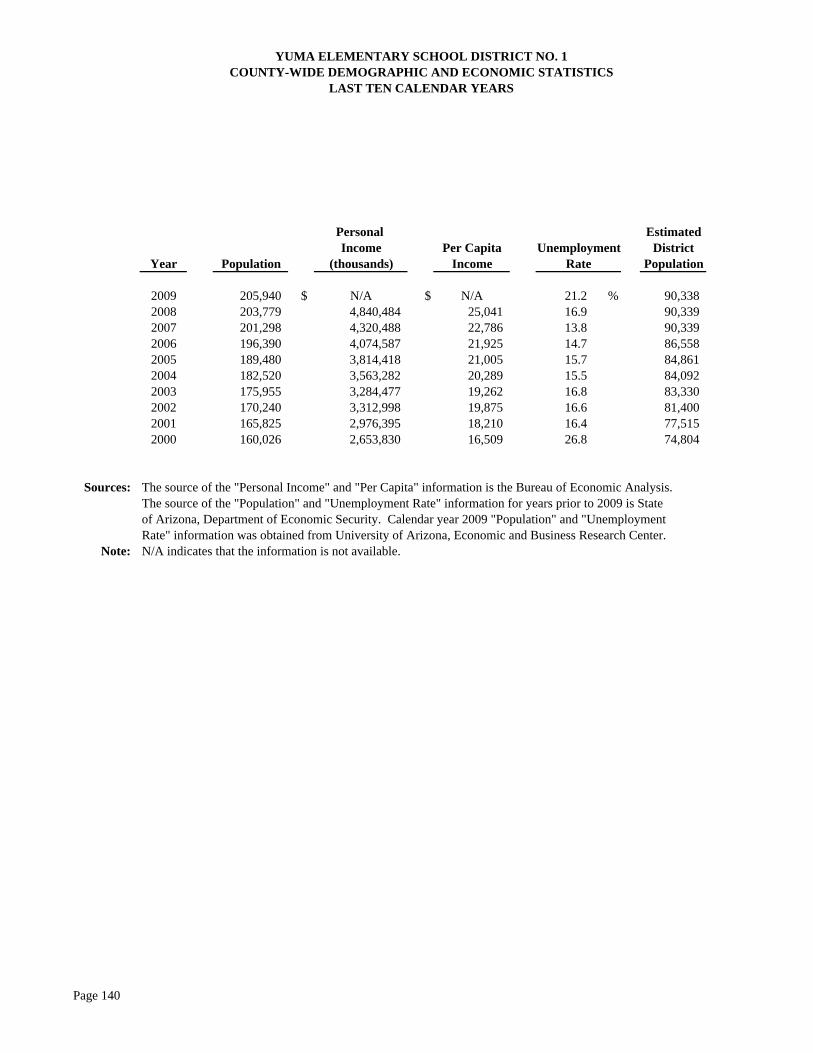
Personal EstimatedIncome Per Capita District
Year Population (thousands) Income Population
2009 205,940 $ N/A $ N/A % 90,338 2008 203,779 4,840,484 25,041 90,339 2007 201,298 4,320,488 22,786 90,339 2006 196,390 4,074,587 21,925 86,558 2005 189,480 3,814,418 21,005 15.7 84,861 2004 182,520 3,563,282 20,289 15.5 84,092 2003 175,955 3,284,477 19,262 16.8 83,330 2002 170,240 3,312,998 19,875 16.6 81,400 2001 165,825 2,976,395 18,210 16.4 77,515 2000 160,026 2,653,830 16,509 26.8 74,804
Sources: The source of the "Personal Income" and "Per Capita" information is the Bureau of Economic Analysis.The source of the "Population" and "Unemployment Rate" information for years prior to 2009 is State of Arizona, Department of Economic Security. Calendar year 2009 "Population" and "UnemploymentRate" information was obtained from University of Arizona, Economic and Business Research Center.
Note: N/A indicates that the information is not available.
YUMA ELEMENTARY SCHOOL DISTRICT NO. 1COUNTY-WIDE DEMOGRAPHIC AND ECONOMIC STATISTICS
LAST TEN CALENDAR YEARS
13.8 14.7
UnemploymentRate
16.9 21.2
Page 140

Percentage Percentageof Total of Total
Employees Employment Employees Employment
U.S. Marine Corps Air Station 7,093 10.3 % 6,200 9.1 %Yuma Proving Ground 2,319 3.4 1,655 2.4 Yuma Elementary School District No. 1 1,263 1.9 690 1.0 Yuma Regional Medical Center 2,037 3.0 1,750 2.6 Grower's Company Inc. 1,400 2.1 250 0.4 Yuma County 1,400 2.1 1,100 1.6 City of Yuma 1,200 1.8 1,050 1.5 Yuma Union High School District No. 70 950 1.4 750 1.1 Dole Corp. 800 1.2 Salyer American Fresh 750 1.1 500 0.7
Total 18,412 27.0 % 14,745 21.6 %
Total employment 68,239 68,130
Source: The source of this information is the Greater Yuma Economic Development Corporation.
YUMA ELEMENTARY SCHOOL DISTRICT NO. 1PRINCIPAL EMPLOYERS
CURRENT FISCAL YEAR AND NINE YEARS AGO
Employer
2010 2002
Page 141

2010 2009 2008 2007 2006
SupervisoryConsultants/supervisors of instruction 4 4 4 4 4 Principals 16 17 18 18 19 Assistant principals 7 6 7 6 7
Total supervisory 27 27 29 28 30 Instruction
Teachers 493 513 554 587 590 Other professionals (instructional) 36 36 36 43 46 Aides 145 126 175 170 189
Total instruction 674 675 765 800 825 Student Services
Librarians 14 14 15 17 Technicians 22 20 20 20 20
Total student services 22 34 34 35 37 Support and Administration
Service workers 507 512 598 598 641 Total support and administration 507 512 598 598 641
Total 1,230 1,248 1,426 1,461 1,533
(Continued)Page 142
Full-time Equivalent Employees as of June 30
LAST NINE FISCAL YEARS
YUMA ELEMENTARY SCHOOL DISTRICT NO. 1FULL-TIME EQUIVALENT DISTRICT EMPLOYEES BY TYPE

2005 2004 2003 2002
SupervisoryConsultants/supervisors of instruction 4 4 4 4 Principals 18 17 16 15 Assistant principals 7 6 5 4
Total supervisory 29 27 25 23 Instruction
Teachers 599 585 563 541 Other professionals (instructional) 43 43 41 39 Aides 150 152 148 140
Total instruction 792 780 752 720 Student Services
Librarians 14 14 13 1 Technicians 19 18 17 16
Total student services 33 32 30 17 Support and Administration
Service workers 610 478 463 454 Total support and administration 610 478 463 454
Total 1,464 1,317 1,270 1,214
Source: The source of this information is the District's personnel records.
(Concluded)Page 143
YUMA ELEMENTARY SCHOOL DISTRICT NO. 1FULL-TIME EQUIVALENT DISTRICT EMPLOYEES BY TYPE
LAST NINE FISCAL YEARS

FiscalYear Average Cost Cost Pupil-
Ended Daily Operating per Percentage per Percentage Teaching TeacherJune 30 Membership Expenditures Pupil Change Expenses Pupil Change Staff Ratio
2010 9,386 61,262,817$ 6,527$ (20.80) % 66,517,098$ 7,087$ (16.35) % 493 19.0 68 %2009 9,552 78,721,113 8,241 (3.06) 80,927,244 8,472 (2.38) 513 18.6 672008 9,895 84,121,180 8,501 6.55 85,876,782 8,679 6.00 554 17.9 67 2007 10,204 81,418,827 7,979 6.18 83,543,424 8,187 3.80 587 17.4 67 2006 10,601 79,665,226 7,515 12.72 83,619,592 7,888 9.81 636 16.7 73 2005 10,580 70,534,062 6,667 (0.38) 75,995,603 7,183 1.21 642 16.5 70 2004 9,817 65,695,059 6,692 (1.31) 69,671,463 7,097 (0.54) 628 15.6 68 2003 9,417 63,851,983 6,781 6.97 67,198,784 7,136 1.09 604 15.6 70 2002 9,533 60,427,476 6,339 11.80 67,293,246 7,059 11.07 580 16.4 67 2001 9,519 53,970,649 5,670 N/A 60,496,333 6,355 N/A 568 16.8 N/A
Source: The source of this information is the District's financial records.Notes: 1) Operating expenditures are total expenditures less debt service and capital outlay.
2) N/A indicates that the information is not available.
Free/ReducedStudents
YUMA ELEMENTARY SCHOOL DISTRICT NO. 1OPERATING STATISTICSLAST TEN FISCAL YEARS
Percentage of
Page 144

2010 2009 2008 2007 2006 2005 2004 2003 2002 2001
SchoolsElementary
Buildings 13 13 14 14 14 13 13 13 13 13Square feet 682,031 682,031 715,202 715,202 715,202 660,964 660,964 660,964 660,964 660,964Capacity 7,175 7,175 8,875 8,875 8,875 8,125 8,125 8,125 8,125 8,125Enrollment 6,779 6,730 7,245 7,419 7,392 7,534 7,566 7,638 7,506 7,506
MiddleBuildings 5 5 5 5 5 5 4 4 4 4Square feet 377,168 377,168 377,168 377,168 377,168 377,168 335,880 335,880 335,880 335,880Capacity 3,778 3,778 3,480 3,480 3,480 3,480 2,830 2,830 2,830 2,830Enrollment 3,146 3,378 3,266 3,231 3,209 3,211 3,064 2,791 2,623 2,323
AdministrativeBuildings 5 5 4 4 4 4 4 4 4 4Square feet 69,310 69,310 36,139 36,139 36,139 36,139 36,139 36,139 36,139 36,139
AthleticsSoccer fields 5 5 5 5 5 5 4 4 4 4Running tracks 5 5 5 5 5 5 4 4 4 4Baseball/softball 5 5 5 5 5 5 4 4 4 4Playgrounds 19 19 19 19 19 18 17 17 17 17
Source: The source of this information is the District's facilities records.
YUMA ELEMENTARY SCHOOL DISTRICT NO. 1CAPITAL ASSETS INFORMATION
LAST TEN FISCAL YEARS
Fiscal Year Ended June 30
Page 145

Page 146
(This page intentionally left blank)