Embed Size (px)
Citation preview

B/WCONFIRMING
PROOF
mol70822_ch03.qxd 7/19/06 3:36 PM Page 81
183
“All the flowers of all the tomorrows are in the seeds of today.”
Chinese proverb
Chapter 8 Population Genetics and Natural Selection 184
Chapter 9 Population Distribution and Abundance 210
Chapter 10 Population Dynamics 231
Chapter 11 Population Growth 254
Chapter 12 Life Histories 272
POPULATIONECOLOGY
mol70822_ch08.qxd 7/26/06 9:47 AM Page 183

B/WCONFIRMING
PROOF
mol70822_ch03.qxd 7/19/06 3:36 PM Page 81
184
Outline
Concepts 186
8.1 Variation Within Populations 187Concept 8.1 Review 192
8.2 Hardy-Weinberg 193Concept 8.2 Review 195
8.3 The Process of Natural Selection 195Concept 8.3 Review 197
8.4 Evolution by Natural Selection 197
Investigating the Evidence 8: Estimating Heritability Using Regression Analysis 198
Concept 8.4 Review 202
8.5 Change Due to Chance 202Concept 8.5 Review 205
Applications: Estimating Genetic Variation in Populations 205
Summary 207
Key Terms 208
Review Questions 208
Suggested Readings 209
Population Geneticsand Natural Selection
mol70822_ch08.qxd 7/26/06 9:11 AM Page 184

B/WCONFIRMING
PROOF
mol70822_ch03.qxd 7/19/06 3:36 PM Page 81
Chapter 8 Population Genetics and Natural Selection 185
history of science. Darwin’s wondering, carefully organizedand supported by a lifetime of observation, would become thetheory of evolution by natural selection, a theory that wouldtransform the prevailing scientific view of life on earth andrebuild the foundations of biology.
Darwin left the Galápagos Islands convinced that thevarious populations on the islands were gradually modifiedfrom their ancestral forms. In other words, Darwin con-cluded that the island populations had undergone a process ofevolution, a process that changes populations of organismsover time. Though Darwin left the Galápagos convinced thatthe island populations had evolved, he had no mechanismto explain the evolutionary changes. However, a plausiblemechanism to produce evolutionary change in populationscame to Darwin almost exactly 3 years after his taking leaveof the Galápagos Islands. In October of 1838 while readingthe essay on populations by Thomas Malthus, Darwin wasconvinced that during competition for limited resources,such as food or space, among individuals within popula-tions, some individuals would have a competitive advan-tage. He proposed that the characteristics producing thatadvantage would be “preserved” and the unfavorable char-acteristics of other individuals would be “destroyed.” As aconsequence of this process of selection by the environment,populations would change over time. With this mechanismfor change in hand, Darwin sketched out the first draft of histheory of natural selection in 1842. However, it would takehim many years and many drafts before he honed the theoryto its final form and amassed sufficient supporting informa-tion. Darwin’s theory of natural selection can be summa-rized as follows:
1. Organisms beget like organisms. (Offspring appear,behave, function, and so forth like their parents.)
2. There are chance variations between individuals in aspecies. Some variations (differences among parents)are heritable (are passed on to offspring).
3. More offspring are produced each generation than can besupported by the environment.
4. Some individuals, because of their physical or behavioraltraits, have a higher chance of surviving and reproduc-ing than other individuals in the same population.
Darwin (1859) proposed that differential survival and repro-duction of individuals would produce changes in speciespopulations over time. That is, the environment acting onvariation among individuals in populations would result inadaptation of the population to the environment. He now hada mechanism to explain the differences among populationsthat he had observed on the Galápagos Islands. Still, Darwinwas keenly aware of a major insufficiency in his theory. Thetheory of natural selection depended upon the passage of“advantageous” characteristics from one generation to thenext. The problem was that the mechanisms of inheritancewere unknown in Darwin’s time. In addition, the prevailingidea at the time, blending inheritance, suggested that raretraits, no matter how favorable, would be blended out of apopulation, preventing change as a consequence.
Darwin’s theory of evolution by natural selection,the unifying concept of modern biology, wascrystallized by his observations in the Galápagos
Islands. In mid October of 1835 under a bright equatorial sun,a small boat moved slowly from the shore of a volcanicisland to a waiting ship. The boat carried a young naturalistwho had just completed a month of exploring the group ofislands known as the Galápagos, which lie on the equatorapproximately 1,000 km west of the South American main-land (fig. 8.1). As the seamen rowed into the oncomingwaves, the naturalist, Charles Darwin, mused over what hehad found on the island. His observations had confirmedexpectations built on information gathered earlier on theother islands he had visited in the archipelago. Later Darwinrecorded his thoughts in his journal which he later published(Darwin 1839), “The distribution of the tenants of this arch-ipelago would not be nearly so wonderful, if, for instance, oneisland had a mocking-thrush, and a second island some otherquite distinct genus—if one island had its genus of lizard anda second island another distinct genus, or none whatever. . . .But it is the circumstance, that several of the islands possesstheir own species of the tortoise, mocking-thrush, finches, andnumerous plants, these species having the same generalhabits, occupying analogous situations, and obviously fillingthe same place in the natural economy of this archipelago,that strikes me with wonder” [emphasis added].
Darwin wondered at the sources of the differencesamong clearly related populations and attempted to explainthe origin of these differences. He would later conclude thatthese populations were descended from common ancestorswhose descendants had changed after reaching each of theislands. The ship to which the seamen rowed was the H.M.S.Beagle, halfway through a voyage around the world. Themain objective of the Beagle’s mission, charting the coasts ofsouthern South America would be largely forgotten, while thethoughts of the young Charles Darwin would eventuallydevelop into one of the most significant theories in the
Figure 8.1 On the Galápagos Islands Charles Darwinencountered many examples of plant and animal species thatdiffered physically from one island to another. Here a Galápagoshawk lands on a giant tortoise for which the islands are named.
mol70822_ch08.qxd 7/26/06 9:11 AM Page 185

B/WCONFIRMING
PROOF
mol70822_ch03.qxd 7/19/06 3:36 PM Page 81
Darwin worked for nearly half a century to uncover thelaws of inheritance. However, he did not. To do so required afacility with mathematics that Darwin had not developed. Ina short autobiography, Darwin (1859) remarked, “I attemptedmathematics, and even went during the summer of 1828 witha private tutor . . . but I got on very slowly. The work wasrepugnant to me, chiefly from my not being able to see anymeaning in the early steps in algebra. This impatience was veryfoolish, and in after years I have deeply regretted that I did notproceed far enough at least to understand something of thegreat leading principles of mathematics, for men thusendowed seem to have an extra sense” [emphasis added].
As Darwin explored the Galápagos Islands, halfwayaround the world in central Europe a schoolboy namedJohann Mendel was developing the facility with mathemat-ics necessary to complete Darwin’s theory of natural selec-tion. At thirteen, Johann was half Darwin’s age, yet he hadalready set a course for a life of study which he followed asresolutely as the crew of the Beagle on their voyage aroundthe world. At the end of his scientific voyage, Mendel, whowould be renamed Gregor Mendel when he became anAugustinian monk, would uncover the basic mechanisms ofinheritance.
How did Mendel succeed, while so many others hadfailed? The sources of his success can be traced to his edu-cation and his own special genius. Mendel’s education at theUniversity of Vienna exposed him to some of the best mindsworking in the physical sciences and to an approach to sci-ence that emphasized experimentation. His introduction to thephysical sciences included a solid foundation in mathemat-ics, including probability and statistics. As a consequence,Mendel could quantify the results of his experimentalresearch.
Mendel chose to work with plants which could be main-tained in the abbey garden. His most famous and influentialwork was done on the garden pea, Pisum sativum, that hasmany desirable traits (fig. 8.2). Many domestic varieties ofpeas, which showed a great deal of physical variation, withits attendant underlying genetic variation, were available toMendel. However, he subjected the phenotypes of his studyorganisms to careful analysis. Rather than treat the phenotypeas a whole, Mendel subdivided the organism into a set ofmanageable characteristics such as seed form, stem length,and so forth, which it turned out were controlled by individ-ual genes. He also discovered that genes come in alternativeforms, which we call alleles, some of which are “dominant”and others “recessive.” This analytical perspective of hisstudy organisms was probably another legacy of his trainingin the physical sciences. Finally, to his excellent educationand genius, Mendel added a lot of hard work and persever-ance (Orel 1996).
Darwin and Mendel complemented each other perfectlyand their twin visions of the natural world revolutionizedbiology. The synthesis of the theory of natural selection andgenetics gave rise to modern evolutionary ecology, a verybroad field of study. Here we examine five major conceptswithin that broad discipline.
8.1 Phenotypic variation among individuals in apopulation results from the combined effects ofgenes and environment.
8.2 The Hardy-Weinberg equilibrium model helpsidentify evolutionary forces that can change genefrequencies in populations.
8.3 Natural selection is the result of differences insurvival and reproduction among phenotypes.
8.4 The extent to which phenotypic variation is due togenetic variation determines the potential forevolution by natural selection.
8.5 Random processes, such as genetic drift, canchange gene frequencies in populations, especiallyin small populations.
186 Section III Population Ecology
Figure 8.2 Garden pea plant in flower. Because the gardenpea normally self-pollinates, Mendel could keep track of andcontrol mating in his study plants.
mol70822_ch08.qxd 7/26/06 9:11 AM Page 186

B/WCONFIRMING
PROOF
mol70822_ch03.qxd 7/19/06 3:36 PM Page 81
8.1 Variation WithinPopulations
Phenotypic variation among individuals in a populationresults from the combined effects of genes and environ-ment. Because phenotypic variation is the substrate uponwhich the environment acts during the process of naturalselection, determining the extent and sources of variationwithin populations is one of the most fundamental considera-tions in evolutionary studies. The following examples reviewvariation in representative plant and animal populations andsome of the early methods used to uncover that variation.
Variation in Plant PopulationsDarwin’s theory of natural selection sparked a revolution inthinking among biologists, who responded almost immedi-ately by studying variation among organisms in all sorts ofenvironments. The first of these biologists to conduct trulythorough studies of variation and to incorporate experimen-tation in their studies, focused on plants.
Phenotypic and Genetic Variation in Potentilla glandulosaJens Clausen, David Keck, and William Hiesey, who workedat Stanford University in California, conducted some of themost widely cited studies of plant variations. Their studiesprovided deep insights into the extent and sources of mor-phological variation in plant populations, including both theinfluence of environment and genetics. Though this researchgroup and its successors studied nearly 200 species, it is bestknown for its work on Potentilla glandulosa or stickycinquefoil (fig. 8.3) (Clausen, Keck, and Hiesey 1940).
Clausen and his research team worked with clones of sev-eral populations of P. glandulosa, which they grew in threemain experimental gardens—one at Stanford near the coast atan elevation of 30 m, another in a montane environment atMather at an elevation of 1,400 m in the Sierra Nevada, anda third garden in an alpine environment at Timberline at3,050 m (fig. 8.4). By cloning lowland, mid-elevation, andalpine plants and growing them in experimental gardens,Clausen, Keck, and Hiesey established experimental condi-tions that could reveal potential genetic differences amongpopulations. In addition, because they studied the responsesof plants from all populations to environmental conditions inlowland, mid-elevation, and alpine gardens, their experimentcould demonstrate adaptation by P. glandulosa populations tolocal environmental conditions.
The growth response of P. glandulosa to environmentalconditions at the three common garden sites is summarizedin figure 8.4. Plant height differed significantly among thestudy sites, which shows an environmental effect on plantmorphology, but the lowland, mid-elevation and alpineplants responded differently to the three environments. Forinstance, while the mid-elevation and alpine plants attainedtheir greatest height in the mid-elevation garden, the lowlandplants grew the tallest in the lowland garden. The number of
flowers produced also indicated differences among theplant populations. In the gardens corresponding to their nat-ural elevations, the mid-elevation and alpine plants pro-duced more flowers compared to plants from the other sites.The lowland plants, in contrast, did not produce the mostflowers in any of the experimental gardens. These differencesin response indicate genetic differences among populationsof P. glandulosa.
Other information indicates that genetic differencesamong the plants are associated with adaptation to the envi-ronments of the native elevation. It is clear that lowland eco-types of P. glandulosa are excluded from the alpine. Mostdied during their first winter in the alpine garden and those thatsurvived flowered during the following summer but theirfruits did not mature. Mid-elevation P. glandulosa also sur-vived poorly in the alpine and their fruits often failed tomature. Alpine plants showed the opposite trends. They hadpoor survival in the lowland garden and went dormant in win-ter, while the lowland plants remained active. In summary,the experiments of Clausen, Keck, and Hiesey demonstratedgenetic differences among populations and adaptation to theirnatural environments. Ecologists call such locally adaptedand genetically distinctive populations within a speciesecotypes. Applying this term then, we can conclude that thelowland, mid-elevation, and alpine populations studied byClausen, Keck, and Hiesey were ecotypes. Using transplant
Chapter 8 Population Genetics and Natural Selection 187
Figure 8.3 Potentilla glandulosa, sticky cinquefoil, growsfrom sea level to over 3,000 m elevation and shows remarkablemorphological variation along this elevational gradient.
mol70822_ch08.qxd 7/26/06 2:36 PM Page 187

B/WCONFIRMING
PROOF
mol70822_ch03.qxd 7/19/06 3:36 PM Page 81
and common garden approaches ecologists have learned agreat deal about genetic variation among and within plantpopulations. These classical approaches combined with mod-ern molecular techniques are rapidly increasing our knowledgeof genetic variation in natural populations.
Combining Molecular and Morphological InformationIn the previous classic example, Clausen, Keck, and Hieseyused differences in growth form of P. glandulosa plants
grown in common gardens to infer genetic differencesamong populations of this species. More recently, KjellHansen, Reidar Elven, and Christian Brochmann combinedmolecular and morphological techniques to explore geneticvariation in populations of Potentilla species living on Spits-bergen Island in the high Arctic. Spitsbergen is the largestisland in the Svalbard archipelago, a far northern part of thecountry of Norway (fig. 8.5).
Hansen, Elven, and Brochmann (2000) were interested inwhether a combination of genetic and morphological infor-mation could help them understand the complex variation of
188 Section III Population Ecology
P. glandulosa transplanted from alpineand mid-elevation to lowland garden; grown beside lowland plants.
Alpine—3,050 m(Timberline)Mid-elevation—1,400 m
(Mather)Lowland—30 m(Stanford)
Coastal Range
Sierra Nevada Range
San Joaquin Valley
Transplant design:
Cross section of California
P. glandulosa transplanted fromlowland and alpine to mid-elevation garden; grown beside mid-elevation plants.
P. glandulosa transplanted fromlowland and mid-elevation to alpinegarden; grown beside alpine plants.
Null hypothesis: No genetic differences (variation) among populations.
If there were no genetic differences amongpopulations, all plants would grow equallywell in all gardens.
Differences in growth in gardens indicatedgenetic differences (variations) amongpopulations.
Lowlandplants
Mid-elev.plants
Alpineplants
80
40
0
Lowland garden
Lowlandplants
Mid-elev.plants
Alpineplants
80
40
0
Mid-elevation garden
Lowlandplants
Mid-elev.plants
Alpineplants
80
40
0
Alpine garden
Plan
t hei
ght (
cm)
Lowlandplants
Mid-elev.plants
Alpineplants
80
40
0
Lowland garden
Lowlandplants
Mid-elev.plants
Alpineplants
80
40
0
Mid-elevation garden
Lowlandplants
Mid-elev.plants
Alpineplants
80
40
0
Alpine garden
Plan
t hei
ght (
cm)
Results: Did not support null hypothesis.
Figure 8.4 A common garden approach to studying genetic variation among populations of Potentilla glandulosa (data from Clausen,Keck, and Hiesey 1940).
mol70822_ch08.qxd 7/26/06 9:11 AM Page 188

B/WCONFIRMING
PROOF
mol70822_ch03.qxd 7/19/06 3:36 PM Page 81
the type seen in Potentilla species (see fig. 8.4). One of thequestions addressed by this team from the Botanical Gardenand Museum of the University of Oslo, Norway concerned agroup of forms known as the Potentilla nivea complex.Based on morphological evidence, the complex had beendivided into three species: P. chamissonis, P. insularis, andP. nivea. A second problem addressed by the researchers waswhether three distinctive forms of P. pulchella should be rec-ognized as different taxa, perhaps varieties or subspecies,within P. pulchella. The typical form of P. pulchella is largeand hairy and grows in a variety of habitats, including cliffs,in cliff meadows where seabirds deposit significant quantitiesof feces, and on ridges. A second form of P. pulchella, whichis small and lacks abundant hairs, grows on gravel terracesalong shorelines. The third form is small and hairy andgrows on silty shoreline terraces.
Hansen, Elven, and Brochmann sampled 17 populationsof Potentilla. The area on Spitsbergen where Hansen, Elven,and Brochmann collected Potentilla extended from about 78°to over 79° N latitude. Ten of these populations were of the P.nivea complex and seven were populations of P. pulchella.Using these collections, Hansen, Elven, and Brochmannstudied 64 morphological characters of 146 plants and they didgenetic analyses of 136 plants. Genetic analyses were doneusing the randomly amplified polymorphic DNA, or RAPD,method (see Applications). Again, the question addressed bythe researchers was whether genetic information combinedwith morphology would support the earlier recognition ofthree species within the P. nivea complex and the subdivisionof P. pulchella into three different taxa.
The results of this study demonstrate the utility of join-ing morphological information with genetic information.
The RAPD method identified three genetically distinctgroups of plants within the P. nivea complex, which we cancall “RAPD phenotypes.” Significantly, most of the geneticvariance within the P. nivea complex was due to variationbetween the proposed species, while much less was due tovariation within each of the proposed species (fig. 8.6). Thethree RAPD phenotypes were also separated clearly on thebasis of several morphological characters. It turned out thatthe separation of plants achieved by Hansen, Elven, andBrochmann, which was based on combined genetic andmorphological data, corresponded precisely to the threepreviously proposed species: P. chamissonis, P. insularis,and P. nivea. These results support the continued recognitionof these taxa.
In contrast, the results of the study did not supportrecognizing the three morphologically distinctive forms ofP. pulchella as separate taxa. Despite their substantial mor-phological differences, the most common RAPD phenotypewas observed in all three forms of P. pulchella. From thisresult, Hansen, Elven, and Brochmann concluded that themorphologically distinctive forms in P. pulchella result fromplastic growth responses to local environments or perhaps aredue to the effects of a small number of genes. As a conse-quence, the researchers concluded that the three forms ofP. pulchella should not be recognized as separate taxa.
The ability of researchers to study the genes of organismsdirectly has revolutionized evolutionary and ecological stud-ies. However, the older experimental garden approachesremain essential for answering some types of scientific ques-tions, particularly in studies of plants.As the following exam-ple shows, however, these approaches have also been usedsuccessfully by ecologists studying animal populations.
Chapter 8 Population Genetics and Natural Selection 189
Figure 8.5 High above the Arctic Circle, the island ofSpitsbergen presents an extreme environment for terrestrial plants.
80
60
40
20
0Between proposed species
Sources of genetic variation
Perc
enta
ge o
f va
rian
ce
Within proposed species
Higher genetic variance between proposed species compared to within proposed species supports recognition of three separate species within the P. nivea complex.
Figure 8.6 Sources of genetic variance between and amongproposed species within the Potentilla nivea complex.
mol70822_ch08.qxd 7/26/06 9:11 AM Page 189
B/WCONFIRMING
PROOF
mol70822_ch03.qxd 7/19/06 3:36 PM Page 81
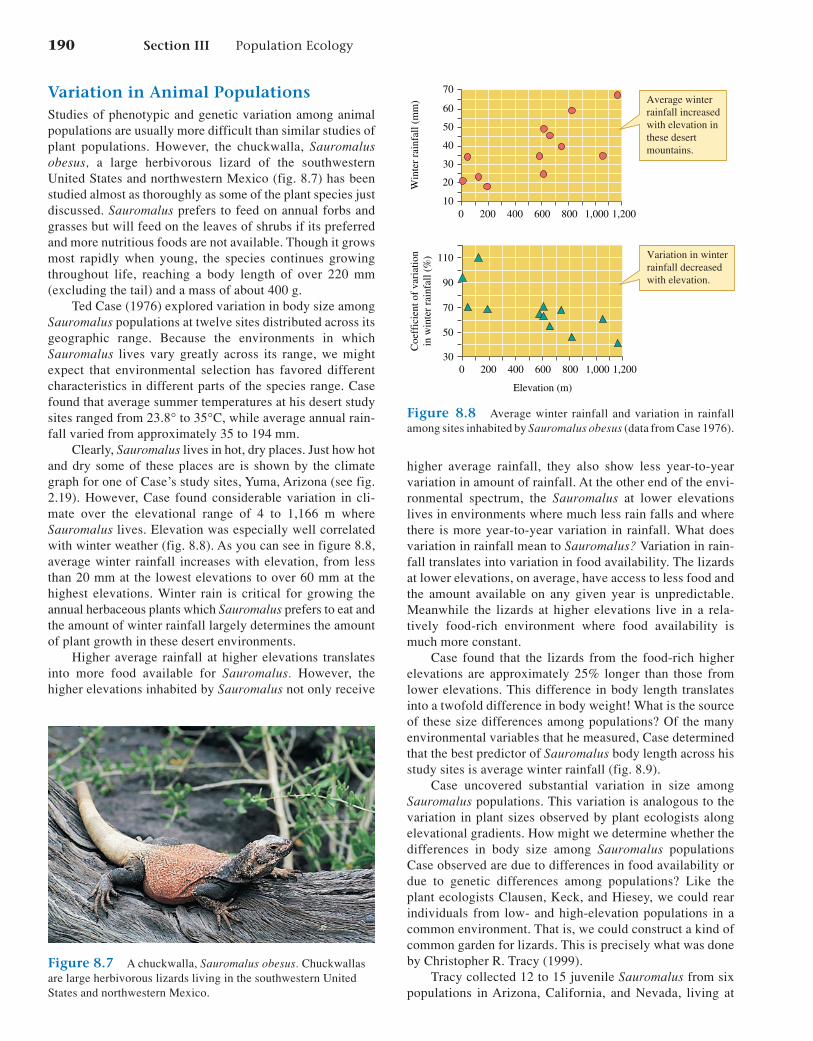
Variation in Animal PopulationsStudies of phenotypic and genetic variation among animalpopulations are usually more difficult than similar studies ofplant populations. However, the chuckwalla, Sauromalusobesus, a large herbivorous lizard of the southwesternUnited States and northwestern Mexico (fig. 8.7) has beenstudied almost as thoroughly as some of the plant species justdiscussed. Sauromalus prefers to feed on annual forbs andgrasses but will feed on the leaves of shrubs if its preferredand more nutritious foods are not available. Though it growsmost rapidly when young, the species continues growingthroughout life, reaching a body length of over 220 mm(excluding the tail) and a mass of about 400 g.
Ted Case (1976) explored variation in body size amongSauromalus populations at twelve sites distributed across itsgeographic range. Because the environments in whichSauromalus lives vary greatly across its range, we mightexpect that environmental selection has favored differentcharacteristics in different parts of the species range. Casefound that average summer temperatures at his desert studysites ranged from 23.8° to 35°C, while average annual rain-fall varied from approximately 35 to 194 mm.
Clearly, Sauromalus lives in hot, dry places. Just how hotand dry some of these places are is shown by the climategraph for one of Case’s study sites, Yuma, Arizona (see fig.2.19). However, Case found considerable variation in cli-mate over the elevational range of 4 to 1,166 m whereSauromalus lives. Elevation was especially well correlatedwith winter weather (fig. 8.8). As you can see in figure 8.8,average winter rainfall increases with elevation, from lessthan 20 mm at the lowest elevations to over 60 mm at thehighest elevations. Winter rain is critical for growing theannual herbaceous plants which Sauromalus prefers to eat andthe amount of winter rainfall largely determines the amountof plant growth in these desert environments.
Higher average rainfall at higher elevations translatesinto more food available for Sauromalus. However, thehigher elevations inhabited by Sauromalus not only receive
higher average rainfall, they also show less year-to-yearvariation in amount of rainfall. At the other end of the envi-ronmental spectrum, the Sauromalus at lower elevationslives in environments where much less rain falls and wherethere is more year-to-year variation in rainfall. What doesvariation in rainfall mean to Sauromalus? Variation in rain-fall translates into variation in food availability. The lizardsat lower elevations, on average, have access to less food andthe amount available on any given year is unpredictable.Meanwhile the lizards at higher elevations live in a rela-tively food-rich environment where food availability ismuch more constant.
Case found that the lizards from the food-rich higherelevations are approximately 25% longer than those fromlower elevations. This difference in body length translatesinto a twofold difference in body weight! What is the sourceof these size differences among populations? Of the manyenvironmental variables that he measured, Case determinedthat the best predictor of Sauromalus body length across hisstudy sites is average winter rainfall (fig. 8.9).
Case uncovered substantial variation in size amongSauromalus populations. This variation is analogous to thevariation in plant sizes observed by plant ecologists alongelevational gradients. How might we determine whether thedifferences in body size among Sauromalus populationsCase observed are due to differences in food availability ordue to genetic differences among populations? Like theplant ecologists Clausen, Keck, and Hiesey, we could rearindividuals from low- and high-elevation populations in acommon environment. That is, we could construct a kind ofcommon garden for lizards. This is precisely what was doneby Christopher R. Tracy (1999).
Tracy collected 12 to 15 juvenile Sauromalus from sixpopulations in Arizona, California, and Nevada, living at
190 Section III Population Ecology
Coe
ffic
ient
of
vari
atio
nin
win
ter
rain
fall
(%)
Win
ter
rain
fall
(mm
)
Variation in winterrainfall decreasedwith elevation.
70
60
50
40
30
20
10
110
90
70
50
30
200 400
Elevation (m)
600 800 1,000 1,2000
200 400 600 800 1,000 1,2000
Average winterrainfall increasedwith elevation inthese desertmountains.
Figure 8.8 Average winter rainfall and variation in rainfallamong sites inhabited by Sauromalus obesus (data from Case 1976).
Figure 8.7 A chuckwalla, Sauromalus obesus. Chuckwallasare large herbivorous lizards living in the southwestern UnitedStates and northwestern Mexico.
mol70822_ch08.qxd 7/26/06 9:11 AM Page 190

B/WCONFIRMING
PROOF
mol70822_ch03.qxd 7/19/06 3:36 PM Page 81
elevations ranging from 200 to 890 m. He then raised thesejuvenile lizards under identical environmental conditions ina laboratory. By growing juvenile Sauromalus under identi-cal environmental conditions, Tracy could determine thecontributions of environmental versus genetic factors to sizedifferences among Sauromalus populations.
Tracy set up the laboratory environment in a way thatsimulated late spring conditions, including 14 hours of lightand 10 hours of darkness daily. These conditions provided thelizards with long periods for daily activity. He providedrocks for shelter and a heat lamp for basking. The laboratoryenvironment maintained a temperature gradient from roomtemperature to 42°C under a heat lamp, which allowed thelizards the opportunity to use behavior to maintain theirbody temperatures at a preferred 36°C. Tracy also made an
abundance of high quality food and vitamins available at alltimes so that food would not limit rates of lizard growth. Inaddition, he took Sauromalus social life into account. Obser-vations by other ecologists had shown that Sauromalus eatsmore and grows faster when living in small groups thanwhen isolated from other Sauromalus. Therefore, Tracy kepthis lizards in groups of 3 to 5 while he followed their growthunder laboratory conditions for 462 days.
How did Sauromalus from different elevations respondto Tracy’s laboratory conditions? Lizards from all populationsgrew well in the laboratory. However, they showed markeddifferent patterns of growth. First, females grew slower thanmales but individuals of both sexes grew faster before reach-ing sexual maturity. However, before sexual maturity, thefastest growth was shown by lizards from low elevations.After maturity, however, the lizards from higher elevationsgrew faster. Despite these complications the outcome of theexperiment was clear. Lizard size at the end of the laboratoryexperiment was highly and positively correlated with theelevation at which they had been collected as juveniles(Fig. 8.10). In the end lizards from the higher elevationsgrew to a larger size, approximating in a laboratory commongarden for lizards the pattern of variation in body size foundin the field.
It appears that natural selection has favored differentsized individuals at different elevations. Tracy’s study ofSauromalus demonstrates how traditional morphologicaland laboratory studies continue to make significant contri-butions to our understanding of variation in animal popula-tions. However, modern molecular approaches dominatecontemporary studies of genetic variation in populations.The following study shows how molecular studies of geneticvariation may be combined with morphological studies toexplore the distribution and extent of genetic variation inanimal populations, even where the historical patterns havebeen obscured by human interference.
Genetic Variation in Alpine Fish PopulationsThe Alps rise out of the landscape of south central Europe,forming a moist and cool high-elevation environment. TheAlps’deep winter snows and glaciers make them the origin offour important rivers: the Danube and Rhine Rivers, whichflow out of the northern Alps, and the Po and Rhone Rivers,which flow out of the southern Alps. Because the headwaterstreams of these rivers are cool, they became refuges for cold-water aquatic organisms following the last Ice Age. As tem-peratures of the surrounding lowlands began to warm at the endof the Pleistocene, approximately 12,000 years ago, aquaticspecies requiring cold water migrated to the headwaters ofthese rivers. The movement of cold-adapted aquatic speciesinto the headwater streams and lakes of the glacial valleys thatlace the Alps created clusters of geographically isolated pop-ulations. This isolation reduced movements of individualsbetween populations. With reduced gene flow, populationscould diverge genetically. Such genetic divergence wouldincrease the genetic variation among populations.
Chapter 8 Population Genetics and Natural Selection 191
Bod
y le
ngth
(m
m)
Chuckwallas grow tolarger size where winterrainfall is higher.
220
210
200
190
180
17010 20 30 40
Winter rainfall (mm)
50 60 70
Figure 8.9 Relationship between winter rainfall andchuckwalla, Sauromalus, size (data from Case 1976).
Males
Females
In a “common garden” both males and females from higher elevation populationsgrew to a larger size.
300 500
Elevation (m)
Bod
y le
ngth
(m
m)
700 900
150
140
130
120
110
Figure 8.10 Chuckwalla body lengths at the end of alaboratory rearing experiment (data from Tracy 1999).
mol70822_ch08.qxd 7/26/06 9:11 AM Page 191

B/WCONFIRMING
PROOF
mol70822_ch03.qxd 7/19/06 3:36 PM Page 81
Morphological differences among populations of head-water fish species in the Alps have long suggested genetic dif-ferences among them. Nowhere has morphological variationamong populations been better studied and documented thanamong the whitefishes. Whitefish are relatives of the trout andsalmon and are classified in the genus Coregonus (fig. 8.11).Marlis Douglas and Patrick Brunner (2002) explored thegenetic and phenotypic variation among populations ofCoregonus in the central Alps. Douglas and Brunner pointedout that ichthyologists have described 19 indigenous Core-gonus populations from the central Alps. However, there hasbeen significant disagreement over the taxonomic status ofthese 19 populations. The classification of these populationsranges from that of a single variable species with 19 distinc-tive populations to dividing the 19 populations into morethan a dozen separate species.
The taxonomic status of Coregonus populations in thecentral Alps is made more difficult by a one-hundred-year his-tory of intensive fisheries management. Douglas and Brun-ner review this history, which included raising Coregonus inhatcheries and moving fish between lakes. One of the mainpurposes of the study by Douglas and Brunner was todescribe the genetic variation among the present-day popu-lations of Coregonus in order to determine if there is evidencefor significant genetic differences among historically recog-nized populations. A second purpose was to examine thegenetic similarity between introduced Coregonus popula-tions and the populations from which they were drawn.Using this information, Douglas and Brunner intended tooffer suggestions for the management and conservation ofCoregonus in the central Alps.
Douglas and Brunner collected 907 Coregonus speci-mens from 33 populations in 17 lakes in the Central AlpineRegion of Europe. They used a mixture of anatomical andgenetic features to characterize the fish collected from the
study populations. The anatomical features were the numberof rays in the dorsal, anal, pelvic, and pectoral fins, theextent of pigmentation in these fins, and the number of gillrakers on the first gill arch. The study populations were char-acterized genetically by using specific primers to amplifysix different loci on microsatellite DNA, tandemly repetitivenuclear DNA, 10 to 100 base pairs long.
Genetic analyses by Douglas and Brunner demonstrateda moderate to high level of genetic variation within all 33study populations. They also found that genetic and morpho-logical analyses distinguished the 19 historically recognizedCoregonus populations of the central Alps. Genotypic differ-ences among populations were sufficient to correctly assignindividual fish to the indigenous population from which theywere sampled with approximately a 71% probability. Fin raycounts correctly assigned fish to the 19 indigenous populationswith a 69% probability, while pigmentation could identifythem with a 43% probability. Combining genetic and pheno-typic data increased the correct assignment of specimens to thepopulations from which they were drawn to 79%. Geneticanalyses of the introduced Coregonus populations revealedtheir genetic similarity to the populations from which theywere stocked. However, these analyses also showed that theintroduced populations have become genetically distinctivefrom their source populations.
The conclusion that Douglas and Brunner drew fromthese results was that the Coregonus of the central Alps ismade up of a highly diverse set of populations that show ahigh level of genetic differentiation. They suggest that thesepopulations should be considered as an “evolutionarily sig-nificant unit.” They further conclude that the distinctivenessof local Coregonus populations is sufficient so that theyshould be managed as separate units. Douglas and Brunnerrecommend that Coregonus should not be moved from onelake basin to another.
The studies of plants and animals that we have reviewedhave repeatedly demonstrated genetic variation in popula-tions. Such genetic variation is required for evolutionarychange. However, in order to better understand how popula-tions can evolve, we need to first understand some aspects ofthe genetics of populations, or population genetics. Thetheoretical foundations of population genetics were estab-lished early in the twentieth century by two investigatorsnamed Hardy and Weinberg.
Concept 8.1 Review
1. What do the results of Tracy’s experiments indicateabout variation in body size among Sauromaluspopulations?
2. What is a fundamental evolutionary implication of thelarge amounts of genetic variation commonly docu-mented in natural populations?
3. What would you expect to see in figure 8.4 if alpine,mid-elevation, and lowland populations of Potentillaglandulosa were not different genetically?
192 Section III Population Ecology
Figure 8.11 Whitefish, Coregonus sp., are adapted to cold,highly oxygenated waters like their relatives the trout and salmon.Because they are valued food fishes, whitefish have beenintensively managed particularly in the central Alps.
mol70822_ch08.qxd 7/26/06 9:11 AM Page 192

B/WCONFIRMING
PROOF
mol70822_ch03.qxd 7/19/06 3:36 PM Page 81
8.2 Hardy-WeinbergThe Hardy-Weinberg equilibrium model helps identifyevolutionary forces that can change gene frequencies inpopulations. We defined evolution as a change in a popu-lation over time. Since evolution ultimately involveschanges in the frequency of heritable traits in a population,we can define evolution more precisely as a change in genefrequencies in a population. Therefore a thorough under-standing of evolution must include some knowledge of pop-ulation genetics. Though Mendel is not generally creditedwith studying the genetics of populations, he included a pop-ulation level analysis in his paper on inheritance in gardenpeas (Mendel 1866). In a section of this paper titled, “TheSubsequent Generations from the Hybrids,” Mendel demon-strated mathematically that if self-fertilization was the onlyform of fertilization in a population consisting of threegenotypes, AA (homozygous dominant), Aa (heterozygous),and aa (homozygous recessive) present in a ratio of one AAindividual : two Aa individuals : one aa individual, the fre-quency of homozygous recessive (aa), and homozygousdominant (AA) individuals would increase in the population.Mendel did not consider what would happen to gene fre-quencies in his theoretical population if breeding occurredthrough something other than self-fertilization. Still, hisanalysis anticipated the field of population genetics, thefoundations of which would be laid 42 years later.
Calculating Gene FrequenciesConsider a population of Asian lady beetles of the speciesHarmonia axyridis (fig. 8.12). Harmonia populations gen-erally include a great deal of variation in color pattern on thewing covers, or elytra, and over 200 color variants areknown. Many color forms are so distinctive that early tax-onomists described them as different species or even differ-ent genera. Genetists in the first half of the twentieth
century, especially Chia-Chen Tan and Ju-Chi Li (1934,1946) and Theodosius Dobzhansky (1937), determined thatthe variation in color patterns shown by Harmonia is due tothe effects of more than a dozen alternative alleles for colorpattern. The phenotypic expressions of two of those allelesare shown in figure 8.13. The homozygous “19-signata”genotype of Harmonia, which we can represent as SS, hasyellow elytra with several black spots, while the homozygous“aulica” genotype, represented here as AA, has elytra withprominent black borders and a large oval area of yellow ororange. Tan and Li, who did extensive breeding experimentsusing Harmonia that they collected in southwestern China,found that crosses between 19-signata and aulica genotypesproduce heterozygous offspring, indicated here as SA, with acolor pattern that includes elements of both the 19-signata andthe aulica parental forms (fig. 8.13). One of the convenientfeatures of knowing so much about color pattern inheritancein Harmonia is that color pattern can be used to determine thegenotypes of many individuals.
Now suppose that you sampled the genotypes of Harmo-nia in a tract of forest in Asia and found that the frequency ofbeetles with genotype SS is 0.81 (81%), the frequency of theSA genotype is 0.18 (18%), and the frequency of the AA geno-type is 0.01 (1%). What is the frequency of the S and A allelesin this population? The frequency in the S allele is:
Frequency of SS + 1/2(Frequency of SA) � 0.81 + 1/2(0.18) � 0.81 + 0.09 � 0.90
The frequency of the A allele is:
Frequency of AA + 1/2(Frequency of SA) � 0.01 + 1/2(0.18) � 0.01 + 0.09 � 0.10
Chapter 8 Population Genetics and Natural Selection 193
Figure 8.12 Two color forms of Harmonia axyridis, theAsian lady beetle. The genetic basis of the color forms ofH. axyridis is well studied, making it a useful species for studiesof population genetics and natural selection.
“19-signata”SS
HeterozygoteSA
“aulica”AA
×
Figure 8.13 Color patterns in the Asian lady beetle,Harmonia axyridis (after Dobzhansky 1937 and Tan 1946).
mol70822_ch08.qxd 7/26/06 9:11 AM Page 193

B/WCONFIRMING
PROOF
mol70822_ch03.qxd 7/19/06 3:36 PM Page 81
These calculations show that the frequency of the S allele inthis lady beetle population is 0.90, while the frequency of theA allele is 0.10.
Evolutionary ecologists are interested in knowing whatfactors may change allele frequencies in a population such asthat of our hypothetical population of Harmonia. Those fac-tors, which we can consider as evolutionary forces, arerevealed indirectly by the Hardy-Weinberg principle. TheHardy-Weinberg principle states that in a population matingat random in the absence of evolutionary forces, allele fre-quencies will remain constant.
Let us review how random mating will influence genefrequencies in the Harmonia beetle population we justreviewed. Assuming equal fertility of the SS, SA, and AAgenotypes, the proportion of S and A alleles in the population,0.9 and 0.1, are also the proportions of eggs and sperm car-rying the two alleles. With random mating, the probabilitythat any two alleles will be paired in a zygote is determinedby the frequency of the alleles in our hypothetical populationas follows:
Proportion of matings that will pair an S sperm with an S egg � 0.9 × 0.9 � 0.81,
Proportion of matings that will pair an S sperm with an A egg � 0.9 × 0.1 � 0.09,
Proportion of matings that will pair an A sperm with an S egg � 0.1 × 0.9 � 0.09
and
Proportion of matings that will pair an A sperm with an A egg � 0.1 × 0.1 � 0.01
The proportion of the three genotypes produced by this ran-dom mating will be: SS � 0.81, SA � 0.09 + 0.09 � 0.18, andAA � 0.01. Notice that the proportions of these genotypes inthe parents and offspring in the population are the same. Ifyou calculate the allele frequencies from the genotype fre-quencies in the offspring you will find that they remain at S �0.90 and A � 0.10, which is what the Hardy-Weinberg prin-ciple predicts when mating in a population is random.
We can represent these relationships in a more generalway using some basic algebra, if we let p equal the fre-quency of one allele and q the frequency of the second allele.In the case of the Harmonia example just discussed, let p �the frequency of the S allele and q � the frequency of the Aallele. Expressing these frequencies in numbers, p � 0.90 andq � 0.10. For a population in Hardy-Weinberg equilibrium ina situation where there are only two alleles at a particularlocus, p + q � 1.0. Again referring to the Harmonia exam-ple, p + q � 0.90 + 0.10 � 1.0. Using this relationship wecan calculate the frequency of genotypes in a population inHardy-Weinberg equilibrium as:
(p + q)2 = (p + q) × (p + q) = p2 + 2pq + q2 = 1.0
The result of this calculation is:
(0.90)2 + 2(0.90 × 0.10) + (0.10)2 = 0.81 + 0.18 + 0.01 = 1.0
According to this equation, the frequencies of the genotypesin our hypothetical Harmonia population are:
p2 � (0.90)2 � 0.81 � frequency of the SS genotype,
2pq � 2(0.90 × 0.10) � 0.18 � frequency of the SA genotype,
and
q2 � (0.10)2 � 0.01 � frequency of the AA genotype.
These calculations are equivalent to the combining of allelesthat would occur if individuals in the Harmonia populationmated at random. The mathematics of the Hardy-Weinbergmodel are further dissected in figure 8.14.
In the equations we just explored, random mating is suf-ficient to maintain constant genotype and allele frequencies.However, Hardy pointed out in his 1908 paper that in naturalpopulations, other conditions are also required to maintainconstant allele frequencies. For instance, Hardy recognizedthat nonrandom mating or differences in fertility amonggenotypes can change allele frequencies in a population. Theconditions necessary to maintain constant allele frequencies
194 Section III Population Ecology
For a population in Hardy-Weinbergequilibrium, in which there are only
two alleles at a particular locus,
and
and
Frequency Frequencyof S of A
p + q = 1.0
The frequency of genotypesin a randomly mating populationin Hardy-Weinberg equilibrium
can be calculated as:
(p + q)2 =
(p + q) × (p + q) = p2 + pq + pq + q2
p2 + 2pq + q2 = 1.0
Frequency of Frequency of FrequencyofSS genotype SA genotype AA genotype
The sum of p and qmust equal 1.0 sincethere are only twoalleles at this locus.
Squaring p + q isanalogous to allowingrandom mating amongindividuals carryingalleles S and A atfrequencies p and q.
The result of thiscalculation givesthe frequency of genotypes in the population.
p = frequency or proportion of one allele, e.g., S, in the population,
q = frequency, or proportion, of the alternative allele, e.g., A,
Figure 8.14 Anatomy of a Hardy-Weinberg equilibriumequation.
mol70822_ch08.qxd 7/26/06 9:11 AM Page 194

B/WCONFIRMING
PROOF
mol70822_ch03.qxd 7/19/06 3:36 PM Page 81
in a population, what is called Hardy-Weinberg equilibrium,are as follows:
1. Random mating. Nonrandom or preferential mating, inwhich the probability of pairing alleles is either greater orlower than would be expected based on their frequency inthe population, can change the frequency of genotypes.
2. No mutations. Mutations which add new alleles to thepopulation or change an allele from one form to anotherhave the potential to change allele frequencies in apopulation and therefore disrupt Hardy-Weinbergequilibrium.
3. Large population size. Small population size increasesthe probability that allele frequencies will change fromone generation to the next due to chance alone. Changein allele frequencies due to chance or random eventsis called genetic drift. Genetic drift reduces geneticvariation in populations over time by increasing thefrequency of some alleles and reducing the frequency ofsome alleles or eliminating others.
4. No immigration. Immigration can introduce new allelesinto a population or, because allele frequencies are dif-ferent among immigrants, alter the frequency of existingalleles. In either case immigration will disrupt Hardy-Weinberg equilibrium.
5. All genotypes have equal fitness, where fitness is theprobability of surviving and reproducing. If differentgenotypes survive and reproduce at different rates,then gene and genotype frequencies will change inpopulations.
Hardy-Weinberg equilibrium requires that all five ofthese conditions be met. How likely is it that all the conditionsrequired for Hardy-Weinberg equilibrium will be present ina natural population? In places and at times the conditionsappear to be present. However, it is very likely that one ormore of these conditions will not be met and allele frequen-cies will change. While at first thought it may not appear thatthe Hardy-Weinberg principle is an important contribution tobiology, it is in fact very important. By carefully identifyingthe highly restrictive conditions under which evolution isnot expected, the analysis by Hardy and Weinberg leads us toconclude that the potential for evolutionary change in naturalpopulations is often very great.
In the remaining sections of chapter 8 we will discussexamples in which one or more of the conditions for Hardy-Weinberg equilibrium have not been met and where evolu-tionary change has occurred in populations as a consequence.We begin this discussion with a general overview of theprocess of natural selection.
Concept 8.2 Review
1. Why is genetic drift more probable in small populationsthan in large populations?
2. How does highly selective mating by female guppiesand scorpionflies (see figs. 7.8 and 7.10) affect thepotential for Hardy-Weinberg equilibrium?
8.3 The Process of NaturalSelection
Natural selection is the result of differences in survivaland reproduction among phenotypes. As we saw in theintroduction to chapter 8, Darwin was one of the first to rec-ognize the biological significance of variation among indi-viduals in a population. The biological significance of thevariation that Darwin recognized stemmed from an infer-ence that he drew. His inference was that some phenotypes ina population would have an advantage over others underparticular environmental circumstances. That is, the pheno-typic characteristics of some individuals, for instance, largeror smaller size, different body proportions, lighter or darkerpigmentation, or higher or lower metabolic rate, wouldresult in higher rates of reproduction and survival comparedto other individuals with other phenotypic characteristics. Inother words, some individuals in a population, because oftheir phenotypic characteristics, produce more offspring thatthemselves live to reproduce.
While the basic concept of natural selection is easyenough to grasp, natural selection does not a take the same formeverywhere and at all times. Rather, natural selection can actagainst different segments of the population under differentcircumstances and can produce quite different results. Naturalselection can lead to change in populations but it can alsoserve as a conservative force, impeding change in a population.Natural selection can increase diversity within a population ordecrease diversity. Let’s begin our discussion of natural selec-tion with a process that conserves population characteristics.
Stabilizing SelectionOne of the conclusions that we might draw from the discussionof the Hardy-Weinberg equilibrium model is that most popu-lations have a high potential for evolutionary change. However,our observations of the natural world suggest that species canremain little changed generation after generation. If the poten-tial for evolutionary change is high in populations, why does itnot always lead to obvious evolutionary change? There aremany reasons for apparent absence of change in populations.For example, one form of natural selection, called stabilizingselection, can act to impede changes in populations.
Stabilizing selection acts against extreme phenotypesand as a consequence favors the average phenotype. Fig-ure 8.15a pictures stabilizing selection, using a normal dis-tribution of body size. Under the influence of stabilizingselection, individuals of average size have higher survival andreproductive rates, while the largest and smallest individualsin the population have lower rates of survival and reproduc-tion. As a consequence of stabilizing selection, a populationtends to sustain the same phenotype over time. Stabilizingselection occurs where average individuals in a populationare best adapted to a given set of environmental conditions.If a population is well adapted to a given set of environmen-tal circumstances, stabilizing selection may maintain thematch between prevailing environmental conditions and theaverage phenotype within a population. However, stabilizing
Chapter 8 Population Genetics and Natural Selection 195
mol70822_ch08.qxd 7/26/06 9:11 AM Page 195

B/WCONFIRMING
PROOF
mol70822_ch03.qxd 7/19/06 3:36 PM Page 81
selection for a particular trait can be challenged by environ-mental change. In the face of environmental change thedominant form of selection may be directional.
Directional SelectionIf we examine the fossil record or trace the history of well-studied populations over time, we can find many examples ofhow populations have changed over time. For instance, therehave been remarkable changes in body size or body propor-tions in many evolutionary lineages. Such changes may be theresult of directional selection.
Directional selection favors an extreme phenotype overother phenotypes in the population. Figure 8.15b presents an
example of directional selection, again, using a normal dis-tribution of body size. In this hypothetical situation, largerindividuals in the population realize higher rates of survivaland reproduction, while average and small individuals havelower rates of survival and reproduction. As a consequenceof these differences in survival and reproduction, the averagephenotype under directional selection changes over time. Inthe example shown in figure 8.15b, average body sizeincreases with time. Directional selection occurs where oneextreme phenotype has an advantage over all other pheno-types. However, there are circumstances in which more thanone extreme phenotype may have an advantage over theaverage phenotype. Such a circumstance can lead to diversi-fication within a population.
196 Section III Population Ecology
Small Body size Large Small Body size Large
Small Body size Large Small Body size Large
Small Body size Large Small Body size Large
(a) Stabilizing selection
Under stabilizing selection, extreme phenotypes have lower rates of reproduction and survival (= red).
As a consequence, the average phenotype remains the most common from one generation to the next.
(b) Directional selection
Under directional selection, an exceptional phenotypes has higher reproduction and survival (= blue).
As a result, the population average changes in a particular direction over time.
(c) Disruptive selection
Under disruptive selection, average phenotypes have lower reproduction and survival compared to the extremes (= red).
Over time, average phenotypes become less common and the population becomes phenotypically more diverse.
Selection
over time
Selection
over time
Selection
over time
Figure 8.15 Three principle forms of natural selection: (a) stabilizing selection, (b) directional selection, and (c) disruptive selection.
mol70822_ch08.qxd 7/26/06 9:12 AM Page 196

B/WCONFIRMING
PROOF
mol70822_ch03.qxd 7/19/06 3:36 PM Page 81
Disruptive SelectionThere are populations that do not show a normal distributionof characteristics such as body size. In a normal distributionsuch as those depicted in figures 8.15a and 8.15b, there is asingle peak, which coincides with the population mean. Thatis, the average phenotype in the population is the most com-mon and all other phenotypes are less common. However, insome populations there may be two or more common phe-notypes. In many animal species, for example, males may beof two or more discrete sizes. For example, it appears that insome animal populations small and large males have higherreproductive success than males of intermediate body size. Insuch populations, natural selection seems to have produceda diversity of male sizes. One way to produce such diversityis through disruptive selection.
Disruptive selection favors two or more extreme pheno-types over the average phenotype in a population. In fig-ure 8.15c, individuals of average body size have lower ratesof survival and reproduction than individuals of either largeror smaller body. As a consequence, both smaller and largerindividuals increase in frequency in the population overtime. The result is a distribution of body sizes among malesin the population with two peaks. That is, the population hasmany large males and many small males but few of interme-diate body size.
Figure 8.15b and 8.15c indicate change in the frequen-cies of phenotypes in the two hypothetical populations aftera period of natural selection. This change depends on theextent to which genes determine the phenotype upon whichnatural selection acts. This dependence is the focus of the dis-cussion of Concept 8.4.
Concept 8.3 Review
1. If you observe no changes in gene frequencies in apopulation over several generations, can you concludethat the population is not subject to natural selection?
2. Why is rapid, human-induced environmental change athreat to natural populations?
8.4 Evolution by NaturalSelection
The extent to which phenotypic variation is due togenetic variation determines the potential for evolution bynatural selection. The most general postulate of the theoryof natural selection is that the environment determines theevolution of the anatomy, physiology, and behavior oforganisms. This is what Darwin surmised as he studied vari-ation among populations and species in different environ-ments. Coincidentally, one of the clearest demonstrationsof natural selection has resulted from studies of populationsof Galápagos finches, which are reviewed in chapter 13(pp. 303–304). Those studies showed that the quantity and
quality of available food exerts strong selection on beak sizein finch populations. Here we review additional studies thatalso provide evidence for Darwin’s bold hypothesis that nat-ural selection by the environment can result in evolutionarychange in populations.
Evolution by Natural Selectionand Genetic VariationDarwin was keenly aware that the only way natural selectioncan produce evolutionary change in a population is if the phe-notypic traits upon which natural selection acts can be passedfrom generation to generation. In other words, evolution bynatural selection depends upon the heritability of traits. We candefine heritability of a trait—usually symbolized as h2—ina broad sense as the proportion of total phenotypic variationin a trait, such as body size or pigmentation, that is attribut-able to genetic variance. In equation form, heritability canbe expressed as:
h2 � VG/VP
Here VG represents genetic variance and VP represents phe-notypic variance. (We reviewed how to calculate variance inchapter 6, p. 151.) Many different factors contribute to theamount of phenotypic variance in a population. We will sub-divide phenotypic variance into only two components: vari-ance in phenotype due to genetic effects, VG, and variance inphenotype due to environmental effects on the phenotype, VE.Subdividing VP in the heritability equation given aboveproduces the following:
h2 � VG/(VG + VE)
Since this highly simplified expression for heritability hasimportant implications, let’s examine it. First, consider envi-ronmental variance, VE. Environment has substantial effectson many aspects of the phenotype of organisms. For instance,the quality of food eaten by an animal can contribute signifi-cantly to the growth rate of the animal and to its eventual size.Similarly, the amount of light, nutrients, temperature, and soforth, affect the growth form and size of plants. So, when weconsider a population of plants or animals, some of the phe-notype that we might measure will be the result of environ-mental effects, that is, VE. However, we are just as familiarwith the influence of genes on phenotype. For example, someof the variation in stature that we see in a population of ani-mals or plants will generally result from genetic variationamong individuals in the population, that is, VG.
What our equation says is that the heritability of aparticular trait depends on the relative sizes of genetic ver-sus environmental variance. Heritability increases withincreased VG and decreases with increased VE. Imagine a sit-uation in which all phenotypic variation is the result ofgenetic differences between individuals and none resultsfrom environmental effects. In such a situation, VE is zero andh2 � VG/(VG + VE) is equal to h2 � VG/VG (since VE � 0),which equals 1.0. In this case since all phenotypic variationis due to genetic effects, the trait is perfectly heritable. We can
Chapter 8 Population Genetics and Natural Selection 197
mol70822_ch08.qxd 7/26/06 9:12 AM Page 197

B/WCONFIRMING
PROOF
mol70822_ch03.qxd 7/19/06 3:36 PM Page 81
also imagine the opposite circumstance in which none of thephenotypic variation that we observe is due to geneticeffects. In this case, VG is zero and so the expression h2 �VG/(VG + VE) also equals zero. Because all of the phenotypicvariation we observe in this population is due to environ-mental effects, natural selection cannot produce evolutionarychange in the population. Generally, heritability of traitsfalls somewhere in between these extremes in the very broadregion where both environment and genes contribute to thephenotypic variance shown by a population. For instance,Peter Boag and Peter Grant (1978) estimated bill width in theGalápagos finch Geospiza fortis to have a heritability of0.95. By comparison they estimated that bill length in thespecies has a heritability of 0.62. In a study of morphologi-cal variation in the water lily leaf beetle, a team of Dutch sci-entists (Pappers et al. 2002) found that body length andmandible width had heritabilities of between 0.53 and 0.83.Now that we have established the requirement of heritablevariation in a trait for its evolution, let’s review studies thathave explored evolution by natural selection in nature.
198 Section III Population Ecology
Estimating Heritability Using Regression Analysis
Investigating the Evidence 8
As we have seen, the extent to which phenotypic variation in atrait is determined by genetic variation affects its potential forthat trait to evolve by natural selection. In other words, thepotential for a trait to evolve is affected by the trait’s heritabil-ity. How can we estimate the heritability of a particular trait?One common method is through regression analysis. Regressionanalysis is a statistical technique used to explore the extent towhich one factor, called the independent variable (usuallysymbolized as X) determines the value of another variable,which we call the dependent variable (usually represented bythe symbol Y). In regression analysis, we construct X-Y plotsas we did when we explored scatter plots and correlation(Investigating the Evidence, chapter 7, p. 172). However,regression analysis is used to determine the equation for a line,called a regression line, that best fits the relationship betweenX and Y. When the relationship between X and Y follows astraight line, the regression equation takes the following form:
Y � bX + a
In this equation, a is the point at which the line crosses the Yaxis, which is called the Y intercept, and b, which is theslope of the line, is the regression coefficient.
Let’s use a natural system to learn more about regressionanalysis and its use in heritability studies. In heritability studies,we are interested in the extent to which the characteristics of par-ents determine the characteristics of offspring. For instance, theteam of Dutch scientists studying water lily leaf beetles (Pappers
et al. 2002) explored the heritability of body length in differentpopulations of the beetle. To determine the heritability of bodylength, they conducted regression analyses using the body lengthof parents as the independent variable, and body length of the off-spring as the dependent variable. Because each of the parents con-tributes to the genotype of the offspring, the value used forparental body length is the “mid-parent body length,” which is theaverage of the two parents’body lengths. Let’s consider the rela-tionships between length of parents and offspring, and useregression analysis to estimate heritability of body length insome hypothetical populations of water lily leaf beetles.
Consider the three scatter plots shown in figure 1 and thelines drawn through the scatter of points. Again, these are muchlike the scatter plots we examined in chapter 7 but with regres-sion lines drawn through each. The regression coefficient ineach of the graphs indicates the level of heritability in the threehypothetical populations. In population a, the regression coef-ficient of 0.00 indicates that there is no relationship betweenparental body length and the body length of offspring. Thisresult is apparent from just the scatter plot, which shows that par-ents of any length, large or small, can have small or large off-spring. In this population it appears that the variation in bodylength among the offspring is determined entirely by environ-mental effects. In contrast, body length has a heritability of 0.52in population b and 0.81 in population c. What do these valuesindicate? With a heritability of 0.52, we can conclude that abouthalf of the variation in body length in population b results from
Adaptive Change in Colonizing LizardsAs we reviewed cases of physiological, anatomical, orbehavior features of organisms, especially in section II of thetext, we assumed that they were the result of adaptation ofpopulations through the process of natural selection. How-ever, we have reviewed few studies that have documented theprocess of natural selection. Why is it so important to makethis distinction? In science we must always guard againstmixing pattern and process or evidence and interpretation. Inthis section we address this omission by reviewing elegantstudies that have documented natural selection in progress.
One of those studies was conducted by Jonathan Losos,Kenneth Warheit, and Thomas Schoener on lizards of thegenus Anolis (Losos, Warheit, and Schoener 1997). Approx-imately 150 species of Anolis inhabit the islands of theCaribbean Sea and another 250 are found in Central andSouth America (fig. 8.16). This great diversity of lizards in asingle genus includes a great amount of variation in size and
mol70822_ch08.qxd 7/26/06 9:12 AM Page 198

B/WCONFIRMING
PROOF
mol70822_ch03.qxd 7/19/06 3:36 PM Page 81
body proportions. The anatomy of Anolis lizards, especiallythe length of their hind limbs, appears to reflect selection foreffective use of vegetation. The attribute of vegetation thatappears to be most significant in selection for hind limblength is the diameter of surfaces available for perching. Hindlimb length in Anolis populations appears to be the result of atrade-off between selection for maximum speed (lizards withlonger hind limbs run faster) and selection for moving effi-ciently on narrow branch surfaces (lizards with shorter hindlimbs move more efficiently on narrow surfaces).
Losos, Warheit, and Schoener used replicated fieldexperiments to study natural selection for changes in mor-phology in Anolis lizard populations. They designed theirexperiments in such a way that they could make very specificpredictions concerning expected morphological changesamong lizard populations. Losos and his colleagues capturedadult Anolis sagrei on Staniel Cay in the Bahama Islandsand then introduced them in groups of 5 to 10 lizards, at aratio of 2 males:3 females, to 11 small islands in 1977 and tothree more in 1981. None of these small islands had their own
Chapter 8 Population Genetics and Natural Selection 199
Figure 8.16 A brown anole, Anolis sagrei, jumping. Limblength is known to be highly correlated with the types of perchesused by Anolis species.
CRITIQUING THE EVIDENCE 8
1. What are the evolutionary implications of the patternsshown in figure 1?
genetic effects, and about half from environmental effects, suchas food quality, temperature, and so forth. The regression coef-ficient of 0.81 in population c indicates that more of the varia-tion in body length in the offspring in that population is theresult of genetic effects.
(a) (b) (c)
Mid-parent body length (mm)
Off
spri
ng b
ody
leng
th (
mm
)
5 5.5 6 6.5 6.5 6.5
6.5
6
5.5
5
4.5
Mid-parent body length (mm)5 5.5 6
6.5
6
5.5
5
4.5
Mid-parent body length (mm)5 5.5 6
6.5
6
5.5
5
4.5
The regression coefficient of 0.00 indicates that body length is not heritable in this population.
The regression coefficient of 0.52 indicates an intermediate level of heritability of body length in this population.
The regression coefficient of 0.81 indicates higher heritability of body length in this population.
Y = 0.81X + 1.081Y = 0.52X + 2.331Y = 0.00X + 5.522
Figure 1 Regression analyses indicating degree of heritability of body length in three hypothetical populations of water lily leaf beetles.
mol70822_ch08.qxd 7/26/06 9:12 AM Page 199

B/WCONFIRMING
PROOF
mol70822_ch03.qxd 7/19/06 3:36 PM Page 81
lizard populations, probably because hurricanes periodicallyeliminate lizards from them. The islands also differedgreatly in their vegetative cover, which ranged in maximumheight from 1 to 3 m on the different islands, but all hadsubstantially lower vegetation than Staniel Cay, which sup-ports some trees over 10 m tall.
Let us reflect on the conditions of the experiment. All theintroduced lizards were drawn from the same source popu-lation on Staniel Cay, which could serve as a reference pop-ulation. The islands onto which the lizards were introducedeach supported somewhat different vegetation. Therefore, ifvegetation is a primary agent selecting for differences inhind limb size, the morphology of the introduced populations
should change from that of the source populations, but theyshould also differ from each other, depending on the vegeta-tion on each small island. Losos, Warheit, and Schoenermade two specific predictions: (1) the extent to which the col-onizing populations change morphologically from thesource population will correlate with the differences in veg-etative structure between the experimental islands andStaniel Cay, and (2) the Anolis populations on the experi-mental islands and Staniel Cay should show a significantcorrelation between relative hind limb length within popula-tions and average perch diameter used on the islands.
After the lizards had occupied the experimental islandsfor 10 to 14 years, Losos and his colleagues returned andmeasured lizard morphology and their distributions on thelocal vegetation. Both predictions of the researchers werewell supported by the results of their study. First, they founda positive correlation between the difference in vegetativeheight on experimental islands compared to Staniel Cay andthe degree to which introduced lizards diverged from theancestral population (fig. 8.17). Second, the hind limblength in the lizard populations was positively correlatedwith the average perch diameter the lizards used on eachisland (fig. 8.18). That is, on islands where lizards useperches of larger diameter, they have longer hind limbs.
The researchers point out that their results indicate thatcolonizing populations can adapt rapidly to new environ-mental conditions. However, they also caution that whiletheir results are consistent with the effects of natural selectionfor changed morphology, they do not demonstrate unequivo-cally that the colonizing populations have evolved. At thispoint we cannot rule out the possibility that lizards on exper-imental islands underwent a developmental change and not anevolutionary change. To eliminate this possibility requiresgenetic studies. In the next study on rapid adaptation bysoapberry bugs, the researchers collected extensive geneticinformation to document the operation of natural selection.
Rapid Adaptation by Soapberry Bugsto New Host PlantsAs discussed in chapter 6, herbivores must overcome a widevariety of physical and chemical defenses evolved by plants.As a consequence, plants theoretically exert strong selectionon herbivore physiology, behavior, and anatomy. Whileherbivore adaptation to plant defenses are generally inferredfrom the juxtaposition of plant defenses and herbivore char-acteristics, few studies have documented the process of her-bivore adaptation. A notable exception is provided by studiesof the soapberry bug and its evolution on new host plants.
The soapberry bug, Jadera haematoloma, feeds onseeds produced by plants of the family Sapindaceae. Soap-berry bugs use their slender beaks to pierce the walls of thefruits of their host plants. To allow the bug to feed on theseeds within the fruit, the beak must be long enough to reachfrom the exterior of the fruit to the seeds. The distance fromthe outside of the fruit wall to the seeds varies widely amongpotential host species. Thus beak length should be understrong selection for appropriate length.
200 Section III Population Ecology
Lizards, Anolis sagrei, introducedto islands with vegetation ofgreater difference in heightcompared to Staniel Cay displaymore morphological change.
Low
Difference in height of vegetation
Mor
phol
ogic
al d
iffe
renc
e
Less Greater
High
Vegetation on islandsabout 3 m tall.
Vegetation on islandsabout 1 m tall.
Trees on Staniel Cay are upto 10 m tall so experimentalislands with low vegetation(about 1 m) were moredifferent from Staniel Caythan were islands with tallervegetation (about 3 m).
Figure 8.17 Relationship between the difference in heightof vegetation between the home island, Staniel Cay, and islandof introduction and change in lizard morphology after theirintroduction (data from Losos et al. 1997).
Shorter
Relative hind limb length (mm)
Perc
h di
amet
er (
cm)
Longer
2
4
5
3
A. sagrei using larger diameterperches have longer hind limbs.
Figure 8.18 Relationship between hind limb length in Anolissagrei and perch diameters on experimental islands (data fromLosos et al. 1997).
mol70822_ch08.qxd 7/26/06 9:12 AM Page 200

B/WCONFIRMING
PROOF
mol70822_ch03.qxd 7/19/06 3:36 PM Page 81
Scott Carroll and Christin Boyd (1992) reviewed thehistory and biogeography of the colonization of new hostplants by soapberry bugs. Historically, soapberry bugs fed onthree main host plants in the family Sapindaceae: the soap-berry tree, Sapindus saponaria v. drummondii, in the southcentral region of the United States, the serjania vine, Serja-nia brachycarpa, in southern Texas, and the balloon vine,Cardiospermum corindum, in southern Florida. During thesecond half of the twentieth century three additional speciesof the plant family Sapindaceae were introduced to thesouthern United States. The round-podded golden rain tree,Koelreuteria paniculata, from east Asia and the flat-poddedgolden rain tree, K. elegans, from southeast Asia are bothplanted as ornamentals, while the subtropical heartseed vine,Cardiospermum halicacabum, has invaded Louisiana andMississippi. At some point after their introduction, somesoapberry bugs shifted from their native host plants andbegan feeding on these introduced plant species.
Carroll and Boyd painstakingly reconstructed the historyof the colonization of the southern United States by newspecies of host plants and colonization of these new plants bysoapberry bugs. Fortunately, extensive historical museumcollections of plants and insects allowed them to assemble thehistory of a fascinating host shift by an herbivorous insect.They were particularly interested in determining whether thebeak length had changed in the soapberry bugs that shiftedfrom native to introduced host plants.
Figure 8.19 contrasts the fruit radius of native and intro-duced host plants in Florida and the south central UnitedStates. In Florida the fruit of the native host plant C. corindumhas a much larger radius than the fruit of the introduced K.elegans (11.92 mm versus 2.82 mm). In the south centralUnited States soapberry bugs shifting to introduced hostplants faced the opposite situation. There, the fruit of thenative S. saponaria has a smaller radius (6.05 mm) than thefruits of the introduced K. paniculata (7.09 mm) and C. hali-cacabum (8.54 mm).
Carroll and Boyd reasoned that if beak length was undernatural selection to match the radius of host plant fruits,bugs shifting to the introduced plants in Florida should beselected for reduced beak length, while those shifting tointroduced hosts in the south central United States should beselected for longer beaks. Figure 8.20 shows the relationshipbetween soapberry beak length and the radius of fruits of theirhost plants. As you can see, there is a close correlationbetween fruit radius and beak length.
At this point we should ask whether the differences inbeak length observed by Carroll and Boyd might be develop-mental responses to the different host plants. In other words,are the differences in beak length due to genetic differencesamong populations of soapberry bugs or were they induced bythe different host plants? Fortunately, Carroll reared juvenilebugs from the various populations on alternative host plantsso we can answer this question. As it turns out, the differ-ences in beak length observed in the field among bugs feedingon the various native and introduced host plants were retainedin bugs that developed on alternative hosts. Thus, we havemore information than is available for the Anolis lizard study
Chapter 8 Population Genetics and Natural Selection 201
10
5
0Native
Florida hosts
South central U.S. hosts
Frui
t rad
ius
(mm
)
Native
Frui
t rad
ius
(mm
)
10
5
0
Introduced
Introduced 1 Introduced 2
In Florida, theintroduced hostplant has a smallerfruit compared tothe native host,while...
... in the south central U.S.,the introduced host plantsproduce larger fruits thanthe native hosts.
Figure 8.19 Comparison of the radius of fruits produced bynative and introduced species of Sapindaceae (data from Carrolland Boyd 1992).
10
9
8
7
60 4
Fruit radius (mm)
Bea
k le
ngth
(m
m)
8 12
Soapberry bugs living on hostplant species with larger diameterfruits have longer beaks.
Figure 8.20 Relationship between fruit radius and beaklength in populations of soapberry bugs living on native andintroduced species of soapberry species (data from Carroll andBoyd 1992).
mol70822_ch08.qxd 7/26/06 9:12 AM Page 201

B/WCONFIRMING
PROOF
mol70822_ch03.qxd 7/19/06 3:36 PM Page 81
reviewed earlier. Here we have evidence for a genetic basis forinterpopulational differences among soapberry bugs. Conse-quently, we can conclude that the differences in beak lengthdocumented by Carroll and Boyd were likely the result of nat-ural selection for increased or decreased beak length.
Scott Carroll, Stephen Klassen, and Hugh Dingle (1997,1998) have done extensive additional studies of soapberrybugs that document substantial genetic differences betweenpopulations living on native versus introduced plants in thefamily Sapindaceae. Significantly, from the perspective of nat-ural selection, the differences between these populations ofsoapberry bugs are great enough that both show reduced repro-duction and survival when forced to live on the alternative hostplants. That is, when soapberry bugs that normally live onnative host plants are moved to introduced plants, their survivaland reproductive rates decrease. Similarly, when soapberrybugs that now live on introduced plants are moved to nativeplants, which their ancestors fed on only 30 to 100 years ago,their reproductive and survival rates also decrease. Theseadditional studies of the genetic differences between soap-berry bug populations provide additional evidence that popu-lations of these bugs living on different host plants haveundergone natural selection for traits that favor their survivaland reproduction on their plant hosts.
Concept 8.4 Review
1. What would we have to know to conclude that thechanges observed in Anolis sagrei after they wereintroduced to small islands are the result of evolution-ary changes (see fig. 8.17)?
2. Can a trait with no heritability, h2 � 0, evolve? Explainyour answer.
3. What must have been true for beak length in soapberrybug populations before new species of soapberryplants were introduced to the United States?
8.5 Change Due to ChanceRandom processes, such as genetic drift, can change genefrequencies in populations, especially in small popula-tions. While we may often think of evolutionary change asa consequence of predictable forces such as natural selectionwhich favors, or disfavors, particular genotypes over others,allele frequencies can change as a consequence of randomprocesses such as genetic drift. Genetic drift is theoreticallymost effective at changing gene frequencies in small popu-lations such as those that inhabit islands. In the followingexamples, we consider the effects of genetic drift on popu-lations on isolated mountaintops and on islands.
Evidence of Genetic Drift in Chihuahua SpruceOne of the greatest concerns associated with fragmentationof natural ecosystems due to human land use is that reducing
habitat availability will decrease the size of animal and plantpopulations to the point where genetic drift will reduce thegenetic diversity. Are these concerns well-founded? TheHardy-Weinberg principle predicts that small populationsizes will be more subject to genetic drift (see p. 195), whichcan result in a loss of genetic variation.
Many natural populations have undergone fragmenta-tion as a consequence of changing climates and natural habi-tat fragmentation. One of those is the Chihuahua spruce,Picea chihuahuana, which is now restricted to the peaks ofthe Sierra Madre Occidental in northern Mexico. During thePleistocene glacial period when the global climate was muchcooler, spruce were found much farther south in Mexico andin more extensive populations. However, following the endof the Pleistocene and the onset of the warmer recent, orHolocene period, spruce populations moved northward andto higher elevations. Today, all spruce populations in Mexicoare restricted to small, highly fragmented areas of subalpineenvironment in the mountains of states of Chihuahua andDurango. On these high mountains, Chihuahua spruce livesin an 800 km long band along the crest of the Sierra MadreOccidental at elevations between 2,200 and 2,700 m. On alocal scale, the species is mainly found on cooler north-facing slopes along well-watered stream corridors, whichare the microclimates where you would expect to find thedescendants of an ice age relictual population. In thesemountain refuges, Chihuahua spruce persists as far south as23°30 ′ N latitude, just south of the Tropic of Cancer.
While the spruce of Durango have not been censused yet,all the Chihuahua spruce in the State of Chihuahua have beenlocated and counted. Local populations of the species rangein size from 15 to 2,441 individuals. This situation presentsitself as a natural experiment on the effects of population sizeand habitat fragmentation on genetic diversity in popula-tions. The opportunity for such studies was pursued by a jointteam of U.S. and Mexican scientists (Ledig et al. 1997). F.Thomas Ledig and Paul D. Hodgskiss from the USDA ForestService and Virginia Jacob-Cervantes and Teobaldo Eguiluz-Piedra of the Universidad Autonoma of Chapingo, Mexico,combined efforts to determine whether Chihuahua spruce haslost genetic diversity as a consequence of reduced populationsize following climatic warming after the end of the last iceage. They were also interested in whether reduced geneticdiversity may be contributing to continuing decline of thespecies and its potential for extinction.
Ledig and his colleagues were particularly interested inthe relationship between genetic diversity and populationsize. They used a technique called starch gel electrophoresisto determine the number of alleles present for 16 enzyme sys-tems. Enzymes are of course gene products, and greaternumbers of the various forms of an enzyme, which are calledallozymes, indicate higher levels of genetic diversity in apopulation. The team assayed allozyme diversity for 24genes, or loci, in seven populations ranging in size from 17to 2,441 individuals.
Ledig and his colleagues found a significant positivecorrelation between population size and genetic diversity of
202 Section III Population Ecology
mol70822_ch08.qxd 7/26/06 9:12 AM Page 202

B/WCONFIRMING
PROOF
mol70822_ch03.qxd 7/19/06 3:36 PM Page 81
their study populations. Figure 8.21 indicates that the small-est populations of Chihuahua spruce have much lower levelsof genetic diversity than the largest populations. Theseresults are consistent with the Hardy-Weinberg principle,which predicts that genetic drift will be most important insmall populations.
How might drift occur in populations of spruce living onisolated mountain peaks in western Mexico and how mightgenetic drift reduce genetic variation in spruce populations?Imagine a population of 15 Chihuahua spruce on a mountainpeak in the Sierra Madre Occidental at the beginning of Julywhen the summer rains begin. The forest is dry after a longspring drought and as the lightning produced by a thunder-storm begins to strike the mountain, one bolt hits one of thespruce trees. The tree explodes as its interior water is turnedinto superheated steam, sending showers of splintered wood50 m in all directions. The spruce tree then catches fire and theflames engulf two neighboring spruce trees before the ensu-ing torrential rains put out the fire. The result is a small spotfire that has killed three trees. The deaths of three trees wouldmake very little difference in a population of several thousand.However, in a population of just 15, three trees represent 20%of the individuals. When individuals are removed from verysmall populations their removal often reduces the frequencyof some alleles; such events will eventually eliminate somealleles entirely from a small population.
It seems likely that genetic drift is changing allele fre-quencies and reducing overall genetic diversity in populationsof Chihuahua spruce. However, this is one species occupyingrelictual environments in one corner of North America.Would we see consistent reductions in genetic diversity if weexamined a larger number of populations inhabiting insularor fragmented environments? The next study addresses thisquestion for both plants and animals.
Genetic Variation in Island PopulationsRichard Frankham (1997) of the Centre for Biodiversity andBioresources at Macquarie University in Sydney, Australia,compared the genetic diversity of island and mainland pop-ulations of both animals and plants. His study was motivatedby the fact that rates of extinction in historic times have beenmuch higher for island populations compared to mainlandpopulations. Frankham developed the idea that becauselower genetic variation within a population indicates lowerpotential for evolutionary responses to environmentalchallenge, lower genetic variation within island populationsmay be partly responsible for their greater vulnerability toextinction compared to mainland populations. However,when he reviewed what was known about the relativegenetic variation in island and mainland populations, heencountered a great deal of uncertainty. Frankham under-took his study to fill this information gap. He posed twomain questions. Do island populations of sexually reproduc-ing species have lower genetic variation than comparablemainland populations? Do endemic island populations,which have lived in isolation on islands long enough todiverge substantially from mainland populations, have lowergenetic variation than nonendemic mainland populations?
Frankham addressed these questions by thoroughlysearching the extensive literature on genetic variation in ani-mal and plant populations. His research uncovered 202 com-parisons of genetic diversity in island versus mainlandpopulations and 38 comparisons of genetic diversity inendemic species on islands versus related mainland speciespopulations. The organisms in the analysis ranged frommoose and wolves to toads, insects, and trees. The results ofFrankham’s analyses clearly support the hypothesis thatgenetic diversity is lower in island populations (fig. 8.22). Outof 202 mainland-island comparisons, 165 showed highergenetic variation in mainland populations compared to 37which indicated higher genetic variation in island popula-tions. Frankham found that the trend toward higher genetic
Chapter 8 Population Genetics and Natural Selection 203
Gen
etic
div
ersi
ty(e
xpec
ted
hete
rozy
gosi
ty)
Population size (N)
0.14
0.12
0.10
0.08
0.06
0.04
Larger populations ofChihuahua spruce possesshigher genetic diversity.
10 100 1,000
Figure 8.21 Relationship between population size and geneticdiversity of Chihuahua spruce, Picea chihuahuana, populations (datafrom Ledig et al. 1997).
Num
ber
of p
opul
atio
ns
Relative genetic variation
Mainland > island
175
150
125
100
75
50
25
0
Generally, geneticvariation is higher inmainland than inisland populations.
Island > mainland
Figure 8.22 Comparison of genetic variation in mainlandversus island populations (data from Frankham 1997).
mol70822_ch08.qxd 7/26/06 9:12 AM Page 203

B/WCONFIRMING
PROOF
mol70822_ch03.qxd 7/19/06 3:36 PM Page 81
variation in mainland populations was even stronger whenhe compared island endemic populations versus mainlandpopulations of closely related species (fig. 8.23). Out of38 endemic island-mainland comparisons, 34 showed highergenetic variation in mainland populations compared to 4which indicated higher genetic variation in endemic islandpopulations.
Frankham’s analysis takes us well beyond the study ofhow population size is related to genetic variation in popula-tions of Chihuahua spruce (Ledig et al. 1997). It appears thatin general, genetic variation is lower in isolated and generallysmaller, island populations. One of Frankham’s motivationsfor his study was to explore the possibility that lower geneticvariation in island populations may contribute to the higherrates of extinction of island populations. By demonstratingthat island populations have lower genetic variation thanmainland populations, he shows that genetic factors cannot beeliminated as a contributor to the higher extinction ratesobserved on islands. However, while this study keeps geneticdiversity alive as a viable hypothesis, it does not in itselfdemonstrate a connection between extinction rates andgenetic diversity. That connection was made in a study pub-lished a year after Frankham’s results appeared in print.
Genetic Diversity and Butterfly ExtinctionsThe landscape of Åland in southwestern Finland is a patch-work of lakes, wetlands, cultivated fields, pastures, meadows,and forest (see fig. 21.12). Here and there in this well-watered landscape you can find dry meadows that supportpopulations of plants, Plantago lanceolata and Veronica spi-cata, that act as hosts for the Glanville fritillary butterfly,Melitaea cinxia (fig. 8.24). As discussed in chapter 21, themeadows where Melitaea lives vary greatly in size, andMelitaea population size increases directly with the size ofmeadows (see fig. 21.13). Careful studies of these populationsby Ilkka Hanski, Mikko Kuussaari, and Marko Nieminen
(1994) showed that small populations of Melitaea living insmall meadows were most likely to go extinct.
Several factors likely influence the greater vulnerabilityof small populations to extinction. However, what rolemight genetic factors, especially reduced genetic variation,play in the vulnerability of small populations to extinction?Richard Frankham and Katherine Ralls (1998) point out thatone of the contributors to higher extinction rates in small pop-ulations may be inbreeding. Inbreeding, which is matingbetween close relatives, is more likely in small populations.Combining already low genetic variation in small populationswith a high rate of inbreeding has several negative impacts onpopulations, including reduced fecundity, lower juvenilesurvival, and shortened life span.
Ilik Saccheri and five coauthors (1998) reported one ofthe first studies giving direct evidence that inbreeding con-tributes to extinctions in wild populations. Saccheri and hiscolleagues studied 1,600 dry meadows and found Melitaea in524, 401, 384, and 320 of the meadows in 1993, 1994, 1995,and 1996, respectively. Over this period they documented anaverage of 200 extinctions and 114 colonizations of meadowsannually. As you can see, these populations are highlydynamic. In order to determine the extent that genetic factors,especially inbreeding, may contribute to extinctions, Sac-cheri and his colleagues conducted genetic studies on popu-lations of Melitaea in 42 of the meadows. They estimatedheterozygosity, an indicator of genetic variability, withrespect to seven enzyme systems and one locus of nuclearmicrosatellite DNA. The researchers used the level of het-erozygosity within each meadow population as an indicatorof inbreeding, with low heterozygosity indicating high lev-els of inbreeding.
The results of the study indicated that influence ofinbreeding on the probability of extinction was very signifi-cant. It turned out that the populations with the highest lev-els of inbreeding (lowest heterozygosity) had the highestprobabilities of extinction. Saccheri and his colleaguesfound a connection between heterozygosity and extinction
204 Section III Population EcologyN
umbe
r of
pop
ulat
ions
Relative genetic variation
Mainland > endemic
30
20
10
0
Mainland populationsare very likely to showmore genetic variationthan island endemicpopulations.
Island endemic > mainland
Figure 8.23 Comparison of genetic variation in mainlandversus island populations (data from Frankham 1997).
Figure 8.24 Long-term studies of the Glanville fritillarybutterfly, Melitaea cinxia, have provided exceptional insights intothe relationship between population size and genetic diversity.
mol70822_ch08.qxd 7/26/06 9:12 AM Page 204

B/WCONFIRMING
PROOF
mol70822_ch03.qxd 7/19/06 3:36 PM Page 81
through effects on larval survival, adult longevity, and egghatching. Females with low levels of heterozygosity pro-duced smaller larvae, fewer of which survived to the winterdormancy period. Pupae of mothers with low heterozygosityalso spent more time in the pupal stage, exposing them togreater attack by parasites. In addition adult females with lowheterozygosity had lower survival and laid eggs with a 24 to46% lower rate of hatching. These effects have the potentialto reduce the viability of local populations of Melitaea thatare made up of individuals of low heterozygosity (lowgenetic variation) and increase their risk of local extinction.
We have seen how the small population size and isola-tion can influence the genetic structure of populationsof many kinds of organisms, including the Chihuahua spruceisolated in cool moist microenvironments in the mountains ofMexico and the Glanville fritillary, Melitaea in the drymeadow environments of southwestern Finland. In situa-tions like these, chance plays a significant role in determin-ing the genetic structure of populations.
Concept 8.5 Review
1. Why do the managers of captive breeding and reintro-duction programs for endangered species try to main-tain high levels of genetic diversity?
2. What is the ecological significance of Frankham’sfinding lower genetic variation in smaller, isolatedisland populations?
Estimating Genetic Variationin Populations
In chapter 8 we have focused considerable attention ongenetic variation in populations. Here we return to geneticvariation to review some methods used to measure this sig-nificant aspect of population structure. How did the scien-tists whose work we discussed in this chapter study geneticvariation in populations? The earlier research by Clausen,Keck, and Hiesey (1940) used transplant experiments todetect genetic differences among populations. More recentresearch on genetic variation in Chihuahua spruce (Ledig et al.1997) and in the Glanville fritillary butterfly (Saccheri et al.1998) used techniques developed in molecular biology.Modern molecular techniques are allowing evolutionaryecologists to explore details of genetic variation within andamong populations that would be impossible without thesemodern techniques.
Molecular Approaches to Genetic VariationThe tools of molecular biology can be used to determine thegenotypes of individuals either by looking at products of
genes, such as enzymes, or by analyzing DNA directly.Ledig and his coauthors (1997) estimated genetic variation inpopulations of Chihuahua spruce by measuring variation inthe allozymes of 16 different enzyme systems (see fig. 8.21).Because allozymes of the same enzyme are the products ofdifferent alleles of the same gene locus, the number ofallozymes produced by a population can be used as an indi-cator of genetic variation within the population. Many stud-ies of enzymes examine isozymes, which are enzymes withthe same biochemical function. Different isozymes may beproduced by the same or different loci. Though enzymestudies remain a useful and powerful tool in evolutionarystudies, genetic variation is increasingly assessed by lookingdirectly at DNA. For instance, Saccheri and his colleagues(1998) used a combination of enzyme and direct DNA stud-ies to characterize the genetic structure of populations of theGlanville fritillary butterfly. A detailed review of molecularmethods used to study genetic variation is well beyond thescope of this discussion. However, reviewing at least thebasics of some of the common molecular methods used tostudy genetic variation will offer an entry to this powerful setof modern tools.
In enzyme studies the tissues of organisms are generallymechanically homogenized and the resulting homogenateanalyzed for the presence and kinds of enzymes. Generally,larger tissue samples are required for enzyme studies thanfor studies of DNA. Since DNA studies may be performedon very small samples, biologists may sample populationswithout damaging them. Nondestructive sampling is espe-cially important in the study of endangered species or in anystudy following known individuals over long periods oftime. For instance, the grizzly bears of Glacier National Parkare being counted and mapped using the DNA in hair that thebears leave on scratching trees and on baited hair traps(USGS 2000). To obtain sufficient quantities of DNA foranalysis, such as that contained within a hair follicle, biolo-gists generally use one of two techniques to amplify thequantity of DNA present in a sample. DNA is usually clonedeither by using bacteria and recombinant DNA technology orby a procedure called polymerase chain reaction or PCR(Hillis et al. 1996). During the PCR process, short, single-stranded DNA is used as primers for DNA synthesis. Eachprimer is highly specific for a given nucleotide sequence andcan be used to amplify a specific locus or gene. However inone approach, designed simply to identify genetic differ-ences or similarities, somewhat randomly chosen primersare used to amplify unspecified DNA sequences. This is theso-called random amplified polymorphic DNA, or RAPD,method. These techniques are well presented in many intro-ductory biology texts.
Once a sufficient quantity of DNA has been obtained, thesample may be analyzed in several ways. One commonlyapplied method uses restriction enzymes, enzymes pro-duced naturally by bacteria to cut up foreign DNA. Restric-tion enzymes cut DNA molecules at particular places calledrestriction sites. The locations of restriction sites along aDNA molecule are determined by the locations of specific
Chapter 8 Population Genetics and Natural Selection 205
mol70822_ch08.qxd 7/26/06 9:12 AM Page 205

B/WCONFIRMING
PROOF
mol70822_ch03.qxd 7/19/06 3:36 PM Page 81
nucleotide sequences. Nucleotides are the basic buildingblocks of nucleic acids and are made up of a five-carbonsugar (deoxyribose or ribose), a phosphate group, and anitrogenous base (guanine, cytosine, adenine, or thymine).The nucleotide sequences determining restriction sites alongthe length of a DNA molecule are different for differentrestriction enzymes. Because restriction sites are determinedby a specific sequence of base pairs on the DNA molecule,differences in number and location of restriction sites reflectdifferences in DNA structure. When exposed to a particularrestriction enzyme, a given DNA molecule will be broken upinto a series of DNA fragments of precise number andlengths. The number and lengths of DNA fragments, calledrestriction fragments, are determined by the number andlocation of restriction sites for a particular restrictionenzyme. Therefore, if DNA samples from different organismsexposed to the same restriction enzyme yield different num-bers and lengths of DNA fragments, we can conclude thatthose organisms differ genetically.
The number and sizes of restriction fragments resultingfrom treating a DNAmolecule with restriction enzymes or the
number of isozymes present in the homogenized tissues of anorganism may be analyzed using a technique called elec-trophoresis. Electrophoresis uses the rate at which enzymes,DNAfragments, or other macromolecules move in an electri-cal field as a means of identifying the molecules (fig. 8.25).When placed in an electrical field, a molecule will moveeither toward the positive or negative end of the field. Nega-tively charged molecules will move toward the positive end,while positively charged molecules will move toward thenegative pole. Smaller molecules move more rapidly thanlarger molecules. Due to the influences of molecule size andcharge on rates of movement, isozymes or DNA restrictionfragments of different structure will migrate at different ratesduring electrophoresis. Consequently during a given timeinterval, molecules of different sizes will migrate differentdistances from the point where they are initially placed in theelectrical field.
Electrophoresis is generally referred to as gel elec-trophoresis because migration of molecules generally takesplace in one of several possible types of gels. Various stainsand other techniques have been developed to detect the
206 Section III Population Ecology
+
+
+
+
Because smaller molecules migrate faster, different allozymes or DNA fragmentswill separate along gel.
Allozymes or DNA fragmentswill migrate to other end of thegradient at a rate depending ontheir size and electrical charge.
GelNegativepole
Positive pole
I
II
III
IV
I
II
III
IV
Electrical power supply
1. Setting up Researcher places samples of enzymes or DNA fragments into wells at one end of the electrical field.
2. After migration Gel is treated with stain or dye to reveal locations of molecules.
Larger molecules
Medium molecules
Smaller molecules
Samples III and IV containdistinctive sets of allozymesor DNA fragments.
Samples I and II contain identicalallozymes or DNA fragments.3. Conclusion
Samples I, II, III, and IV include three different genotypes: Samples I and II have the same genotype, while samples III and IV represent two other genotypes.
–
–
–
–
Figure 8.25 Gel electrophoresis can be used to study genetic variation.
mol70822_ch08.qxd 7/26/06 9:12 AM Page 206

B/WCONFIRMING
PROOF
mol70822_ch03.qxd 7/19/06 3:36 PM Page 81
locations of DNA fragments or of specific enzymes within thegel after an electrophoresis run. The result is a pattern ofbanding in a gel that generally allows the biologist to iden-tify genetic differences among individuals. By samplingmany individuals from a population researchers can charac-terize the genetic structure of the population and determineif populations differ genetically.
What do the banding patterns, such as those shown in fig-ure 8.25, reveal about the genetics of individuals and popu-lations? We can say that the sample of four hypotheticalindividuals depicted in figure 8.25 includes three differentgenotypes. Individuals I and II have the same genotype,while individuals III and IV are of two other genotypes. Bysampling many individuals and many enzyme systems orgenetic loci in a population, the biologist will be able to esti-mate the genetic variation and genetic composition of a pop-ulation. After characterizing several populations, we can testquestions such as whether population size influences geneticvariation in species such as the Chihuahua spruce (seefig. 8.21) or whether island populations of a species have lessgenetic variation than mainland populations of the samespecies (see fig. 8.23).
An approach that gives a very high resolution picture ofthe genetic makeup of individuals and populations and thatis receiving increasing attention is DNA sequencing.Because sequencing reveals the sequence of nucleic acidsalong DNA molecules, this tool gives the ultimate genetic
information. The number of DNA sequences described isincreasing rapidly and our ability to interpret and compareDNA sequence data is also increasing at an impressive rate(Hillis et al. 1996). While the Human Genome Project hasassumed center stage (DOE 2000), the genomes of manyother species are completely described or will be soon.
David Hillis and his coauthors (1996) suggest that DNAsequencing can be used as a powerful tool for studyinggenetic variation within and among populations. Some ofthe areas where sequencing might be applied include geo-graphic variation among populations and gene flow amongpopulations. However, Hillis and his team point out thatthere are trade-offs. Obtaining and interpreting the highlydetailed information provided by sequencing for one or twoloci necessarily limits the number of loci that the biologist canstudy. Where the emphasis is on studying larger numbers ofloci, isozyme studies or restriction fragment analyses allowthe researcher to study larger numbers of loci. At this pointin time, the biologist’s choice of methods is governed bythese trade-offs.
Future advances in DNA sequencing and analysis willvery likely improve the potential for comparing large num-bers of loci using sequence data. Regardless of future devel-opment, ecologists now have many powerful tools forassessing the extent of genetic variation in populations.These tools will be invaluable as this generation of ecologistsworks to conserve the earth’s biodiversity.
Chapter 8 Population Genetics and Natural Selection 207
Darwin and Mendel complemented each other well and theirtwin visions of the natural world revolutionized biology. Thesynthesis of the theory of natural selection and genetics gaverise to modern evolutionary ecology. Here we examine fivemajor concepts within the area of population genetics and nat-ural selection.
Phenotypic variation among individuals in a popula-tion results from the combined effects of genes and envi-ronment. The first biologists to conduct thorough studiesof phenotypic and genotypic variation and to incorporateexperiments in their studies, focused on plants. Clausen,Keck, and Hiesey explored the extent and sources of mor-phological variation in plant populations, including both theinfluences of environment and genetics. Case determinedthat the best predictor of chuckwalla, Sauromalus, bodylength was average winter rainfall. Tracy’s laboratorygrowth experiments indicated that variation in body sizeamong chuckwalla populations is at least partly determinedby genetic differences among populations.
The Hardy-Weinberg equilibrium model helps iden-tify evolutionary forces that can change gene frequenciesin populations. Because evolution involves changes ingene frequencies in a population, a thorough understandingof evolution must include the area of genetics known as pop-ulation genetics. One of the most fundamental concepts inpopulation genetics, the Hardy-Weinberg principle, states
that in a population mating at random in the absence of evo-lutionary forces, allele frequencies will remain constant. Fora population in Hardy-Weinberg equilibrium in a situationwhere there are only two alleles at a particular locus, p + q �1.0. The frequency of genotypes in a population in Hardy-Weinberg equilibrium can be calculated as (p + q)2 �(p + q) × (p + q) � p2 + 2pq + q2 � 1.0. The conditions nec-essary to maintain constant allele frequencies in a populationare: (1) random mating, (2) no mutations, (3) large popula-tion size, (4) no immigration, and (5) equal survival andreproductive rates for all genotypes. When a population is notin Hardy-Weinberg equilibrium, the Hardy-Weinberg prin-ciple helps us to identify the evolutionary forces that may bein play.
Natural selection is the result of differences in sur-vival and reproduction among phenotypes. Naturalselection can lead to change in populations but it can alsoserve as a conservative force, impeding change in a popula-tion. Stabilizing selection acts against extreme phenotypesand as a consequence, favors the average phenotype. Byfavoring the average phenotype, stabilizing selectiondecreases phenotypic diversity in populations. Directionalselection favors an extreme phenotype over other pheno-types in the population. Under directional selection, theaverage of the trait under selection can change over time. Dis-ruptive selection favors two or more extreme phenotypes
mol70822_ch08.qxd 7/26/06 9:12 AM Page 207

B/WCONFIRMING
PROOF
mol70822_ch03.qxd 7/19/06 3:36 PM Page 81
over the average phenotype in a population, leading to aincrease in phenotypic diversity in the population.
The extent to which phenotypic variation is due togenetic variation determines the potential for evolution bynatural selection. The most general postulate of the theoryof natural selection is that the environment determines theevolution of the anatomy, physiology, and behavior oforganisms. Some of the clearest demonstrations of naturalselection have resulted from studies of populations of Galá-pagos finches. Losos, Warheit, and Schoener used replicatedfield experiments to study natural selection for changes inmorphology in Anolis lizard populations. Their results indicatethat colonizing populations can adapt rapidly to new envi-ronmental conditions. Studies by Carroll and several col-leagues show that soapberry bug populations living on nativeand introduced host plants have undergone natural selectionfor traits that favor their survival and reproduction on partic-ular host plant species. Hundreds of other examples of naturalselection have been brought to light during the nearly oneand a half century since Darwin published his theory.
Random processes, such as genetic drift, can changegene frequencies in populations, especially in small popu-lations. Genetic drift is theoretically most effective atchanging gene frequencies in small populations such as thosethat inhabit islands. One of the greatest concerns associated
with fragmentation of natural ecosystems due to human landuse is that reducing habitat availability will decrease the sizeof animal and plant populations to the point where genetic driftwill reduce the genetic diversity within natural populations.Ledig and his colleagues found a significant positive correla-tion between population size and genetic diversity in popula-tions of Chihuahua spruce, a naturally fragmented populationof trees living on mountain islands. Frankham showed thatcompared to mainland populations, island populations gen-erally include less genetic variation. Saccheri and his col-leagues found that higher heterozygosity (genetic diversity)was associated with lower rates of population extinctionthrough the effects of heterozygosity on larval survival, adultlongevity, and egg hatching in populations of the Glanvillefritillary butterfly, Melitaea cinxia.
The earlier research on adaptation of populations tolocal environmental conditions used transplant experimentsto detect genetic differences among populations. Morerecent research on genetic variation within and among pop-ulations has applied techniques developed in molecular biol-ogy. Ecologists now have many powerful tools, rangingfrom classical techniques to modern technologically sophis-ticated approaches, for assessing the extent of genetic varia-tion within and among populations and meeting thechallenge of documenting and conserving biodiversity.
208 Section III Population Ecology
adaptation 185
allele 186
allele frequencies 194
allozyme 202
dependent variable 198
directional selection 196
disruptive selection 197
DNA sequencing 207
ecotype 187
electrophoresis 206
endemic 203
evolution 185
genetic drift 195
Hardy-Weinberg principle 194
heritability 197
inbreeding 204
independent variable 198
isozyme 205
loci 202
microsatellite DNA 192
natural selection 185
nucleotide 206
population genetics 192
regression coefficient 198
regression line 198
restriction enzyme 205
restriction fragment 206
restriction site 205
stabilizing selection 195
more recent studies by Christopher Tracy add to our under-standing of variation among chuckwalla populations?
4. What is the Hardy-Weinberg principle? What is Hardy-Weinberg equilibrium? What conditions are required forHardy-Weinberg equilibrium?
5. Review the Hardy-Weinberg equilibrium equation. What partsof the equation represent gene frequencies? What elementsrepresent genotype frequencies and phenotype frequencies?Are genotype and phenotype frequencies always the same?Use a hypothetical population to specify alleles and allelicfrequencies as you develop your presentation.
6. What is genetic drift? Under what circumstances do youexpect genetic drift to occur? Under what circumstances is
1. Contrast the approaches of Charles Darwin and GregorMendel to the study of populations. What were Darwin’s maindiscoveries? What were Mendel’s main discoveries? How didthe studies of Darwin and Mendel prepare the way for the laterstudies reviewed in chapter 8?
2. Review the historical studies of genetic and phenotypic varia-tion among populations of plants using transplant experiments.How did the studies of Clausen, Keck, and Hiesey complementthese earlier studies?
3. What environmental variable did Ted Case determine to be thebest predictor of variation in body size among populations ofchuckwallas? Did Case’s studies of chuckwallas demonstrategenetic differences among his study populations? What did the
mol70822_ch08.qxd 7/26/06 9:12 AM Page 208

B/WCONFIRMING
PROOF
mol70822_ch03.qxd 7/19/06 3:36 PM Page 81
genetic drift unlikely to be important? Does genetic driftincrease or decrease genetic variation in populations.
7. Suppose you are a director of a captive breeding program fora rare species of animal, such as Siberian tigers, which arefound in many zoos around the world but are increasingly rarein the wild. Design a breeding program that will reduce the pos-sibility of genetic drift in captive populations.
8. Jonathan Losos, Kenneth Warheit, and Thomas Schoener’sstudies of Anolis populations demonstrated significant mor-phological change following introduction of the lizards tovarious islands differing in vegetative structure. Design anexperiment to determine whether the morphological changes in
the study populations were based on genetic changes. Can youadapt the methods of Christopher Tracy to this project?
9. How did the studies of Scott Carroll and his colleaguesdemonstrate rapid evolutionary adaptation to introduced soap-berry plants? What advantages do a group of organisms, suchas soapberry bugs, offer to researchers studying natural selec-tion compared to larger organisms such as Chihuahua spruceand chuckwalla lizards?
10. How do classical approaches to genetic studies, such as com-mon garden experiments, and modern molecular techniques,such as DNA sequencing, complement each other? What are theadvantages and disadvantages of each?
Chapter 8 Population Genetics and Natural Selection 209
Carroll, S. P. and C. Boyd. 1992. Host race radiation in thesoapberry bug: natural history with the history. Evolution46:1052–69.
Carroll, S. P., S. P. Klassen, and H. Dingle. 1998. Rapidlyevolving adaptations to host ecology and nutrition in thesoapberry bug. Evolutionary Ecology 12:955–68.
This pair of papers traces the fascinating story of some of theresearch that has revealed one of the best documented cases ofnatural selection of herbivorous insect populations for livingas specialists on particular plant species. These papersshowcase well designed and carefully executed studies ofevolutionary ecology.
Case, T. J. 1976. Body size differences between populations of thechuckwalla, Sauromalus obesus. Ecology 57:313–23.
Tracy, C. R. 1999. Differences in body size among chuckwalla(Sauromalus obesus) populations. Ecology 80:259–71.
Separated by over 20 years, these companion papers explorethe relationship between climate, variation in morphology,and local adaptation by chuckwallas—careful work on aninteresting animal.
Douglas, M. R. and P. C. Brunner. 2002. Biodiversity of centralalpine Coregonus (Salmoniformes): impact of one-hundredyears of management. Ecological Applications 12:154–72.
A thorough and modern exploration of the geneticmorphologic structure of a complex evolutionary lineage,made even more complex by intensive management.
Ehrlich, P. R. and I. Hanski. 2004. On the Wings of Checkerspots:A Model System for Population Biology. Oxford: OxfordUniversity Press.
Inspiring and readable book, summarizing decades of researchon checkerspot butterflies on two continents.
Pappers, S. M., G. van der Velde, N. J. Ouborg, and J. M. vanGroenendael. 2002. Genetically based polymorphisms inmorphology and life history associated with putative host racesof the water lily leaf beetle Galerucella nymphaeae. Evolution56:1610–21.
Carefully controlled studies of heritability of polymorphictraits in populations of the water lily leaf beetle.
Reznick, D. N. and C. K. Ghalambor. 2005. Selection in nature:experimental manipulations of natural populations. Integrative and Comparative Biology 45:456–62.
Excellent and concise summary of the foremost fieldexperiments on natural selection.
mol70822_ch08.qxd 7/26/06 9:12 AM Page 209


![¶ò ºc b¿´Zòü¢èZ¥Ø yu殿dÄl´ yuZ¥] · 2014. 12. 30. · yuZ¥] yu 殿dÄl´ b¿´Zòü ¢èZ¥Ø ¶ò ºc ½Z°¥·Yy u aZØvs ²øY büZø ±Y{yY ±Yºcæ°³](https://img.pdfslide.net/doc/110x75/611eaf346745ae4b770e16d5/-c-bzz-yudl-yuz-2014-12-30-yuz-yu-dl.jpg)


![˘ˇˆ˙˝˛˚˜ - Hokkaido Bank · ˘ˇˆ˙ ˝ ˛˚˜ !"#$%& ’()* +,- ./0˛12˜3.4 560˛789:;?@abc@ de ˙fghij klmn3.opq#rs t@0˛2&ˇuv˛1 w ’ )* +, e x˛yuz[& ˘\˛]^](https://img.pdfslide.net/doc/110x75/5eb98c634238f617fd5b3a9d/oe-hokkaido-bank-oe-a-012oe34.jpg)


![Mp qrs tuKv wdk^b x^glgb]dd yUz' { X|](https://img.pdfslide.net/doc/110x75/62067b432f1d427bdd1f97d9/mp-qrs-tukv-wdkb-xglgbdd-yuz-x.jpg)