Embed Size (px)
Citation preview

Yves Alarie, PhD Professor Emeritus
Graduate School of Public Health University of Pittsburgh

QSARs to Commemorate the Fiftieth Anniversary
of the RD50 Annual Society of Toxicology Meeting
March 2016 * No conflict of interest in the preparation and presentation of these slides

OBJECTIVES AND GOALS Estimates of Threshold Limit Values (TLVs)
for New Chemicals
• Restricted to Volatile Organic Chemicals (VOCs)
• Both Non-Reactive (nrVOCs) and Reactive (rVOCs)
• Estimates obtained from RD50 values obtained in mice
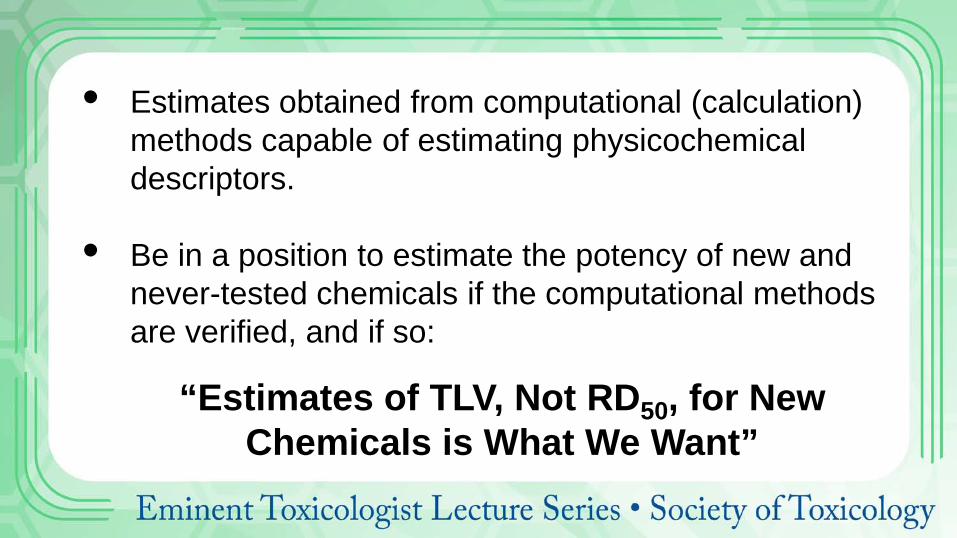
“Estimates of TLV, Not RD50, for New Chemicals is What We Want”
• Estimates obtained from computational (calculation) methods capable of estimating physicochemical descriptors.
• Be in a position to estimate the potency of new and
never-tested chemicals if the computational methods are verified, and if so:

BRIEF HISTORY - TRIGEMINAL REFLEX


PRIOR WORK AS A STARTING POINT Sensory irritation is a frequently-used basis for TLVs; from 25% to 50% of TLVs have sensory irritation as a direct or secondary part in their basis.
The potency of VOCs as sensory irritants has been evaluated in mice since 1966* and:
*From: Alarie, Y. (1966). Arch. Environ. Health 13: 433-449

a) formal validation was undertaken using 26 positive and 26 negative sensory irritants in humans, resulting in the same classification in mice.
b) the potency of sensory irritants in mice was then measured from a decrease in respiratory frequency by 50% (RD50) using concentration-response relationships.
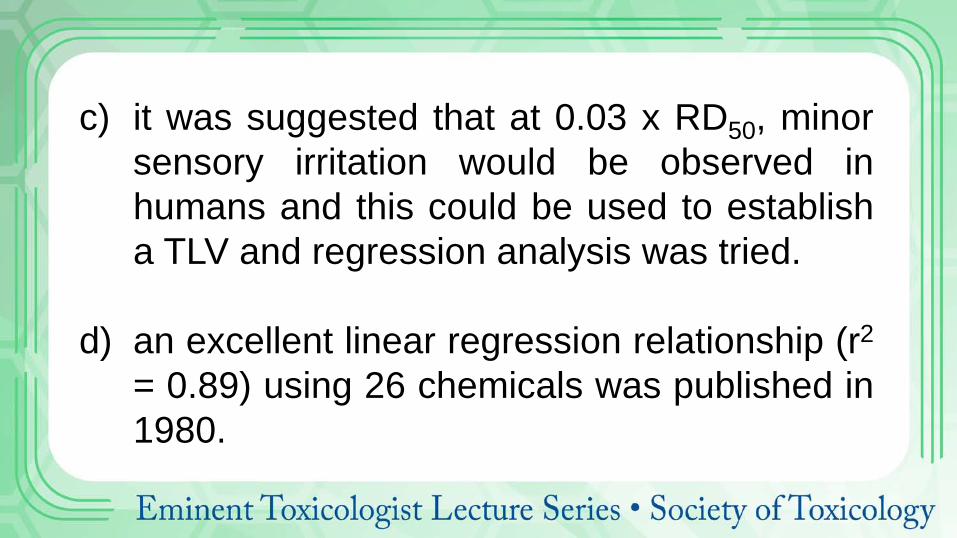
c) it was suggested that at 0.03 x RD50, minor sensory irritation would be observed in humans and this could be used to establish a TLV and regression analysis was tried.
d) an excellent linear regression relationship (r2 = 0.89) using 26 chemicals was published in 1980.
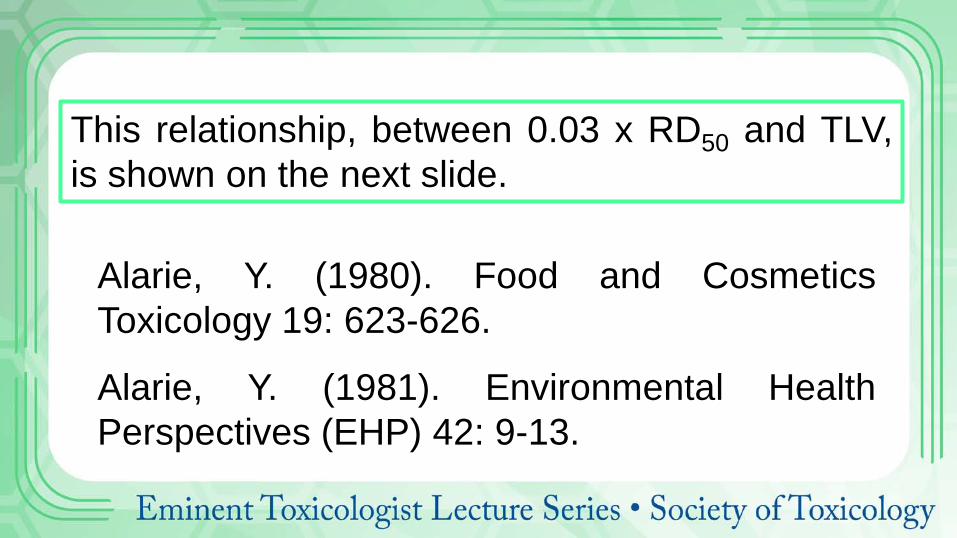
Alarie, Y. (1980). Food and Cosmetics Toxicology 19: 623-626.
Alarie, Y. (1981). Environmental Health Perspectives (EHP) 42: 9-13.
This relationship, between 0.03 x RD50 and TLV, is shown on the next slide.

26 Chemicals R sq. = 0.90

BRIEF DESCRIPTION OF THE ORIGINAL RD50 METHOD, “THE MOUSE BIOASSAY”
From: Alarie, Y. (1966). Arch. Environ. Health 13: 433-449

Exposure Chamber
BRIEF DESCRIPTION …

Recording of Breathing Patterns in Mice
BRIEF DESCRIPTION …

Concentration-Response Relationship and RD50
BRIEF DESCRIPTION …
COMPUTERIZED METHOD TO EVALUATE SENSORY IRRITATION (SI), AIRFLOW LIMITATION (A), AND
PULMONARY IRRITATION (P): SI, A, P
The next set of three slides (1, 2, 3) was taken from: Vijayaraghavan, R, Schaper, M, Thompson, R, Stock, MF, Boylstein, LA, Luo, JE and Alarie, Y. (1994). Computer assisted recognition and quantitation of the effects of airborne chemicals acting at different areas of the respiratory tract in mice. Arch. Toxicol. 68: 490-499.

1)COMPUTERIZED METHOD FOR SI,A,&P A: Normal conditions Airflow signal (Vdot) and integrated Vdot to yield VT. A horizontal line is drawn at zero Vdot, separating the airflow during inspiration (VI), upward and airflow during expiration (VE), downward. D: Measuring TB and TP Hand-drawn wave showing how TB (duration of braking) and TP (duration of pause) are measured.

2)COMPUTERIZED METHOD FOR SI,A,&P B: During sensory irritation Note the major change: an increase in TB. This will also result in a net decrease in respiratory frequency (f). C: During bronchoconstriction Note the major changes: longer duration of expiration with much lower Vdot than normal. To quantify this change, Vdot at mid-tidal volume during expiration (0.5 VTE), abbreviated VD here is measured. VD has also been abbreviated EF50, expiratory flow at 0.5 VT. There is also a net decrease in f.
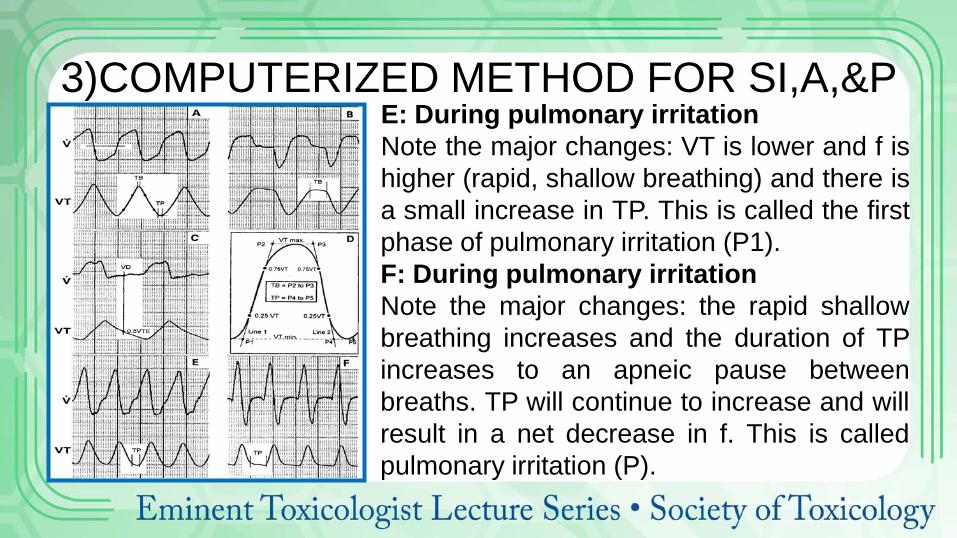
3)COMPUTERIZED METHOD FOR SI,A,&P E: During pulmonary irritation Note the major changes: VT is lower and f is higher (rapid, shallow breathing) and there is a small increase in TP. This is called the first phase of pulmonary irritation (P1). F: During pulmonary irritation Note the major changes: the rapid shallow breathing increases and the duration of TP increases to an apneic pause between breaths. TP will continue to increase and will result in a net decrease in f. This is called pulmonary irritation (P).
SENSORY IRRITATION: MEASURING POTENCY Given the above, we can assess whether or not an airborne chemical has sensory irritating properties by measuring TB or by simply measuring respiratory frequency (f or BPM) provided that the decrease in f is due to an increase in TB, obviously.
COMPUTERIZED METHOD FOR SI,A,&P
COMPUTERIZED METHOD FOR SI,A,&P The figures presented on the next slide*: Concentration-response relationship for %BPM and %TB, during exposure to CBC. The regression line (solid), 95% CI (dotted lines), and 95% PI (dashed lines) are presented. Open circles indicate data points omitted, see text. *From: Alarie, Y. (1998). Computer-based bioassay for evaluation of sensory irritation of airborne chemicals and its limit of detection. Arch. Toxicol. 72: 277-282.

%BPM = 59.51 + (64.99 x log concentration), r2 = 0.96 %TB = 824.9 + (715 x log concentration), r2 = 0.93

BRIEF UPDATE OF RESULTS FROM 1966-2007
• Continued progress was made, increasing the number of chemicals evaluated and a review with QSAR was published by Y. Alarie in 1973 (Crit. Rev. Toxicol. 2: 299-363)
• M. Schaper published in 1993 a large database (total of 244 chemicals), containing 89 VOCs for which RD50 and TLV values were available, again with very good linear regression relationships found (Am. Ind. Hyg. Assoc. J. 54: 488-544).

• Using this database, Alarie et al. (1998 Arch. Toxicol. 72: 125-140) extracted 145 VOCs, 83 reactive and 59 non-reactive and were able using Abraham’s chemical descriptors for nrVOCs to estimate their potency. Excellent results were obtained, but restricted only to nrVOCs. Results for rVOCs were explained separately.
• Original and computerized methods were used by investigators in China, Denmark, Finland, France, Germany, India, Japan, Poland, etc. More chemicals have been added, or the same chemicals have been tested by several laboratories.

. • Therefore, the 1993 database of Schaper
has now been updated and contains 102 chemicals for which we also have TLVs. Since several chemicals have also been evaluated by several laboratories, we now have a total of 184 entries.
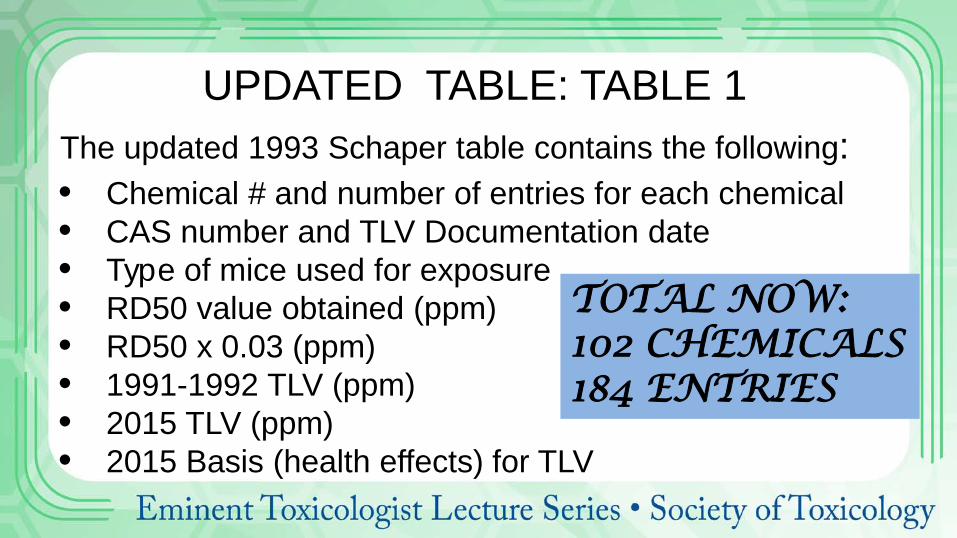
UPDATED TABLE: TABLE 1 The updated 1993 Schaper table contains the following: • Chemical # and number of entries for each chemical • CAS number and TLV Documentation date • Type of mice used for exposure • RD50 value obtained (ppm) • RD50 x 0.03 (ppm) • 1991-1992 TLV (ppm) • 2015 TLV (ppm) • 2015 Basis (health effects) for TLV
TOTAL NOW: 102 CHEMICALS 184 ENTRIES
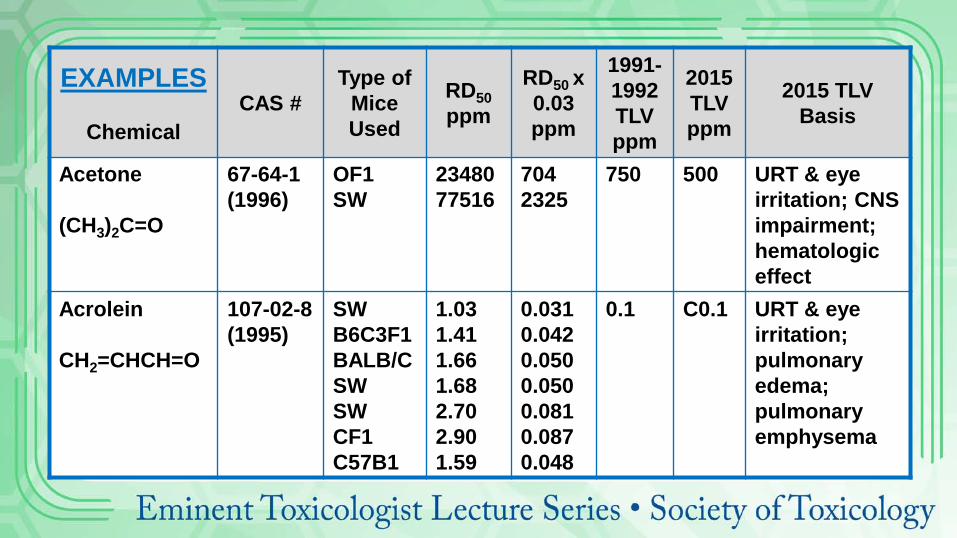
EXAMPLES
Chemical CAS #
Type of Mice Used
RD50 ppm
RD50 x 0.03 ppm
1991-1992 TLV ppm
2015 TLV ppm
2015 TLV Basis
Acetone (CH3)2C=O
67-64-1 (1996)
OF1 SW
23480 77516
704 2325
750 500 URT & eye irritation; CNS impairment; hematologic effect
Acrolein CH2=CHCH=O
107-02-8 (1995)
SW B6C3F1 BALB/C SW SW CF1 C57B1
1.03 1.41 1.66 1.68 2.70 2.90 1.59
0.031 0.042 0.050 0.050 0.081 0.087 0.048
0.1 C0.1 URT & eye irritation; pulmonary edema; pulmonary emphysema

EXAMPLES
Chemical CAS #
Type of Mice Used
RD50 ppm
RD50 x 0.03 ppm
1991-1992 TLV Ppm
2015 TLV ppm
2015 TLV Basis
Allyl Alcohol CH2=CH-CH2OH
107-18-6 (1996)
OF1 ICR CF1
1.6 2.5 3.9
0.048 0.075 0.117
2.0 0.5 URT & eye irritation
n-Propyl Alcohol (n-Propanol) CH3-CH2-CH2OH
71-23-8 (2006)
OF1 SW CF1
4780 12704 13660
143 381 409
200 100 URT & eye irritation

TABLE 1 - DISCUSSION POINTS ACETONE: nrVOC, low potency, factor of 3 between the two types of mice, drop in TLV 1991 to 2015, added effect to URT
ACROLEIN: rVOC, very high potency, factor of 3 between different types of mice, added C in 2015, added effects to URT
ALLYL ALCOHOL: rVOC, very high potency, factor of 3 between different types of mice, drop in TLV from 1991 to 2015
n-PROPYL ALCOHOL: nrVOC, very low potency, shows effect of unsaturation in allyl alcohol, again a factor of 3 between different types of mice, again drop in TLV from 1991 to 2015
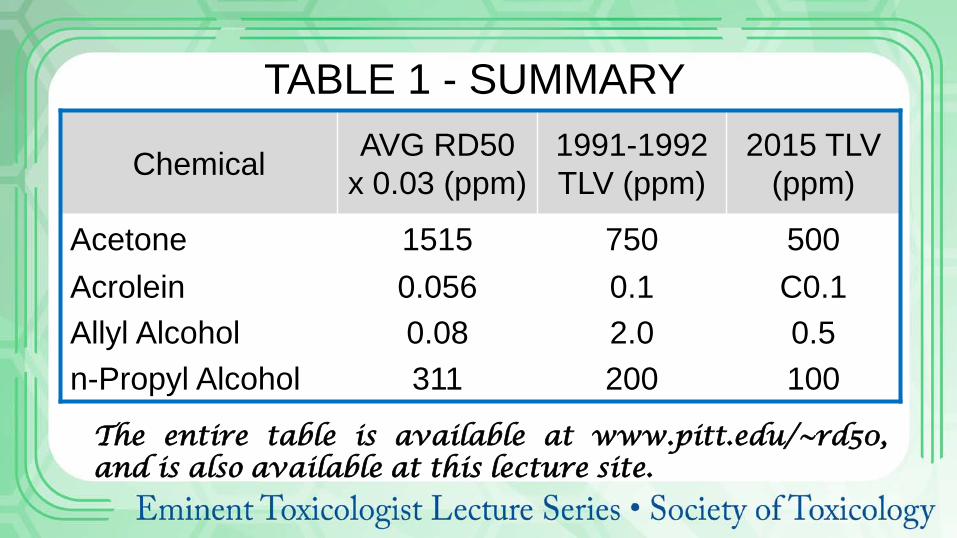
TABLE 1 - SUMMARY
Chemical AVG RD50 x 0.03 (ppm)
1991-1992 TLV (ppm)
2015 TLV (ppm)
Acetone 1515 750 500 Acrolein 0.056 0.1 C0.1 Allyl Alcohol 0.08 2.0 0.5 n-Propyl Alcohol 311 200 100
The entire table is available at www.pitt.edu/~rd50, and is also available at this lecture site.
1000010001001010.10.010.001
100000
10000
1000
100
10
1
0.1
0.01
0.001
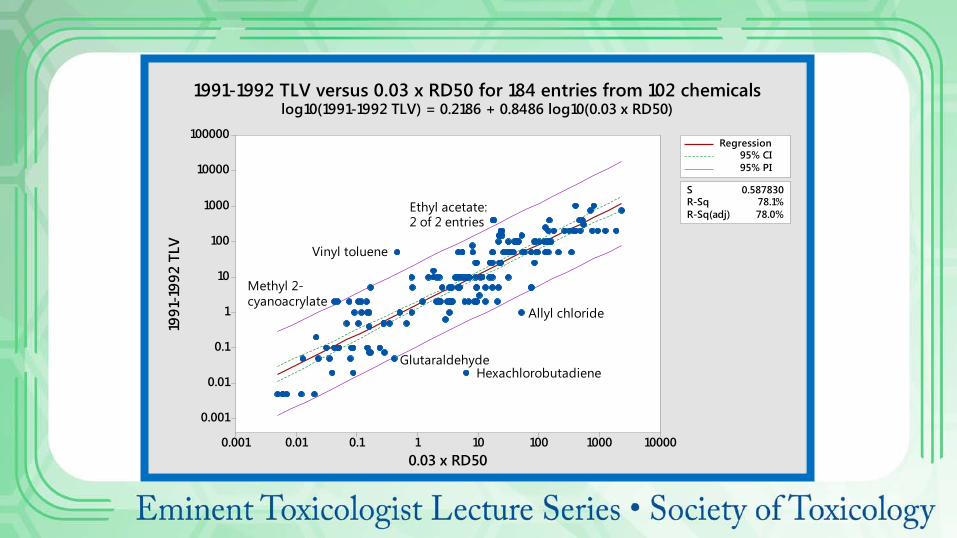
S 0.587830R-Sq 78.1%R-Sq(adj) 78.0%
0.03 x RD50
1991
-199
2 TL
V
Regression95% CI95% PI
1991-1992 TLV versus 0.03 x RD50 for 184 entries from 102 chemicalslog10(1991-1992 TLV) = 0.2186 + 0.8486 log10(0.03 x RD50)
HexachlorobutadieneGlutaraldehyde
Allyl chloride
2 of 2 entriesEthyl acetate:
Vinyl toluene
cyanoacrylateMethyl 2-

210-1-2
99.999
90
50
10
10.1
Residual
Perc
ent
20-2
2
0
-2
Fitted Value
Resi
dual
1.500.750.00-0.75-1.50-2.25
45
30
15
0
Residual
Freq
uenc
y
180160140120100806040201
2
0
-2
Observation Order
Resi
dual
Normal Probability Plot Versus Fits
Histogram Versus Order
Residual Plots for log10(1991-1992 TLV)

REGRESSION ANALYSIS 0.03 x RD50 VS 1991-1992 TLV
Plot includes all strains of mice used to obtain RD50 values R sq = 0.78

Using the data from Table 1, the next two slides illustrate: 1. Linear regression analysis of 2015 TLV versus 0.03 x RD50 2. Analysis of the residuals for the least squares linear regression analysis of 2015 TLV vs. 0.03 x RD50 in the figure can be inspected and shows that the linear model is adequate. Outliers are easily identified as noted on the linear regression analysis plot. Statistical analysis was conducted using Minitab 17. In the “Versus Order” plot, the observation numbers correspond to the entry numbers in Table 1.

1000010001001010.10.010.001
100000
10000
1000
100
10
1
0.1
0.01
0.001
0.0001
S 0.676778R-Sq 72.4%R-Sq(adj) 72.3%
0.03 x RD50
2015
TLV
Regression95% CI95% PI
2015 TLV versus 0.03 x RD50 for 184 entries from 102 chemicalslog10(2015 TLV) = - 0.01900 + 0.8392 log10(0.03 x RD50)
Allyl chlorideEpichlorohydrin
Nitrogen dioxide2-Methoxyethyl acetate
Hexachlorobutadiene
Sulfur dioxide: 2 of 15 entries
2 of 2 entriesEthyl acetate:
Vinyl toluene

210-1-2
99.999
90
50
10
10.1
Residual
Perc
ent
20-2
2
0
-2
Fitted Value
Resi
dual
1.81.20.60.0-0.6-1.2-1.8-2.4
45
30
15
0
Residual
Freq
uenc
y
180160140120100806040201
2
0
-2
Observation Order
Resi
dual
Normal Probability Plot Versus Fits
Histogram Versus Order
Residual Plots for log10(2015 TLV)

MORE RECENT APPROACHES • Luan, F. et al. (2006) Chemosphere 63: 1142-1153
These investigators were also able to get excellent results for nrVOCs, using chemical descriptors and using the 1993 database from Schaper. Some progress was made for the rVOCs.
• Gupta, S. et al. (2015). Ecotoxicology 24: 873-886. Estimating irritation potency of volatile organic chemicals using QSARs based on decision tree methods for regulatory purpose. Again, the database from Schaper was used.

• The importance of the approach of Gupta et al. (2015) is that it can take both nrVOC and rVOCs and will now be presented here in the slides below.
• Another very recent article is authored by Abraham, M.H. et al. (2016). An assessment of air quality reflecting the chemosensory irritation impact of mixtures of volatile organic compounds. Environ. International 86: 84-91.
Gupta et al. (2015) are following 3 important steps, well-described in their article. They have used 145 VOCs, the same as used by Alarie et al. (1998) above, and all are from the 1993 Schaper database. • Use the QSAR modeling steps prescribed by the OECD • Calculated molecular descriptors for the both nrVOCs
and rVOCs using known methods • Using decision tree classification techniques to optimize
the results The figures below are from the Gupta et al. article.

QSAR MODELING STEPS AND RESPECTIVE OECD PRINCIPLES
FROM: GUPTA et. al., 2015

HISTOGRAM OF SENSORY IRRITATION POTENCY (LOG RD50) OF VOCs IN MICE
FROM: GUPTA et. al., 2015

MEASURED VS. PREDICTED LOG RD50 a)
b)
c)
Measured vs. model predicted log RD50 values for training and test sets in: a) SDT (Single Decision Tree) b) DTF (Decision Tree Forest) c) DTB (Decision Tree Boost)

GUPTA ET AL. (2015) YIELDED GOOD RESULTS, BUT THIS IS FOR RD50s.
WE NEED TLVs. • How do we get to TLVs? • We already know there was a good correlation between
0.03 x RD50s and TLVs in 1980 and 1993. • Is it still good for the 2015 updated database on RD50s
and the 2015 TLVs? • The answer is YES as presented in the regression
analysis graphs on the previous slides.

NEED TO TEST ABOVE QSAR WITH NEW CHEMICALS
• The above QSAR contains 145 chemicals, but only 102 have a TLV. This is not a problem.
• However, we need to test how good the potency estimates would be for new chemicals. This is required for any QSAR.

• A total of 114 chemicals (all nr or r VOCs) were identified with the basis for their TLV being ‘URT irr’, ‘Eye irr’ in the 2015 ACGIH TLV Booklet. These are presented in the table below.
• We could obtain RD50 values in mice to verify how close the estimated TLV (0.03 x RD50) would be. This is not necessary.
• Since TLV= 0.03 x RD50, it follows that RD50= TLV / 0.03.
• We would now have a total of 216 chemicals.

TABLE 2. LIST OF CHEMICALS WITH THRESHOLD LIMIT VALUES (TLVs) PRIMARILY BASED ON SENSORY
IRRITATION. Chemicals CAS # Documentation
Date1
TLV-TWA or STEL2
(ppm) TLV Basis3
Acetic anhydride 108-24-7 2010 10 URT & eye irr; pulm func
No RD50 values are available for these chemicals. This table includes only volatile organic chemicals (VOCs).

CHEMICALS BEGINNING WITH “A” Acetic anhydride 108-24-7 2010 10 URT & eye irr; Pulm func
Acetophenone 98-86-2 2008 10 URT irr; CNS impair, Pregnancy lost
Acrylic acid 79-10-7 1986 2 URT irr
Adiponitrile 111-69-3 1990 2 URT & LRT irr
Allyl bromide 106-95-6 2011 0.1 Eye & URT irr
Ally propyl disulfide 2179-59-1 2001 0.5 URT & eye irr

CHEMICALS BEGINNING WITH “B” Benzotrichloride 98-07-7 1994 0.1 Eye, skin & URT irr Benzoyl chloride 98-88-4 1992 0.5 URT & eye irr Benzyl acetate 140-11-4 1990 10 URT irr sec-Butanol 78-92-2 2001 100 URT irr; CNS impair iso-Butene 115-11-7 2007 250 URT irr; body weight eff sec-Butyl acetate 105-46-4 1965 200 Eye & URT irr n-Butyl acrylate 141-32-2 1996 2 Irr n-Butyl mercaptan 109-79-5 1968 0.5 URT irr o-sec-Butylphenol 89-72-5 1977 5 URT, eye & skin irr

WHAT TO EXPECT IF USING THE QSAR WITH THESE ADDITIONAL CHEMICALS
Looking at the list of chemicals in the table on the previous slides, an organic chemist would reach the conclusion that we would expect several outliers. This is simply because many of them would fall outside of the chemical domain in the current QSAR.

However, this is not a problem. If so, new and expanded training and test sets would be appropriate for again testing how valuable a QSAR could be to evaluate the TLV of yet untested chemicals, provided that they are VOCs.
We can also expect new chemicals to be introduced in the work place. The computerized method has greatly expanded our ability to quickly establish the likely location/s of the respiratory tract that may be most affected during inhalation exposures.

ACKNOWLEDGEMENT Over the years, much progress was made with the collaboration of Michael H. Abraham, University College London, Gunnar D. Nielsen, National Institute of Occupational Health, Denmark and Michelle M. Schaper, U.S. Department of Labor, as well as many students, postdoctoral fellows, and visiting scientists. Questions or Comments may be sent to: [email protected]