Embed Size (px)
Citation preview

:r: a :r:
c :E
-
)>
s -<
U
'l
0 z 0 .,
~ "' "' 0 c :I
a - "' -t
)I>
-t
m ::r:
Q ::r:
~
)I>
-< c m ., )I>
:Ia -t ~
m z -t
rT1
()
0 ~ zt
:P
'0 o
O
01
0
0 ~0
I _
z
~
'<)()<
-
()--
(/)
.--W
--t
.-- rn
c 0 -<

,.
BOONVILLE ECONOMIC STUDY
1958- 1963
PREPARED BY THE
MISSOURI STATE HIGHWAY DEPARTMENT
DIVISION OF HIGHWAY PLANNING
IN COOPERATION WITH
U. S. DEPARTMENT OF COMMERCE
BUREAU OF PUBLIC ROADS
July 1965

1 •
1 1 1 -]
l -]
-]
-]
l -]
-]
-]
-]
I j
Introduction
Summary and Conclusions
Plan of Study
Economic Trends
Gasoline Service Stations Motels and Hotels
CONTENTS
Restaurants, Taverns and Liquor Stores Automotive . . . . General Merchandise All Retail Sales Taxable Sales Population . . Employment . Other Economic Factors
Parking
Accidents
Appendix
Page
1
4
6
. . 10
12 18 20 20 23 26 33 33 38 38
43
45
47

1 J ]
J J ]
J
I
II
III
IV
v
VI
VII
VIII
TABULATIONS
Consumer Price Index .
Gross National Product
Business "Stops" and "Starts"
A Survey of Selected Sources of Income
Postal Receipts
B ank De pos its
Summary of Boonville Parking Surveys
Accident Record Boonville Study Area .
Page
9
10
32
40
42
42
44
45
,I lj I

1 ' E"\ /\ ~ .. I"
]
]
]
]
]
]
Figure
1
2
3
4
5
6
7
8
9
10
11
12
13
14
ILLUSTRATIONS
Page
Location Map 3
Study Area 7
Gross National Product 11
Traffic Flow Map - Before Bypass Opened to Traffic 1 3
Traffic Flow Map - After Bypass Opened to Traffic 14
Service Stations Estimated Gross Retail Sales 15
Service Stations Total Gasoline Gallonage Sold 1 6
Service Stations Estimated Gross Retail Sales - Dollar Volume 17
Food and Lodging Retail Sales and Rec e ipts 1 9
Restaurants, Taverns and Liquor Stor e Retail Sales 21
Automotive Sales and Tax Receipts 22
General Merchandise Retail Sales 24
General Merchandise Retail Sales - Dollar Volume 2 5
All Retail Sales - By Sections 27
:I

1
Figure
15
1 16
17
1 18
1 19
20
1 21
1 22
23
1 24
A-1
A-2
1 A-3
A-4
1
All Retail Sales - By Sections - Dollar Volume
All Retail Sales By Sales Classifications
All Retail Sales By Sales Classifications - Dollar Volume
Business Stops and Starts
A Comparison of Taxable Sales
Taxable Sales - Boonville and Comparable Cities
Population . .
A Comparison of School Enrollment
A Comparison of Employment
Boonville Utilities
Service Stations Estimated Retail Sales as a Percent of the Average Quarter of 1958 ............ .
Gasoline Gallonage Sold as a Percent of the Average Quarter of 1958
Motel Receipts as a Percent of the Average Quarter of 19 58 . . . .
Restaurants, Taverns and Liquor Stores Retail Sales as a Percent of the Average Quarter of 1958 . . . . . . . . . . . . . . . . .
-,
Page
28
29
30
31
34
35
36
37
39
41
48
49
50
51
J
J J j
J I
l
J
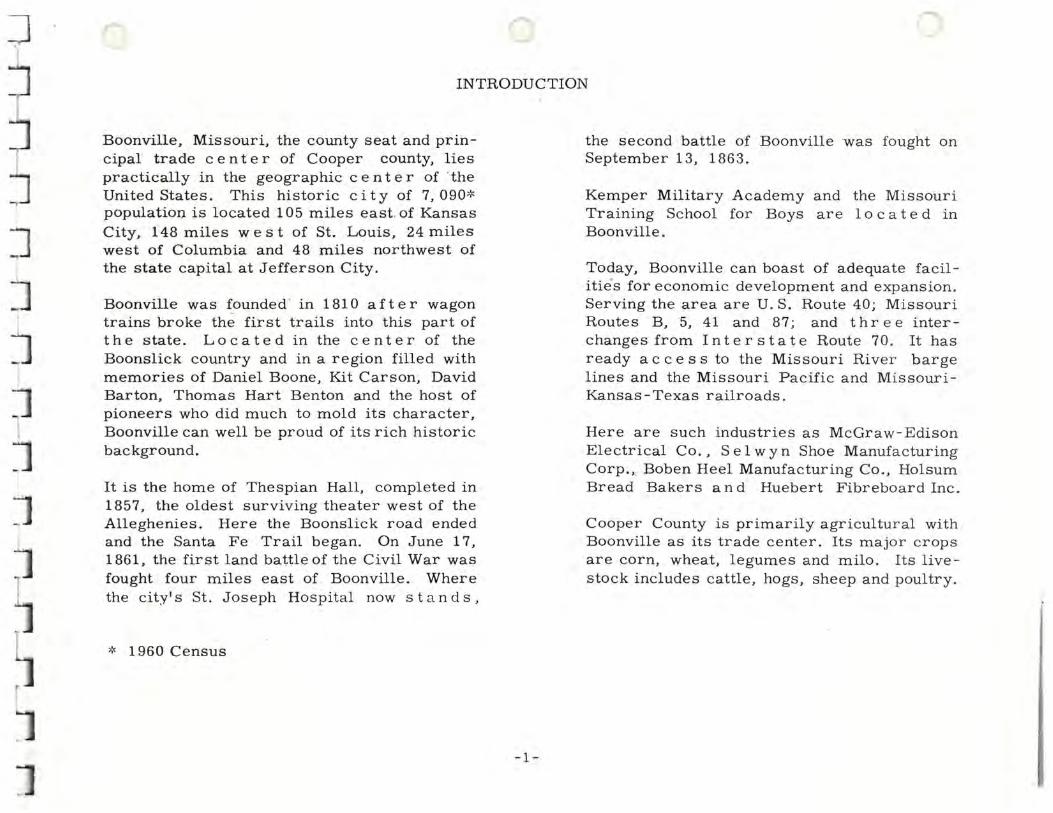
INTRODUCTION
Boonville, Missouri, the county seat and principal trade c enter of Cooper county, lies practically in the geographic center of 'the United States. This historic city of 7, 090>:< population is located 105 miles east. of Kansas City, 148 miles west of St. Louis, 24 miles west of Columbia and 48 miles northwest of the state capital at Jefferson City.
Boonville was zounded . in 1810 after wagon trains broke the first trails into this part of the state. Locate d in the c e n t e r of the Boonslick country and in a region filled with memories of Daniel Boone, Kit Carson; David Barton, Thomas Hart Benton and the host of pioneers who did much to mold its character, Boonville can well be proud of its rich historic background.
It is the home of Thespian Hall, completed in 1857, the oldest surviving theater west of the Alleghenies. Here the Boonslick road ended and the Santa Fe Trail began. On June 17, 1861, the first land battle of the Civil War was fought four miles east of Boonville. Where the city's St . Joseph Hospital now st a nds,
* 1960 Census
-1-
the second battle of Boonville was fought on September 13, 1863.
Kemper Military Academy and the M i ssouri Training School for Boys are lo c ated in Boonville.
Today, Boonville can boast of adequate facilitie"s for economic development and expansion. Serving the area are U.S. Route 40; Missouri Routes B, 5, 41 and 87; and thr e e interchanges from Interstate Route 70. It has ready access to the Missouri Rive r barge lines and the Missouri Pacific and Missouri Kansas- Texas railroads.
Here are such industries as McGraw- Edison Electrical Co., S e 1 w y n Shoe Manufacturing Corp.,: Bohen Heel Manufacturing Co., Hol sum Bread Bakers and Huebert F ibreboard Inc .
Cooper County is primarily agr icultur al with Boonville as its trade center. Its major crops are corn, wheat, legumes and milo. Its live stock includes cattle, hogs, sheep and poultry.

In the initial planning of Interstate Route 70 from St. Louis to Kansas City, State Highway Department and federal officials decided on a line generally running over or paralleling U.S. Route 40, but they were confronted with the problem of the Missouri River bridge leading into downtown Boonville. It was a serious impediment to traffic due to the physical characteristics of the bridge and the extent and content of the traffic passing over it and through the city.
The decision was made to locate Interstate
-2-
Route 70 about 3 miles south of town to eliminate this bottleneck through Boonville.
Naturally, some city officials and busine ssmen were concerned that this highway relocation would adversely affect the area's economic activity. To recover some of the di verted tourist trade and encourage future business growth, a new Business Loop 70 was constructed. This business loop, along with the interchange at Missouri Route B, gave Boonville three direct connections with Interstate Route 70.

'
\§)
LOCATION MAP
BOONVILLE COOPER COUNTY FIGURE I
-3-
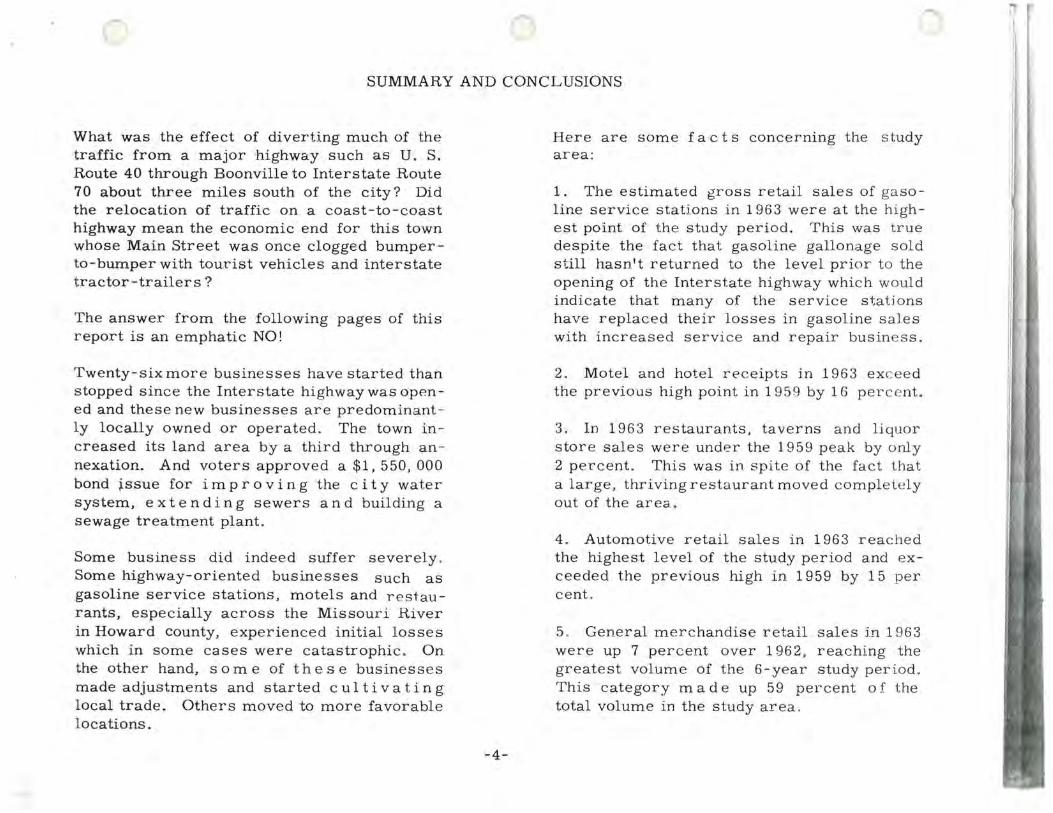
SUMMARY AND CONCLUSIONS
What was the effect of diverting much of the traffic from a major highway such as U. S. Route 40 through Boonville to Interstate Route 70 about three miles south of the city? Did the relocation of traffic on a coast-to-coast highway mean the economic end for this town whose Main Street was once clogged bumperto-bumper with tourist vehicles and interstate tractor-trailers?
The answer from the following pages of this report is an emphatic NO!
Twenty-six more businesses have started than stopped since the Interstate highway was opened and these new businesses are predominant ly locally owned or operated. The town increased its land area by a third through an nexation. And voters approved a $1, 550, 000 bond ~ssue for improving the city water system, extending sewers and building a sewage treatment plant.
Some business did indeed suffer severely, Some highway-oriented businesses such as gasoline service stations, motels and restaurants, especially across the Missouri River in Howard county, experienced initial losses which in some cases were catastrophic. On the other hand, some of these businesses made adjustments and started cultivating local trade. Others moved to more favorable locations.
-4-
Here are some facts concerning the study area :
1. The estimated gross retail sales of gasoline service stations in 1963 were at the highest point of the study period. This was true despite the fact that gasoline gallonage sold still hasn•t returned to the level prior to the opening of the Interstate highway which would indicate that many of the service stations have replaced their losses in gasoline sales with increased service and repair business.
2. Motel and hotel receipts in 1963 excee d the previous high point in 1959 by 16 percent.
3. In 1963 restaurants, taverns and liquor store sales were under the 1959 peak by only 2 percent. This was in spite of the fac t that a large, thriving restaurant moved completely out of the area.
4. Automotive retail sales in 1963 reached the highest level of the study period and exceeded the previous high in 1959 by 15 per cent.
5 . General merc handise retail sales in 1963 were up 7 percent over 1962, reaching the greatest volume of the 6-year study period . This category made up 59 percent of the total volume in the study area,
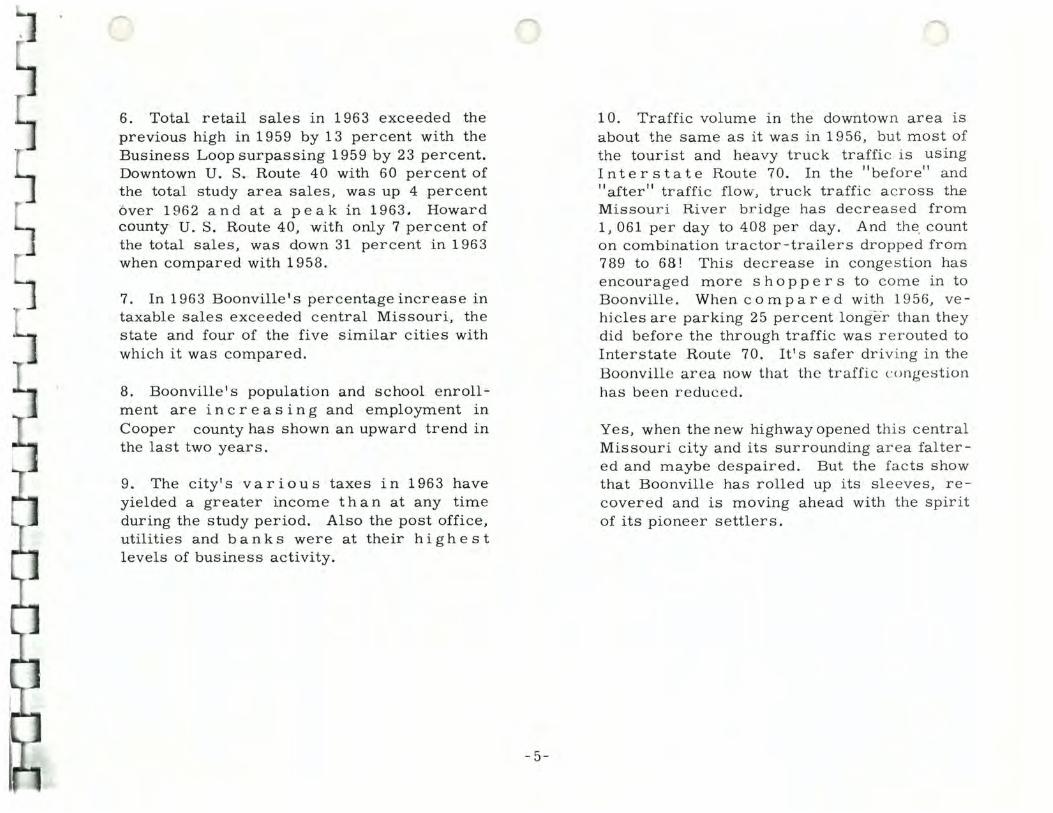
6. Total retail sales in 1963 exceeded the previous high in 1959 by 13 percent with the Business Loop surpassing 1959 by 23 percent. Downtown U. S. Route 40 with 60 percent of the total study area sales, was up 4 percent 6ver 1962 and at a peak in 1963. Howard county· U. S. Route 40, with only 7 percent of the total sales, was down 31 percent in 1963 when compared with 1958.
7. In 1963 Boonville's percentage increase in taxable sales exceeded central Missouri, the state and four of the five similar cities with which it was compared.
8. Boonville's population and school enrollment are inc r e as in g and employment in Cooper county has shown an upward trend in the last two years.
9. The city's various taxes in 1963 have yielded a greater income than at any time during the study period. Also the post office, utilities and banks were at their highest levels of business activity.
-5-
10. Traffic volume in the downtown area is about the same as it was in 1956, but most of the tourist and heavy truck traffic is using Interstate Route 70. In the "before" and "after" traffic flow, truck traffic across the Missouri River bridge has decreased from 1, 061 per day to 408 per day. And the count on combination tractor-trailers dropped from 7 89 to 68! This decrease in congestion has encouraged more shoppers to come in to Boonville. When compared with 1956, vehicles are parking 25 percent longe·r than they did before the through traffic was rerouted to Interstate Route 70. It's safer driving in the Boonville area now that the traffic c onge stion has been reduced.
Yes, when the new highway opened this central Missouri city and its surrounding area faltered and maybe despaired. But the facts show that Boonville has rolled up its sleeves, recovered and is moving ahead with the spirit of its pioneer settlers.

]
]
]
PLAN OF STUDY
To present a sound evaluation of the effect of the relocation of through traffic from U. S. .Route 40 to Interstate Route 70, many of the area• s economic factors were analyzed over the 6-year period 1958-1963.
This period, which includes about three years before and after the opening of the Interstate facility in October 1960, .should be long enough to give an indication of the effect of the relo'"" cation on the city of Boonville and its immediate environs. Therefore, the data and conclusions in this presentation are offered as a final report on the economic situation in the Boonville area. In most instances, the year 1958 was used as the base year in the comparisons presented in the study.
The study area starts at the junction of U. S. Route 40 and Missouri Route 5 in Howard county, extends south along Main Street in Boonville and includes Business Loop 70 and the I-70 interchange area.
As shown in Figure 2 the study area was divided into four parts in order to present a more precise reflection of the changes made
-6-
in the area• s economy. In some cases , insufficient data prevented this division. A description of the four parts is as follows :
Bus in e s s Loop I -70 - extends from the Missouri Routes 87 and 41 interchange about 2. 5 miles southeast of Boonville, along Bingham Road, Main Street, and Ashley Road to U. S. Route 40 and Missouri Route 5 interchange, about 2. 1 m i 1 e s southwest of Boonville. It also includes Missouri Route 41 for about 1 mile west from the junction with Missouri Route 5.
Downtown U. S. 40 - along Main Street and one block in each direction from the Missouri River bridge south to the Ashley Road junction.
Howard County U. S. 40- north from the Missouri River bridge for about 1. 4 miles to the junction with Missouri Route 5.
Interstate Route 70 Interchange Area - the Missouri Routes 41 and 87 interchange, the Missouri Route B interchange and the U. S. Route 40 and Missouri Route 5 interchange.

N BOONVILLE STUDY AREA
AREAS~
FIGURE 2
- 7-

J
~
Various aspects of the economy were examined with primary emphasis on retail .sales .. The retail firms ' in the study area were divided into these classifications:
1. Gasoline Service Stations
2. Motels and Hotels
3. Restaurants, Taverns and Liquor Stores
4. Automotive - New :and Used Automobiles, Parts, Accessories and Tires
5. General Merchandise - Food Markets, Department Stores, Drug Stores, Furniture Stores, etc.
Other components of the Boonville economy were studied suer . as business "stops and
-8-
starts", city tax income, utiliti es, .bank deposits and employment.
Where possible, comparisons were made at the city, county, state and national level to determine if Boonville' s economy was being influenced by factors other than the highway relocation.
A parking survey was made of the downtown area before and after the opening of Interstate Route 70 at Boonville. Traffic counts were
d ' 11 f 11 d rna e 1n the s t u d y area on a be ore an 11 after" basis also.
The data for this study were obtained by direct contacts with individual businessmen, city officials and state agencies. Additional information was obtained from the use of publications of the state and federal government.

Although Table I shows a continuous rise in the consumer price index during the study
TABLE I
period, no attempt has been made to adjust any of the retail sales figures used in this study.
Consumer Price Index
Year
1958 1959 1960 1961 1962 1963
Index (1957- 59 = 1 OOo/c)
100. 7 101.5 103. 1 104.2 105.4 106.7
Source: U. S. Department of Commerce - Survey of Current Business
-9-
f

I
l 1
ECONOMIC TRENDS
In evaluating the economy of the Boonville study area, some perspective can be gained by considering the gross national product of the United States as illustrated in Figure 3 and Table I I.
TABLE II
The nation, while showing a decrease in output during some of the quarters of 1959 and 1960, has enjoyed a rapid and constant recovery during the years 1961, 1962, and 1963.
Gross National Product (In Billions}
Unadjusted Constant Year Dollars 1954 Dollars
1958 444.5 401.3 1959 482.8 428.4 1960 503.4 440.2 1961 518. 7 447.9 1962 556.2 476.4 1963 583.9 492.6
Source: U. S. Department of Commerce - Survey of Current Business
-10-
il

(/)
lr <t ...J ...J
8
600
560
520
~480 (/)
z Q ...J ...J
m 440
400
360 I 2 3 4 1958
2 3 4 1959
GROSS NATIONAL PRODUCT ANNUAL RATES BY QUARTERS
2 3 4 1960
2 3 4 1961
-11-
2 3 4 1962
2 3 4 1963
FIGURE 3

J I
It w o u 1 d be virtually impossible to isolate those economic factors which have been directly affected by the highway relocation at Boonville. However, an attempt has been made to explore various components of Boonville's economy to determine what changes have taken place. In some cases , such as highway-oriented businesses, it is apparent that the highway relocation has had a definite effect. On other businesses, the assignment of effect would be theoretical.
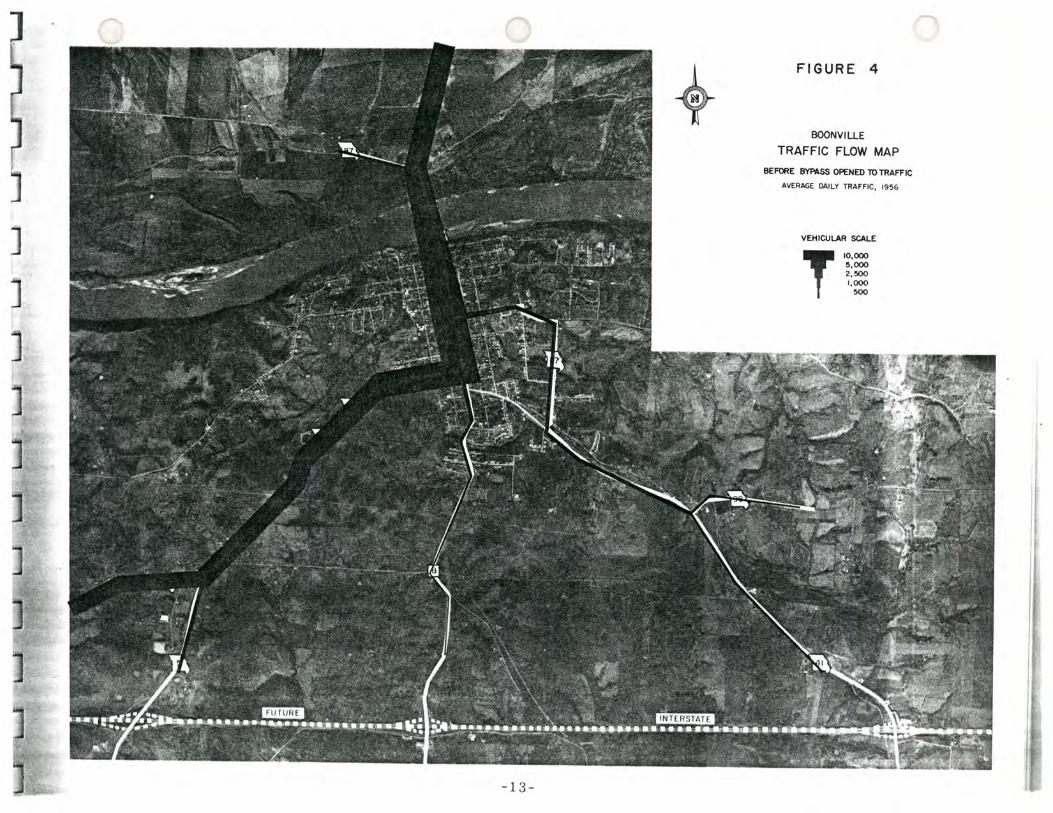
Figures 4 and 5 illustrate the "before" and "after" flow of traffic in the study area. Downtown U. S. Route 40 shows a decrease of less than 5 percent in the central business district and a decrease of about 13 percent . near the I-70 Business Loop. Howard county U. S . Route 40 has experienced a drop in traffic in excess of 40 percent.
A similar drop occurred on the western leg of the I-70 Business Loop. Within the study area it would appear that some of the loss of traffic on U. S. Route 40 in Howard county has been recovered on Missouri Route B and the east leg of the I-70 Business Loop.
GASOLINE SERVICE STATIONS
In reviewing Figures 6, 7, and 8 it is obvious that the construction of Interstate Route 70
-12-
has had a decided influence on gasoline ser ... vice stations in all segments of the study area. In Figure 6, the Business Loop's esti mated gross retail sales are down 30 percent in 1963 from the base year 1958 and Howard county U. S. Route 40 is down 40 p e rcent. Downtown U. S. Route 40 is up 1 percent with a rising trend in the last two years.
The total study area, excluding the I - 70 inter change areas , is down 27 percent although showing some recovery in the last two years . The total study area, when including the Inter state interchange are as, shows an upward trend in the last two years and 1963 was 8 percent above 1958 and at an all -time high during the study period.
When comparing Figure 6 with Figure 7, it should be noted that the percentage drop in estimated gross retail sales is less than the percentage drop in total gasoline gallonage sold in the four parts of the study area. This would indicate that many of the gasoline ser vice stations have replaced their losses in gasoline sales with increased s e r vi c e and repair business.
Figure 8 depicts the dollar volume of estimated gross retail sales of the gasoline service stations during the study period . It is significant that the service station sales in the interchange areas exceed those of each of the other sectors during the year 1963.
] I - ~· ~- --. 1 .. \ ... _, ... ·-· '
] - ~ -:~ · -' :...-- ' ..... ; ~ ~ f .... , .. - - \ -' - .......-;~ .. ~~_..;;..... ~ _... )~~ .,._
\. \ . - , :.· ~ -- ~~ '<- ... , iJ -
-1 3 -
-~ . ' ..... , ,... [J.. '~ J -.
-. -·· - .... ... - ,. I - ·· p -- : .·'
t
.
•'
FIGURE 4
BOONVILLE
TRAFFIC FLOW MAP
BEFORE BYPASS OPENED lOTRAFFIC
AVERAGE DAILY TRAFFIC, 1956
VEHICULAR SCALE
T 10,000 !1,000 2, !100 1,000
!100

t
- 1 t1 -
FIGURE 5
BOONVILLE
TRAFFIC FLOW MAP
AFTER BYPIIISS OPENED TO TRAFFIC
AVERAGE DAILY TRAFFIC, 1963
VEHICULAR SCALE
T 10,000 5,000 2, 500 1,000
500
I I
I' d I !


I f--'
O'l I
•
' \-
--~

·1-70 INTERCHANGE AREA
Dill HOWARD COUNTY U.S. 40
D DOWNTOWN u.s. 40
II BUSINESS LOOP 1-70
BOONVILLE ..... ,·uoY AREA SERVICE STATIONS ESTIMATED GROSS RETAIL SALES
2.~ 2.5
2 2
fl) s::: a: ~ r
I 5!: ~ 1.~ · o z 0 (J)
~ 0 "TI
fl) 0 z 0 0 r - r ...J )> ...J I I ::tJ :E (J)
FIGURE 8 -17-

Appendix Figures A-1 and A-2 show the quarterly trend of gasoline service station estimated gross retail sales and gallonage sold during the 6-year study period. Signifi-· cantly, a downward trend in gasoline gallonage sold started back in 1958 and started up again the 2nd quarter of 1962. A glance at the quarterly sales in both these illustrations clearly shows the sharp downward trends beginning in the last quarter of 1960 and the strong upswing resulting from the service station openings in the interchange areas in 1962 and 1963.
With the sizable decrease in traffic flow in the Howard county and Business Loop I - 70 segments of the study area, it is 1 o g i c a 1 that there would be a drop in both service station retail sales and gasoline gallonage sold.
MOTELS AND HOTELS
Because of the small number of motels and hotels, which constitute about 1 percent of the total area sales volume, no attempt was made to divide the study area. Figure 9 presents a trend in motel and hotel receipts and a comparison of food and lodging retail sales in the study area with the state of Missouri.
-18-
Including the I-70 interchange areas, motel and hotel receipts in 1963 were 23 percent higher than 1958, an all - time high. A com parison of 1963 with 1958, excluding the inter c hange are as , shows a drop of 11 percent which would indicate that the losses in town, on the Business Loop and in Howard county, have been more than recovered by the motels in the interchange areas.
Food and lodging retail sales , as illustrated in Figure 9, show a decrease of 22 percent from 1958 to 1963 , when excluding the I -70 interchange a r eas. Including the interchange areas, 1963 is up 9 percent ove r 1958.
During the study period, the state experienced a continual r i s e in food and lodging retail sales with a 12 percent increase in 1959 over 1958 and 24 percent increase in 1963 over 1958. The Boonville study area, while trailing the state's rate of growth in food and lodging sales, shows a sharp rate of growth in the last 2 years.
Appendix Figure A-3 shows a 4-quarter centered moving average for motel receipts in the Boonville area. This illustration vividly depicts the sharp rise in receipts occasioned by the opening of new m o t e 1 s in the .interchange areas during 196 3.

--
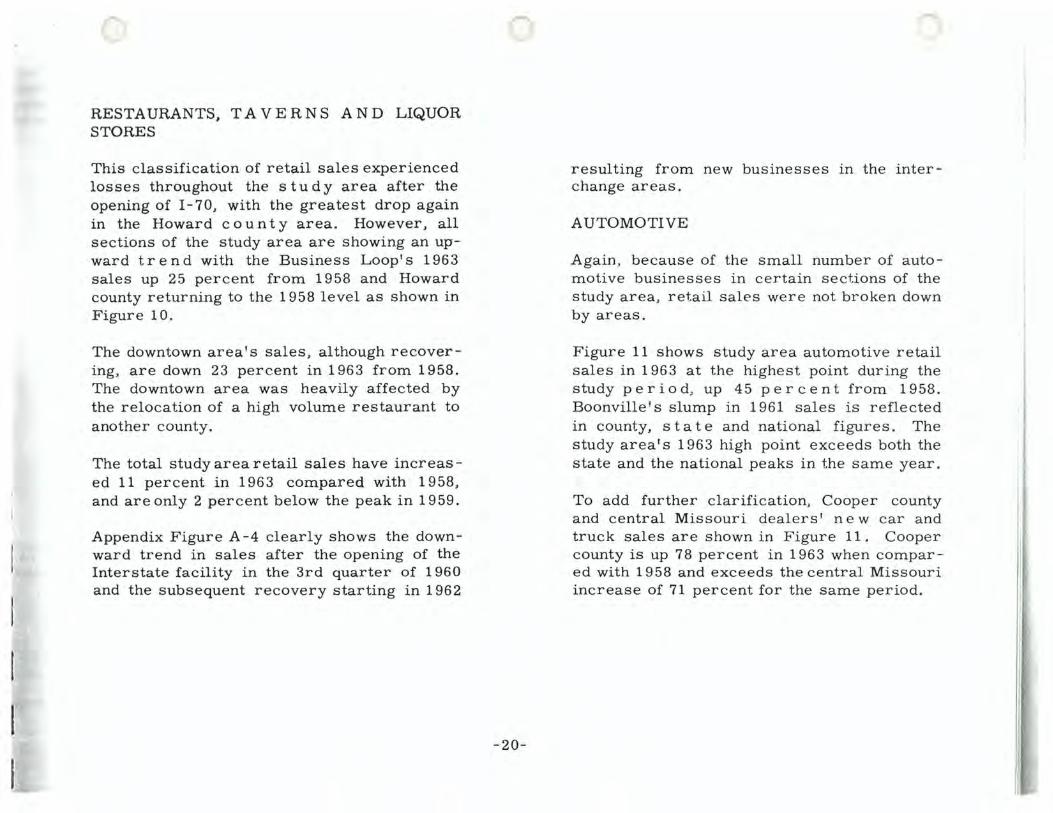
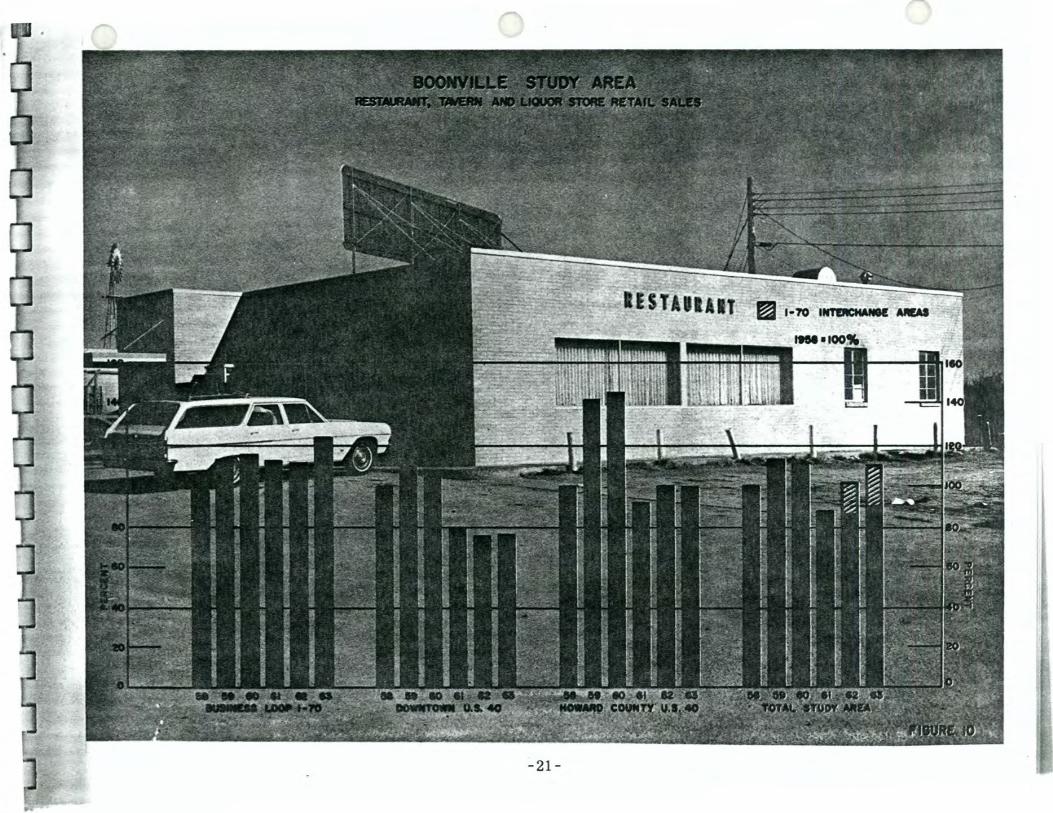
RESTAURANTS, TAVERNS AND LIQUOR STORES
This classification of retail sales experienced losses throughout the study area after the opening of I-70, with the greatest drop again in the Howard county area. However, all sections of the study area are showing an upward trend with the Business Loop's 1963 sales up 25 percent from 1958 and Howard county returning to the 1958 level as shown in Figure 10.
The downtown area's sales, although recovering, are down 23 percent in 1963 from 1958. The downtown area was heavily affected by the relocation of a high volume restaurant to another county.
The total study area retail sales have increased 11 percent in 1963 compared with 1958, and are only 2 percent below the peak in 1959.
Appendix Figure A-4 clearly shows the downward trend in sales after the opening of the Interstate facility in the 3rd quarter of 1960 and the subsequent recovery starting in 1962
-20-
resulting from new businesses in the interchange areas.
AUTOMOTIVE
Again, because of the small number of automotive businesses in certain sections of the study area, retail sales were not broken down by areas.
Figure 11 shows study area automotive retail sales in 1963 at the highest point during the study period, up 45 percent from 1958. Boonville's slump in 1961 sales is reflected in county, state and national figures. The study area's 1963 high point exceeds both the state and the national peaks in the same year.
To add further clarification, Cooper county and central Missouri dealers' new car and truck sales are shown in Figure 11 . Cooper county is up 78 percent in 1963 when compared with 1958 and exceeds the central Missouri increase of 71 percent for the same period.


GENERAL MERCHANDISE
This category of retail sales would be considered the least highway-oriented of the five classifications of retail sales. As shown in Figure 12 in 1963 all sectors of the study area are at the highest level of the study period.
Compared with 1958, Business Loop 70 shows a 166 percent gain in 1963; downtown U. S. Route 40 shows a 13 percent increase ; Howard county is up 41 percent; and the total study area has 23 percent more sales. The tremendous percentage increase in retail sales in the Business Loop can be explained in that there has b e en a s i z a b 1 e increase in the
-23-
number of businesses in this part of the study area.
In three years since the opening of Interstate 70, only the Howard county section of the study are a has experienced a decrease in sales in any one year ; that was in 1961.
The reduction of traffic congestion, r esulting from the relocation of tourist and heavy truc k traffic to Interstate Route 70, has m a a e H much easier for shoppers to come ' in to Boonville.
Figure 13 shows the dollar volumes involved in the general merchandise retail sales of the three sectors.


BOONVILLE ST~ -)y AREA GENERAL MERCHANDISE RETAIL SALES
12 12
• HOWARD COUNTY U.S. 40
lliJ DOWNTOWN U.S. 40
10~ II BUSINESS LOOP 1-70
! .II Ii\1111111; 1\l; ; I \; I
-25-
:s:: r r
·o z (/)
0 'Tl
0 0 r r ~ ;u (/)
FIGURE 13
ALL RETAIL SALES
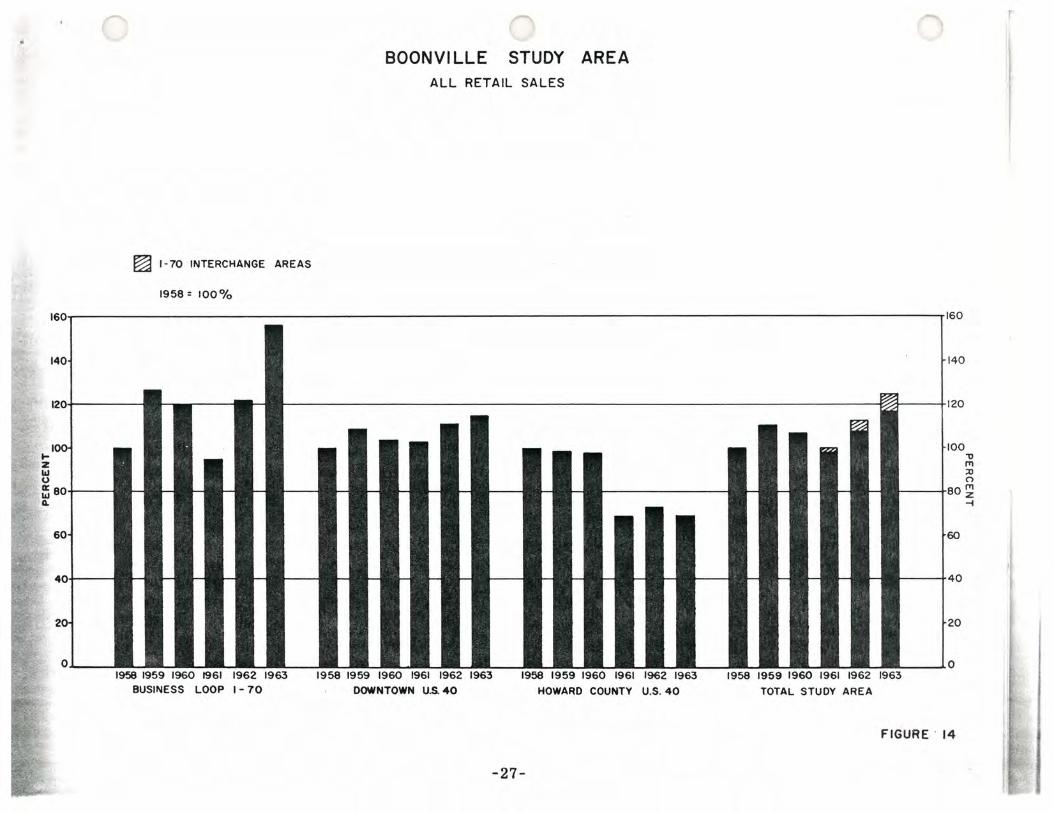
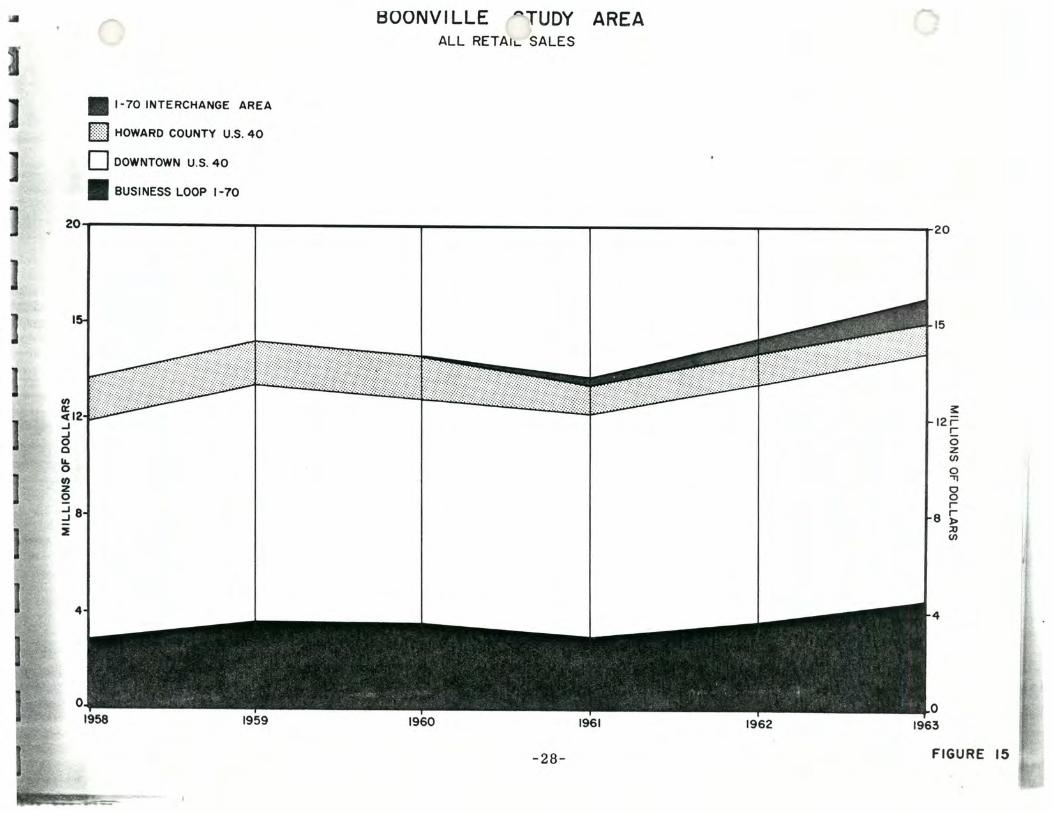
Figures 14 and 15 summarize all retail sales in the study area by the four divisions. Figure 14 shows that total retail sales are up 25 percent, comparing 1963 with 1958. There has been a 1 7 percent gain eve n when the interchange areas are excluded.
Compared with 1958 the Business Loop is up 56 percent in 1963, downtown U. S. Route 40 is up 15 percent with Howard county U. S. Route 40 down 31 percent. It must be realized that the majority of Howard county's sales are in highway-oriented businesses and would show losses with the sharp traffic decrease in that area.
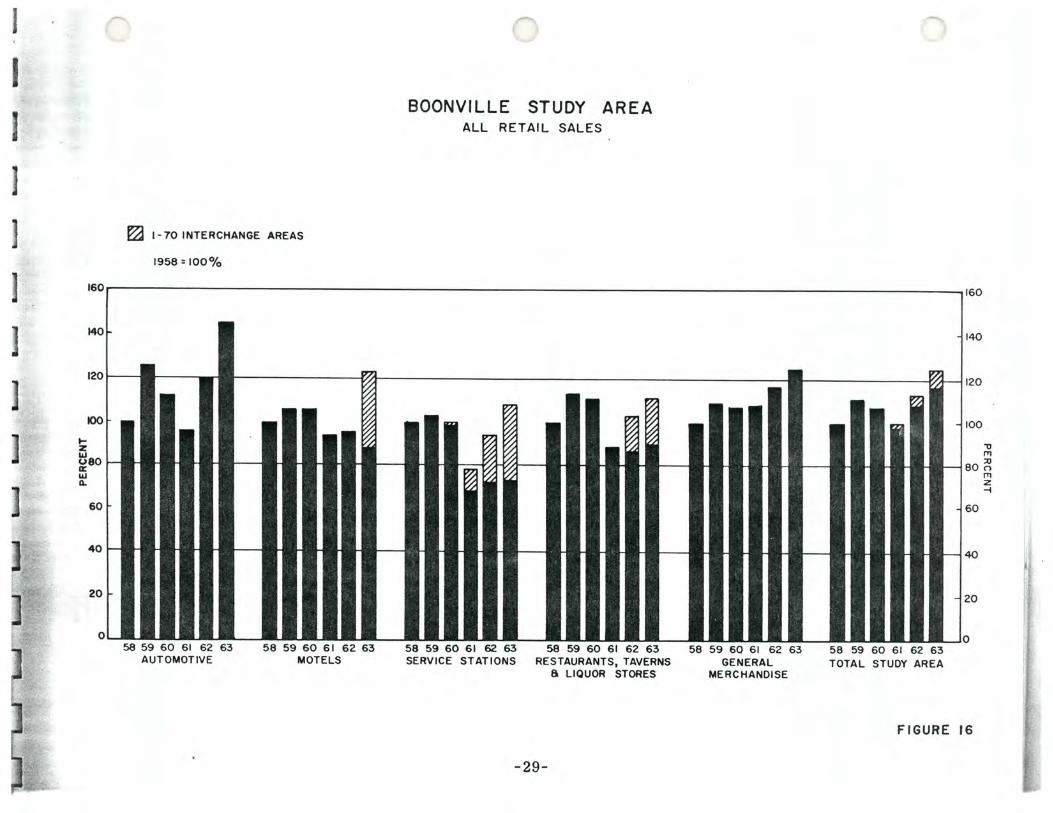
Figures 16 and 17 present summaries of the five classifications of retail sales in the study area. Figure 16 shows all businesses at the highest level of the 6-year study period, except restaurants, taverns and liquor stores.
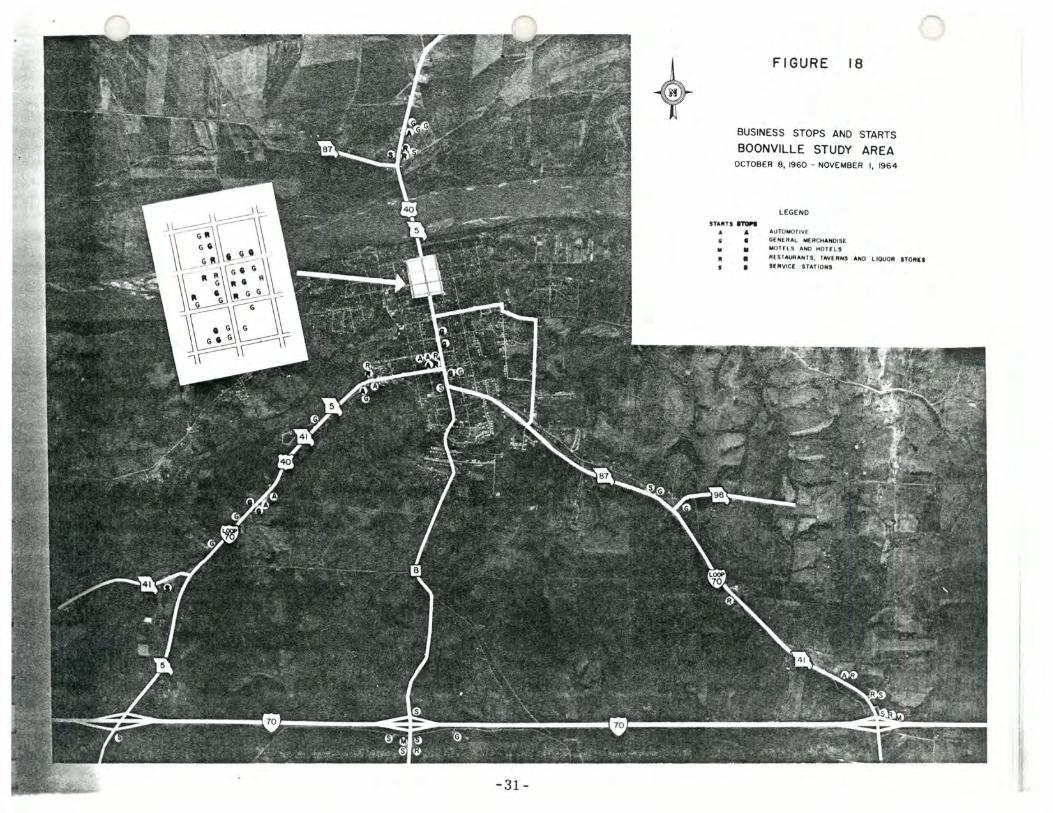
Figure 18 shows the business "stops" and 11 starts" in the study area since Interstate 70 opened on October 8, 1960, up until November 1, 1964. Table I II gives a breakdown of the business "stops" and "starts".
-26.,.
There have been added three automotive businesses, 14 general merchandise businesses, two motels and eight service stations. There has been a decrease of one in the restaurant, tavern and liquor store group. This gives a total of 26 additional businesses and most of these new businesses are locally owned or operated.
Figure 18 and Table I I I also indicate that many new businesses have opened up on the Business Loop and in the interchange areas. They also show that downtown U. S. Route 40 closings are being m or e than offset by replacement businesses.
Many of the business "starts" have occurred during the period July 1, 1963, to November 1, 1964, with l-70 Business Loop having 12 of 21, downtown U. S. Route 40 having 8 of 18, Howard county U. S. Route 40, 3 of 4 and I -7 0 inter change area, 3 of 11. During this same p e rio d there has b e en one Howard county "stop" and four downtown U. S. Route 40 "stops". This shows a continuing increase in business activity beyond the 6-year study period.
I . '
•
~ 1-70 INTERCHANGE AREAS
1958 = 100 °/o
BOONVILLE STUDY AREA ALL RETAIL SALES
160 160
o ....... _ ....... 1958 1959 1960 1961 1962 1963
BUSINESS LOOP I - 70 1958 1959 1960 1961 1962 1963
DOWNTOWN U.S. 40
1958 1959 1960 1961 1962 1963
HOWARD COUNTY U.S. 40
-27-
140
~ 1120
100 "ll f'l'l :n 0
80 ~ -!
0 1958 1959 1960 1961 1962 1963..__ .......
TOTAL STUDY AREA
FIGURE · 14
lll
Ill 1·701NTERCHANGE AREA
till HOWARD COUNTY U.S. 40
D DOWNTOWN u.s. 40
II BUSINESS LOOP 1-70
BOONVILLE /""-TUDY AREA ALL RETAIL SALES
20 20
15
(/) , .... ' • ........ ·.:-:-:·,;:::::·_;_::::.··.::: ... _:::-.;:.:-·.- ... ·.
~ ~12 12 j= ..J r ..J 0 0 0 z 1&. (/)
0 0 (/)
, z 0 0 0
r je 8 ~
;:o 2 (/)
1958 1959 1960 1961 1962 1963
-28- FIGURE 15
I
~ I-701NTERCHANGE AREAS
1958 = 100°/0
BOONVILLE STUDY AREA ALL RETAIL SALES
160 160
120
.... z t:8o a: I.IJ Q.
60
40
20
58 59 60 61 62 63 AUTOMOTIVE
58 59 60 61 62 63 MOTELS
58 59 60 61 62 63 SERVICE STATIONS
58 59 60 61 62 63 RESTAURANTS, TAVERNS
8 LIQUOR STORES
-29-
58 59 60 61 62 63 GENERAL
MERCHANDISE
140
120
100
"U iTI
80 ~
58 59 60 61 62 63 TOTAL STUDY AREA
60
40
20
0
FIGURE 16
iTI z -i

MIL
LIO
NS
OF
DO
LL
AR
s·-'
[ill]~ II
:u
:1::
I IT
I 0
......
(J)
~
0 ~
ITI
)>
r z
c :u
gl
~
)>
ITI
z :I
: :u
~
0 0
sn ~
:I:
ITI
)>
~
r z
~ (J
) C
) 1'1
1 1'1
1 :u
)>
z :u
(J
) 1'1
1 )>
g
) r 0 c 0 :u
(J) ~
0 :u
1'11
(J)
tD
0 0 z
• ~ D
<
l>
r
C)
)>
(J)
r IT
I c
1'11
r r
z ~
:u
r-IT
I 0
:5
:::0
:u
:1::
0 ['1
1 )>
0
1'11
~
r ~
CJ)
I
<
(J)
r :1:
: ~
-i
w
1'11
1'11
0 :u
~
en c
I 0
0 l>
0
:I:
z r
)>
(J)
['11
-<
z en
0 (J
) )>
1'1
1 ::n
m
)>
j~fi \\}~\;-, \ \ \\ -" i\ \ " • ~
H~t jW~r ,F-1
-31-
FIGURE 18
BUSINESS STOPS AND STARTS
BOONVILLE STUDY AREA OCTOBER 8, 1960 - NOVEMBER I, 1964
STAIItTS~ . " 8 •
" • • • •
LEGEND
AUTOMOTIVE
GENERAL MERCHANDISE MOT HS AND HOT [ LS
AU TAUHAN fS , TAV( " NS
Sf MVIC[ STATIONS ANO l. IOuo.- lfORI I

)
]
)
TABLE III
BOONVILLE STUDY AREA
BUSINESS "STOPS" AND "STARTS"
October 8, 1960 - November 1, 1964
Automotive General Merchandise Motels and Hotels Restaurants, Taverns, Liquor Stores Gasoline Service Stations
Total
Automotive General Merchandise Motels and Hotels Restaurants, Taverns, Liquor Stores Gasoline Service Stations
Total
STOPS
Business Loop I-70
2 3
2 1
8
STARTS
6 7
5 3
21
-32-
Downtown U. S. 40
10
6
16
16
2
18
Howard County
u. s. 40
1 -
2 1
4
3
1
4
I-70 Inter-
changes
--
--
-
1 2 2 6
11
Total
3 13
-10
2
28
6 27
2 9
10
54

TAXABLE SALES
A comparison of taxable sales for the period 1958 to 1963 was made between the city of Boonville, Cooper county, central Missouri and the state; this is illustrated in Figure 19. Boonville's 31 percent increase of 1963 over 1958 exceeds central Missouri's 25 percent increase and the state's 28 percent increase, while it is slightly under Cooper county's 33 percent increase.
The fact that the p e r c en tag e increase in Cooper county, excluding Boonville was higher than Boonville could be due to construction workers' purchases in the year prior to the opening of I-70, and the rapid growth of business on the I-70 interchange areas and along the· Business Loop outside Boonville's city limits.
In Figure 20, an attempt was made to compare Boonville with five other Missouri cities of similar economic characteristics. In the comparison, Boonville's taxable sales percentage increases were generally above the other five cities.
POPULATION
Another indicative factor in economic activity
-33-
is that of population. Figure 21 shows that Boonville's population has increased in the last 20 years with corresponding decreases in population in both Cooper and Howard counties. The fact that these two counties have experienced population decreases is not unusual since 83 of Missouri's 114 counties have had decreases since the 1950 census. This is further evidence of the trend of population movement from rural to urban areas.
Since a year-by-year estimate of population during the study period was not available, school enrollment trends have been examined and illustrated in Figure 22. The population of Boonville increased by 6 percent from 1950 to 1960, but the school enrollment shows a 19 percent increase from the 19 57- 58 school year to that of the 1962-63 school year.
Even though changes in school district and census boundaries might be involved in the growth rates of the city and county, it would' fur the r confirm a s hi f t from r u r a l to urban areas. The percentage increase in school enrollment in Boonville compares favorably with that of central Missouri and the state as a whole.

A COMPARISON OF TAXABLE SALES
1958 = 100°/0
160 160
~ z w
140
~ 80 w Q.
58 59 60 61 62 63 BOONVILLE
58 59 60 61 62 63 COOPER COUNTY
58 59 60 61 62 63 COOPER COUNTY LESS BOONVILLE
58 59 60 61 62 63 CENTRAL MISSOURI
-34-
140
120
100
, fT1
80 ~
60
40
20
0 58 59 60 61 62 63 58 59 60 61 62 6 3 STATE OF MISSOURI STATE EXCLUDING LARGER
METROPOLITAN AREAS
FIGURE 19
,..., z -1

]
I
TAXABLE SALES- BOONVILLE AND COMPARABLE CITIES
1958 = 100 °/0
160 r--------------------------------------------------------------------------------------------------------,160
140
120
100
~ z w u 8o-a: w Cl.
60
40-
20
- - - - -
- - - - -
58 59 60 61 62 63 BOONVILLE
58 59 60 61 62 63 CLINTON
-35-
58 59 60 61 62 63 DESOTO
58 59 60 61 62 63 MARSHALL
140
100
-o f'l
80 ~
58 59 60 61 62 63 MARYVILLE
60
40
20
0
FIGURE 20
JTI z -1

.... z
POPULATION BOONVILLE AREA
1920= 100°/o
~ IW
140
+-----{:":::::J .... t;::::;:::;t--t:\\'1--t:::::::::: 120
00
~eo I I 0:: w 0..
"'0 1"11 :0
t------+ 80 0
1920 1930 1940 1950 1960
BOONVILLE
1920 1930 1940 1950 1960
COOPER COUNTY
-36-
1920 1930 1940 1950 1960
COOPER COUNTY EXCLUDING BOONVILLE
f----+40
.__ _ _,_o 1920 1930 1940 1950 1960
HOWARD COUNTY
1"11 z -i
FIGURE

PER
CEN
T N
~
01
Q)
8 ;::;
~
Oi
0 0
0 0
0 0
0
57
·58
CD
58
·59
iD
8
59
-60
(I
I z
Q)
~
II
r 60
-61
i5
r 0
1"1
61·6
2 ~
0 6
2-6
3
(')
57-5
8 0 S6
5
8·5
9
1"1 :n
59-6
0
g 6
0·6
1
c l>
z
61
-62
-i -<
62-6
3 0 0 s:
('
) 5
7-5
8
~
1"1 z
58-5
9 :::
0 -i :n
en
'f! 5
9-6
0
0 ~
60·6
1 z
(ij ~
61-6
2 0
~ 6
2-6
3
, I w
-J
en
I 0
~
57-5
8 I
~ 5
8-5
9
0 )>
0
~
59
·60
r
(')
60-6
1 I'T
I 0 c
61-
62
z
z -i
:::0
-<
62
·63
0 r r
57-5
8 s:
I'T
I ~ 5
8·5
9
z 0
-i
~
59
-60
g 6
0-6
1
~ 61
-62
-i -<
62
-63
57
-58
iii
59
-60
(/
)
"TI
g 60
-61
:n
Ci)
-
61-6
2
c ::0
ITI
N·
0 N
~
01
Q)
i5
;::;
i a;
N
0 0
0 0
0 0
0 0
1N3:
l!::l3
d
......
.,....
,.. __

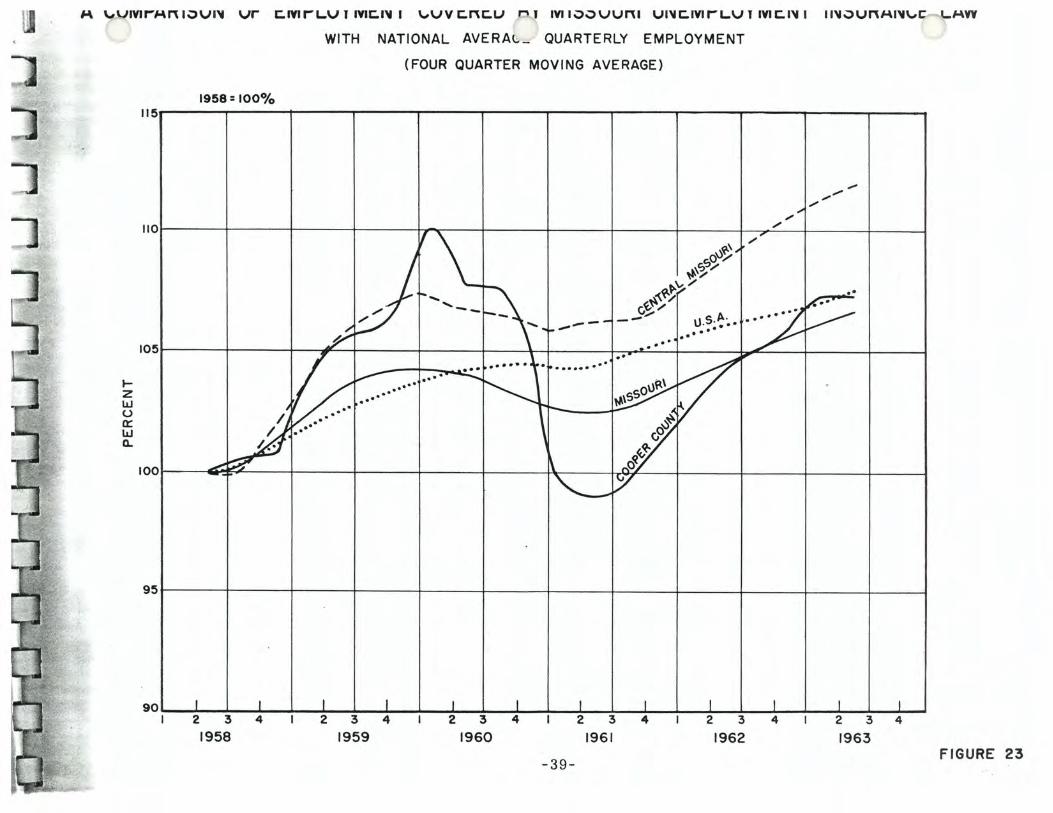
EMPLOYMENT
In Figure 23, a comparison of employment covered by Missouri's Unemployment Law at the county, mid-Missouri and state level is made with the national average quarterly employment.
Although it must be realized that the Missouri emp!Qyment figures include only the businesses with four or more employees, a comparison of trends can be made with the national figures.
The state's percentage increase in employment has been less than that of the nation's during the last three years, whereas central Missouri's increase is larger than that of the state and the nation. The sharp rise and fall of Cooper county's employment could be attributed in part to the employment of construetion workers during the period of construction of the Interstate Highway.
-38-
OTHER ECONOMIC FACTORS
To further clarify the economic condition of Boonville, such aspects as city -tax income, utility operations, postal receipts and bank deposits were analyzed. Table IV details a selection of various sources of city tax income which would be indicative of Boonville's economic climate. Obviously, most of these sources of income slow a distinct upward trend.
Figure 24 illustrates Boonville's utility activities, all of which have made gains since 1958.
Both postal receipts and bank deposits, as presented in Tables V and VI show definite upward trends.
M ~-VIVH""'M~ lvV I~ Vr I:.IVU""'L..V l lVII:. I~ I ~VV t:.ni:.U p ,J IVIIvvVU~I UI'41:.1VI r L..V l lVII:. I~ I ll~vU~MI~~C-'-MYV
tz w u 0::: w Q..
1958= 100% 115
110
105
/
~ ~ 100
95
L__L__ 90 I
-- J 2 3 4
1958
WITH NATIONAL AVERAL_ QUARTERLY EMPLOYMENT
(FOUR QUARTER MOVING AVERAGE)
/ ,""
'\_ ov~" ;'
~ y
~ ~ ... .. .. .. .. ..
I I 2 3 4
1959
~{;_)CJ; ~ .....
f\ """ I"-, :<.~~~ .... __ {J~~/
--- __ ,..... u s.A. . ...
~-- .. . . .. .. ...... . . . . ...... \. ..
v II"'" ... ......... .... ~
~~ ~ r--
\ I 0
~
~ nd~·
'--/
I I I I I 2 3 4 2 3 4 2 3
1962 1960 1961
-39-
;;z
I 4
.... ......... ....
-·· ,<··
~
I I 2 3 4
1963 FIGURE 23

TABLE IV
CITY OF BOONVILLE
A Survey of Selected Sources of Tax Income
1958-59 1959-60 1960-61 1961-62 1962-63 1963-64
Current Real Estate Tax 51, 360 53, 771 60, 201 68,444 71,891 72, 567 Current Personal Property Tax 9, 356 11' 34 7 11, 459 12,751 13,984 14,058 Merchants and Manufacturers
Ad Valorem Tax 4, 908 4,782 5, 172 5, 780 5, 759 6,351 Merchant Licenses 7, 387 7, 232 6, 805 7, 577 6, 566 7, 665 Auto and Truck Licenses 8, 076 8, 066 9, 671 9, 251 10,266 10, 302 5o/c Gross Receipts Tax 3 7, 932 40, 034 43, 117 46,486 49, 161 50,485 Parking Meter 17, 390 18,247 18, 259 16, 862 ':< 16, 883 17,112 Light and Water Meter Tax 4, 122 2, 387':o:c 2, 401 2, 419 2,474 2,475 Sanitation Department Collection 38, 779 39, 445 39, 238 39, 159 40,375 44,257
1958 1959 1960 1961 1962 1963
Assessed Valuation
Real Estate 5, 666, 180 5, 657, 900 5,992,980 6, 022,750 6, 240, 507 6, 389, 7 50 Personal Property 1,,149, .875. 1,324,275 1,244,960 1, 256,415 1, 343, 920 1, 378, 600
Tax Levy L .OO . 1. 00 1. 10 1. 21 1. 21 1. 21
* One parking lot discontinued ** Light meter tax discontinued
Source: Boonville City Audits
-40-

BOONVILLE UTILITIES
1958 = 100°/o
180 180
160
140 140
120
• IIIII ··••II ··•Ill .II 120
.... z
II II .,
w ~100
, 100~
w , ~ z
-i
80
TELEPHONES WATER METERS GAS METERS ELECTRIC METERS KILOWATT HOURS
F I GURE 24
-41-

TABLE V
POSTAL RECEIPTS - BOONVILLE
Year Receipts
1958 $114,170 1959 152, 272 1960 169,309 1961 167,724 1962 178, 606 1963 197,223
>:C Rate Increase
Source: Postmaster - Boonville, Missouri
TABLE VI
BANK DEPOSITS - BOONVILLE
Year Deposits
1958 $14, 918, 286 1959 14,630,444 1960 15,074,720 1961 17,320,214 1962 17, 163, 987 1963 18,781,926
Index
100 133 148 147 156 173>1:
Index
100 98
101 116 115 126
Source: National Bank of Boonville Kemper State Bank
-42-

PARKING
Table VII shows the result of parking surveys made in Boonville during a 12-hour period before and after the opening of Interstate 70 to traffic. These surveys were conducted in the downtown area. While it is recognized that two surveys could hardly be called conclusive, some implications can be gained since efforts were made to make conditions as identical as possible.
In the "before" and "after" comparisons, it
-43- '
would appear that although fewer vehicles are parking in downtown Boonville, the average parking time has increased. With 15 percent decrease in the number of vehicles parked, the average parking time per vehicle has increased about 25 percent. Howard county, with only 8 more vehicles parked, had an increase in average parking time per vehicle of 50 percent. This could indicate that Howard county residents are doing more shopping in Boonville.

TABLE VII
SUMMARY OF BOONVILLE PARKING SURVEYS
June 29, 1960 (6 a.m. to 6 p.m.)
August 7, 1961 (6a. m. to 6 p.m.) Average
Percent Percent Parking Percent Space- of Total of Total Time Per
Total of Total Hours Space- Hours Space- Hours Vehicle Registration Trucks Cars Vehicles Vehicles Used Used Available (Minutes)
1960
Boonville 20 813 833 45.5 1274.9 59. 1 23.6 91. 8 Cooper County 2 139 141 7.7 179.8 8.3 3.3 76.5 Howard County 1 152 153 8.4 144.7 6.7 2. 7 56.7 Boone County 6 37 43 2.3 46.0 2.1 0.9 64.2 Other Counties 25 467 492 26.9 397.4 18.4 7.4 48.5 U.S. Government - 3 3 0.2 1.0 0. 1 0.0 20.0 Foreign States 10 152 162 8.9 113. 9 5.3 2. 1 42.2 Foreign Countries - 2 2 0.1 0. 5 0.0 0.0 1 5. 0
Totals 64 1765 1829 100.0 2158.2 100.0 40.0 70.8
1961
Boonville 24 747 771 49. 1 1302.8 56.9 24.1 101.4 Cooper County 2 122 124 7.9 189.0 8.2 3.5 91. 5 Howard County 1 160 161 10.2 228.5 10.0 4.2 85.2 Boone County 5 30 35 2.2 40.0 1.7 0.7 68.6 Other Counties 10 394 404 25.7 458. 5 20.0 8.5 68. 1 U.S. Government Foreign States 1 74 75 4.8 70.7 3.1 1.3 56.6 Foreign Countries - 1 1 0.1 1.5 0. 1 0.0 90.0
Totals 43 1528 1571 100.0 2291.0 100.0 42.3 87.5
* Total Space Hours Available 5400
-44-

j,
ACCIDENTS
The decrease in traffic congestion has had a favorable effect on the safety of the driv-
TABLE
ing public as shown in Table VII I.
VIII
Accident Record Boonville Study Area
Number of Property Year Accidents Damage Injuries Fatalities
1958 191 $ 63, 671 79 5 1959 194 75,908 100 2 1960 180 1 I 79,774 92 3
8 21 5,250 7 1 1961 102 32,375 24 0
13 7, 110 18 0 1962 118 39,410 56 2
12 13, 325 13 1 1963 136 57,180 39 0
7 12, 050 12 0
1 I The Study Area excluding Interstate Route 70
21 The stretch of Interstate Route 70 from the Missouri Routes 41 and 87 interchange to the U. S. Route 40 and Missouri Route 5 interchange
Source: Boonville City Police and Missouri State Highway Patrol Records and Reports
-45-

This study is the third in a series which included Rolla and Lebanon, Missouri. In all three studies it was evident that the highway bypasses have not .adversely affected the economics of the cities. However, it would be wrong to imply that such relocations cannot be detrimental to the business climate "in 'the communities they bypass.
Rolla, Lebanon and Boonville are trade cen-
-46-
ters in the midst of rural economies and most highway-oriented businesses have either moved to m<!tre favorable locations or began cul tivating local tr.ade.
Some cities may have particular economi c . and traffic conditions which are quite differ ent from these three cities and the decision to construct highway bypasses must be based on the circumstances in each individual case.
I ~
~
I

I I .,
... z 1&.1
STUDY AREA SERVICE STATIONS ESTIMATED RETAIL SALES
AS A PERCENT OF THE AVERAGE QUARTER OF 1958
- - QUARTERLY SALES -----·QUARTERLY SALES INCLUDING 1-70 INTERCHANGE AREAS
FOUR QUARTER MOVING AVERAGE CENTERED • • • • • • •• • • FOUR QUARTER MOVING AVERAGE INCLUDING 1-70 INTERCHANGE AREAS
160 160
1958=100°/0
~0 140
~ 1·70 INTERCHANGE AREAS
20 , ~ 120
~ 801 ' I T \> 't -· • , . "· 1 • r ' 1 1 1&.1 • ,. I ••• 1: I > ::::;;oo>< I
a.
40~-----------+----------+----------+----------~--------4----------+----~ 40
20
0 2 3 4 1958
2 3 4 1959
2 3 4 1960
YEARLY
2 3 4 1961
QUARTERS
2 3 4 1962
-48-
2 3 4 1963
1958 1959 1960 1961 1962 1963
FIGURE · A-1

... z LIJ
STUDY AREA GASOLINE GALLONAGE SOLD
AS A PERCENT OF THE AVERAGE QUARTER OF 1958
----QUARTERLY SALES ------- QUARTERLY SALES INCLUDING 1-70 INTERCHANGE AREAS
FOUR QUARTER MOVING AVERAGE. CENTERED •••••••••• FOUR QUARTER MOVING AVERAGE INCLUDING 1-70 INTERCHANGE AREAS
160 160
1958=100%
4 140
~ I· 70 INTERCHANGE AREAS
Z IW
.------------iiOO
' 0 801 .. 1/ . I I '..! I I • .- ' I • I a: ~ '<r•. '' va• ,. LIJ 0..
0 2 1961
YEARLY QUARTERS 1962
FIGURE A-2
-49-
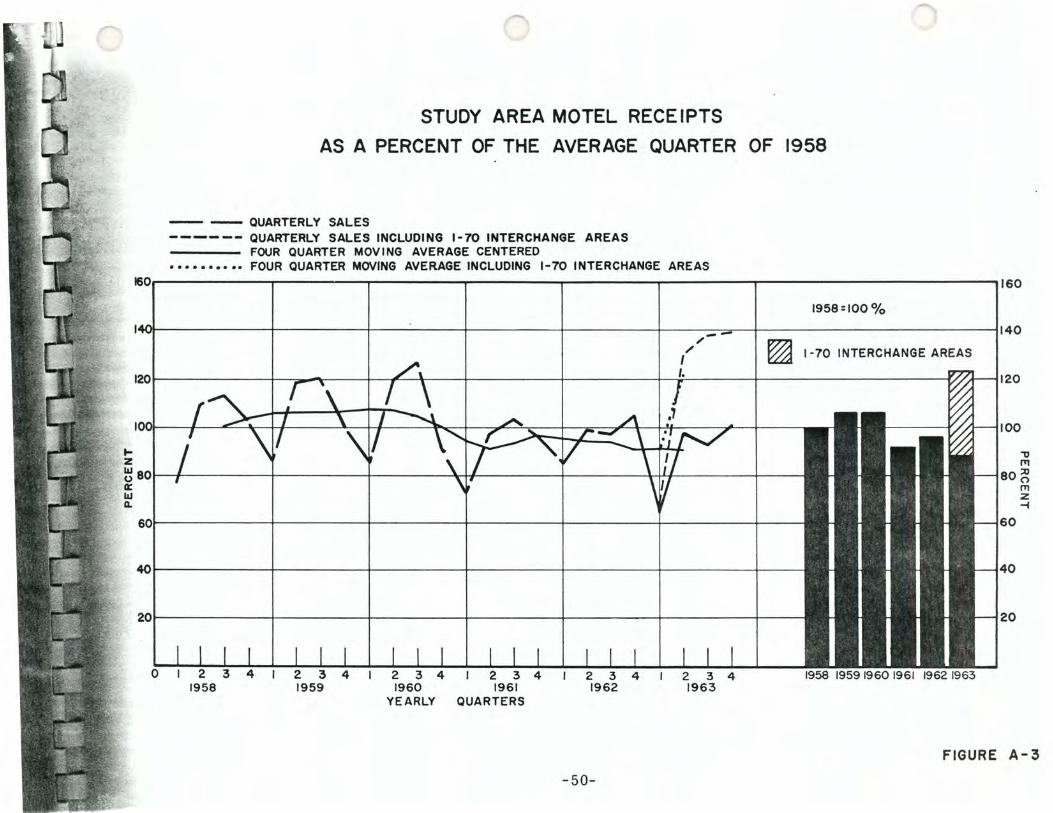
STUDY AREA MOTEL RECEIPTS
AS A PERCENT OF THE AVERAGE QUARTER OF 1958
---- ---- QUARTERLY SALES ------ QUARTERLY SALES INCLUDING 1-70 INTERCHANGE AREAS
FOUR QUARTER MOVING AVERAGE CENTERED • • • • • • •• •• FOUR QUARTER MOVING AVERAGE INCLUDING 1-70 INTERCHANGE AREAS
60 160
1958=100%
I 140
~ 1-70 INTERCHANGE AREAS
0
40~----------~---------+--------~----------~--------4---------~--~
20~----------~---------+--------~----------~--------,_--------~--~
1958 19591960 1961 1962 1963
FIGURE A-3
-50-

STUDY AREA RESTAURANTS, TAVERNS a LIQUOR STORES RETAIL SALES
AS A PERCENT OF THE AVERAGE QUARTER OF 1958
-- QUARTERLY SALES ------ QUARTERLY SALES INCLUDING 1-70 INTERCHANGE AREA ---- FOUR QUARTER MOVING AVERAGE CENTERED • •• • • •• • ••• FOUR QUARTER MOVING AVERAGE INCLUDING 1-70 I~TERCHANGE AREAS
160 160
1958 = 100°/0
140 140
' 201 ::j;t' \\ I it I I /--, .. j./'\ I ~ 1·70 INTERCHANGE AREAS 1120
I ••••• \ I
~ I I I v '\.1 / \ 1/ I I LIJ 801 • 0 a: LIJ Q.
60~---------------------+--------------------~-----------------r--------------------r-----------------;-----------------_,--------~
40~------------~---------r----------+----------4----------~----------~--~
0 I 2 3 4 1958
2 3 4 1959
I 2 3 4 1960
YEARLY
2 3 4 1961
QUARTERS
2 3 4 1962
2 3 4 1963
1958 19591960 1961 1962 1963
FIGURE A-4
-51-