Embed Size (px)
Citation preview

-
NASA
pt.2 ; I
TI? 1007
c.1
DOE/NASA/1011-78/28 NASA TM-78993
- 0 -I ==E - -
COLD-AIR PERFORMANCE OF z"-g J=- W L W E * u-g W-"
F R E POWER TURBINE DESIGNED '"3
FOR 112-KILOWATT AUTOMOTIVE - 2
3e -
Kerry b. McLallin and Milton G. Kofskey National Aeronautics and Space Administration Lewis Research Center
, : Prepared for 1' .// 3 U. S. DEPARTMENT OF ENERGY Office of Conservation and Solar Applications Division of Transportation Energy Conservation
. "i 1 1 <,
https://ntrs.nasa.gov/search.jsp?R=19790009688 2018-09-07T14:52:00+00:00Z

NOT I C E
This report was prepared to document work sponsored by the United States Government. Neither the United States nor its agent, the United States Department of Energy, nor any Federal employees, nor any of their contractors, subcontractors or their employees, makes any warranty, express or implied, or assumes any legal liability or responslbillty for the accuracy, completeness, or useful- ness of any information, apparatus, product or process disclosed, or represents that its use would not infringe privately owned rights.

TECH LJBRARY KAFB, NM
0334334 DOE/NASA/1011-78/28 NASA TM-78993
COLD-AIR PERFORWNCE OF FREE POWER TURBINE DESIGNED FOR 112-KILOWATT AUTOMOTIVE GAS-TURBINE ENGINE
I1 - EFFECTS OF VARIABLE STATOR-VANE-CHORD SETTING ANGLE ON TURBINE PERFORMANCE
K e r r y L. M c L a I l i n a n d Milton G. Kofskey Na t iona l Ae ronau t i cs and Space Admin i s t ra t i on Lewis Research Center Cleveland, Oh i o 44135
February 1979
Prepared fo r U. S. DEPARTMENT OF ENERGY Off ice of Conserva t ion and So la r App l ica t ions D iv i s ion of T ranspor ta t i on Energy Conserva t i on Wash ing ton , 0. C. 20545 Under In teragency Agreement EC-77-A-31-1011

SUMMARY
The cold-air performance of the baseline power turbine designed for a 112-kilowatt automotive gas-turbine engine has been experimentally determined as part of the Department of Energy automotive gas-turbine program. Since this axial-flow power turbine has a variable stator for engine control and braking, performance data were taken at positive-power stator-vane-chord setting angles of 26O, 30°, 35O (design), 40°, and 50' from the plane of rotation and at the nominal braking position of 107O. The overall performance in terms of mass flow, torque, speed, and efficiency is pre- sented. Overall diffuser performance and the results of rotor-exit radial surveys are also presented.
Turbine efficiency varied significantly with stator setting angle, increasing to a maximum as the setting angle increased. For equivalent design speed and a design work factor of 1.172, the maximum total efficiency was 0.87 at the 45' setting angle although the total efficiency at the design setting angle of 35' was 0.77. Turbine mass- flow and torque levels increased with increasing setting angle, with the maximum levels at the 50° stator setting angle. At equivalent design speed and a design static- pressure ratio of 1.775, mass flow ranged from 48.5 to 133.5 percent of design and torque ranged from 33 to 142 percent of design as the stator was opened from the 26O to the 50° setting angle. The turbine braking power was determined at a nominal stator setting angle of 107O. At equivalent design speed and static-pressure ratio, equivalent braking power was 10.8 percent of equivalent design power output.
Turbine internal flow characteristics were determined from static-pressure mea- surements and rotor-exit radial surveys with probes. The rotor-hub reaction was negative for all conditions tested at stator setting angles below 40°. Although the hub stage reaction was -0.160 at the 35O setting angle (design), it was 0.131 at the 45O setting angle (maximum efficiency). Overall diffuser total-pressure-loss coefficients that included both the diffuser and the exit collector were obtained over the range of diffuser-inlet critical velocity ratios tested. The loss coefficient varied from 0.2 to 0.4 as the inlet critical velocity ratio increased from 0 . 1 to 0.5.
INTRODUCTION
The Department of Energy (DOE) is conducting a program to demonstrate a gas- turbine-powered automobile that meets the 1978 Federal Emissions Standards and has

acceleration characteristics and fuel economy that are competitive with current con- ventionally powered vehicles. One part of this program involves the performance evaluation of a sixth-generation gas-turbine engine that was designed and fabricated (ref. 1) by the Chrysler Corp. This engine delivers 112 kilowatts for use in a 2000- kilogram vehicle.
The Lewis Research Center, under an interagency agreement, was given the re- sponsibility for evaluating the performance of the Chrysler gas-turbine engine. This engine is to be used as a baseline for the development of an upgraded automotive gas- turbine engine. Accordingly, engine tests, as well as cold-air component tests of the turbomachinery, a re being made. Results of tests to determine the overall external heat loss from the engine are given in reference 2. The cold-air component test re- sults for the compressor-drive turbine are given in reference 3 . The cold-air compo- nent test results for the free power turbine with the variable stator set at the design stator setting angle of 35' are given in reference 4.
Since the power turbine uses a variable-area stator for engine control and braking, we wanted to know the turbine performance over the range of stator setting angles. This report describes the cold-air performance characteristics of the power turbine at stator setting angles of 2 6 O , 30°, 35' (design), 40°, 45O, and 50' from the plane of M-
tation and at the stator braking position of 107'. Tests were made with an inlet pres- sure of 0.42 bar and an inlet temperature of about 303 K. At the design stator setting angle, these conditions gave the same Reynolds number as at design engine operating conditions. Data were obtained at speeds from 30 to 110 percent of design and at pres- sure ratios from 1.11 to 2.67.
This report describes the power turbine and its performance at each stator setting angle with and without the exit diffuser. Results are expressed in terms of power, torque, mass flow, and efficiency. The results of radial surveys of rotor-exit absolute flow angle and total pressure at design equivalent speeds and pressure ratios are pre- sented, including velocity diagrams. Diffuser performance is presented over the range of test conditions.
SYMBOLS
A flow area, cm
$ aspect ratio, b/c
b blade height, cm
c blade chord, cm
d flow deviation angle, I p I - [ K [ , deg
2
2

i
N
P
P
R
Rstg
r
S
T
U
V
AvU
W
W
r Y
6
E
E
incidence angle, I p I - I K 1 , deg
turbine wheel speed, rad/sec
power, kW
absolute pressure, bar
gas constant, for air R = 8314.4 J/kg.K
(u; - us)+ (w; - w;) stage reaction.
- (< - <)+ (.; - ui)+(w; - w;) radius, cm
blade spacing, cm
temperature, K
blade velocity, m/sec
absolute flow velocity, m/sec
change in absolute tangential velocity across rotor, m/sec
relative flow velocity, m/sec
mass flow, kg/sec
absolute flow angle measured from axial direction, deg
average absolute flow angle, deg
relative flow angle measured from axial direction, deg
torque, N-m
ratio of specific heats
ratio of inlet total pressure to U . S. standard sea-level pressure, pi/p*
y*(*)v*/(y*-l)
specific-heat ratio correction,
turbine efficiency
squared ratio of critical velocity at inlet to critical velocity at U. S. standard sea-level conditions,
3

K blade metal angle at leading o r trailing edge, measured from axial direction (fig. 2(b)), deg
0- blade solidity, c/s
Q stator-vane-chord setting angle measured from tangential direction (fig. 2(b)), deg -
w diffuser total-pressure-loss coefficient, (pi - pb)/(pi - p4)
Subscripts:
c r conditions corresponding to Mach number of 1
L local condition
m mean
t tip
th blade throat
1 station upstream of prerotation vanes (fig. 6(a))
2 station at stator inlet (fig. 6(a))
3 station at stator exit and rotor inlet (fig. 6(a))
4 station at rotor exit and diffuser inlet (fig. 6(a))
5 station just inside diffuser exit (fig. 6(a))
6 station in exit collector (fig. 6(a))
35 design stator setting angle of 35'
Superscripts :
I total-state condition
* U . S. standard sea-level conditions of 1.013 bars and 288.2 K
TURBINE DESCRIPTION
The DOE baseline power turbine, with a variable stator for engine braking and control, was designed to deliver 112 kilowatts for use in a 2000-kilogram vehicle. The design-point operating conditions are given in table I .
A cross section of the power-turbine test package is shown in figure 1. Engine components including the interstage duct, variable stator, rotor, exit diffuser, and bearing assembly were used in the test package. Prerotation vanes were used at the
4

interstage duct inlet to provide approximately the design swirl out of the compressor- drive turbine.
Variable Stator
The power-turbine stator was designed to provide a variable throat area for engine braking and control. Since, in this design, the vanes pivot through large arcs, the stator assembly was designed with concentric, spherical end walls. The pivot axis was chosen to be a line through the center of the concentric spheres and at an angle of 19.50' to the plane of rotor rotation (fig. 1). This design allows the vanes to pivot with no change in end clearance. The stator assembly is shown in figure 2(a), and the effects of pivot on the vane mean-section flow path a re shown in figure 2(b) for selected stator-vane-chord setting angles.
The stator has 27 vanes, each with changing cross section and twist from hub to tip. The effects of stator setting angle on the stator-exit, mean-radius blade metal angle K (fig. 2(b)) and on the throat area +h are shown in figure 3 for the positive- power stator setting angles tested. The blade metal angle K varied from 76' to 52' (from the axial direction) a s the stator was opened from the 26O to the 50' stator set- ting angle. Stator throat area varied from 60 to 160 percent of design as the stator was opened from the 26' to the 50' setting angle.
The stator aerodynamic parameters are given in table I1 for the design stator set- ting angle. The measured vane end clearances are 0.025 and 0.041 centimeter at the hub and tip walls, respectively. These clearances are 1.1 and 1 . 9 percent of the vane height at the hub and tip, respectively. The design stator-vane-chord setting angle is 35O, which corresponds to a stator-exit mean-radius blade metal angle of 67'.
Rotor
The power-turbine rotor is of axial-flow design with a constant hub radius and a tip radius that increases from inlet to exit. The rotor average hub-tip radius ratio is 0.751, with a hub diameter of 14.163 centimeters and a tip diameter that increases from 18.753 to 18.966 centimeters through the blade row. The tip clearance is con- stant through the blade row at 0.047 centimeter, o r 2 percent of the average blade height.
The rotor has 51 blades, each with changing cross section and twist from hub to tip. The rotor is shown in figure 4 and rotor design blading parameters are given in table 11.
5

Diffuser
The power-turbine exit diffuser is an axial- to radial-flow annular diffuser with highly curved end walls. The ratio of diffuser-exit to rotor-exit area is 2.175, and the ratio of the average length to the diffuser inlet height is 3.130. The gas flow is dumped from the W u s e r exit into a large collector before it leaves the test package. The dif- fuser and the exit collector are shown in figure 1.
APPARATUS, INSTRUMENTATION, AND PROCEDURE
Apparatus
The apparatus consisted of the turbine, an airbrake dynamometer to absorb and measure the torque output of the turbine, and an inlet and exhaust piping system with flow controls (fig. 5). Pressurized, dry a i r was used as the driving fluid for the tur- bine.
The air was piped into the turbine through a filter, a mass-flow measuring station (a calibrated flat-plate orifice), and a remotely controlled pressure-regulating valve. The air, after passing through the turbine, was exhausted through a system of piping and a remotely operated valve into the laboratory low-pressure exhaust system.
The airbrake dynamometer was cradle mounted on air bearings for torque mea- surement. The force on the torque arm was measured with a commercial, strain-gage load cell. The rotational speed was measured with a magnetic pickup and a shaft- mounted gear.
Instrumentation
Turbine performance was determined by measurements taken at stations 2 and 4. Overall performance, which includes that of the diffuser and the exit collector, was determined by measurements taken at stations 2 and 6. (Fig. 6 gives station loca- tions.) Turbine-inlet total temperature was measured at station l and was assumed to be the same at station 2 . Thermocouple rakes could not be installed at station 2 be- cause it would have involved drilling through several mating parts (fig. l). At sta- tion 1, the instrumentation consisted of four total-temperature rakes spaced at 90' in- tervals around the circumference. At stations 2 and 3 (stator inlet and exit) there were eight wall static-pressure taps, four each on the inner and outer walls. These inner- and outer-wall taps were located opposite each other at 90' intervals around the circumference.
6
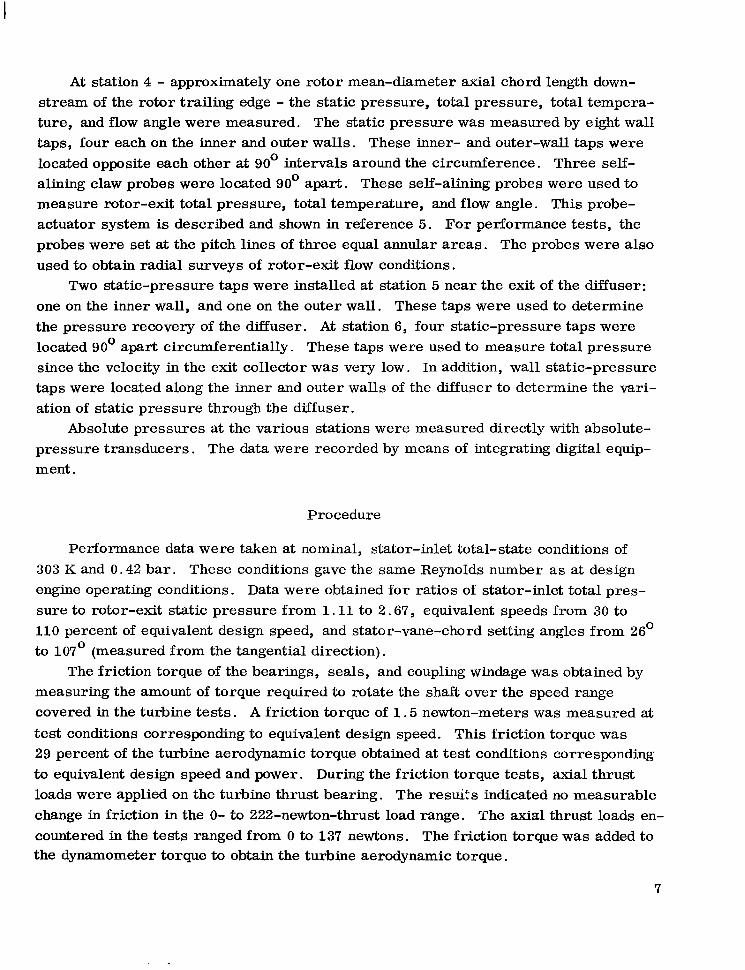
At station 4 - approximately one rotor mean-diameter axial chord length down- stream of the rotor trailing edge - the static pressure, total pressure, total tempera- ture, and flow angle were measured. The static pressure was measured by eight wall taps, four each on the inner and outer walls. These inner- and outer-wall taps were located opposite each other at 90° intervals around the circumference. Three self- alining claw probes were located 90' apart. These self-alining probes were used to measure rotor-exit total pressure, total temperature, and flow angle. This probe- actuator system is described and shown in reference 5. For performance tests, the probes were set at the pitch lines of three equal annular areas. The probes were also used to obtain radial surveys of rotor-exit flow conditions.
Two static-pressure taps were installed at station 5 near the exit of the m u s e r : one on the inner wall, and one on the outer wall. These taps were used to determine the pressure recovery of the diffuser. At station 6, four static-pressure taps were located 90° apart circumferentially. These taps were used to measure total pressure since the velocity in the exit collector was very low. In addition, wall static-pressure taps were located along the inner and outer walls of the diffuser to determine the vari- ation of static pressure through the diffuser.
Absolute pressures at the various stations were measured directly with absolute- pressure transducers. The data were recorded by means of integrating digital equip- ment.
Procedure
Performance data were taken at nominal, stator-inlet total-state conditions of 303 K and 0.42 bar. These conditions gave the same Reynolds number as at design engine operating conditions. Data were obtained for ratios of stator-inlet total pres- sure to rotor-exit static pressure from 1.11 to 2.67, equivalent speeds from 30 to 110 percent of equivalent design speed, and stator-vane-chord setting angles from 26' to 107' (measured from the tangential direction).
The friction torque of the bearings, seals, and coupling windage was obtained by measuring the amount of torque required to rotate the shaft over the speed range covered in the turbine tests. A friction torque of 1 .5 newton-meters was measured at test conditions corresponding to equivalent design speed. This friction torque was 29 percent of the turbine aerodynamic torque obtained at test conditions corresponding to equivalent design speed and power. During the friction torque tests, axial thrust loads were applied on the turbine thrust bearing. The resuits indicated no measurable change in friction in the 0- to 222-newton-thrust load range. The axial thrust loads en- countered in the tests ranged from 0 to 137 newtons. The friction torque was added to the dynamometer torque to obtain the turbine aerodynamic torque.
7

The turbine was rated on the basis of both total and static efficiencies. The total pressures p' at stations 2 and 4 were calculated from measured mass flow w, static pressure p, total temperature T' , and flow angle a! with the following equation:
where A is the annular flow area at the particular station in question.
RESULTS AND DISCUSSION
The overall performance of the DOE baseline power turbine is discussed in terms of mass flow, torque, power, speed, and pressure ratio. Performance maps based on rotor-exit total, rotor-exit static, and diffuser-exit static conditions (pressure ratios and efficiencies) a r e presented. Turbine internal flow characteristics, determined from rotor-exit radial surveys, are given in terms of efficiency and absolute flow angle. Velocity diagrams calculated from the survey data are also presented. The static-pressure variations through the turbine are shown at the hub and tip. Diffuser performance is discussed in terms of the static-pressure variations through the duct a s well as the total-pressure losses over the range of conditions tested.
Overall Performance
Mass flow. - As previously mentioned, stator throat areas from 60 to 160 percent of the design throat area were tested (fig. 3). So, the turbine has independent mass- flow curves for each stator setting angle. The mass-flow curves for the positive- power stator setting angles (26' to 50') are presented in figure 7 . The mass-flow variation with the stator in braking position (107') is presented in a later section.
The mass flow is presented, at each positive-power setting angle, for lines of con- stant speed over the static-pressure-ratio range pi/p4 tested. At setting angles be- low 40' (figs. 7(a) to (c)), each set of speed lines converges at high pressure ratios, indicating stator choke conditions. At the 40' setting angle (fig. 7 (d)), the stator ap- peared to choke at low turbine speeds and the rotor appeared to choke at high turbine speeds. Above the 40' setting angle (figs. 7(e) and (f)), the speed lines do not converge at high pressure ratios, indicating that the rotor will choke before the stator. However, at the 45' and 50' setting angles, rotor choke could not be reached for the test inlet conditions.
8

I
Mass flows at each positive-power stator setting angle were compared at a static- pressure ratio pb/p4 of 1.775. This corresponds to the design overall static- pressure ratio pi/p6 of 1.698 at the design stator setting angle. At the 1.775 static- pressure ratio and equivalent design speed, mass flow ranged from 48.5 percent of de- sign at the 2 6 O setting angle to 133.5 percent of design at the 50° setting angle.
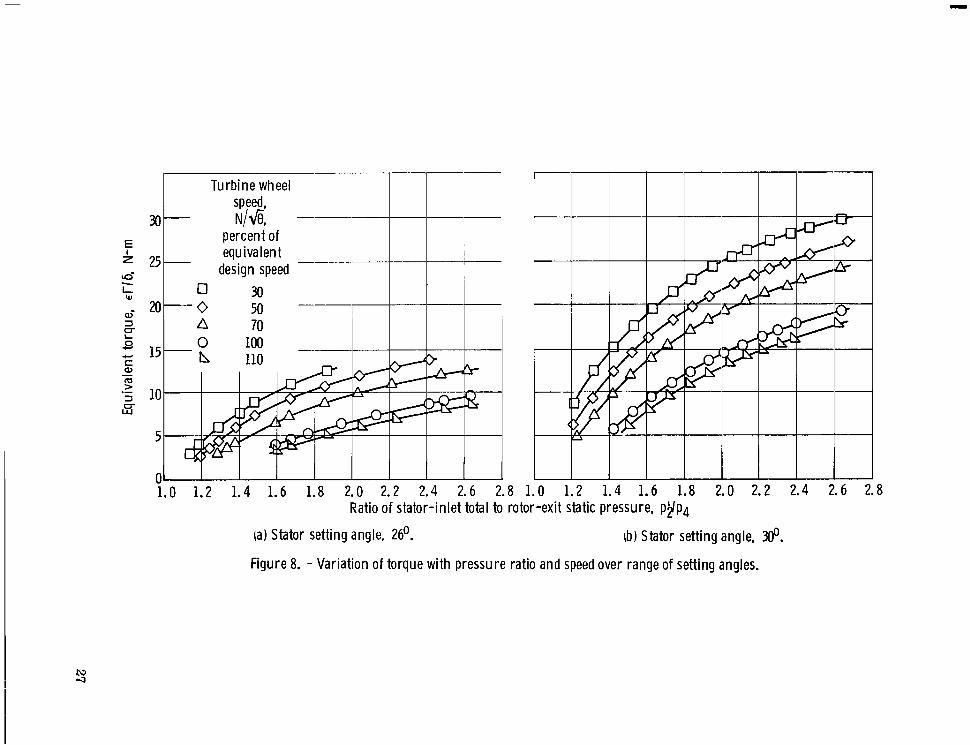
stant equivalent speed over the static-pressure-ratio range pi/p4 tested at each positive-power stator setting angle. Torque increased with increasing pressure ratio and decreasing speed at each setting angle, and limiting loading was not reached at any setting angle. At the design speed and pressure ratio, torque ranged from 33 to 142 percent of design as the stator was opened from the 26' to the 50° setting angle.
Torque. - The turbine equivalent torque is presented in figure 8 for lines of con-
Rotor-exit absolute flow angle. - During performance testing, the rotor-exit abso- lute flow angle was measured by the three survey probes, as described in the section Instrumentation. The average flow angle is presented in figure 9 at each positive- power stator setting angle for lines of constant equivalent speed over the static- pressure-ratio range pb/p4 tested. This average flow angle was used in the equation given in the section Procedure to calculate the rotor-exit total pressure. As shown in figure 9, the exit flow angle became more negative as speed decreased and pressure ratio increased. Negative exit flow angles indicate a positive contribution to turbine work output.
Total-pressure ratio. - The relationship between the total-pressure ratio pi/pi and the static-pressure ratio pb/p4 is shown in figure 10 at each positive-power stator setting angle for lines of constant equivalent speed. At high static-pressure ratios, the total pressure ratio increased with increasing speed. At low static- pressure ratios, this trend reversed as the speed lines began to cross. The only in- consistency in these observations is at the 26O stator setting angle, where flow condi- tions were considerably off design values.
Performance maps. - The performance maps were developed by crossplotting per- formance data of mass flow, speed, torque, and pressure ratio. Equivalent power is plotted as a function of the equivalent mass-flow - speed parameter along lines of con- stant equivalent speed. Lines of constant pressure ratio and constant efficiency are superimposed. The turbine was rated on the basis of ratios between the stator-inlet total pressure and the rotor-exit total pressure (pb/pk), the rotor-exit static pres- sure (ph/p4), and the diffuser-exit-collector static pressure (pi/p6) for each positive- power stator setting angle. Two flow conditions, corresponding to the design work factor and to the rotor-exit radial survey point, a re shown on each performance map.
The performance maps based on rotor-exit total pressure are shown in figure 11. The general level of total efficiency increased as the stator was opened and then leveled off at the 45' and 50' stator setting angles. The maximum total efficiency increased
9

I
from a low of 0.55 at the 26' setting angle (fig. ll(a)) to a high of 0.88 at both the 45' and 50' setting angles (figs. ll(e) and (f), respectively). At the design setting angle (fig. l l (c)) the measured total efficiency at equivalent design conditions was 0.77 - 11 points lower than the maximum efficiency, which occurred at the 45O setting angle. Optimum flow conditions do not occur at design point; the flow phenomena that cause this wide difference are discussed in the section Internal Flow Characteristics.
The performance maps based on rotor-exit static pressure are shown in figure 12. The general level of static efficiency increased as the stator was opened, but above the 40' setting angle (figs. 12(d) to (f)) efficiency levels remained relatively constant. The maximum value of static efficiency increased from a low of 0.52 at the 26' setting angle (fig. 12(a)) to a high of 0.75 at the 45' setting angle (fig. 12(e)). This maximum static efficiency at 45' is about 5 points higher than that measured at the design point (fig. 12(c)).
The performance maps based on the diffuser-exit-collector static pressure are shown in figure 13. The general level of overall static efficiency increased as the sta- tor was opened but leveled off at the 45' and 50' setting angles. The maximum overall efficiency increased from a low of 0.53 at the 26O setting angle (fig. 13(a)) to a high of 0.84 at both the 45' and 50' setting angles (figs. 13(e) and (f), respectively). This maximum overall efficiency at 45O and 50' is about 8 points higher than that measured at the design point (fig. 13(c)).
The performance maps also indicate that variations in stator setting angle up to 40' (figs. Il(a) to (d)) had little effect on the location of the maximum-efficiency island with respect to speed and pressure ratio. Above the 40' setting angle (figs. l l (d) to (f)) the maximum-efficiency island shifted toward lower values of speed and pressure ratio as the stator was opened further. The location of the maximum-efficiency island on the performance map depended on the incidence and reaction in the rotor. At the high setting angles, the reaction split favored the rotor; and optimum incidence would occur at lower speeds and pressure ratios than at the low setting angles, where the re- action favored the stator. The turbine incidence and reaction encountered in these tests a re discussed in a later section.
Turbine performance comparison. - A comparison of turbine performance at each positive-power stator position was made to determine the effects of stator setting angle. The conditions chosen for comparison were equivalent design speed and the design work factor of 1.172. The variations of rotor-exit total qb 4, rotor-exit static q2-4, and overall static q2 efficiencies with stator setting angle are presented in figure 14, and the turbine performance characteristics are presented in table III.
reached near the 45' setting angle. The total efficiency at the 45' setting angle was 0.87, as compared with a total efficiency of 0.77 at the design stator setting angle of
- -
Efficiency increased with increasing stator setting angle until a maximum was
10

35O. This 10-point increase in total efficiency can be attributed to increased rotor re- action and reduced stator end-clearance leakage effects due to decreased loading and reaction in the stator.
The rotor-exit kinetic energy recovered by the diffuser and the exit collector can be seen in figure 14 by comparing the levels of rotor-exit total and static efficiency relative to the overall static efficiency. The maximum kinetic energy recovery oc- curred at the 35' setting angle, where 85 percent of the rotor-exit kinetic energy was recovered. Only 70 percent of the kinetic energy was recovered at the 45' setting angle, where blading efficiency was maximum. In terms of turbine static efficiency, the gains in efficiency due to the diffuser and the exit collector were 6.3 and 9.3 points at the 35' and 45O setting angles, respectively. The kinetic energy recovered at each setting angle is listed in table 111, along with the turbine equivalent power output and the pressure ratios required to obtain design work output.
with the stator in the nominal braking position of 107O. Performance data were taken over a range of speeds from 30 to 130 percent of design and over a range of static- pressure ratios pi/p4 from 1 . 2 to 2.3. The results a re shown in figure 15.
Turbine equivalent mass flow is shown in figure 15(a) for lines of constant speed over the range of static-pressure ratios tested. The separation of the speed lines at the higher pressure ratios indicates that the rotor will choke before the stator at this setting angle; however, no rotor choke occurred for the range of pressure ratios tested. At equivalent design speed and pressure ratio the equivalent mass flow was 1 .09 kilograms per second (1.4 percent larger than design). The incidence losses en- countered by the blading with the stator in the braking position reduced the turbine mass flow to near the design value.
Braking performance. - The performance of the power turbine was determined
Turbine equivalent power is shown in figure 15(b) for lines of constant speed over the range of static-pressure ratios tested. Negative power indicates that the turbine is operating in the braking regime. Braking power increased with increasing speed and decreasing pressure ratio. The maximum braking power was measured at 130 per- cent of equivalent design speed and at a static-pressure ratio of about 1.4, where the equivalent braking power was 66.6 percent of equivalent design power. At equivalent design speed and static-pressure ratio, braking power was 10.8 percent of equivalent design power. The trends in the speed lines appear to indicate that maximum braking at each speed will occur near a static-pressure ratio of 1 .2 .
Internal Flow Characteristics
Survey data. - Rotor-exit radial surveys were taken at equivalent design speed and near the design total-pressure ratio pb/pi of 1.675 for the positive-power stator set-
11

ting angles. Significant increases in efficiency level occurred as the stator was opened and rotor reaction increased. Midspan efficiency increased the most, but the hub- and tip-region efficiencies leveled off at the high setting angles. The shifting of reaction to the rotor with increasing setting angle resulted in lower rotor profile losses and bigher midspan efficiency (fig. 16(a)). Although rotor-hub efficiency also increased with in- creasing setting angle, it decreased slightly at the 50' setting angle as the improve- ment due to rotor reaction was overcome by increases in incidence and end-wall loss. In the tip region, the leveling-off trend with increasing setting angle was due to the ad- verse effect of increased rotor reaction, which causes tip clearance losses to increase (ref. 6). Incidence losses also increased in the tip region for the high setting angles.
The variation in rotor-exit absolute flow angle from hub to tip is shown in figure 16(b) for each positive-power stator setting angle. The average flow angle is presented because the circumferential variations encountered were relatively small. Negative angles indicate a positive contribution to turbine work output. As the stator was opened and rotor reaction increased, the exit flow angle decreased - becoming negative above the 40° setting angle. The effects of rotor-tip clearance can be seen at higher rotor reactions (setting angles of 35' to 50') as a sudden increase in flow angle in the tip re- gion caused by the unloading of the blade near the clearance gap. The flow angle de- creased in the hub region because secondary flow effects in the hub end-wall boundary layer resulted in cross-channel flows from the pressure surface to the suction surface and in overturning near the hub.
Turbine reaction. - The reaction variations through the turbine are presented along the hub and tip walls in figures 17 and 18, respectively. Reaction data are given as ratios of wall static pressure to stator-inlet total pressure p/pb at selected turbine static-pressure ratios p4/pb and at equivalent design speed.
The hub reaction variations through the stator and rotor are shown in figure 17 for the positive-power stator setting angles. As setting angle increased (stator throat area increased), stator-hub reaction decreased and rotor-hub reaction increased. Below the 40° setting angle, the rotor-hub reaction was negative for all static-pressure ratios shown, as indicated by a rise in static pressure between the stator exit and the rotor exit in figures 17(a) to (c). The rotor-hub reaction was positive only at the 45' and 50' setting angles for all static-pressure ratios shown, as indicated by a decrease in static pressure through the rotor in figures 1 7 (e) and (f).
The tip reaction variations through the stator and rotor are shown in figure 18 for the positive-power stator setting angles. Although stator-tip reaction levels were lower than at the hub, the variation with setting angle was similar and reaction was still positive at the 50' setting angle. Rotor-tip reaction was positive for all test con- ditions and increased with increasing setting angle.
12

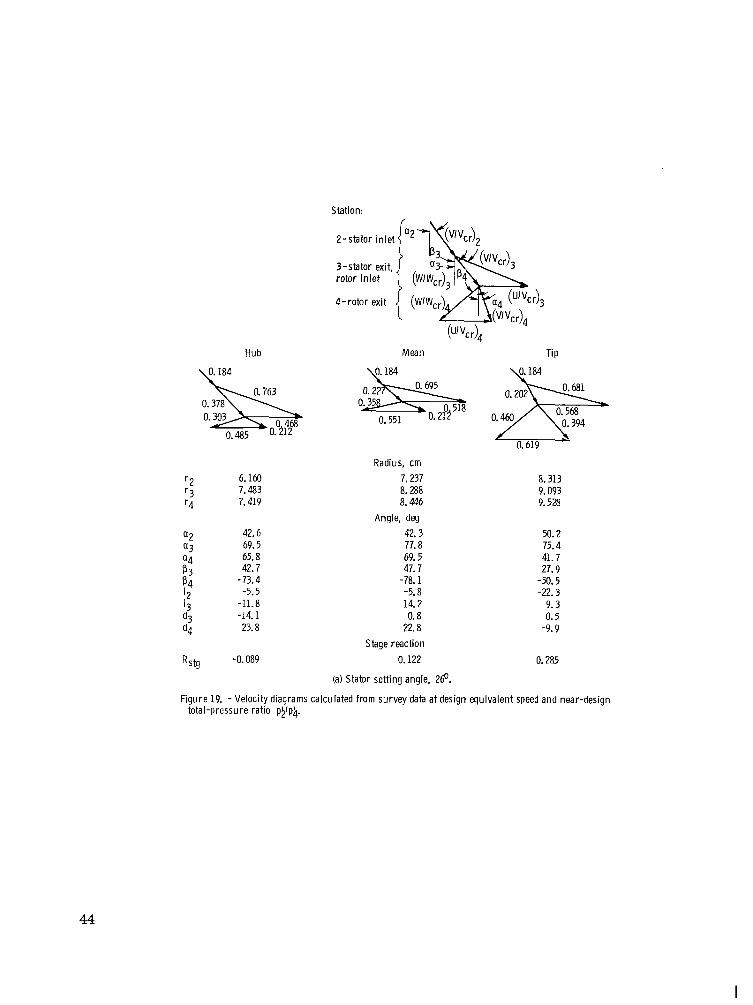
Velocity diagrams. - The velocity diagrams presented in figure 19 were calculated from survey data taken near the design total-pressure ratio pb/pi of 1.675 and at equivalent design speed. The folloWing basic assumptions were necessary to calculate the diagrams from the available data:
(1) Stator-inlet total temperature and total pressure were constant radially. (2) Static-pressure variations were linear from hub to tip for stations 2 to 4. (3) Stator total-pressure loss was constant radially. (4) Rotor-exit total-temperature level was adjusted to match measured torque. (5) Total-pressure levels at stations 3 and 4 were adjusted to match measured
mass flow. The resulting velocity diagrams at the hub, mean, and tip are shown for each positive- power stator setting angle. The figure shows absolute and relative flow angles and critical velocity ratios as well as the incidence, deviation, and stage reaction.
Turbine stage reactions R were calculated at the hub, mean, and tip for the stg
positive-power stator setting angles and are presented in figure 19 along with the other velocity diagram data. As noted previously, the rotor-hub reaction was negative for stator setting angles less than 40'. This negative reaction may cause high losses in the hub region, with possible flow separation. Stage reactions for the 35' setting angle (design setting) were -0.160, 0.195, and 0.339 at the hub, mean, and tip, respectively. Stage reactions for the 45' setting angle (maximum blading efficiency setting) were 0.131, 0.483, and 0.550 at the hub, mean, and tip, respectively.
Stator and rotor incidence angles (fig. 19) were calculated from the velocity dia- grams and blading geometry, taking into account the blading flow blockage caused by the leading edge. Stator incidence was affected by two variables: (1) the decrease in stator-blade inlet angle, measured from the axial direction, as the stator was rotated open (higher setting angles); and (2) the variation in stator-inlet flow angle, especially at the hub and tip, with changes in turbine mass flow. Stator incidence at the hub and mean increased negatively as the stator was opened, but stator incidence at the tip re- mained relatively constant at high negative values. For stator setting angles below 45O, the incidence angle at the tip was greater than -21.4'. The loss method described in reference 7 indicates a possible 20 to 50 percent increase in profile loss.
Rotor incidence at the mean and tip varied from positive to negative as the stator setting angle increased from 26' to 50'. The rotor-hub incidence was negative at all stator setting angles and increased negatively as the setting angle increased. The rotor incidence angles at a setting angle of 35' were -15. lo, 4.8', and -3.6O at the hub, mean, and tip, respectively. The rotor incidence angles at a setting angle of 45' were -30.6', -14. go, and -16.5O at the hub, mean, and tip, respectively. Because of the negative hub reaction at the 35O setting angle, the incidence encountered could cause some increase in hub profile loss (ref. 4). The negative incidence encountered at the
13
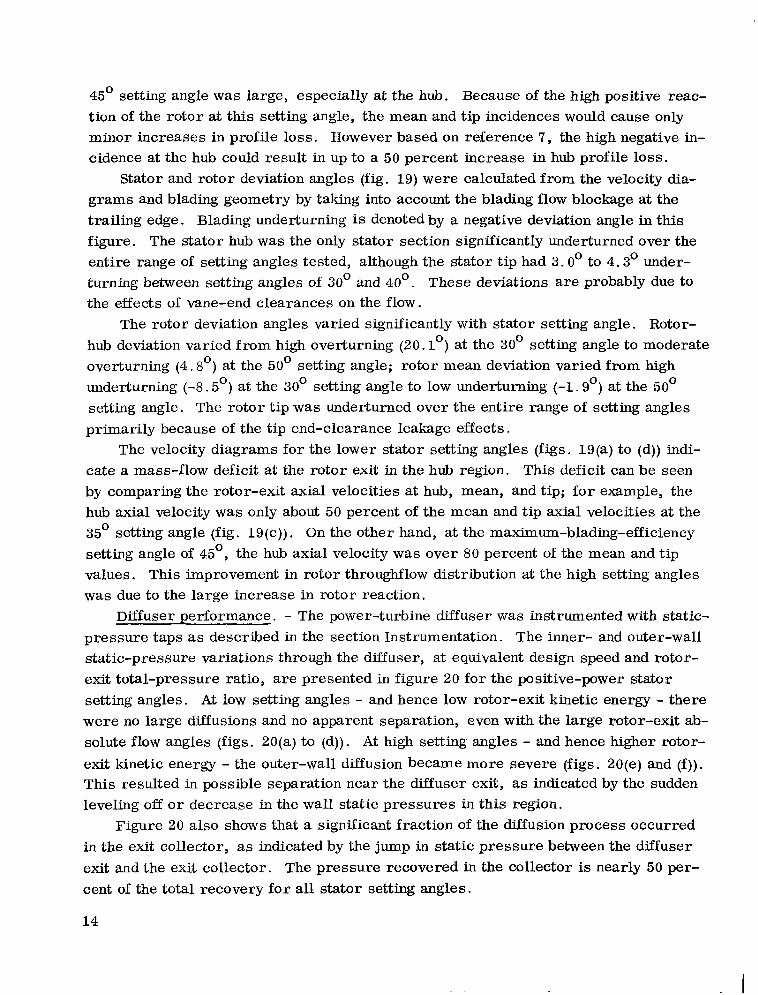
45O setting angle was large, especially at the hub. Because of the high positive reac- tion of the rotor at this setting angle, the mean and tip incidences would cause only minor increases in profile loss. However based on reference 7, the high negative in- cidence at the hub could result in up to a 50 percent increase in hub profile loss.
Stator and rotor deviation angles (fig. 19) were calculated from the velocity dia- grams and blading geometry by taking into account the blading flow blockage at the trailing edge. Blading underturning is denoted by a negative deviation angle in this figure. The stator hub was the only stator section significantly underturned over the entire range of setting angles tested, although the stator tip had 3.0' to 4.3' under- turning between setting angles of 30' and 40'. These deviations are probably due to the effects of vane-end clearances on the flow.
The rotor deviation angles varied significantly with stator setting angle. Rotor- hub deviation varied from high overturning (20.1') at the 30' setting angle to moderate overturning (4. S o ) at the 50' setting angle; rotor mean deviation varied from high underturning (-8.5') at the 30' setting angle to low underturning (-1. go) at the 50' setting angle. The rotor tip was underturned over the entire range of setting angles primarily because of the tip end-clearance leakage effects.
The velocity diagrams for the lower stator setting angles (figs. 19(a) to (d)) indi- cate a mass-flow deficit at the rotor exit in the hub region. This deficit can be seen by comparing the rotor-exit axial velocities at hub, mean, and tip; for example, the hub axial velocity was only about 50 percent of the mean and tip axial velocities at the 35' setting angle (fig. 19(c)). On the other hand, at the maximum-blading-efficiency setting angle of 45O, the hub axial velocity was over 80 percent of the mean and tip values. This improvement in rotor throughflow distribution at the high setting angles was due to the large increase in rotor reaction.
Diffuser performance. - The power-turbine diffuser was instrumented with static- pressure taps as described in the section Instrumentation. The inner- and outer-wall static-pressure variations through the d s u s e r , at equivalent design speed and rotor- exit total-pressure ratio, are presented in figure 20 for the positive-power stator setting angles, At low setting angles - and hence low rotor-exit kinetic energy - there were no large diffusions and no apparent separation, even with the large rotor-exit ab- solute flow angles (figs. 20(a) to (d)). At high setting angles - and hence higher rotor- exit kinetic energy - the outer-wall diffusion became more severe (figs. 2O(e) and (f)). This resulted in possible separation near the diffuser exit, as indicated by the sudden leveling off or decrease in the wall static pressures in this region.
Figure 20 also shows that a significant fraction of the diffusion process occurred in the exit collector, as indicated by the jump in static pressure between the diffuser exit and the exit collector. The pressure recovered in the collector is nearly 50 per- cent of the total recovery for all stator setting angles.
14

The total-pressure losses of the diffuser and the exit collector were determined over the range of test conditions. The total pressures used were those calculated at the rotor exit and those measured by the static-pressure taps in the exit collector. (The velocity was assumed to be very low in the collector. ) The diffuser total- pressure-loss coefficient W is presented in figure 21 over the range of diffuser-inlet critical velocity ratios tested. The band of data indicates an increase in loss with an increase in inlet velocity. The total-pressure-loss coefficient varied from about 0 . 2 to about 0.4 as the inlet critical velocity ratio increased from 0 .1 to 0.5. At the de- sign work factor, the loss coefficient increased from 0.26 at the 35' stator setting angle to 0.31 at the 45' stator setting angle. This increase in total-pressure loss was also represented by a decrease in kinetic energy recovery, a s described in the section Turbine performance comparison.
The diffuser total-pressure loss as a function of inlet Mach number was estimated by using the empirical correlation of reference 8, a s follows: The diffuser-inlet height, average length, and area ratio were used to obtain an equivalent annular diffuser. A static-pressure-rise coefficient was obtained. Since the correlation of reference 8 is for no swirl and thin inlet boundary layers, various Mach numbers were assumed for a no-swirl uniform flow at the inlet. At each Mach number, the static-pressure rise and flow continuity were used to compute the diffuser-exit uniform flow conditions and the diffuser total-pressure loss. Total-pressure loss was assumed to be zero from the diffuser exit to the exit collector. The total-pressure-loss coefficient 53 was com- puted at each Mach number, and the results are shown in figure 21. This total- pressure-loss estimate is within the band of experimental data and appears to agree well with a mean line for the band.
SUMMARY OF RESULTS
The cold-air performance of the baseline power turbine has been determined as part of the Department of Energy automotive gas-turbine engine program. This turbine is an axial-flow power turbine with a variable stator for engine control and braking. Performance data were obtained at equivalent speeds from 30 to 110 percent of design; at equivalent static-pressure ratios from 1.11 to 2.67; and at stator-vane-chord set- ting angles of 26O, 30°, 35O (design), 40°, 45O, 50°, and 107O (braking position) from the plane of rotation. The overall performance results are presented in terms of mass flow, torque, speed, and efficiency. The results of rotor-exit radial surveys and of diffuser performance investigations are also presented. The results were as follows:
increased, with the maximum efficiencies at the 45' setting angle. 1. The rotor-exit total efficiency increased a s the stator-vane-chord setting angle
15

2. For a design work factor of 1.172, the total efficiency at the 45' setting angle was 0.87 ; 10 points higher than at the design setting angle of 35'.
3. At equivalent design speed and design stator-inlet to rotor-exit static-pressure ratio, equivalent mass flow ranged from 48.5 percent of design at the 26' setting angle to 133.5 percent of design at the 50' setting angle. The stator choked before the rotor below the 40' stator setting angle.
ranged from 33 percent of design at the 26' setting angle to 142 percent of design at the 50' setting angle. Limiting loading was not reached at any stator setting angle.
4. At equivalent design speed and design static-pressure ratio, equivalent torque i
5. At equivalent design speed and static-pressure ratio, braking power was 10.8
6. Negative reaction occurred across the rotor hub at all flow conditions measured
7. The total-pressure-loss coefficient of the exit diffuser increased a s diffuser-
percent of equivalent design power.
for stator setting angles of 35' and below.
inlet velocity increased, varying from 0.2 to 0.4 as the inlet critical velocity ratio in- creased from 0 . 1 to 0.5.
Lewis Research Center, National Aeronautics and Space Administration,
Cleveland, Ohio, October 16, 1978, 778-32.
REFERENCES
1. Angell, Peter R. ; and Golec, Thomas: Upgrading Automotive Gas Turbine Tech- nology, An Experimental Evaluation of Improvement Concepts. SAE Paper 760280, Feb. 1976.
2. Meng, Phillip R. ; and Wulf, Richard F . : Experimentally-Determined External Heat Loss of Automotive Gas Turbine Engine, Preliminary Data Report. NASA TM X-71709, 1975.
3. Itoelke, Richard J. ; and McLallin, Kerry L. : Cold-Air Performance of the Compressor-Drive Turbine of the Department of Energy Baseline Automobile Gas-Turbine Engine. DOE/NASA/1011-78/25, NASA TM-78894, 1978.
4. Kofskey, Milton G . ; and Nusbaum, William J. : Cold-Air Performance of Free Power Turbine Designed for 112-Kilowatt Automotive Gas-Turbine Engine. I - Design Stator-Vane-Chord Setting Angle of 35'. NASA TP-1007, 1978.
16

5. Futral, Samuel M . ; Kofskey, Milton G. ; and Rohlik, Harold E . : Instrumentation Used to Define Performance of Small Size, Low Power Gas Turbines. ASME Paper 69-GT-104, Mar . 1969.
6. Haas, Jeffrey E. ; and Kofskey, Milton G. : Cold-Air Performance of a 12.766- Centimeter-Tip-Diameter Axial-Flow Cooled Turbine. III - Effect of Rotor Tip Clearance on Overall Performance of a Solid Blade Configuration. NASA TP-1032, 1977.
7. Ainley, D. G. ; and Mathieson, G. C. R. : Examination of the Flow and Pressure Losses in Blade Rows of Axial-Flow Turbines. R. & M . No. 2891, British A.R. C . , 1955.
8 . Sovran, Gino; and Klomp, Edward D. : Experimentally Determined Optimum Geometries for Rectilinear Diffusers with Rectangular, Conical, or Annular Cross Section. Fluid Mechanics of Internal Flow, Gino Sovran, ed. , Elsevier Publishing Co. , 1967, pp. 270-312.
17

TABLE I. - TURBINE DESIGN-POINT CONDITIONS
Parameter
Inlet temperature, K Inlet pressure, bar Mass flow, kg/sec Rotative speed, rpm Specific work, J/g Power, kW Rotor mean diameter, cm Work factor, AVu/Um Overall efficiency, q2-6 Overall pressure ratio, pb/p6
~
Engine operation
1104.2 1.894 1.001
35 845 112.5 112.6
16.511 1.172 0.742 1.661 " -
Equivalent conditions
288.2 1.013 1.075
18 534 30.2 32.4
16.511 1.172 0.742 1.698
..
Test conditions " -
303.0 0.420 0.436
19 004 31.7 13.8
16.511 1.172 0.742 1.698
.
TABLE 11. - TURBINE DESIGN BLADING PARAMETERS
[See section SYMBOIS for definitions. J
Blade Section IWW
Stator Hub Mean Tip
Rotor Hub Mean Tip
0.828 1.56
1.393 1.44
~ . "
Number of thickness
blades F 0.047
27 .048 .046
5 1 0.094
.066
.042
& S C O S K 1 "
8.3 6 .0 5.2
1 5 . 0 10.8 6.8 - ~.
0.025 "-"
.041
""- ""_ 0.046
1.1 "_ 1 . 9
-" "-
2.0
18

TABLE III. - COMPARISON OF OVERALL TURBINE PERFORMANCE AT DESIGN
WORK FACTOR FOR POSITIVE-POWER STATOR SETTING ANGLES
-
Equivalent speed, N, rpm Equivalent mass flow, w, kg/sec Equivalent torque, r, N-m Equivalent power, P, kW Work factor, AVu/Um Equivalent total-pressure ratio,
P y P i
P y P 4
Equivalent static-pressure ratio,
Equivalent overall static-pressure ratio, p!2/p6
Diffuser kinetic energy recovery, percent
~ ~~
I Stator setting angle, deg
26 I 30
18 534 18 534 0.498
2.103 1.172 1.172 24.1 15.0 12.5 7 .8
0.800
1.757
2.226 1.854
2.172 1.796
44 58
I
35
18 534 1.006 15.6 30.3
1.172 1.662
1.763
1.675
85
40
18 534 1.201 18.5 36.2
1.172 1.593
1.708
1.617
77
45
18 534 1.356 21.2 40.9
1.172 1.562
1.704
1.598
7 0
1
50
.8 534 1.431 22.2 43.2
1.172 1.568
1.734
1.622
62
F i g u r e 1. - Cross sec t ion of tu rb ine tes t package.
19

(a) Stator assembly.
Nomina l f l ow d i r e c t i o n
P a r a l l e l to a x i s o f r o t a t i o n
Stator-vane- c h o r d s e t t i n g
angle, * \ I
,--- P a r a l l e l to p lane " ' ' *A / of ro ta t ion
(b) Var iab le-s tator p ivot character is t ics a t mean sect ion.
F i g u r e 2. - C h a r a c t e r i s t i c s of var iable stator.
20

21

T h i n - p l a t e
Isolat ion valve
o r i f i c e P r e s s u r i z e d
P r e s s u r e c o n t r o l v a l v e To l ow-p ressu re exhaust sys tem and contro l va lves
Cont ro l va lve
(a) Schematic of t u rb ine t es t appara tus .
Ib) Turb ine test apparatus.
F igu re 5. - Exper imenta l equipment .
22

Station 6 ~ - ____
Station 5
Station R" 4
Station 1 \
'L Prerotat ion vanes
I- - I -
(a) Measuring stations.
Four rakes of three thermocouples each
Wall static-pressure taps - Flow-angle, total-pressure, and
Total-temperature rake total-temperature probes
Station 1
Station 4
Station 5
(b) Research instrumentation. (Measurement planes as viewed from cbwnstream.)
~ Wall stat ic-pressure taps
(c) Diffuser instrumentation. F igure 6. - Instrumentation.
23

p e r c e n t of equ iva len t
c - al (a) Stator set t ing angle, 26'. m
24
1.1 1.3 1.5 1.7 1.9 2.1 2.3 2.5 2.7 Ratio of s ta to r - in le t to ta l to ro to r -ex i t static p r e s s u r e , p y p 4
(b) Stator set t ing angle, 3@. F i g u r e 7. -Va r ia t i on o f mass f l ow w i th p ressu re ra t i o and speed ove r range of set t ing angles.

1.10
1. m
.90
.80
.70
v)
U al - E?
(c) Stator set t ing angle, 35O.
Rat io of s ta to r - in le t to ta l to ro to r -ex i t s ta t i c p ressure . p$/p4
(d) Stator set t ing angle, 4@. F i g u r e 7. - Cont inued.

Cn Cn
. .. (e) Stator set t ing angle. 49’.
1.1 1.3 1.5 1.7 1.9 2.1 2 3 Ratio of s ta to r - i n le t t o ta l t o ro to r -ex i t s ta t i c p ressu re , p j l p4
(f) S ta to r se t t ing ang le , 58.
F i g u r e 7. -Conc luded.
26
. . . .. . . . . . . .. . . . . . .
c Turbine wheel speed,
30 N/&, -- - Dercent of 25b equivalent
LC- design speed
Y
1.0 1.2 1.4 1.6 1.8 2.0 2.2 2.4 2.6 2.8 1.0 1.2 1.4 1.6 1.8 2.0 2.2 2.4 2.6 2.8 Ratio of stator-inlet total to rotor-exit static pressure, pyp4
(a) Stator setting angle, 26O. cb) Stator setting angle, 300. Figure 8. - Variation of torque with pressure ratio and speed over range of setting angles.

1.0 1.2 1.4 1.6 1.8 2.0 2.2 2.4 2.6 2.8
4
4
""""
1.0 1.2 1.4 1.6 1.8 2.0 2.2 2.4 2.6 2.8 Ratio of stator-inlet total to rotor-exit static pressure, pyp4
(c) Stator setting angle, 35O. (dl Stator setting angle, @. Figure 8. - Continued.

50-r"i---- Turbine wheel I I speed,
45 " i"" +- N / I ~
8 1.0 1.2 rotor-exit static
(e) Stator setting angle, 45O.
1.4 1.6 1.8 2.0 2.2 pressure, pYp4
( f ) Stator setting angle, 500.
2.4 2.6 2.8
Figure 8. - Concluded.
W N

Turb ine wheel speed, N / f i ,
percent of
design speed equivalent
”
IC) Stator setting angle, 35’.
?. 2 2: 4
0
2 0 h
I
30 50
100 70
110
Ib) Stator setting angle.
%
-% *
-lH ).
Id) Stator setting angle. 40°.
Ratio of stator-inlet total to rotor-exit stat ic pressure, prpq
(e) Stator setting angle. 45’. If) Stator setting angle. 500
I , a
Figure 9. - Variation of rotor-exit absolute f low angle with static-pressure ratio and speed over range of sett ing angles.
30

Turbine wheel
;y$ percent of equivalent
design speed
d
0 0 A 0 n
(a) Stator setting angle, 26’.
[CI Stator setting angle. 35”.
30 50
100 70
110
ibl Stator setting angle, 3@.
(dl Stator setting angle, 4@.
, ‘ :. I 1.2 1.4 1.6 1.8 2.0 2.2 2.4 2.6 2.8 1.0 1.2 1.4 1.6 1.8 2.0 2.2 2.4 2 Ratio of stator- inlet total to rotor-exit stat ic pressure, pyp4
(e ) Stator setting angle. 49. ( f l Stator setting angle. 500.
Figure 10. - Var iat ion of total-pressure rat io with stat ic-pressure rat io and speed over range of set t ing angles.
31

PYPh /I 0 . 2 . 4 .6 .8 1.0 1.2~103 4 .6 .8 1.0 1.2 1.4 1.6 1.8X10'
Equivalent maSS-flOW -speed parameter, E w N I ~ , k g - radlsec2
la) Stator setting angle, 26'. b) Stator setting angle, WO.
Figure 11. - Turbine performance maps based on rotor-exit total conditions.

0 . 4
Turbine wheel speed, N / d , percent of equivalent design speed "" Equivalent ratio of stator-inlet total to rotor-exit total pressure, pyph " Rotor-exit total efficiency, sj-4
0 Survey conditions Design work factor
-!" YPb
1.2 1.6 2.0 ~
L 2.4
PYPh
O. 4 .a 1.2 1.6 2.0 24 2
Equivalent mass-flow - speed parameter, ~wN/&i, kg. rad/sec2
(c) Stator setting angle, 35O. (d) Stator setting angle, 4@. Figure 11. -Continued.
w w

(e) Stator setting angle, 45O. i f ) Stator setting angle, 500. Figure 11. -Concluded.

- -- - Equivalent ratio of stator-inlet t o t a l to rotor-exit static pressure. P/IP~ - - Rotor-exit static efficiency, 72-4
Turbine wheel speed, N/&, percent of equivalent design speed
0 Survey conditions Design work factor
la) Stator setting angle, 26'. Ib) Stator setting angle. 300.
Figure 12. - Turbine performance maps based on rotor-exit static conditions.

101-
0 1-
""
Turbine wheel speed. N/&, percent of equivalent design speed Equivalent ratio of stator-inlet total to rotor-exit static pressure, p/Ip4
0 Survey conditions Design work factor
" Rotor-exit static efficiency, 112-4
1
"L" .8 1.2 1.6 2.0 2.4 2 . 8 ~ 1 0 ~
I I
1.2 1.6 2.0 2.4 2.8 13. Equivalent mass-flow - speed parameter, ~wN16, kg. rads&
IC) Stator setting angle, 39. Id) Stator setting angle. 400. Figure 12. -Continued.

I I
Turbinewheel speed, N/&, percent of equivalent design speed "" Equivalent ratio of stator-inlet total to rotor-exit static pressure, pyp4 - - Rotor-exit static efficiency, 72-4
rn Survey conditions 0 Design work factor
l o r n
5 L .4 .8 1.2 1.6 20 2.4 2.8 3.2 3.6~10~ .4 .8 1.2 1.6 2.0 2.4 28 3.2 3.(
Equivalent mass-flow -speed parameter, ewW6, kg. radsec2
(e) Stator setting angle. 45O. If) Stator setting angle. SOO. Figure 12. -Concluded.
I

Turbine wheel speed. N/G, percent of equivalent design speed "- - Equivalent ratio of stator-inlet total to diffuser-exit static pressure, ppp6 " Overall static efficiency, 72-6
rn 0
Survey conditions Design w r k factor
5c
40
O I - L L 0 . 2 . 4 .6
I I .a 1.0 1.2 1 . 4 ~ 1 0 ~ .'2 .4 .6 .8
Equivalent mass-flow - speed parameter, ewN16. kg. rad& 1.0
1 I
! 1.4 1.6 1.8 2.[br103
la) Stator setting angle, 26O. (bl Stator setting angle, 300. Figure 13. - Turbine Performance maps based on diffuser-exit-collector static conditions.

0
I s
Turbine wheel speed, N/&, percent of equivalent design speed "" Equivalent ratio of stator-inlet total to diffuser-exit static pressure, ppIp6 - - Overall static efficiency, 72-6
Survey conditions 0 Design work factor
.15 1 I 1.2
-I
I
1.6 I 2.0 2. 0 + L
. 4 + .8 1.2 - 1 . 6 2.0 2.4 2.8 3.;
Equivalent mass-flow - speed parameter, ewNl6, kg. radlsec'
(c) Stator setting angle, 35". (d) Stator setting angle, 4$. Figure 13. -Continued.

Turbinewheelspeed. N/&, percent of equivalent design speed Equivalent ratio of stator-inlet total to diffuser-exit static pressure, pyp6 Overall static efficiency, Q - ~
" - - "
Survey conditions 0 Design work factor
W( I I I I I I I 1
! 1.5
0"" . 4 .8 1.2 1.6 2.0 2.4 2.8 3.2 3 . 6 ~ 1 0 ~ ""
(e) Stator setting angle. 45O.
"-____!-I" . 4 .8 1.2 1.6 2.0 2.4 2.8 3.2 3 . 6 ~ 1 0 ~
Equivalent mass-flow - speed parameter, ~wN16, kg. radfsec2
If) Stator setting angle. 58.
Figure 13. -Concluded.

“r
1.2- u “7
m Y
- 1.1- g
c
5 ! I 25 M 35 40 45 50
Stator set t ing angle, 0, deg
F i g u r e 14. - V a r i a t i o n of t u r b i n e e f f i c i e n c y w i t h s t a t o r se t t ing ang le a t des ign work fac to r of 1.172 and de- sign speed.
Turbine wheel
percent of equivalent
design speed a 0 7
Q a 0 0
0
0
M 40 50 60 70 80
100 90
110 130
10
5 0 . 5 n
L‘ -10
B 5 c
a - ._ F -20 3 E
1. 2 1.4 1.6 1.8 2.0 2.2 2.4 1.2 1.4 1.6 1.8 2.0 2.2 2.4 Ratio of stator-inlet total to rotor-exit static pressure, pyp4
-30
la) Mass flow. 0) Braking power.
Figure 15. - Braking position performance. Stator setting angle, 1070.
41

42

Ratio of ro to r - exit stat ic to stator- inlet
total pressure, PqlP?
" "_ 0.75 .70 - "_ .60 .50
.+. .56 (design)
"- "
Ratio of ro to r - exi t stat ic to s ta to r - in le t
total pressure, P4lPI
" " - 0.75 .70 .60 .50
"- ""
"
+ .56 (design)
1.0
-N L1 -8.
.8 L
VI VI 3
2 n .6 B 8
-
1- I-
c - "7 c Lu . 4 (a) Stator setting
8 angle, 26'. E 1.0 r
I (a) Stator setting
angle, 26'. (c) Stator sett ing
angle. 35O. -
(b) Stator setting angle. ?@. -
(c) Stator set t ing angle, 35O. - 8
L
1.0 " m
h .?.x .""" \'"" .", \
I
. 4 l"l 2 3 4 - 2 3 4
. 4 2 3 4 2 3 4 2 3 4
Stat ion
(el Stator sett ing angle. 45O.
2 3 4 Stat ion
(e) Stator setting angle. 45O.
( f ) Stator sett ing angle, 50'.
(dl Stator sett ing angle, 400. (d) Stator setting
angle, 400. I f ) Stator set t ing
angle. 500.
Figure 17. - V a r i a t i o n of hub-wal l s ta t ic Pressure through tu rb ine .
F igure 18. - V a r i a t i o n of t ip-wal l s ta t ic pressure through tu rb ine .
S t a t i o n
Hub
\O. 184
M e a n
\O. 184
'2 6.160 '3 7.483 '4 7.419
a2 42.6 a 3 69.5 a4 65.8 p3 42.7 p4 -73.4 i 2 -5.5 i 3 -11.8 d3 -14.1 d4 23.8
R s @ -0.089
0.695
0.551 O.
Radius , cm 7.237 8.288 8.446
Angle, deg
42. 3 77.8 69.5 47.7
-78.1 -5.8 14.2 0. 8
22.8 Stage reac t ion
0.122
(a) Stator set t ing angle, 26'.
Tip
0.394
0.619
8.313 9.093 9.528
50.2 75.4 41.7 27.9
-50.5 -22.3
9.3 0.5
-9.9
0.285
F i g u r e 19. - Veloc i ty d iagrams ca lcu lated f rom survey data a t des ign equiva lent speed and near-des ign to ta l -p ressure ra t io p>/pb.
44
I

Station:
2 -stator inlei
3-stator exit, rotor inlet
4- rotor exit
Hub
'2 6.160 '3 7.483 '4 7.419
a2 41.9 a3 67.6 04 46.1 p3 47. a P4 - 70.1 5 -9.9
-7.3 -11.2
d4 20.1
stg -0.203
Mean
\o. 2%
0.559
Radius, cm 7.237 a. 288 a. 446
42. a Angle, deg
72.1 34.6 47.8
-49.0 -11.4 14.2 -1.1 -a. 5
Stage reaction 0.039
(b) Stator setting angle, 300. Figure 19. -Continued.
Tip
\ 0.299
0.763 0.331
0.545 0.563
0.628
a. 313 9.093 9.528
47.4 68.1
26.0 -51.2 -24.4
9.3 -3.0 -9.3
3. a
0.237

Station
Hub Mean Tip
0.379
0.518 0.602 0.569
0.194 0.492 0.559 0.627
6.160 7.483 7.419
39.5 61.7 22.6 37.5
-66.8 -12.6 -17. a -11. a 16.3
-0.160
Radius, crn 7.237
8.445 Angle, deg
43.5 67.5
38.0 -49.5 -17.1
4.4 -0.6
a. 288
18.5
-a. 2 Stage reaction
0.195
(c) Stator setting angle. 35O.
Figure 19. - Continued.
a. 31 3 9.093 9.527
40.2 61.8 19.5 14.6
-54.7 -22.3 -3.7 -4.3 -5.7
0.339
46

Station
Hub
h . 4 6 1
0.881 0.552
0.565 0.294
0.49s
6.160 7.483 7.41 9
31.1 60.2 -0.3 34.1
-59.4 -9.4
-20.9 -7.9 8.0
0.023
Mean
0.563
Radius, cm 7.237 8.288 8.446
Angle, deg 44.1 62.2
27.9 2.1
-51.2 -22.7 -5.4 -0.9 -6.7
Stage reaction 0.329
(d) Stator setting angle, 4@. Figure 19. - Continued.
0.412
0.567
0.627
8.313 9.093 9.528
34.2 57.8 11.4 8.4
-51.2 -21.4 -9.6 -3.2 -9.4
0.394
47
I

Station:
'2 '3 '4
Rstg
Hub Mean Tip
0.632
0.495
6.160 1.483 1.419
45.6 54.0
-14.1 23.1
-51.3 -28.6 -30.6 -9.0 5.3
0.131
0.116 0.457
0.518
0.566
Radius, cm 1.231 8.288 8.446
Angle, deg 42.8 51.2
-13.0 17.7
-55.4 -26.5 -14.9 -0.9 -2.5
Stage reaction 0.483
(e) Stator setting angle, 49 .
Figure 19. - Continued.
\0.%3
0.165 0.416
0.631
8.31 3 9.093 9.528
20.0 54.1 0.1 1.1
-52.9 -12.9 -16.5 -1.8 -1.8
0.550
48

Sta t ion
Hub
0.527
0.494
Mean
\O. 533
‘2 6.160 ‘3 7.483 ‘4 7.419
a2 57.5 a3 55.0 04 -21.8 p 3 18.7 P4 12 ‘3 -33.6 d3 -2.6 d4 4.8
-57.1 -46.0
Rstg 0.488
Radius, c m 7.237 8.288 8.446
Angle, deg 33.6 52.4
-22.9 3.6
-56.4 -27.2 -27.7 -0.6 -1.9
Stage reaction 0.756
I f ) Stator setting angle. NO.
Figure 19. - Concluded.
0.630
8.313 9.093 9.528
21.9 51.3 -8.2
-11.8 -52.2 -1 9.5 -28.9
0.5 -8.9
0.827
49

a Di f fuser inner wa l l 0 Dif fuser outer wal l 0 Exit collector - station 6
1.00 r
(a) Stator setting angle, 26'; rotor-exit (b) Stator setting angle, 300; rotor-exit absolute flow angle, 64.9. absolute flow angle, 42.8'. - -- n
a 1 . o o r r ai L
y1 y1
3
m L n
I 0
.95rA-"=
L o .- - 0 m e 0
(d) Stator setting angle, @; rotor-exit absolute flow angle, 0.9.
r
'800 20 40 60 80 100 0 20 40 60 80 100 Diffuser surface length, percent
(e) Stator setting angle. 45'; rotor-exi t ( f ) Stator setting angle. 500; rotor-exit absolute flow angle, -13.4'. absolute flow angle, -15.6'.
Figure 20. -Var ia t ion o f wal l s ta t ic pressures through ex i t d i f fuser a t near-des ign Overa l l pressure rat io and design speed.
50

I S
Stator setting angle, VJ.
deg 0 30 0 35 D 40 A 45
Analytical results from ref. 8
I .2
I .3
I . 4 I
.5 Rotor-exit, absolute, critical velocity ratio, (VIV )
Figure 21. -Variation of diffuser total-pressure-loss coefficient with rotor-exit, absolute, c r 4
critical velocity ratio.
51

1. Report No. I . . ~
2. Government Accession No. " ___- -
3. Recipient's Catalog No.
NASA TM-78993
COLD-AIR PERFORMANCE OF FREE POWER TURBINE DESIGNED 112-KIMWATT AUTOMOTIVE GAS-TURBINE ENGINE II - EFFECTS OF VARIABLE STATOR-VANE-CHORD SETTING ON TURBINE PERFORMANCE
4. Title and Subtitle . .. - . . "
5. Report Date
.
~ . .. - . . .. 1 8. Performing Organization Report No. .. ~"
Kerry Lo McLallin and Milton G. Kofskey -~
9. Performing Organization Name and Address ~ -
I National Aeronautics and Space Administration Lewis Research Center Cleveland, Ohio 44135
- .. . . " ~"
t" ~ -
1 1 . Contract or Grant No
A w o r t and Period Covered "
12. Sponsoring Agency Name and Address
U.S. Department of Energy Division of Transportation Energy Conservation Washington -L- D :"- C . - 20545 . . . . . - ~~ ~~~ - - - -.
5. Supplementary Notes
Final report. Prepared under Interagency Agreement EC-77-A-31-1011.
~ " - ~ ~ _ _ _ i _ ~ _ "" _- __ I_~~"~ " "" - . .. . . ~
6. Abstract
The cold-air performance of an axial-flow power turbine with a variable stator designed for a 112-kW automotive gas-turbine engine was determined at speeds from 30 to 110 percent of design and at pressure ratios from 1.11 to 2.67. Performance is presented in terms of equivalent mass flow, torque, power, and efficiency for stator-vane-chord setting angles of 26O, 30°, 35' (design), 40°, 45O, and 50'. Turbine braking performance at a nominal stator setting angle of 107' is also presented. Turbine efficiency increased with increasing stator setting angle. A 10-point efficiency increase was obtained by opening the stator from the design setting angle of 35' to a setting angle of 45'.
~~ ~. . .
7. Key Words (Suggested by Author(s)) Turbine engines; Automotive engines; Axial- flow turbines; Single-stage turbines; Gas tur- bines; Variable stator
. . ~"
18. Distribution Statement . .
Unclassified - unlimited STAR Category 07 DOE Category UC-96
Unclassified I Unclassified " ~~ . I -
1 A04 - " .
' For sa le by the Nat ional Technlcal Informat ion Servlce, Spr lnef le ld. Vlrglnla 22161 NASA-Langley, 1979
...._ ... .,.. .,

National Aeronautics and Space Administration
Washington, D.C. 20546 Official Business
Penalty for Private Use, $300
POSTMASTER: If Undeliverable (Section 1 5 8 Postal Manual) Do Not Return