Embed Size (px)
Citation preview
Zambia
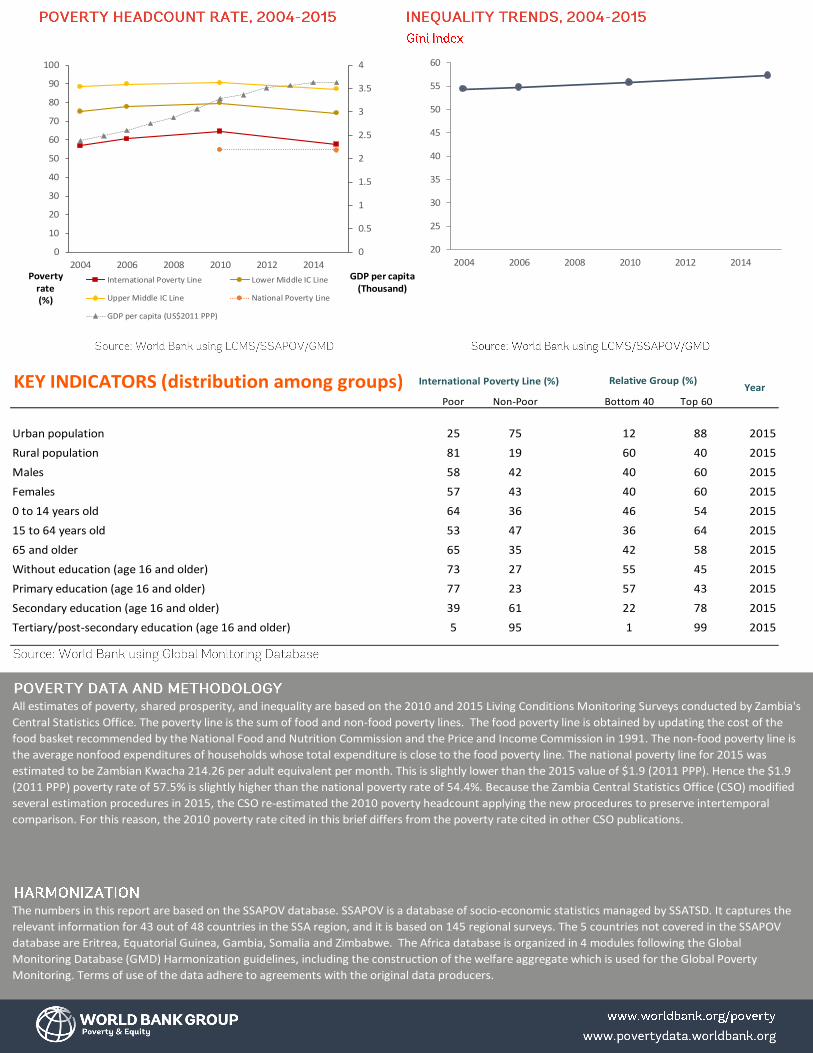
KEY INDICATORS (distribution among groups) International Poverty Line (%)Year
Poor Non-Poor Bottom 40 Top 60
Urban population 25 75 12 88 2015
Rural population 81 19 60 40 2015
Males 58 42 40 60 2015
Females 57 43 40 60 2015
0 to 14 years old 64 36 46 54 2015
15 to 64 years old 53 47 36 64 2015
65 and older 65 35 42 58 2015
Without education (age 16 and older) 73 27 55 45 2015
Primary education (age 16 and older) 77 23 57 43 2015
Secondary education (age 16 and older) 39 61 22 78 2015
Tertiary/post-secondary education (age 16 and older) 5 95 1 99 2015
The numbers in this report are based on the SSAPOV database. SSAPOV is a database of socio-economic statistics managed by SSATSD. It captures the
relevant information for 43 out of 48 countries in the SSA region, and it is based on 145 regional surveys. The 5 countries not covered in the SSAPOV
database are Eritrea, Equatorial Guinea, Gambia, Somalia and Zimbabwe. The Africa database is organized in 4 modules following the Global
Monitoring Database (GMD) Harmonization guidelines, including the construction of the welfare aggregate which is used for the Global Poverty
Monitoring. Terms of use of the data adhere to agreements with the original data producers.
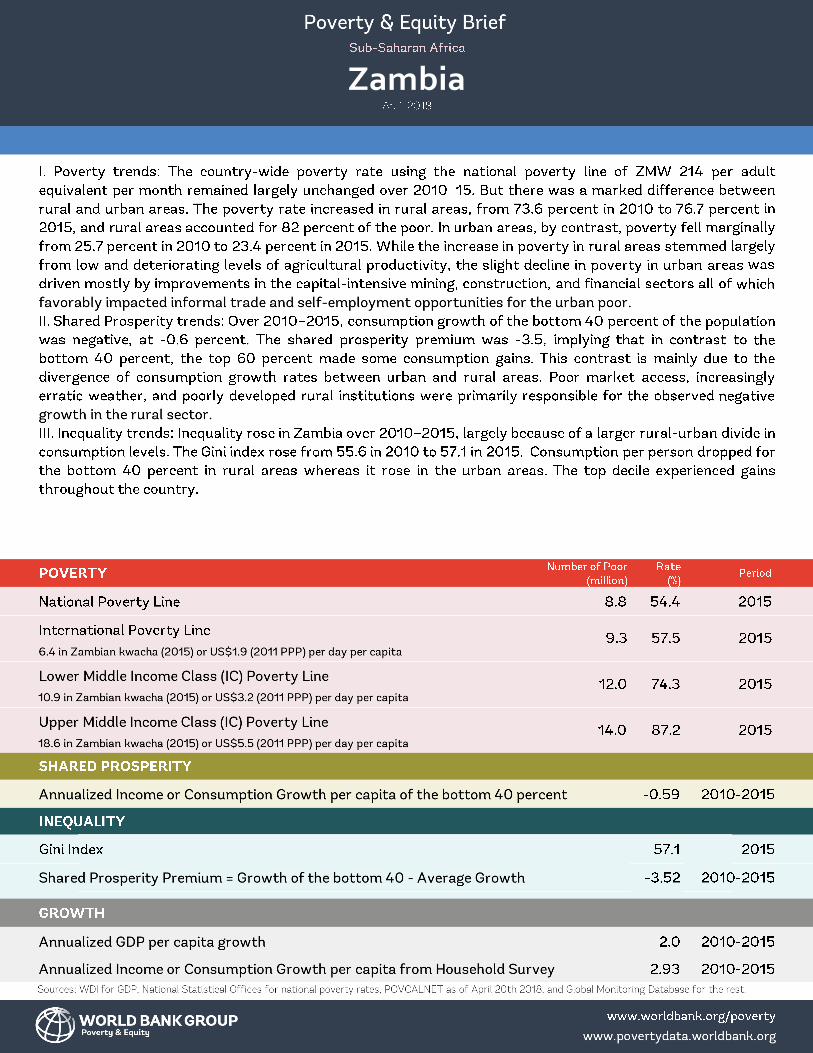
All estimates of poverty, shared prosperity, and inequality are based on the 2010 and 2015 Living Conditions Monitoring Surveys conducted by Zambia's
Central Statistics Office. The poverty line is the sum of food and non-food poverty lines. The food poverty line is obtained by updating the cost of the
food basket recommended by the National Food and Nutrition Commission and the Price and Income Commission in 1991. The non-food poverty line is
the average nonfood expenditures of households whose total expenditure is close to the food poverty line. The national poverty line for 2015 was
estimated to be Zambian Kwacha 214.26 per adult equivalent per month. This is slightly lower than the 2015 value of $1.9 (2011 PPP). Hence the $1.9
(2011 PPP) poverty rate of 57.5% is slightly higher than the national poverty rate of 54.4%. Because the Zambia Central Statistics Office (CSO) modified
several estimation procedures in 2015, the CSO re-estimated the 2010 poverty headcount applying the new procedures to preserve intertemporal
comparison. For this reason, the 2010 poverty rate cited in this brief differs from the poverty rate cited in other CSO publications.
Relative Group (%)
Poverty rate (%)
GDP per capita (Thousand)
20
25
30
35
40
45
50
55
60
2004 2006 2008 2010 2012 20140
0.5
1
1.5
2
2.5
3
3.5
4
0
10
20
30
40
50
60
70
80
90
100
2004 2006 2008 2010 2012 2014
International Poverty Line Lower Middle IC Line
Upper Middle IC Line National Poverty Line
GDP per capita (US$2011 PPP)