Embed Size (px)
Citation preview

OctOber 2013 Issue 2
ZAMBIA'S JOBS CHALLENGE REALITIES ON THE GROUND
Pub
lic D
iscl
osur
e A
utho
rized
Pub
lic D
iscl
osur
e A
utho
rized
Pub
lic D
iscl
osur
e A
utho
rized
Pub
lic D
iscl
osur
e A
utho
rized

OctOber 2013 Issue 2
ZAMBIA ECONOMIC BRIEF
ZAMBIA'S JOBS CHALLENGE REALITIES ON THE GROUND
• THE WORLD BANK

© 2013 The International Bank for Reconstruction and Development/THE WORLD BANK1818 H Street NWWashington, DC 20433USA
All rights reserved
This report was prepared by the staff of the Africa Region Poverty Reduction and Economic Management. The findings, interpretations, and conclusions expressed herein are those of the authors and do not necessarily reflect the views of the World Bank’s Board of Executive Direc-tors or the countries they represent.
The report was designed, edited, and typeset by Communications Development Incorporated,Washington, DC.
Cover: Musa MwamutandaPhoto: Jumbe Ngoma

iii
Foreword vAcknowledgments vi
Executive summary vii
Section 1 Recent economic developments 1Zambia shares robust growth and capital inflows with other Sub-Saharan economies 1Zambia’s economy: Recent concerns about economic management 3Selected financial sector developments 6Medium-term outlook: Good prospects but considerable risks 9
Section 2 Jobs challenge: Realities on the ground 13Improving earnings from work is an important development priority 13Labor force is growing fast and will stay young for a long time 14Current employment patterns are similar to other agrarian economies 15Employment profile does not appear to be changing fast enough 17Unemployment is mainly an urban youth issue 18A large number of working Zambians are poor and concentrated in farming 19Some youth issues deserve special attention 19Summary of findings and policy implications 26
Annex A Economic data 29Annex B Basic definitions of labor force and employment 33Annex C Labor force participation, employment, and unemployment 34Annex D Determinants of wages in wage employment sector 40
Notes 42References 45
Boxes1.1 Movement in world metal and copper prices 21.2 Interest rate caps in South Africa 71.3 Evolution of nontraditional exports 102.1 What do youth want? A qualitative study of youth employment and unemployment
in Zambia 132.2 Waiting to get into a university 192.3 Jobs in agriculture and poverty reduction 20
Contents

Z a m b i a E c o n o m i c b r i E f — J o b s c h a l l E n g E : r E a l i t i E s o n t h E g r o u n d
iv
2.4 What jobs do youth want to be in? 212.5 Getting a job is about who you know: “Wako ni wako” culture 222.6 Skills matter for increasing agricultural productivity 232.7 Targeting girls can pay off 28
Figures1.1 Real GDP growth and prospects, 2001–15 11.2 Net capital inflows to Sub-Saharan Africa and Zambia, 2008–13 21.3 Foreign direct investment inflows by sector, 2011 31.4 Copper production, 2005–13 41.5 Net savings and genuine savings, 1997–2011 51.6 Stock of external debt since the Multilateral Debt Relief Initiative, 2006–13 51.7 Ex-post lending and deposit rates, 2008–12 71.8 Interest rate spread and net interest margin, 2002–11 81.9 Decomposition of bank interest rate spreads, 2008–12 81.10 Current account balance and international reserves, 2008–13 112.1 Zambia’s population is young, similar to other Sub-Saharan countries 142.2 Zambia’s population is estimated to almost double by 2030, even with declining levels
in fertility 142.3 Zambia’s population will remain young in the coming decades 152.4 Overview of employment in 2010 (thousands) 152.5 Wage employment grows with per capita income 162.6 Public sector employs more highly educated people than private sector 172.7 Changes in the economy’s structure from 1994 to 2012 182.8 Unemployment rate by age for rural and urban areas 182.9 Girls, urban youth, and youth with senior secondary education are more likely to be
inactive 192.10 Distribution of working poor and nonpoor by employment category 202.11 Transitions into employment differ in rural and urban areas 212.12 Employment outcomes for youth depend on opportunities 232.13 More than half of youth have primary education or less 242.14 School enrollment by wealth 242.15 Zambian grade 6 students underperform in literacy and mathematics compared with
other southern and eastern African countries 25
Tables1.1 Utilization of the sovereign bond proceeds 61.2 GDP growth projections, by main sectors, 2013–15 11A.1 GDP growth, by main sectors, 2004–12 29A.2 Central government finances, 2008–13 30A.3 Selected balance of payment indicators, 2008–13 31A.4 Zambia’s top 10 trading partners in 2011 32C.1 Labor force participation, employment, and unemployment,
by gender, location, age, and education level 34C.2 Employment by economic sector 37C.3 Labor force participation, employment, and unemployment, by province and stratum 38C.4 Economic activity of Zambians ages 15–35 and 36–64 39

v
I am pleased to share this Zambia Economic Brief with a focus section on jobs. This sec-ond Brief is part of a series of short economic updates produced twice a year by the World Bank. Each Brief includes two sections: the Bank’s assessment of recent economic devel-opments and outlook in the short to medium term, and its analysis on a specific develop-ment topic or theme.
This Brief comes at a time when Zambia is continuing to experience robust economic growth but economic management is becom-ing more challenging. The execution of the 2013 budget highlights some of these chal-lenges: the capacity to use costly foreign debt efficiently and keep personnel costs low so that essential spending on health and edu-cation services for the poor is not crowded out. The government rightly understands the importance of maintaining macroeconomic stability that has served the country well in the past decade.
The jobs section of the Brief shines a light on what lies underneath Zambia’s lower middle- income status. We find that most Zambians are employed, working on farms, in nonfarm home businesses, and in wage jobs. Yet a large number of them remain mired in poverty because their earnings from work are low. So, while creating formal private sector jobs is a priority, an equally important development priority is to improve the living standards and earnings of working Zambians by boosting their productivity in agriculture, nonfarm self-employment, and formal employment. And who and where are the unemployed? They are mostly youth
in urban areas, from relatively better off families who can afford to wait for jobs they desire. Therefore unemployment per se is a lesser challenge in Zambia.
We juxtapose these facts against the sce-nario where Zambia’s labor force is growing fast, currently at more than 130,000 new entrants a year. But formal jobs are grow-ing very slowly. Meanwhile, the ranks of the working poor continue to swell as youth from poor families and rural areas keep getting absorbed in the jobs their parents were in—largely farming and home businesses. These youth do not have the educational qualifica-tions to improve their choices. This situation points toward the need to improve access to good quality basic education, which will go a long way in not only supporting the country’s growth but also improving earnings from work, particularly for the working poor.
We expect these Briefs to support evi-dence-based policy debate in the country. In that spirit the Brief has generally stayed away from making specific policy prescrip-tions. We hope that the findings of the Brief will generate a healthy debate in the coun-try on policies and interventions needed to meet Zambia’s jobs challenge, which by all accounts is rather huge.
Kundhavi KadiresanCountry Director for Zambia
The World Bank
Foreword

vi
The second Zambia Economic Brief has been prepared by the Poverty Reduction and Eco-nomic Management Unit of the World Bank Country Office in Lusaka. The team was led by Praveen Kumar and included Gun-hild Berg, Allen Dennis, Indira Ekanayake, Asumani Guloba, Edna Kabala, Julia Philipp, Sangeeta Raja, Dena Ringold, and Katia Her-rera Sosa. Dena Ringold led the subteam that worked on the youth employment and skills issues. The Zambia Institute for Policy Analy-sis and Research carried out a qualitative study on youth employment. Valuable com-ments were received at various stages from
Kate Bridges, Louise Fox, Nalini Kumar, Samuel Maimbo, Dino Merotto, and Jumbe Ngoma. Peer reviewers were Kathleen Beegle and Deon Filmer. Kate Bridges, Victoria Cabral, Martha Mando, and Jumbe Ngoma organized dissemination events. Kutemba Kambole provided administrative support to the team. Kundhavi Kadiresan, Country Director, Zambia, and John Panzer, Sector Manager, AFTP1 unit, provided overall guid-ance and advice.
The report was edited and laid out by a team at Communications Development Incorporated, led by Bruce Ross-Larson.
Acknowledgments

vii
Recent economic developmentsZambia shares its robust economic growth and capital inflows in the past few years with other Sub-Saharan countries, growth sup-ported by high commodity prices that while declining are still at historical high levels. High commodity prices have induced large foreign direct investment (FDI) flows, mainly in extractive industries but also in services sector, supporting growth. Zambia’s min-ing sector has benefited from FDI, receiving almost $1 billion in 2011 alone.
In 2013 Zambia’s real GDP is projected to grow 6.0 percent, much lower than the initially projected 7.8 percent. Despite a rebound in copper output and large increases in public spending, contracting agriculture output (in at least two major corps: maize and cotton) of about 7.4 percent will bring down growth in 2013. The final growth outcome will also depend on how the much larger-than-planned fiscal deficit is financed during the rest of 2013.
The 2013 budget has come under stress due to several unplanned expenditures and a shortfall in revenue collection. Additional expenditures include public sector wage awards (0.8 percent of GDP), accumulated fuel supply losses not initially budgeted for (1.0 percent of GDP), and expected higher spending on the Farm Input Supply Pro-gram (0.4 percent of GDP). In addition, Food Reserve Agency loans guaranteed by the gov-ernment in 2012 (0.8 percent of GDP) are due to be repaid. Preliminary data on domestic tax collection for the first half of 2013 suggests an estimated shortfall of 1.0 percent of GDP.
A large gap has emerged between avail-able resources and likely spending in 2013. The government is responding with a full range of adjustments, including cutting recurrent spending (such as on travel and motor vehicles), cutting capital projects, and stepping up revenue collection. Even after these efforts the fiscal deficit is expected to be higher than the budgeted 4.5 percent of GDP. The government is exploring addi-tional external and domestic borrowing to close the gap.
The government has raised fuel prices and reduced maize and fertilizer subsidies, but the medium-term fiscal impact of these initiatives is uncertain. These reforms aimed to create space for expanding better targeted spend-ing programs. But the fiscal benefits of a fuel price increase could erode if retail prices are not periodically adjusted to reflect shifts in the world price of oil and in the kwacha–dol-lar exchange rate. Similarly, fiscal benefits of the reduction in maize subsidies are uncer-tain, because the government has not decided on the quantity and price of maize to be pur-chased by the Food Reserve Agency.
External debt grew rapidly after 2006, but its use and management need strengthening. The stock of external debt rose from $1.1 bil-lion in 2007 to $3.4 billion in 2012 (a 192 per-cent nominal increase). The composition of external debt is also changing. Zambia’s attainment of lower middle-income status has reduced access to funding on highly con-cessional terms, even as its financial choices have expanded. This has led to an increase in nonconcessional borrowing since 2011.
Executive summary

Z a m b i a E c o n o m i c b r i E f — J o b s c h a l l E n g E : r E a l i t i E s o n t h E g r o u n d
viii
One year after it was issued, most of the proceeds of the $750 million sovereign bond from 2012 are yet to be used. All the pro-ceeds were allocated to projects in the 2012 and 2013 budgets, but most of these projects have not taken off. Apart from using bor-rowed money on projects with high rates of return, the government needs to improve its public financial management and debt man-agement to deal with the risks of fast growing external debt.
Since 2012 began, the Bank of Zambia has instituted several important policy changes affecting the financial sector. One such change is the introduction of interest rate caps for both commercial banks and micro-finance institutions to control high lending rates in Zambia’s credit market. The interest rate caps have greatly affected the business strategies of commercial banks and micro-finance institutions. Based on other coun-tries’ experiences, interest rate caps would likely curtail lending to small and medium enterprises, especially for unsecured loans.
Effective lending rates had been declin-ing since 2009, while deposit rates remained unchanged. As a result, interest rate spreads—the difference between effective lending and deposit rates—fell to 10.3 per-cent in 2012 from 15.0 percent in 2009. The decline in interest rate spreads is explained largely by the decline in overhead costs. Profit margins in the banking system remain high. Interest rate spreads can be reduced further by increasing efficiency (to reduce overheads) and competition (to put pressure on profit margins).
Zambia’s gross international reserves declined sharply in 2013, from $3.0 billion in December 2012 to $2.5 billion (2.8 months of prospective import cover) in April 2013. The outflows were driven by mainly the Bank of Zambia’s direct support for the oil import bill and debt-servicing obligations. But a stop to Bank of Zambia direct financing of the oil import bill and the tightened monetary pol-icy conditions have halted a further decline in reserves.
Medium-term prospects for Zambia’s eco-nomic growth remain good but are subject to evenly balanced risks emanating from global uncertainties and macroeconomic management. GDP growth is expected to average more than 7 percent over 2013–15.
Underpinning the projected medium-term growth are favorable external and domestic developments. China’s strengthening econ-omy (Zambia’s largest trading partner) bodes well for Zambia’s metal trade. The strong foreign direct investment flows to mining in recent years are expected to continue boost-ing growth.
Zambia’s expected robust growth not-withstanding, serious external risks remain. Especially important among these risks are fast-declining copper prices. The economy can absorb moderate declines in copper prices, but steeper declines will hurt the country. Indeed, planned mining invest-ments could be delayed or even canceled—slowing construct ion and reducing government revenues—with consequences for infrastructure investment and potentially leading to macroinstability as the kwacha depreciates (or reserves are depleted).
In addition, Zambia’s economy has seen far too many unexpected policy changes in recent years. Persistent and even esca-lating perceptions of an uncertain policy environment could weaken investment, thereby reducing GDP growth. Further, the risks of fiscal slips could undermine mac-roeconomic stability and undo some of the country’s recent hard-earned gains. Fiscal policy remains on a sustainable trajectory, but escalating recurrent and off-budget expenses must be reined in. Major global credit rating agencies have a negative out-look for Zambia.
Jobs challenge and realities on the groundSection 2 develops the following messages, drawing mainly on the Living Conditions Monitoring Survey data and using other research including cross-country findings of the World Development Report 2013 (World Bank 2012b):• Zambia’s population and labor force is
young and growing fast. The population is projected to almost double by 2030 and hit 140 million by 2100. In 2010 about 130,000 young workers were added to the labor force; in 2030 about 300,000 will be added.
• The current structure of the economy and sources of growth are such that for-mal wage jobs are being created slowly. This pace is nowhere close to being able to

ix
absorb the new cohorts of youth that are entering the labor market.
• A large number of Zambians are already working because they cannot afford to not work. Therefore unemployment per se is less of a developmental concern. But a large number of working Zambians are poor; actually working adults are more likely to be poor than the nonworking. The working poor are concentrated mostly in farming and to a lesser extent in nonfarm self-employment. It is a development prior-ity to improve the earnings of the working poor by improving their productivity.
• Apart from agriculture, nonfarm self-employment in the form of home busi-nesses is an important source of jobs, much larger than the small and medium enterprises.
• Zambia’s public sector is relatively large. Statistical analysis shows that public sec-tor wages, particularly in parastatals, are higher than in the private sector for similar education, location, gender, and experience.
• Enrollment ratios in basic education have grown, but schooling is not translating into skills. Basic education is the founda-tion for skill building and hence improved productivity, but its quality is poor. The poor, rural youth, and girls are particu-larly disadvantaged in terms of access to good quality basic education.The above findings should shape Zambia’s
efforts to tackle the jobs challenge. Sustained attention should be given to achieving the following objectives: accelerating the pace of growth of formal jobs in the private sector, improving smallholder productivity in agri-culture, providing a supportive environment for nonfarm home businesses, and improv-ing access to good quality basic education.
Youth, particularly the urban unem-ployed, will benefit from overall efforts to improve the broad environment for jobs. But the poor youth, particularly girls in rural areas, may not benefit much because they are unable to transcend the barriers of pov-erty, gender, and location. Disadvantaged youth would need to be better equipped to seize opportunities created by improving the jobs environment. Fundamentally, this involves providing equitable opportunities for improving their basic skills.
These objectives require multifaceted and long-term policies and government interven-tions. This Brief does not provide recom-mendations for achieving these objectives. However, to stimulate debate some commen-tary is included on current policies and pol-icy directions suggested.
Creating formal jobs in the private sector is rightly accorded top priority in govern-ment policy and strategy documents. The government’s general approach is to provide an enabling environment for the private sec-tor and address constraints to growth. This is a sound approach. But as a resource-rich country Zambia faces pressures on com-petitiveness due to an abundance of foreign exchange. Zambia’s urban centers are not yet dynamic centers for creating wage jobs in the private sector unlike the experience of suc-cessful countries across the developing world. As large consumption agglomerates Zambia’s urban centers attract migrant labor from rural areas, but the migrants get absorbed in largely petty commerce activities. This Brief suggests an approach to create conditions for light manufacturing to grow.
For wage employment, understanding the technical and vocational education sector is a priority for future skills development. While Zambia is looking to expand technical and vocational education, and such expansion is often seen as the solution to high youth unemployment, little is known about the cur-rent system, its quality, and the employment trajectories of its graduates. International experience underscores the importance of the governance of technical and vocational training, and close partnerships with private sector employers.
On smallholder productivity, maize subsi-dies that are the cornerstone of government’s agricultural policy and spending do not ben-efit smallholders enough and are also subject to leakages. Public sector investments would be important to driving agricultural growth and intensifying smallholder agriculture. Productivity growth in smallholder agricul-ture would also require attention to access to credit so that farmers can mechanize and apply appropriate amount of fertilizers. Farm blocks are also given a good deal of attention by the government. Experience with farm blocks is limited so far and a careful ex-ante economic analysis of farm blocks is suggested.

Z a m b i a E c o n o m i c b r i E f — J o b s c h a l l E n g E : r E a l i t i E s o n t h E g r o u n d
x
Home businesses and microenterprises are generally grouped together as informal enter-prises. And informality, generally associated with lower productivity, has been a consider-able policy concern in Zambia. The general policy approach toward informal enterprises is to bring them under regulation. Given their importance to employment and job creation, home businesses and microenterprises need greater support from the government. Initia-tives that address the most important con-straints to creating a business such as access to finance and space to work could be cost-effective. More analysis is needed to under-stand these constraints in Zambia. There is also a need to understand how youth learn skills on the job and what other interventions can increase the skills of youth working in agriculture and self-employment.
Improving foundational skills in basic education and expanding access to second-ary education and skills training, especially
for the poor, would address a major con-straint to improvements in self-employment and productivity in agriculture, small enter-prises, and formal sector employment. But how learning outcomes can be improved needs to be understood so that school-ing translates into skills. Further analysis is needed to understand whether Zambia’s poor performance in learning assessments is due to inputs (lack of qualified teachers, overcrowded classrooms), issues with service delivery (incentives for teachers to provide quality education), or other factors.
There is a need to address the gaps in access to basic education and prevent drop-outs through targeted programs for children at risk of not starting or finishing school. While boosting skills is a longer term agenda, targeted interventions to support the transi-tions of girls, the poor, and inactive youth into jobs can improve opportunities for more marginalized groups over the shorter term.

1
SECTioN 1
Recent economic developments
Zambia shares robust growth and capital inflows with other Sub-Saharan economiesDespite weakness in the global economy, growth in Sub-Saharan Africa remains robust (figure 1.1), supported by resilient domestic demand and commodity prices that, while declining, are still historically high (box 1.1). In 2012 the region’s growth was estimated at 4.4 percent. Excluding South Africa, its larg-est economy, the region’s economies grew a robust 5.4 percent—more than the develop-ing country average of 5.0 percent. About a quarter of Sub-Saharan countries (includ-ing Zambia) grew at least 7 percent, and several are among the world’s fastest grow-ing. Medium-term growth prospects remain strong and should be supported by a pick-up in the global economy, high commodity prices (expected to stay above average), and investment in the productive capacity of the
region’s economies. Overall, Sub-Saharan Africa is forecast to grow an average of more than 5 percent a year over 2013–15: 4.9 per-cent in 2013 and gradually strengthening to 5.4 percent by 2015 (World Bank 2013b).
Increased investment f lows have sup-ported Sub-Saharan Africa’s—including Zambia’s—growth performance, with investment-to-GDP ratios increasing an aver-age of 0.5 percentage points a year over the past decade. In 2012 net private capital flows to the region reached $58.8 billion, with for-eign direct investment (FDI) accounting for $32.1 billion; they are projected to rise to a record $67.5 billion in 2013 (figure 1.2). The region’s resilient FDI flows in 2012 reflect still-high commodity prices. In that year sev-eral mines were expanded, and new ones were built. Prospecting yielded major gas dis-coveries along Africa’s east coast. New, com-mercially viable oil wells were drilled in West
Figure Real GDP growth and prospects, 2001–15
1.1
–2
0
2
4
6
8
2015(forecast)
2014(forecast)
2013(forecast)
201220112010200920082007200620052004200320022001
Rea
l GD
P gr
owth
, per
cent
age
chan
ge
Developing countries (excluding China)Sub-Saharan Africa (excluding South Africa) Zambia
Sub-Saharan Africa
Source: World Bank DEC Prospects Group.

Z a m b i a E c o n o m i c b r i E f — J o b s c h a l l E n g E : r E a l i t i E s o n t h E g r o u n d
2
increased investment
flows have supported
Sub-Saharan Africa’s—
including Zambia’s—
growth performance
Box Movement in world metal and copper prices
1.1 Despite the recent moderate pick-up in the global economy, prices of most industrial commodities have fallen. Metal prices, measured by the World Bank Metal Price Index, have declined 25 percent from post-crisis highs and 7 percent since February 2013. Prices of copper—Zambia’s main export—declined 14 percent from mid-February 2013 to mid-June and 27.5 percent from the post-crisis peak in 2011. From a historical perspective copper prices remain high—some 315 percent higher in nominal terms than they were a decade ago (box figure).
Box figure Global copper prices and World Bank Metal Price index, January 1995–May 2013
0
50
100
150
200
250
20132012201120102009200820072006200520042003200220012000199919981997199619950
2,500
5,000
7,500
10,000
12,500
$ pe
r m
etri
c to
n
Real m
etal price index (2005 = 100)
Copper World Bank Metal Price Index
The price weakness reflects both moderate growth in demand and a strong supply response, results of increased investments over the past few years, induced by high prices. In metal markets new projects in Latin America (Chile, Peru), Africa (Zambia, Democratic Republic of Congo), and Asia (China, Mongolia) have placed substantial downward pressure on metal prices, even as sales have strengthened in line with the pick-up in output. Most base metals are in excess supply for 2013, which is likely to exert further downward pressure. Copper is in good supply, as evidenced by large stocks at the London Metal Exchange and Shanghai Metal Exchange (4 percent of annual consumption for copper). Combined stocks of copper at these exchanges increased 52 percent in the first three months of the year.
Financial and real assets like commodities have been affected by interest rate fluctuations as well, induced by expansionary monetary policy. Indeed, part of the run-up in metal prices over the past several years can be attributed to very low global interest rates, which have reduced the cost of borrowing money in order to hold large inventories of industrial metals. This metals “carry trade” contributed to a remarkable increase in global inventories, even as metal prices hit record highs (rising inventories are normally associated with weak demand and falling prices). A normalization of interest rates, as the quantitative easing in the United States tapers off, could change the economics of this carry trade, resulting in a steep decline in metal prices. Recent U.S. Federal Reserve statements that led to a sell-off in global financial markets in May and June also contributed to the price decline.
Source: World Bank DEC Prospects Group.
Figure Net capital inflows to Sub-Saharan Africa and Zambia, 2008–13
1.2
0
50
100
150
2013(forecast)
2012(estimate)
2011201020092008
$ bi
llion
s $ billions
Zambia
Other capital in�owsNet foreign direct investment in�ows
Sub-Saharan AfricaNet foreign direct investment in�ows
Other capital in�ows
0.0
0.5
1.0
1.5
Source: Authors’ computations and World Bank DEC Prospects Group.

3
in 2013 real GDP is
projected to grow
6.0 percent, much
lower than the initially
projected 7.8 percent
and East Africa, and numerous countries dis-covered new mineral deposits.
Although extractives dominate in the value of FDI, the services sector, notably in infrastructure-related projects in construc-tion, transportation, electricity, telecommu-nications, and water, has been expanding. In addition, some larger economies with a grow-ing middle class, such as Ghana, Kenya, Nige-ria, and South Africa, are attracting more FDI flows to their rapidly expanding con-sumer sector (retail and consumer banking).
Capital inflows to Zambia have remained resilient, with net FDI and portfolio invest-ments growing steadily over 2009–12, from $305 million to an estimated $1.1 billion. Growth was especially strong in the sec-ond half of 2012. FDI inflows continue to be directed mainly at mining, with finan-cial institutions, wholesale trade, real estate activities, and communications also contrib-uting (figure 1.3). Australia, Canada, and the United Kingdom contribute the most FDI inflows to Zambia, consistent with inves-tor composition in mining (Bank of Zambia 2012).
Zambia’s economy: Recent concerns about economic management
Copper production continues to growZambia’s economy is poised to grow slower in 2013 than earlier projected. In 2013 real GDP is projected to grow 6.0 percent, much lower than the initially projected 7.8 percent. Despite a rebound in copper output and strong growth in the public sector, contrac-tion in agricultural output by about 7.4 per-cent will bring growth down in 2013 (annex
table A.1 and see table 1.2 below). Recent indications signal a contraction in two major crops—maize, at –11 percent, and cotton, at –48 percent (current market prices)—in the 2012/13 season. The contraction in maize output is due to erratic rain patterns and an attack of army worms.
Production indicators point toward a recovery in copper output, as the rebound in production during the fourth quarter of 2012 spilled into the new year (figure 1.4). Prelimi-nary data for the first half of 2013 indicate increasing capacity in existing mines. At the same time, new mines (Luashya-Muliashi and Konoko) have opened recently, boosting production. This trend will likely continue as the new mines hit their production potential.
The high and growing mining output is not fully reflected in the national accounts estimates of growth and nominal output. National accounts estimates use 1994 as the base year. But the structure of the economy has since changed considerably, with mining having a much larger share. A planned rebas-ing of national accounts estimates could sub-stantially increase the share of mining value added and raise GDP at current prices.
Fiscal management is a cause for concernThe 2013 budget has come under stress due to several unplanned expenditures and a shortfall in revenue collection. Preliminary data (based on January–July 2013 budget outturn) point to additional expenditure arising from accumulated fuel supply losses not initially budgeted for (1 percent of GDP), public sector wage awards (0.8 percent of GDP),1 and expected higher spending on the Farm Input Supply Program (0.4 percent).2
Figure Foreign direct investment inflows by sector, 2011
1.3
–0.25 0.00 0.25 0.50 0.75 1.00
Mining and quarryingDeposit-taking corporations
Wholesale and retail tradeReal estate activities
Information and communicationsAgriculture, forestry, and �shing
ConstructionAccommodation and foodElectricity, gas, and steam
Finance and insuranceManufacturing
Other
$ billions
Source: Bank of Zambia 2012.

Z a m b i a E c o n o m i c b r i E f — J o b s c h a l l E n g E : r E a l i t i E s o n t h E g r o u n d
4
The fiscal deficit is
expected to be higher
than budgetedIn addition, Food Reserve Agency loans guaranteed by the government in 2012 (0.8 percent of GDP) are due to be repaid. Preliminary data on domestic tax collection up to July 2013 suggest an expected shortfall of 1 percent of GDP for the year. Except for the pay-as-you-earn tax and value-added tax on imports, major revenue bases are likely to underperform. Particularly, mining rev-enue (company income tax) is projected to be 0.9 percent of GDP lower than initial esti-mates (annex table A.2).
Consequently, a large gap has emerged between available resources and likely spending in 2013. The government is responding with a full range of adjustments and measures, including cutting recurrent spending (such as on travel and motor vehi-cles), cutting capital spending, and step-ping up revenue collection. To close the gap, the government will cut the budget for the second half of 2013 by 20 percent for the priority sectors (education, health, agri-culture, water and sanitation, and defense and security) and 50 percent for other sec-tors. The capital budget is projected to drop to 5.7 percent of GDP from the budgeted 7.2 percent. In addition, the Food Reserve Agency debt will be rolled over as an appro-priate repayment schedule is negotiated. Even after these efforts the fiscal deficit is expected to be higher than budgeted. The government is exploring additional exter-nal and domestic borrowing to close the deficit.
The government has raised fuel prices and reduced maize and fertilizer subsi-dies, but the medium-term fiscal impacts of these initiatives are uncertain. These
reforms aimed to create space for expand-ing better targeted spending programs. Before the fuel prices were raised, there was an implicit subsidy equal to the difference between the pump price and the fuel cost.3 The government paid more than 754 billion kwacha ($147 million) in 2012 toward the fuel subsidy (0.7 percent of GDP) and has so far paid 1.22 billion kwacha ($227 mil-lion) in 2013 to clear the outstanding bill. And the removal of the maize subsidy could reduce the Food Reserve Agency budget overrun, which has averaged 1.1 percent of GDP since 2010. But the fiscal benefits of a fuel price increase could erode quickly if no mechanism is put in place to periodi-cally adjust retail prices to reflect changes in the world price of oil and in the dol-lar–kwacha exchange rate. Similarly, fiscal benefits of the reduction in maize subsidies are uncertain, because the government has not decided on the quantity and price of maize to be purchased by the Food Reserve Agency.
Copper windfall has not contributed much to building human capitalThe large public sector wage award of 2013 will likely cast a long shadow, cutting into public investment in human and physical capital. Indeed, while Zambia’s mining rev-enues have grown, they have gone mostly to consumption instead of human capital investment. After adjusting for net national savings, human capital investment has clearly not kept pace with resource depletion (fig-ure 1.5).4 The gap between genuine and net national savings has grown large in recent years, compared with that in 2004.
Figure Copper production, 2005–13
1.4
0
50
100
150
200
250
201320122011201020092008200720062005
Mill
ion
met
ric
tons $ per m
etric ton
Copper production Global copper price
0
2,000
4,000
6,000
8,000
10,000
Source: Bank of Zambia; authors’ computations.

5
While public
investment has been
ramped up, it is
yet to be matched
with the selection
of high-return
projects and efficient
implementation
External debt has grown rapidly but its use and management need strengtheningExternal debt has been growing rapidly since 2006, when the Multilateral Debt Relief Ini-tiative substantially reduced Zambia’s debt (figure 1.6). The stock of external debt rose from $1.1 billion in 2007 to $3.4 billion in 2012 (a 192 percent nominal increase). The composition of external debt is also chang-ing. Zambia’s attainment of lower middle-income status has reduced access to funding on highly concessional terms, even as its financial choices have expanded.5 This has led to an increase in nonconcessional bor-rowing since 2011. Between June 2011 and May 2013 the government borrowed $1.61 billion on nonconcessional terms—including a $750 million sovereign bond in September 2012.
Most of the proceeds of the $750 million sovereign bond have yet to be used (table 1.1). While the proceeds were allocated to proj-ects in the 2012 and 2013 budgets, several of
these projects have been delayed or are yet to take off. There is a need to have economi-cally viable and “ready to go and implement” projects before deciding on how much and when to borrow, particularly on nonconces-sional terms.
Zambia’s capacity for project appraisal, public financial management (PFM), and debt management requires further strength-ening. As noted by the first Economic Brief (World Bank 2012c), while public investment has been ramped up, it is yet to be matched with the selection of high-return projects and efficient implementation. Since the early 2000s Zambia has embarked on a series of PFM reforms, yet the current systems face several weaknesses. Several reports have indi-cated that PFM systems require strengthen-ing—including budget processes (planning, allocation, execution, monitoring, report-ing), public investment management, cash management, public procurement, debt management, and internal audit and control
Figure Stock of external debt since the Multilateral Debt Relief initiative, 2006–13
1.6
0
1
2
3
4
5
2013(projected)
2012201120102009200820072006
$ bi
llion
s
Percent of GD
P
Stock of external debt ($ billions) Stock of external debt (percent of GDP)
0
5
10
15
20
25
Source: Zambian authorities, IMF, and World Bank estimates.
Figure Net savings and genuine savings, 1997–2011
1.5
Perc
ent
of G
NI
–20
–10
0
10
20
30
201120102009200820072006200520042003200220012000199919981997
Net savings Genuine savings
Source: Authors’ computations based on World Bank (2012a).

Z a m b i a E c o n o m i c b r i E f — J o b s c h a l l E n g E : r E a l i t i E s o n t h E g r o u n d
6
The interest rate caps
have greatly affected
the business strategies
of commercial banks
and microfinance
institutions
(World Bank 2010, 2013c; Government of Zambia 2008, 2012a, 2013). The Ministry of Finance has formulated a five-year strategic plan to address these areas.
With increased access to nonconcessional borrowing, a prudent debt management approach is critical for managing the chang-ing composition of public debt. With the public and publicly guaranteed debt stock at 28 percent of GDP in 2012, Zambia’s pub-lic debt dynamics are sustainable, given the current size and evolution of the domestic debt stock. But the growing external noncon-cessional debt portfolio implies higher risk exposure—through currency, liquidity, and exchange rate risks. Zambia should give pri-ority to developing a debt-management strat-egy with a strong focus on managing the risk exposure of potential variations in the cost of debt servicing and its impact on the budget and the size of the debt. It should also give priority to identifying how cost and risk vary with the changes in the composition of the debt.
Selected financial sector developmentsSince 2012 began, the Bank of Zambia has instituted several important policy changes affecting the financial sector. These changes include revising minimum capital require-ments for banks, rebasing the national cur-rency, banning the use of foreign currency for domestic transactions through statutory instrument (SI) 33, and setting interest rate caps on loans. SI 55 has recently been issued to monitor balance of payments transactions. It is still too early to assess the full impacts
of these policy changes. This section briefly considers the setting of interest rate caps and provides an early read on emerging issues.
interest rate capsIn January 2013 the Bank of Zambia intro-duced interest rate caps for both commercial banks and microfinance institutions to con-trol high lending rates in the domestic credit market. The interest rate caps, linked to the Bank of Zambia policy rate (at 9.75 percent), are 18.75 percent for commercial banks, 30 percent for payroll lenders, and 42 per-cent for development-oriented microfinance institutions (MFIs). According to the Bank of Zambia classification, 10 of 32 MFIs are clas-sified as development-oriented lenders.
The interest rate caps have greatly affected the business strategies of commercial banks and MFIs. Commercial banks that are lend-ing to small and medium enterprises (SMEs) and piloting new products are reassessing their business plans. Some have already dis-continued lending to SMEs, as interest rates charged for SME loans, especially those not secured by collateral, are typically above the regulatory interest rate ceiling. At the end of 2012 commercial banks’ SME lending port-folio totaled the equivalent of $480 million for 14,000 loans, $20 million of it unsecured. The interest rate caps are expected to curtail lending to SMEs, especially for unsecured loans, as in South Africa (box 1.2).
Lending by development-oriented MFIs has also been affected since the caps were introduced. These MFIs have changed their business model by introducing “assessment
Table Utilization of the sovereign bond proceeds
1.1Project Fiscal year $ millions
Expected absorption Comment
Kafue Gorge lower project 2012 186.0 Q4 2013 Yet to start
Kitwe-Chingola road 2013 100.0 Q1 2013 Implementation commenced
Roads re-financing “Formula 1” 2012 145.0 Q4 2012 Payment done
Itezhi Tezhi hydropower equity injection 2012 36.0 Q4 2013 SI33 implementation challenges
Other ZESCO projects 2013 33.0 Q4 2014 Yet to start
Link Zambia roads project (Pave Zambia) 2013 65.0 Q1 2013 implementation commenced
Railway 2013 120.0 Q4 2013 Yet to start
Private sector support project (Access to credit-DBZ) 2013 20.0 Not yet accessed by private sector
Rehabilitation of university teaching Hospital 2013 29.4 Q4 2013 Yet to start
Discount premium 14.2
Transaction costs 1.4
Total 750.0
Source: Ministry of Finance.

7
Zambia’s interest
rate spreads remain
structurally higher
than those of their
peers, even though
they have been
declining since 2009
fees” and other charges to overcome the caps. This new practice is reducing trans-parency in the pricing of MFI loans, which will prove especially challenging due to low financial literacy. In addition, MFIs are forced to reduce operating costs. In many cases they are considering cutting staff, post-poning investments in information technol-ogy systems, and closing branches, especially in rural areas, which cost more to maintain. Recently established MFIs have yet to reach economies of scale, and smaller MFIs estab-lished by private parties might not survive under current conditions. This is expected to affect outreach, the type of financial products MFIs offer, and loan terms and conditions.
Even in the absence of any interest rate caps Zambia’s effective lending rates had been declining since 2009, while deposit rates remained unchanged.6 The lending rate for the banking system, 17.4 percent in 2009, declined to 12.3 percent in 2012. Lending rates must also be compared with the Treasury bill rate (91 days), which can be interpreted as the “risk-free” return on capital, of 9.4 percent
at the end of 2012, leaving a difference of about 3 percentage points. Deposit rates have remained constant at about 2 percent since 2008. And consequently, interest rate spreads fell to 10.3 percent in 2012 from 15.0 percent in 2009 (figure 1.7). An appropriate approach to interest rates is to look at spreads and see how they can be brought down.
Drivers of high interest rate spreadsZambia’s interest rate spreads remain struc-turally higher than those of their peers, even though they have been declining since 2009 (Feyen and Kibuuka 2012).7 Over the last decade both Zambia’s interest rate spreads and its net interest margin have hovered above the 90th percentile of the world distri-bution and have compared poorly against the regional group benchmark (figure 1.8).8
Interest rate spread decomposition for 2008–12 reveals several interesting drivers of Zambia’s high interest rate spreads.9 Fig-ure 1.9 shows that:• Overheads are the largest component of
the Zambian spreads, but their impact has almost halved since 2009, when the global
Box interest rate caps in South Africa
1.2 Several countries have introduced interest rate caps but with varying designs. The caps in South Africa, similar to those in Zambia, are linked to the repo rate but differentiated by the type of lending product rather than the type of institution. Differentiation by product allows lenders to charge higher interest rates for riskier transactions, such as unsecured loans or developmental credit agreements. Despite curtailing predatory lending in the formal sector, interest rate caps have led to an increase in informal lending, which is outside the National Credit Regulator’s control. In addition, South Africa shows that financial institutions take advantage of interest rate caps by classifying more loans as short-term transactions for which higher interest rates can be charged rather than entering into longer term credit agreements. The repo rate’s recent drop has tight-ened the current caps considerably, and several financial institutions appear to have limited their lending, even where the caps were not previously binding, such as in mortgage lending.
Source: Authors.
Figure Ex-post lending and deposit rates, 2008–12
1.7
20122011201020092008
Perc
ent
of G
NI
Lending rate Deposit rate
0
5
10
15
20
Source: Individual banking statements from Zambian banks and World Bank staff calculations.

Z a m b i a E c o n o m i c b r i E f — J o b s c h a l l E n g E : r E a l i t i E s o n t h E g r o u n d
8
interest rate spreads
can be reduced further
by increasing efficiency
and competition
financial crisis put pressure on bank over-heads and provisions. Trends in staff pay-ment, notably the easing of a previously tight labor market, explain much of the decline. Even so, salaries remain high and continue to drive overheads.
• Higher provisioning to counter the effects of the global financial crisis has fallen sub-stantially—and in turn reduced spreads.
• Profit margins have fluctuated, but they remain high and are the second largest
component of the spreads. Taxes make up a large percentage of the profit mar-gin. The corporate tax rate for banking institutions fell from 40 percent in 2008 to 35 percent in April 2012, which would have a positive impact on spreads.
• Reserves have dropped steadily over the last five years, also lowering the spreads.Interest rate spreads can be reduced fur-
ther by increasing efficiency (to reduce over-heads) and competition (to put pressure on
Figure interest rate spread and net interest margin, 2002–11
1.8 Lending–deposit spread
0
10
20
30
2011201020092008200720062005200420032002
Perc
ent
Zambia Sub-Saharan Africa median Expected median
Net interest spread
0
5
10
15
2011201020092008200720062005200420032002
Perc
ent
Zambia Sub-Saharan Africa median Expected median
Source: Authors’ calculations based on data from Zambian authorities.
Figure Decomposition of bank interest rate spreads, 2008–12
1.9
20122011201020092008
Perc
ent
Reserves Overheads Provisions Pro�ts
0
5
10
15
20
Source: Individual banking statements from Zambian banks and World Bank staff calculations.

9
Medium-term
prospects for Zambia’s
economic growth
remain good, but
serious external risks
remain, including fast-
declining copper prices
profit margins). Given the size of Zambia’s financial system ($6.6 billion at the end of 2012), reaping full economies of scale is a challenge. Facilitating bank expansion into underserved segments of the market by improving the financial infrastructure, par-ticularly the credit bureau and the collateral regime, would reduce risk and thus allow banks to lower interest rates. Broadening the credit bureau would allow more competition among banks for the lowest risk borrowers. In addition, the shortage of skilled labor is driving up salaries in the financial sector. Reducing that shortage by expanding train-ing programs for the financial sector can go a long way toward lowering overheads and interest rate spreads.
External position is generally sound but reserves need to growZambia’s current account has traditionally been characterized by large surpluses on mer-chandise trade and deficits on services trade and net income. But in the past two years imports have grown at a faster pace compared with exports (annex table A.3). In 2012 the import bill grew 25 percent, with petroleum imports (accounting for about 12 percent) growing more than 70 percent. Growing demand in mining (which grew 25 percent, consuming more than 35 percent of total petroleum product imports), increased vehi-cle imports (which grew 40 percent), and electricity load shedding accounted for the growth in petroleum products in 2012, par-ticularly the second half. An interesting fea-ture of Zambia’s trade is the recent surge in nontraditional exports (box 1.3). Some of the increase comes from maize exports that are not likely to be sustained once subsidies are withdrawn, but there are other agro- products that have the potential to grow. China remained Zambia’s largest trading partner, with copper and nontraditional exports lead-ing the way (annex table A.4).
The Bank of Zambia’s net foreign exchange sales totaled $517 million in April 2013, with gross international reserves having declined to $2.5 billion from $3.0 billion in December 2012 (figure 1.10 and annex table A.3). The outflows were driven mainly by the Bank of Zambia’s direct support for the oil import bill and debt-servicing obligations. But the April 2013 stop to Bank of Zambia direct financing
of the oil import bill and the tightened mon-etary policy conditions have halted a further decline in reserves.
Medium-term outlook: Good prospects but considerable risksMedium-term prospects for Zambia’s eco-nomic growth remain good but are subject to evenly balanced risks emanating from global uncertainties and macroeconomic manage-ment. GDP growth is expected to average more than 7 percent over 2013–15 (table 1.2). Underpinning the projected medium-term growth are favorable external and domestic developments. China’s strengthening econ-omy bodes well for Zambia’s metal trade. The strong FDI flows to mining in recent years are expected to continue boosting growth.
Aggregate demand is also expected to continue boosting growth. Rising consumer spending, along with increased capital spend-ing (both private and public), will lead to an increase in imports. Expected increases in exports should compensate for this, leading to a positive net export contribution to GDP growth. Fiscal policy is expected to remain expansionary, contributing to higher growth prospects. In addition, recent real wage increases (for both the public and private sec-tors) will support household consumption, the largest contributor to aggregate demand. Household domestic spending should also benefit from a stable macroeconomic envi-ronment (average inf lation expected at 7–8 percent), lower real interest rates, and increased access to consumer credit. Indeed, with rising incomes, the increase in personal loans is expected to continue over 2013–15. (The share of personal loans in total loans increased from 40 percent in 2010 to 50 per-cent in 2012.)
Serious external risks remainZambia’s expected robust growth notwith-standing, serious external risks remain. Especially important among these risks are fast-declining copper prices. The economy can absorb moderate declines in copper prices, but steeper declines will hurt the country. Indeed, planned mining investments could be delayed or even canceled— slowing construction and reducing government revenues—with consequences for infrastruc-ture investment and potentially leading to

Z a m b i a E c o n o m i c b r i E f — J o b s c h a l l E n g E : r E a l i t i E s o n t h E g r o u n d
10
macroinstability as the kwacha depreciates (or reserves are depleted).
The steeper decline could be acceler-ated by both supply-side factors (new mines being opened globally) and weaker demand from high-income countries and China (which accounts for more than half of Zam-bia’s exports). China is already rebalanc-ing its growth model—from export- and investment- led (more metal-intensive) to
more consumption-driven (less metal-inten-sive). Another external risk is the expected rise in interest rates as the U.S. Federal Reserve begins to taper off its quantitative easing. This rise will not only have carry-trade effects on metal prices (see box 1.1) but also raise the cost of borrowing in interna-tional markets for developing countries like Zambia. Indeed, steep rises in the cost of borrowing could price developing economies
Box Evolution of nontraditional exports
1.3 Nontraditional merchandise exports surged to more than 70 percent in 2012 (box figure 1). And growth has been impressive, above 32 percent, since 2010. Also in 2012, nontraditional exports contributed more than 30 percent of merchandise exports (30.4 percent) for the first time since 2003. But despite the gains this contribution is still below the 38 percent in 2003—when copper exports were still very low (box figure 2).
Box figure 1 Growth in nontraditional exports, 2001–12
0
1
2
3
201220112010200920082007200620052004200320022001
$ bi
llion
s
Percentage change
Nontraditional exports Annual growth
0
25
50
75
Source: Bank of Zambia.
Box figure 2 Recent diversification in merchandise exports, 2000–12
0
2
4
6
8
10
2012201120102009200820072006200520042003200220012000
$ bi
llion
s
Traditional exports Nontraditional exports
Source: Zambian authorities and IMF estimates.
Zambia’s surge in nontraditional exports since 2010 has been driven largely by maize, copper wire, cane sugar, gemstones, cotton yarn, and tobacco, which from 2010 to 2012 contributed about half of these exports. In 2012 wood exports stood at $183 million, up substantially from $14 million in 2011, due largely to exports to the Democratic Republic of Congo and Malawi. For maize a combination of surplus stocks and favorable prices (subsidized) could have increased exports to neighboring countries, such as Namibia, Tanzania, and Zimbabwe. A large jump in gemstone exports to Belgium, Singapore, and South Africa accounted for the high growth of this export base. Also notable was the 2012 surge in exports to South Africa of animal, fish, and plant products not for human consumption.
Source: World Bank 2013b.

11
Persistent and even
escalating perceptions
of an uncertain policy
environment could
weaken investment,
thereby reducing
GDP growth
out of international credit markets, reduc-ing their ability to raise long-term capital to finance much-needed infrastructure projects so that they can improve their competitive-ness and raise potential output. The World Bank estimates that the resulting decline in developing country investment could reduce GDP growth as much as 0.6 percentage points a year after three years, as part of the adjustment to higher capital costs.
Perceptions of an uncertain policy environmentIn addition, Zambia’s economy has seen far too many unexpected policy changes in recent years, the latest being the Bank of Zambia balance of payments monitoring SI 55 of 2013. Persistent and even escalating
perceptions of an uncertain policy environ-ment could weaken investment, thereby reducing GDP growth. Further, the risks of fiscal slips could undermine macroeco-nomic stability and undo some of the coun-try’s recent hard-earned gains. Fiscal policy remains on a sustainable trajectory, but esca-lating recurrent and off-budget expenses must be reined in. Major global credit rating agencies have a negative outlook for Zambia.
Despite good projections for the short to medium term, Zambia’s economy still faces large development challenges. The slow structural transformation implies that the economy still relies on copper, especially for foreign exchange earnings and government revenues. While rapid growth is welcome, the
Figure Current account balance and international reserves, 2008–13
1.10
–10
–5
0
5
10
2013(projected)
2012(preliminary)
2011201020092008
Perc
ent
of G
DP
Months of prospective im
ports
Current account balance International reserves
2.0
2.5
3.0
3.5
4.0
Source: Authors and the Bank of Zambia.
Table GDP growth projections, by main sectors, 2013–15
1.2 Percent, unless otherwise stated
Indicator 2013 2014 2015
Primary sector 0.1 7.6 6.8
Agriculture, forestry, and fishing –7.4 3.3 5.6
Mining and quarrying 12.0 13.1 8.2
Secondary sector 9.1 10.5 10.9
Manufacturing 6.5 6.6 5.9
Electricity, gas, and water 4.0 11.6 18.1
Construction 12.0 11.0 11.0
Tertiary sector 6.6 6.8 6.4
Wholesale and retail 3.8 4.5 5.0
Restaurants, bars, and hotels 12.0 11.0 10.0
Transport, storage, and communications 11.8 13.4 10.2
Financial institutions and insurance 8.0 5.0 5.0
Real estate and business services 3.0 3.0 3.0
GDP 6.0 7.3 7.5
Memorandum item (billions of kwacha)
GDP (current market prices) 120,952.0 139,113.0 158,275.0
Source: Zambian authorities, IMF, and World Bank staff estimates.

Z a m b i a E c o n o m i c b r i E f — J o b s c h a l l E n g E : r E a l i t i E s o n t h E g r o u n d
12
copper-dependent growth model has been unable to create enough productive jobs, for-mal or informal. The growth has also failed to make a real dent in poverty. The next sec-tion shines light on how employment and
poverty are related in Zambia and how long-term solutions to twin challenges of creating jobs and reducing poverty could lie in improv-ing smallholder productivity and improving access to good quality basic education.

13
SECTioN 2
Jobs challenge: Realities on the ground
improving earnings from work is an important development priorityThe issue of jobs is important to all Zam-bians and discussions about how to create jobs and reduce unemployment pervade the media, policy documents, and debates. In the 2013 Afrobarometer Survey “unemploy-ment” topped the list of the most important problems facing Zambia that the government should address, with 19 percent respondents choosing it (Afrobarometer 2013). This situa-tion has not changed much from 2009 when unemployment was ranked the second biggest problem, after “farming and agriculture.”
People care about jobs because earnings from work are generally the biggest share of their incomes. Living standards improve as labor earnings improve. For poor Zambians, improving labor earnings could lead them out of poverty. Jobs are also important for the psychological well-being of people and social cohesion (World Bank 2012b). Later, this sec-tion reports reactions of young people, col-lected as part of a qualitative study (box 2.1). The study shows that the youth want to get into jobs in line with the level of their skills
and education, and when such jobs are not forthcoming, it can breed discontentment.
This section places priority on improving the living standards and earnings of work-ing Zambians by improving their productiv-ity in agriculture, nonfarm self-employment, and the formal sector. This is a development priority because a majority of Zambians are already working; they cannot afford to be unemployed. Moreover, the Zambian labor force is growing fast and the pace at which formal wage jobs are growing will not be fast enough to absorb the new cohorts of youth that are entering the labor market. Creat-ing formal private sector jobs—by creating a business environment for the private sec-tor to grow—is, and will be, important. But equally important is to ensure that the con-ditions are in place so that “work pays off (better)” in agriculture as well as in nonfarm self-employment.
This section also places emphasis on improving access to, and quality of, basic edu-cation that “is an absolute priority given that skill building is cumulative and basic educa-tion forms the foundation on which much
BoxWhat do youth want? A qualitative study of youth employment and unemployment in Zambia
2.1 To have a richer picture of what the kinds of employment that Zambian youth aspire to are, and their experiences in different types of work and unemployment, a rapid qualitative assessment was undertaken in April 2013. The survey, conducted by the Zambian Institute for Policy Analysis and Research, included focus groups and interviews with 68 young people in four districts of the Eastern and Lusaka provinces, covering rural and urban areas. The survey captured a diverse range of experiences, including men and women ages 15–24 in wage employment, self-employment, farming, unemployment, and students.
While not nationally representative, the study complements the quantitative picture in this section with insights into the opportunities and barriers that youth face in finding employment and moving between jobs.
Source: Authors.

Z a m b i a E c o n o m i c b r i E f — J o b s c h a l l E n g E : r E a l i t i E s o n t h E g r o u n d
14
Even if fertility
declines, Zambia’s
population is
estimated to almost
double by 2030
of the later path of skill acquisition rests” (World Bank 2012b). The poor, rural youth, and girls are specifically identified as prior-ity targets when it comes to improving access to good quality basic education. These dis-advantaged sections are not in a position to benefit from an improvement in the general environment for jobs creation by the private sector because they are unable to transcend the barriers of poverty, location, and gender.
This section draws largely on 2010 Living Conditions Monitoring Survey (LCMS) data to draw out salient facts—the realities on the ground—about employment, youth, and poverty in Zambia (CSO 2010b). In the end a brief contrast is made between “the reali-ties on the ground” and current policy direc-tion and debate. Some recommendations are made on accelerating formal jobs creation by the private sector, increasing smallholder agricultural productivity, improving the envi-ronment for home businesses, and enhanc-ing access to basic education for the youth based on available research and lessons from other countries.
Labor force is growing fast and will stay young for a long timeZambia’s population is overwhelmingly young, similar to other Sub-Saharan coun-tries, and the youth make up a large share of the labor force (figure 2.1). Africa is experiencing a youth bulge, and Zambia is no exception. According to 2010 estimates, 82 percent of the population (roughly 5 mil-lion people) is 35 or younger, and 66 per-cent (about 3 million) is 24 or younger (CSO 2010b). At 62 percent, youth (ages 15–35) also make up a large share of the total labor force.10 The young population is a result of the persistently high fertility rate in Zambia and the accompanying strong population growth (World Bank forthcoming a).
Zambia’s population and labor force will continue to grow fast in the coming decades. Even if fertility declines, Zambia’s popula-tion is estimated to almost double by 2030 (figure 2.2). A young age structure creates powerful momentum for future population growth because the youth are either in their reproductive years or will soon enter them.
Figure Zambia’s population is young, similar to other Sub-Saharan countries
2.1
0 10 20 30 40 50 60 70
Ghana
Rwanda
Zimbabwe
Mozambique
Zambia
Uganda
Share of total population age 24 or younger
Source: United Nations, Department of Economic and Social Affairs, Population Division 2011.
FigureZambia’s population is estimated to almost double by 2030, even with declining levels in fertility
2.2
Mill
ions
of p
eopl
e
0
50
100
150
2100209020802070206020502040203020202010200019901980197019601950
Source: World Bank forthcoming a.

15
Without a sharp
and sustained drop
in fertility and with
that a decline in the
dependency ratio, the
opportunity of a youth
bulge could be lost
Under reasonable assumptions the working-age population would also almost double to more than 12 million in 2030. Assuming that the current ratio of labor force to working-age population persists, the number of work-ers added to the labor force would go up from about 130,000 in 2010 to more than 180,000 in 2020 and 300,000 in 2030.
And Zambia’s population and labor force will stay young, presenting challenges and opportunities (figure 2.3). Declining fertil-ity will only affect the age distribution of the population if it can be sustained over a long period of time.11 An estimated 15.5 million Zambians will be entering the youth popula-tion between 2011 and 2040, more than the
current population of the country.12 The youth bulge is often seen as an opportunity that can drive dynamism and competitive-ness. But without a sharp and sustained drop in fertility and with that a decline in the dependency ratio, the opportunity of a youth bulge could be lost. Currently, that drop is not likely to happen and so the youth bulge presents serious challenges.
Current employment patterns are similar to other agrarian economiesIn 2010 Zambia’s population was slightly more than 13 million, about 7 million being of working age (figure 2.4; annex C).13 About 5 million people (71 percent of the
Figure Zambia’s population will remain young in the coming decades
2.3 Female Male
2010 2040
Percent Percent
20 10 0 10 20 20 10 0 10 20
0–45–9
10–1415–1920–2425–2930–3435–3940–4445–4950–5455–5960–6465–6970–7475–7980–8485–8990–9495–99100+
Source: World Bank forthcoming a.
Figure Overview of employment in 2010 (thousands)
2.4 Totalpopulation
13,020
Labor force4,998
Employed4,574
Rural 284
Agriculture3,042
Nonfarmself-employment
762
Urban478
Informal192
Formal nonpublic sector 307
Unemployed425
Working-agepopulation
7,021
Formal public sector
272
Wageemployment
770
Note: The numbers reported in the figure are statistical estimates and not based on a direct count (as in a census). “Formal” refers to employment in enterprises with more than five employees. In the discussion that follows “nonfarm self-employment” is used interchangeably with “home businesses.”Source: Authors’ calculations based on Living Conditions Monitoring Survey data from CSO (2010b).

Z a m b i a E c o n o m i c b r i E f — J o b s c h a l l E n g E : r E a l i t i E s o n t h E g r o u n d
16
Despite high
urbanization, farming
is the main occupation
of Zambians, with
about 68 percent
of the labor force
working-age population, or the labor force participation rate) were in the labor force—that is, they were either working or looking for work. There is a significant difference in participation rates between rural and urban areas. In rural areas about 78 percent of the working-age population was in the labor force, while only 61 percent was in urban areas (annex table C.1). The lower participa-tion rate in urban areas is explained largely by the low rate for the youth and women.
Zambia has employment patterns simi-lar to other agrarian economies. The share of wage employment differs greatly across countries and generally indicates a country’s development level (figure 2.5). The lower share of wage employment and higher share of farming characterize agrarian economies. More than 80 percent of employment in Zambia is nonwage. In this, Zambia does not differ much from its Sub-Saharan peers.
Despite high urbanization, farming is the main occupation of Zambians.14 In 2010 about 4.5 million people were working in Zambia, with about 68 percent in farming, including fishing and forestry. Manufactur-ing employed only about 3.2 percent, and mining 1.5 percent. There is sizable activity in the services sector (25 percent of the total employment), almost a fourth of which is gov-ernment services (annex table C.2).15 There is very little nonfarm activity in rural areas; only about 14 percent of rural employment is in nonfarm activities, of which 2.8 percent-age points are the public sector.
And farming is not necessarily an occu-pation of choice for those working in it. In many cases, particularly for the youth, it is the absence of alternative opportunities that
keeps them in farming. Many youth enter the labor force working on family farms before moving into wage or self-employment. Simi-larly, for women it is the lower mobility due to family and other obligations that keeps them on farm. Data show that a larger share of women workers (74 percent) is on farms than men (59 percent).
Nonfarm self-employment (home busi-nesses) is an important source of employ-ment. It constitutes about 17 percent of total employment and almost half of total nonfarm employment, though concen-trated mainly in urban areas. This category includes people who run home businesses, as their main activity, with no hired employ-ment.16 Analysis from other Sub-Saharan countries shows that home businesses pro-vide an important avenue for people who are prepared to leave agriculture but cannot find wage employment (World Bank forthcoming b). Besides home businesses, a sizable share of wage employees (about a quarter) works in microenterprises.17 Most microenterprises share characteristics of informality with home businesses, such as lack of registration as a firm, lack of social security coverage for the employees, and being outside the pur-view of labor regulation.
While small and medium enterprises are often looked upon as the source of jobs and employment, home businesses and micro-enterprises actually play a much bigger role in employing people in Zambia as in most developing countries and even middle-income countries. They contribute 67 per-cent of employment in industrial activities (annex table C.2). Commerce activities are almost entirely made up of home businesses
Figure Wage employment grows with per capita income
2.5
Wag
e em
ploy
men
t (s
hare
of t
otal
)
0 2 4 6 8 10 120
25
50
75
100
Ln GDP per capita
Source: Authors’ calculations based on wage employment data from World Bank (2012b) and per capita income data from World Bank (2012a).
17
The public sector
accounted for
about 47 percent
of formal wage
employment in 2010
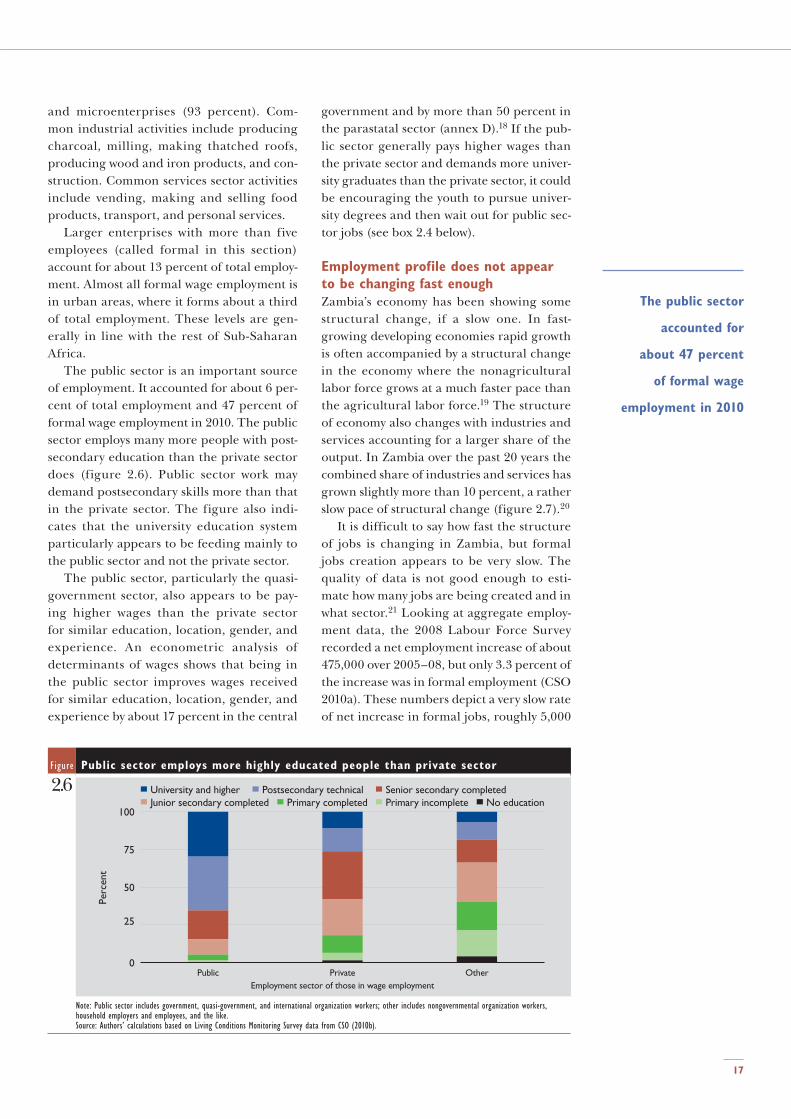
and microenterprises (93 percent). Com-mon industrial activities include producing charcoal, milling, making thatched roofs, producing wood and iron products, and con-struction. Common services sector activities include vending, making and selling food products, transport, and personal services.
Larger enterprises with more than five employees (called formal in this section) account for about 13 percent of total employ-ment. Almost all formal wage employment is in urban areas, where it forms about a third of total employment. These levels are gen-erally in line with the rest of Sub-Saharan Africa.
The public sector is an important source of employment. It accounted for about 6 per-cent of total employment and 47 percent of formal wage employment in 2010. The public sector employs many more people with post-secondary education than the private sector does (figure 2.6). Public sector work may demand postsecondary skills more than that in the private sector. The figure also indi-cates that the university education system particularly appears to be feeding mainly to the public sector and not the private sector.
The public sector, particularly the quasi-government sector, also appears to be pay-ing higher wages than the private sector for similar education, location, gender, and experience. An econometric analysis of determinants of wages shows that being in the public sector improves wages received for similar education, location, gender, and experience by about 17 percent in the central
government and by more than 50 percent in the parastatal sector (annex D).18 If the pub-lic sector generally pays higher wages than the private sector and demands more univer-sity graduates than the private sector, it could be encouraging the youth to pursue univer-sity degrees and then wait out for public sec-tor jobs (see box 2.4 below).
Employment profile does not appear to be changing fast enoughZambia’s economy has been showing some structural change, if a slow one. In fast- growing developing economies rapid growth is often accompanied by a structural change in the economy where the nonagricultural labor force grows at a much faster pace than the agricultural labor force.19 The structure of economy also changes with industries and services accounting for a larger share of the output. In Zambia over the past 20 years the combined share of industries and services has grown slightly more than 10 percent, a rather slow pace of structural change (figure 2.7).20
It is difficult to say how fast the structure of jobs is changing in Zambia, but formal jobs creation appears to be very slow. The quality of data is not good enough to esti-mate how many jobs are being created and in what sector.21 Looking at aggregate employ-ment data, the 2008 Labour Force Survey recorded a net employment increase of about 475,000 over 2005–08, but only 3.3 percent of the increase was in formal employment (CSO 2010a). These numbers depict a very slow rate of net increase in formal jobs, roughly 5,000
Figure Public sector employs more highly educated people than private sector
2.6
OtherPrivatePublic
Perc
ent
Junior secondary completedUniversity and higher
Primary completedPostsecondary technical
Primary incompleteSenior secondary completed
No education
0
25
50
75
100
Employment sector of those in wage employment
Note: Public sector includes government, quasi-government, and international organization workers; other includes nongovernmental organization workers, household employers and employees, and the like.Source: Authors’ calculations based on Living Conditions Monitoring Survey data from CSO (2010b).

Z a m b i a E c o n o m i c b r i E f — J o b s c h a l l E n g E : r E a l i t i E s o n t h E g r o u n d
18
Urban youth
overwhelmingly
comprise the ranks
of unemployeda year, or about 1 percent a year. In compari-son, real GDP expanded over 2003–08 at an average rate of 5.7 percent.22 These numbers show that, given the current structure of the economy and the nature of growth, formal jobs are being created at a much slower pace than economic growth.23
Unemployment is mainly an urban youth issueUnemployment in Zambia is an issue, but aff licting mainly the urban youth. In 2010 about 8.5 percent of Zambians in the working-age group reported themselves as un employed.24 There was a significant urban–rural difference, with the urban unemployment rate at 19.6 percent, more than six times the rural rate of 3.1 percent. And unemployment is concentrated among young people. Combining age and urban–rural location, urban youth overwhelmingly comprise the ranks of unemployed (fig-ure 2.8). In the 15–35 age group 27.4 percent
of urban youth were unemployed, compared with just 4.4 percent in the rural areas.
The unemployment rate is highest for youth who have completed senior secondary education, perhaps explained by that better educated youth, especially in urban areas, have more resources and can afford to be unemployed while waiting for opportuni-ties in wage employment (Guarcello, Kov-rova, and Lyon 2012). In comparison, less educated youth with fewer resources cannot opt out of working and are likely to work on family farms or in home businesses. Indeed, unemployment is considerably higher among nonpoor youth (16 percent), compared with poor youth (9 percent).
About 17 percent of youth are inactive—neither working nor studying. Urban girls are more likely to be inactive than urban boys: 41 percent of urban girls are inactive, com-pared with 24 percent of urban boys. The trend of inactive youth by education level is similar to the pattern of unemployment.
Figure Unemployment rate by age for rural and urban areas
2.8
Perc
ent
0
20
40
60
6460555045403530252015
Rural areas Urban areas
Age
Source: Authors’ calculations based on Living Conditions Monitoring Survey data from CSO (2010b).
Figure Changes in the economy’s structure from 1994 to 2012
2.7
2012201120102009200820072006200520042003200220012000199919981997199619951994
Perc
ent
Tertiary sector Secondary sector Primary sector
0
25
50
75
100
Note: See annex table C.2 for definition of primary, secondary, and tertiary sectors.Source: Authors’ presentation of data obtained from Zambian authorities.

19
Farming accounts for
about 81 percent of
the working poor
Inactivity is highest among those who com-pleted senior secondary education, and decreases for both higher and lower educa-tion levels, further suggesting that youth with higher education can afford to be unem-ployed (figure 2.9). But it could also be due to that some students who have completed senior secondary education wait one year before they start university education (box 2.2).
A large number of working Zambians are poor and concentrated in farmingA large number of working adults remain mired in poverty.25 In fact, working adults are more likely to be poor than the nonworking. In the 36–64 age group 62 percent of those working are poor, compared with 56 percent of nonworking. Working poor are concen-trated in farming, which accounts for about 81 percent of the working poor (figure 2.10).
For those employed in agriculture, to escape poverty they must derive greater earn-ings from their work. Research shows that an increase in labor earnings plays a big role in reducing poverty. In farming, apart from individual characteristics of farmers such as education, improvements in other factors of production such as better access to input-out-put markets, infrastructure improvements,
and improvement in land rights can affect farmers’ labor productivity. Several of these same factors are also fundamental for enhancing off-farm jobs and diversifying family incomes.
In low-income countries growth in agri-culture is associated with larger reductions in poverty than in other sectors of the econ-omy (World Bank 2012b). Since 1700 almost every example of mass poverty reduction has begun with an increase in agricultural pro-ductivity (box 2.3).
The much lower concentration of poor in the nonfarm home business sector is notable. Evidence shows that in many countries this sector has played an important role in mov-ing people out of poverty. In Bangladesh and Uganda the shift in primary economic activ-ity from agriculture to a nonfarm business contributed substantially to poverty reduc-tion over the last decade (World Bank forth-coming b).
Some youth issues deserve special attentionYouth employment issues present additional dimensions. Youth have aspirations for their future. Educated young Zambians want to work outside of agriculture in wage and
FigureGirls, urban youth, and youth with senior secondary education are more likely to be inactive
2.9
0 10 20 30 40 50
Total
No educationPrimary incompletePrimary completed
Junior secondary completedSenior secondary completed
Postsecondary technicalUniversity and higher
RuralUrban
FemaleMale
Percent
Source: Authors’ calculations based on Living Conditions Monitoring Survey data from CSO (2010b).
Box Waiting to get into a university
2.2 Asaph Zulu is a bright young Zambian who passed grade 12 in February 2013, coming out near the top in the Lusaka area, with sterling grades scoring a “1” on seven of his eight courses and a “2” on the other, based on a scale of 1 to 9, with 1 being the highest. Asaph comes from a large poor family headed by his mother. He wants to be a doctor but cannot pay for university fees. He has to wait to get a bursary and cannot start college until September 2014. Meanwhile he is working at a gas station trying to support his family. If and when he ultimately starts going to the university, it would have been almost two years since he wrote his grade 12 examinations. He is worried that his academic skills might deteriorate waiting so long to start university.
Source: Authors.
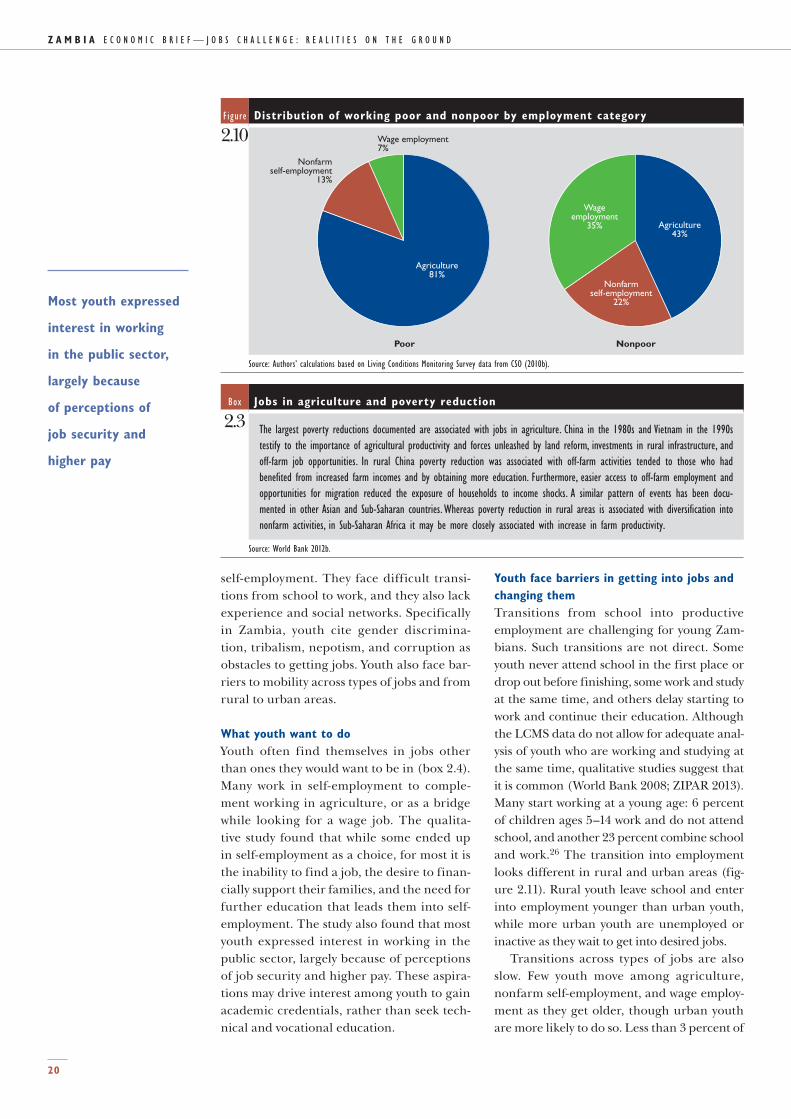
Z a m b i a E c o n o m i c b r i E f — J o b s c h a l l E n g E : r E a l i t i E s o n t h E g r o u n d
20
Most youth expressed
interest in working
in the public sector,
largely because
of perceptions of
job security and
higher pay
self-employment. They face difficult transi-tions from school to work, and they also lack experience and social networks. Specifically in Zambia, youth cite gender discrimina-tion, tribalism, nepotism, and corruption as obstacles to getting jobs. Youth also face bar-riers to mobility across types of jobs and from rural to urban areas.
What youth want to doYouth often find themselves in jobs other than ones they would want to be in (box 2.4). Many work in self-employment to comple-ment working in agriculture, or as a bridge while looking for a wage job. The qualita-tive study found that while some ended up in self-employment as a choice, for most it is the inability to find a job, the desire to finan-cially support their families, and the need for further education that leads them into self-employment. The study also found that most youth expressed interest in working in the public sector, largely because of perceptions of job security and higher pay. These aspira-tions may drive interest among youth to gain academic credentials, rather than seek tech-nical and vocational education.
Youth face barriers in getting into jobs and changing themTransitions from school into productive employment are challenging for young Zam-bians. Such transitions are not direct. Some youth never attend school in the first place or drop out before finishing, some work and study at the same time, and others delay starting to work and continue their education. Although the LCMS data do not allow for adequate anal-ysis of youth who are working and studying at the same time, qualitative studies suggest that it is common (World Bank 2008; ZIPAR 2013). Many start working at a young age: 6 percent of children ages 5–14 work and do not attend school, and another 23 percent combine school and work.26 The transition into employment looks different in rural and urban areas (fig-ure 2.11). Rural youth leave school and enter into employment younger than urban youth, while more urban youth are unemployed or inactive as they wait to get into desired jobs.
Transitions across types of jobs are also slow. Few youth move among agriculture, nonfarm self-employment, and wage employ-ment as they get older, though urban youth are more likely to do so. Less than 3 percent of
Figure Distribution of working poor and nonpoor by employment category
2.10
Agriculture81%
Nonfarmself-employment
13%
Wage employment7%
Agriculture43%
Nonfarmself-employment
22%
Wageemployment
35%
Poor Nonpoor
Source: Authors’ calculations based on Living Conditions Monitoring Survey data from CSO (2010b).
Box Jobs in agriculture and poverty reduction
2.3 The largest poverty reductions documented are associated with jobs in agriculture. China in the 1980s and Vietnam in the 1990s testify to the importance of agricultural productivity and forces unleashed by land reform, investments in rural infrastructure, and off-farm job opportunities. In rural China poverty reduction was associated with off-farm activities tended to those who had benefited from increased farm incomes and by obtaining more education. Furthermore, easier access to off-farm employment and opportunities for migration reduced the exposure of households to income shocks. A similar pattern of events has been docu-mented in other Asian and Sub-Saharan countries. Whereas poverty reduction in rural areas is associated with diversification into nonfarm activities, in Sub-Saharan Africa it may be more closely associated with increase in farm productivity.
Source: World Bank 2012b.

21
Many youth perceive
the allocation of jobs
to be unfair, based
on gender, nepotism,
and connections
rather than merit
youth in the LCMS responded that they had changed jobs in the last 12 months. This low mobility is due partly to low mobility between
rural and urban areas. Most rural youth start working in agriculture, and it remains their primary activity over time. In contrast, as
Box What jobs do youth want to be in?
2.4 Most youth are not satisfied in their current jobMost participants were not satisfied with their current jobs mainly due to low incomes and poor working conditions, for those in wage employment, and lack of capital for those in self-employment. As a result, all participants indicated that they were looking for work elsewhere.
They are self-employed for various reasons“I chose self-employment because of the insecurity in wage employment. . . . It took me about one year and six months to
settle in self-employment.” A young entrepreneur (urban)“I have worked before. But I decided to be in business. It took me four years to settle.” A young entrepreneur (urban)“Sitting idle troubled me, so I started to start doing gardening in 2010.” A young entrepreneur (rural)“I was not earning anything to support my family, and I planned to further my education. So I decided to do various jobs.”
A young married volunteer (rural)“I did not choose [to be in self-employment]. It is because I failed to find a job.” A young entrepreneur (urban)
Youth in rural areas combine family farming with other activities to make ends meet“I help out at home, and attend to my field where I have a piece of land to grow food for my own consumption.” A young
woman in farming self-employment (rural)“I prepare to attend to my garden where I grow vegetables for sell. I water and weed my vegetables in morning. Thereafter, usu-
ally in the afternoon I get to the Boma (town center) to look for work.” A young woman in farming self-employment (rural)
Most youth want to work in the public sectorParticipants in the qualitative study were asked which industries or companies they would want to work in. Most participants indicated that they would want to work in public sector jobs, especially in health and education.“I would like to work in the health industry because I want to work for and help people.” A young female full-time student (urban)“The Ministry of Gender or Youth and Child Development because I have a passion for young people.” A young female entre-
preneur who makes beads and earrings (urban)“The Ministry of Commerce, Trade and Industry because of the passion I have for business.” A young self-employed male
engaged in poultry and data entry (urban)“I would like to work in a mine procurement department so that I learn because I want to open my own mine.” A young
female entrepreneur (urban)“The Ministry of Science and Technology because I have a passion for computers.” A young male entrepreneur who runs a
barber shop“I want to work for the Central Statistical Office. This is because I did some surveys with the institution, and I was inspired
by the money they gave me.” A young male barbershop owner“Ministry of Education because there is more time to do other things.” A young male employed to sell beef products (urban)
Source: ZIPAR 2013.
Figure Transitions into employment differ in rural and urban areas
2.11
0
25
50
75
100
3530252015
Employed Full-time student Unemployed Not in labor force or education
Rural areas Urban areas
0
25
50
75
100
3530252015
Age Age
Perc
ent
Perc
ent
Source: Authors’ calculations based on Living Conditions Monitoring Survey data from CSO (2010b).

Z a m b i a E c o n o m i c b r i E f — J o b s c h a l l E n g E : r E a l i t i E s o n t h E g r o u n d
22
Living in an urban
area and being a
man improves an
individual’s chances
of wage employment,
while living in a rural
area and being a
woman reduces them
urban youth get older, participation in home businesses and wage employment rises, while that in agriculture falls.
Youth depend on many resources when searching for jobs. Most youth find out about job opportunities from friends and relatives, and newspapers, electronic media, posters, social media (Facebook), and text messages are also sources of information. While there were no distinct differences in sources of labor market information between young men and women, there were noticeable dif-ferences between urban and rural areas. Information from friends, relatives, post-ers, and radio were common in both rural and urban areas. Access to television, social media, and newspapers is more prevalent in the urban areas.
Many youth perceive the allocation of jobs to be unfair, based on gender, nepotism, and connections rather than merit. Respon-dents in the qualitative survey explained how people get jobs in their communities. In all areas, getting jobs is about “who you know” instead of “what you know” (box 2.5). Many respondents believed that they needed to know someone to get a job. A young woman
explained, “I have tried to get a job, but only relatives are being employed.” Perceptions of discrimination are widespread, including concerns about tribalism and nepotism. Oth-ers, especially women, indicated that they were discriminated because of their gender or appearance. Young women especially cited discrimination and sexual harassment as part of the job search. Respondents relayed examples of employers or recruitment offi-cers requesting sexual favors or monetary bribes in exchange for employment.
opportunities for skills development for youth, particularly for girls, are unequalYouth employment patterns largely mimic those for adults in the labor force, indicat-ing that youth find it hard to transcend cir-cumstances such as location, gender, and household poverty status (annex table C.4). And these circumstances largely determine the opportunities available to youth. Living in an urban area and being a man improves an individual’s chances of wage employ-ment, while living in a rural area and being a woman reduces them. Access to education is also dependent on these circumstances
Box Getting a job is about who you know: “Wako ni wako” culture
2.5 James, 24 years old, spends his mornings volunteering at the Nyimba District Hospital and helping pregnant women, and his afternoons running a hair salon with his wife and sister-in-law. He wants to further his education by going to college while also adequately supporting his wife and four children. Not satisfied with his current situation, he is still looking for a regular paid job. He has applied to several employers but with no success. But he says most people get jobs through relatives and being known, and he does not feel connected enough to get one. He is aware of the Citizen’s Economic Empowerment Fund for entrepreneurship, but he feels it only benefits the privileged with connections.
For Daniel, a 23-year-old unemployed Chongwe resident who has done a management course, getting a job is also about who you know. “If I don’t know anyone, I won’t get the job,” he said emphatically, when asked about barriers or obstacles to securing a job.
To overcome this obstacle, he believes that people should be recruited on merit. He also believes that tertiary education fees should be lowered to enable more young people to access higher education.
Both James and Daniel are examples of the “wako ni wako” culture, which literally means “your kind is your own.” The wako ni wako culture is currently practiced to various degrees in organizational recruitment and selection procedures, both public and private. It refers to recruitment based on friendships, family ties, and tribe or political affiliation without regard for qualifications. And it was one of the main reasons cited by most of the young people who participated in the focus groups for not getting jobs.
John is a Chipata-based unemployed 24-year-old who failed mathematics at grade 12. “I feel as if people are laughing at me because I don’t have a job,” he says when asked how he felt about being unemployed. “You feel as if you are not useful to the world.”
He has worked before, at a seasonal job with one of the tobacco companies in Chipata. To get this job, he had to pay a bribe to the recruiting officer—50,000 kwacha. Had he been unable to pay the bribe, he would not have got the job.
To John, the job market in Chipata is limited, and thus leads to corruption. He suggests that the once vibrant Luangwa Industries, which used to manufacture bicycles, should be reopened to increase employment opportunities for young people like him.
Source: ZIPAR 2013.

23
Many youth drop
out of school due to
financial constraints
(World Bank 2012c). Figure 2.12 depicts the stark contrast in employment outcomes for a rural girl with little education from a poor household with those of an urban boy with some postsecondary education from a non-poor household.
Basic skills are important for building human capital. These skills include numer-acy, literacy, and behavioral skills that allow young people to interact successfully and perform on the job (World Bank 2012b, forthcoming b). They are also important for raising agricultural productivity, as well as for productivity in home businesses and wage employment (box 2.6).
Most youth enter the labor force with lim-ited education and skills. Access to education measured by enrollments has been improving rapidly. Enrollments in grades 1–12 rose from 2.6 million students in 2004 to 3.6 million in 2010 (World Bank 2012d). But outcomes have been poor. Roughly 30 percent of youth (or 1.5 million) have no education at all or have not completed primary school (grades 1–7), and another 28 percent have no schooling beyond primary school (figure 2.13).27
Many youth drop out of school due to financial constraints. Half of youth who dropped out before completing primary and secondary school identified lack of financial resources as the main obstacle to continuing their education. The gross enrollment rate in the last grade of primary schooling is 118 per-cent (because of the large number of over-age students) but it drops to 87 percent for the first year of junior secondary and to 40 per-cent by the end of senior secondary school. Starting at the junior secondary level, schools are permitted to charge fees, making it harder to continue education, particularly for students from poor households. Additionally, junior and senior secondary schools are more likely to be located near urban areas, limiting access for those who live in rural areas.
Very few poor youth benefit from govern-ment spending on secondary and tertiary education. For secondary education the share of beneficiary students rises rapidly with wealth, and for tertiary education the vast majority of beneficiaries (more than 85 percent) are in the top quintile by wealth (figure 2.14).
Box Skills matter for increasing agricultural productivity
2.6 Basic literacy plays a key role in increasing agricultural productivity in both developing and developed countries (Fuglie 2010; Himanshu 2006). Primary and secondary education has a highly significant positive effect on agricultural productivity, based on a panel of 65 countries over 1961–2002 (Reimers and Klasen 2011). This is because farmers with more education are more likely to adopt modern technologies, make better use of inputs, choose technologies more effectively, and respond more rapidly to changes, like market and weather conditions (Schultz 1988). Additionally, modern information and communication technologies are changing the nature of the skills required for agriculture, as information (from agriculture techniques to price and market access) is obtained by radio, television, Internet, and mobile services. These changes suggest that foundational skills, literacy, and numeracy will have larger impacts on agricultural productivity amid rapid technical change.
Source: World Bank forthcoming b.
Figure Employment outcomes for youth depend on opportunities
2.12
Male with somepostsecondary education from a
nonpoor household in an urban area
Female with no education orincomplete primary from a
poor household in a rural area
Perc
ent
Agriculture Nonfarm household enterprises Wage employment
0
25
50
75
100
Source: Authors’ calculations based on Living Conditions Monitoring Survey data from CSO (2010b).

Z a m b i a E c o n o m i c b r i E f — J o b s c h a l l E n g E : r E a l i t i E s o n t h E g r o u n d
24
Girls face steeper
barriers to staying in
school, largely due to
family considerations,
and thus are more
likely to have no
or incomplete
primary education
Financial constraints limit the education outcomes for the poor youth. More than half of youth in the bottom consumption quintile have no education or incomplete primary schooling and only 0.2 percent have educa-tion beyond the senior secondary level. In contrast, only 8 percent of youth in the top quintile have no education or incomplete pri-mary education and 22 percent have educa-tion beyond senior secondary (CSO 2010b).
Girls face steeper barriers to staying in school, largely due to family considerations, and thus are more likely to have no or incom-plete primary education. A fifth of girls iden-tified pregnancy, marriage, and health as reasons for leaving school, in contrast with just 4 percent of boys (CSO 2010b). Fam-ily obligations and social norms shape girls’ decisions about education and work (World Bank 2011). Early marriage is common in Zambia, as 26 percent of female youth ages 15–24 are married. A 2002 study found that 42 percent of women in ages 20–24 were mar-ried by the age of 18 (UNICEF 2005).
Even for those students who stay in school, the quality of education is poor. Zambian students underperform in both reading and mathematics compared with their peers in other countries (figure 2.15). Most Zam-bian grade 6 students did not reach mini-mum standards for functional literacy or numeracy on the 2007 Southern and East-ern Africa Consortium for Monitoring Edu-cation Quality (SACMEQ) III assessment: 73 percent of Zambian grade 6 students do not score beyond “basic literacy” (levels 1–3) and 92 percent do not score beyond “basic numeracy” (levels 1–3).28 Among SACMEQ-tested countries, Zambia ranked 13th of 14 in reading and last in math.29 Further, Zambia’s student performance has not improved over time, even declining slightly compared with other countries.30
Learning deficits are especially severe for the poor, rural youth, and girls. Students from households in the lowest welfare quartile scored more than half a standard deviation below their counterparts from households in
Figure More than half of youth have primary education or less
2.13
0 10 20 30 40 50
No education orprimary incomplete
Primary completed
Junior or seniorsecondary completed
Postsecondary
Percent
Source: Authors’ calculations based on Living Conditions Monitoring Survey data from CSO (2010b).
Figure School enrollment by wealth
2.14
TertiarySecondaryBasic
Qui
ntile
par
ticip
atio
n (p
erce
nt)
Richest quintile Quintile 4 Quintile 3 Quintile 2 Poorest quintile
0
25
50
75
100
Source: Cuesta, Kabaso, and Suarez-Becerra 2012.

25
Zambian students
underperform in
both reading and
mathematics compared
with their peers in
other countries
the top quartile.31 More than half of grade 6 students from the top quartile scored at or above level 4 on SACMEQ III literacy exams, while only 17 percent of students from the bottom quartile did. In both reading and mathematics, students in Lusaka performed the best, while students in the Southern province, where more than three-quarters of people are rural, performed the worst. And girls do slightly worse than boys. Differences in test scores mount as inequalities add up. For example, a boy from Lusaka whose house-hold belongs to the top 25 percent by socio-economic status would score on average 84 points more in math than a girl in the South-ern province whose family belongs to the bot-tom 25 percent by socioeconomic status.
it is not clear if youth with postsecondary education are in short supplyYouth with postsecondary and tertiary educa-tion have a larger share of wage employment
and have higher incomes, but it is not clear if their skills are in short supply. Completing postsecondary technical education greatly enhances a Zambian graduate’s probability of accessing wage employment—85 percent of youth with postsecondary technical edu-cation are in wage employment. More than a third of youth in wage employment have some postsecondary education, and roughly two-thirds have completed at least senior sec-ondary school. In contrast, the vast majority of youth with primary education or less work in agriculture.
In the qualitative survey youth mentioned the absence of job vacancies as more of an issue than a skills gap (ZIPAR 2013). Employ-ers generally do not cite skills as a top obsta-cle in enterprise surveys. Only 10 percent of firms in the 2008 Investment Climate Assess-ment, rated skills as a major constraint to their business, compared with 36 percent of firms in 2003 (World Bank 2009). Similarly,
FigureZambian grade 6 students underperform in literacy and mathematics compared with other southern and eastern African countries
2.15 Literacy
0
25
50
75
100
All cou
ntries
Malawi
Zambia
Leso
tho
South
Afri
ca
Ugand
a
Mozam
bique
Namibi
a
Zimba
bwe
Botsw
ana
Seyc
helle
s
Zanzib
ar
Maurit
iusKe
nya
Tanz
ania
Swaz
iland
Perc
ent
of g
rade
6 s
tude
nts
scor
ing
on li
tera
cy le
vel
Levels 1 to 3 Levels 4 to 5 Levels 6 to 8
Mathematics
Levels 1 to 3 Levels 4 to 5 Levels 6 to 8
0
25
50
75
100
All cou
ntries
Zambia
Malawi
Namibi
a
Leso
tho
Zanzib
ar
Ugand
a
Mozam
bique
South
Afri
ca
Zimba
bwe
Botsw
ana
Swaz
iland
Tanz
ania
Seyc
helle
sKe
nya
Maurit
ius
Perc
ent
of g
rade
6 s
tude
nts
scor
ing
on m
athe
mat
ics
leve
l
Source: Hungi and others 2010.

Z a m b i a E c o n o m i c b r i E f — J o b s c h a l l E n g E : r E a l i t i E s o n t h E g r o u n d
26
more than 40 percent of the respondents to the Zambia Large Business Survey and 65 percent to the Zambia Small Business Sur-vey think that adequate educated workforce does not present an obstacle for business. Firms identified access to finance and infra-structure as more pressing issues.32
But there is evidence that some specific skills may be in short supply. Firms and industry representatives in a recent survey identified “a lack of modern relevant skills among higher education graduates” as a con-cern, especially in the construction, manu-facturing, and mining sectors (Moono and Rankin 2012). Coverage of technical and vocational education and universities is low, and connections between educational institu-tions and private sector employers are weak. This may be because the Zambian education system has been traditionally geared toward preparing graduates for employment in the public sector, where the many youth in wage employment work.
Summary of findings and policy implicationsThis section arrived at the following main findings—the realities on the ground—about Zambia’s jobs challenge:• Zambia’s population and labor force is
young and growing fast. The population is projected to almost double by 2030 and hit 140 million by 2100. In 2010 about 130,000 young workers were added to the labor force; in 2030 about 300,000 will be added.
• The current structure of the economy and sources of growth are such that for-mal wage jobs are being created slowly. This pace is nowhere close to being able to absorb the new cohorts of youth that are entering the labor market.
• A large number of Zambians are already working because they cannot afford to not work. Therefore unemployment per se is less of a developmental concern. But a large number of working Zambians are poor; actually working adults are more likely to be poor than the nonworking. The working poor are concentrated mostly in farming and to a lesser extent in nonfarm self-employment. It is a development prior-ity to improve the earnings of the working poor by improving their productivity.
• Apart from agriculture, nonfarm self-employment in the form of home busi-nesses is an important source of jobs, much larger than small and medium enterprises.
• Zambia’s public sector is relatively large. Statistical analysis shows that public sec-tor wages, particularly in parastatals, are higher than in the private sector for similar education, location, gender, and experience.
• Enrollment ratios in basic education have grown, but schooling is not translating into skills. Basic education is the founda-tion for skill building and hence improved productivity, but its quality is poor. The poor, rural youth, and girls are particu-larly disadvantaged in terms of access to good quality basic education.The above findings should shape Zambia’s
efforts to tackle the jobs challenge. Sustained attention should be given to achieving the following objectives: accelerating the pace of growth of formal jobs in the private sector, improving smallholder productivity in agri-culture, providing a supportive environment for nonfarm home businesses, and improv-ing access to good quality basic education.
Youth, particularly the urban unem-ployed, will benefit from overall efforts to improve the broad environment for jobs. But the poor youth, particularly girls in rural areas, may not benefit much because they are unable to transcend the barriers of pov-erty, gender, and location. Disadvantaged youth would need to be better equipped to seize opportunities created by improving the jobs environment. Fundamentally, this involves providing equitable opportunities for improving their basic skills.
These objectives require multifaceted and long-term policies and government interven-tions. This Brief does not provide recom-mendations for achieving these objectives. However, to stimulate debate the following paragraphs comment on current policies and suggest directions that could be explored in light of experience of other countries.
Formal jobs in the private sectorCreating formal jobs in the private sec-tor is accorded top priority in government policy and strategy documents. The govern-ment’s general approach is to provide an

27
enabling environment for the private sector and address constraints to growth (see, for example, Government of Zambia 2012b). This is a sound approach. But as a resource-rich country Zambia faces pressures on com-petitiveness due to an abundance of foreign exchange. Zambia’s urban centers are not yet dynamic centers for creating wage jobs in the private sector unlike the experience of suc-cessful countries across the developing world. As large consumption agglomerates Zambia’s urban centers attract migrant labor from rural areas, but the migrants get absorbed in largely petty commerce activities. Zambia’s urbanization experience appears to be simi-lar to some other resource-rich developing countries who have found it hard to benefit from urbanization (Jedwab 2012).
One approach could be to create condi-tions for light manufacturing to grow faster. Light manufacturing (including agribusi-ness) has been an important stepping stone toward economic diversification in most eco-nomically successful developing countries. In Africa, Ethiopia has been successful in expanding production of leather products for exports. A recent World Bank study on light manufacturing in Zambia examined industry-specific constraints to growth in leather products, wood products, metal products, apparel, and agribusiness (Dinh 2013).33 The study concluded that tackling the agricultural reform agenda is funda-mental to developing light manufacturing in Zambia because agriculture is the source of inputs for leather, wood, and agribusiness industries. Improving trade logistics is also crucial for industries such as metal products where inputs are procured from outside the country.
For wage employment, understanding the technical and vocational education sector is a priority for future skills development. While Zambia is looking to expand tech-nical and vocational education, and such expansion is often seen as the solution to high youth unemployment, little is known about the current system, its quality, and the employment trajectories of its graduates. International experience underscores the importance of the governance of technical and vocational training, and close partner-ships with private sector employers (World Bank 2012b).
Smallholder productivityZambia is often seen having a high avail-ability of land relative to the population, but average farm size is smaller than two hectares.34 So, technological change that enhances yields, particularly of cereals, would be the desired policy goal. Public sec-tor investments would be important to driv-ing agricultural growth and intensifying smallholder agriculture. Public support is needed for technology generation and trans-fer. This could be through promoting part-nerships with the private and international agricultural research system while protecting the interests of small members. Productivity growth in smallholder agriculture would also require attention to access to credit so that farmers can mechanize and apply appropri-ate amount of fertilizers.
Maize subsidies are the cornerstone of the government’s agricultural policy and spending. Research shows that these sub-sidies mostly benefit large farms, through direct employment creation and income effects. And because of leakages, the employ-ment creation effect of subsidies is weaker than alternative uses of subsidies. Recently, the government has shown a willingness to reconsider agricultural subsidies. It is sug-gested that the government produce a policy paper on reorienting the fertilizer subsidies toward alternative public spending such as rural roads and small-scale irrigation and on targeting subsidies only to remote and small farms.
As part of creating employment in agricul-ture, the government has also given a good deal of attention to farm blocks.35 Experi-ence with farm blocks is limited so far. An appraisal of the Mkushi project shows that only 50 new jobs were created at full devel-opment, which is low for 2,500 hectares. It is suggested that farm blocks should be subject to a careful ex-ante economic analysis that would cover, among other things, the cost of public support (including the imputed values of special access to land, water, and infra-structure) per job created.
Nonfarm self-employmentHome businesses and microenterprises are generally grouped together as informal enterprises. And informality, generally asso-ciated with lower productivity, has been a

Z a m b i a E c o n o m i c b r i E f — J o b s c h a l l E n g E : r E a l i t i E s o n t h E g r o u n d
28
considerable policy concern in Zambia. The general policy approach toward informal enterprises is to bring them under regula-tion. But regulation neither stops newer businesses from being created nor improves productivity of those brought under regu-lation. Given their importance to employ-ment and job creation, home businesses and microenterprises need greater support from the government. Initiatives that address the most important constraints on creating a business such as access to finance and space to work could be cost-effective (World Bank forthcoming b). More analysis is, however, needed to understand these constraints in Zambia.
There is also a need to understand how youth learn skills on the job and what other interventions can increase the skills of youth working in agriculture and self-employment. Apprenticeships can be an important source of skill-building on the job for home busi-nesses, but there is a need for more informa-tion about how this works in Zambia.
Access to good quality basic education for the youthImproving foundational skills in basic edu-cation and expanding access to secondary education and skills training, especially for the poor, would address a major constraint to improvements in self-employment and pro-ductivity in agriculture, small enterprises, and formal sector employment (Iancho-vichina and Lundstrom 2008). But how
learning outcomes can be improved needs to be understood so that schooling trans-lates into skills. Further analysis is needed to understand whether Zambia’s poor per-formance in learning assessments is due to inputs (lack of qualified teachers, over-crowded classrooms), issues with service delivery (incentives for teachers to provide quality education), or other factors. There is a need to address the gaps in access to basic education and prevent dropouts through targeted programs for children at risk of not starting or finishing school.
Targeted interventions to support the transitions of girls, the poor, and inactive youth into jobs can improve opportunities for more marginalized groups over the shorter term. Such programs can include initiatives to ease barriers to entry for youth, including internships, apprenticeships, and training programs. Recent evaluations of targeted training programs for girls in Uganda show that job and skills training programs focused on girls can improve employment outcomes for girls through empowerment and skills development (box 2.7).
DataTo design and implement policies and inter-ventions to address the jobs challenge, good data on labor force and economic activity are needed at regular intervals. Currently the availability and quality of data is patchy. This is an area for sustained attention of the government.
Box Targeting girls can pay off
2.7 In Uganda the Empowerment and Livelihood for Adolescents program, operated by the nongovernmental organization BRAC, provides girls ages 14–20 with life-skills training to reduce risky health behaviors and vocational skills to start small businesses. The program significantly improved HIV- and pregnancy-related knowledge and reduced corresponding risky activities, and raised the likelihood of girls being engaged in income-generating activities by 35 percent, driven mainly by self-employment. Since the program is not based in the classroom, it can also target girls who have dropped out of the labor force. The two program elements complement each other, and are at least as successful as programs that exclusively target life skills or vocational skills. With the cost per girl in year two of the program at only 0.54 percent of household income at baseline, the program is a low-cost and scalable intervention that enables young girls to improve their life outcomes.
Source: Bandiera and others 2012.

29
ANNEx A
Economic data
Table GDP growth, by main sectors, 2004–12
A.1 Constant price = 1994; percent, unless otherwise stated
Indicator 2004–08 2009 2010 20112012
(preliminary)
Primary sector 3.7 12.4 10.2 2.2 3.1
Agriculture, forestry, and fishing 1.8 7.2 6.6 8.0 7.1
Mining and quarrying 7.1 20.2 15.2 –5.2 –2.7
Secondary sector 9.0 4.9 6.5 8.5 10.1
Manufacturing 4.0 0.5 4.2 8.0 7.2
Electricity, gas, and water 2.8 6.8 7.4 8.2 4.1
Construction 17.2 8.3 8.1 8.9 13.6
Tertiary sectora 6.1 3.8 6.6 7.8 7.3
Wholesale and retail 3.8 2.2 4.2 7.5 4.0
Restaurants, bars, and hotels 9.9 –13.9 10.2 7.9 –2.6
Transport, storage, and communications 14.9 7.6 14.9 13.7 12.8
Financial institutions and insurance 4.1 8.5 6.0 4.9 12.0
Real estate and business services 3.3 2.8 3.0 2.9 2.9
GDPb 5.8 6.0 7.6 6.8 7.2
GDP (less mining) 5.7 4.8 6.8 8.2 8.2
GNI 4.5 17.4 1.5 9.8 8.0
Memorandum items
GDP at current market prices (billions of kwacha) 39,525.9 64,615.6 77,666.6 93,344.4 105,983.0
GNI at current market prices (billions of kwacha) 35,363.7 62,684.6 71,128.0 87,730.3 100,211.8
Nominal GDP per capita (U.S. dollars) 810.7 1,092.5 1,224.9 1,408.6 1,469.1
Nominal GNI per capita (U.S. dollars) 724.7 1,059.9 1,121.8 1,323.8 1,389.1
a. Includes community, social, and personal services and others.b. Includes taxes (less financial intermediary services indirectly measured).Source: Zambian authorities, IMF, and World Bank staff estimates.

Z a m b i a E c o n o m i c b r i E f — J o b s c h a l l E n g E : r E a l i t i E s o n t h E g r o u n d
30
Table Central government f inances, 2008–13
A.2 Percent of GDP, unless otherwise stated
2008 2009 2010 20112012
(budget)2012
(preliminary)2013
(budget)
January–July 2013 (percent of budget)
Revenue 23.0 18.9 19.6 21.7 20.8 23.2 21.7 50.5
Tax 17.6 14.6 16.4 19.3 16.5 18.2 17.9 57.2
Income taxes 8.5 7.5 8.9 11.4 8.0 9.7 9.0 62.9
Value-added tax 4.0 3.8 4.1 4.3 4.5 4.5 5.0 52.9
Excise taxes 2.6 1.6 1.8 1.8 2.0 2.1 2.1 49.2
Customs duties 2.4 1.7 1.6 1.8 2.1 1.9 1.7 49.6
Nontax 1.3 1.4 1.4 1.6 2.5 2.9 2.6 53.5
Grants 4.1 2.9 1.8 0.8 1.8 2.1 1.3 17.2
Expenditure 23.9 21.3 22.6 23.9 24.6 26.3 25.8 53.5
Current expenditure 20.4 17.9 19.4 19.7 17.3 19.6 18.6 59.6
Out of which wages and salaries 8.2 8.2 8.1 7.9 8.2 8.9 9.1 53.8
Out of which interest payments 1.7 1.6 1.8 1.2 1.6 1.6 1.7 42.7
Out of which fertilizer support program 0.8 0.9 0.8 1.0 0.5 0.8 0.4 77.5
Out of which Strategic Food Reserve 0.1 0.3 1.6 1.8 0.3 0.3 0.2 43.3
Out of which fuel subsidy 0.0 0.0 0.1 0.3 0.0 0.7 0.0 122,393.4
Capital expenditure 3.5 3.4 3.2 4.2 7.3 6.7 7.2 37.8
Overall balance (including grants)a –1.5 –2.4 –3.1 –1.2 –4.1 –4.8 –4.5 72.8
Financing 1.5 2.4 3.1 1.2 4.1 4.8 4.5 72.8
External (net) 0.5 –0.1 0.3 1.2 3.0 3.7 2.9 48.2
Domestic (net) 1.1 2.5 2.7 0.0 1.1 1.1 1.5 119.6
Memorandum items
Primary balance 0.2 –0.8 –1.3 0.0 –2.5 –3.2 –2.8 90.7
Mining revenues 1.9 1.0 1.9 5.5 3.7 3.8 4.0 38.7
Stock of external debt 9.4 10.8 9.1 10.2 16.3
Stock of domestic debt, net 10.5 12.1 12.9 11.6 11.4
a. Includes fiscal measures, overfinancing, and budget carryovers.Source: Ministry of Finance, IMF, and World Bank estimates.

31
Table Selected balance of payment indicators, 2008–13
A.3 $ millions, unless otherwise stated
2008 2009 2010 20112012
(preliminary)2013
(projected)
Current account –1,049.5 538.4 1,144.7 705.4 9.9 –830.0
Trade balance 404.4 905.6 2,704.0 2,206.0 1,452.0 901.0
Exports 4,958.7 4,319.0 7,414.0 8,660.0 9,413.0 10,259.0
Out of which copper 3,684.5 3,179.3 5,767.9 6,660.2 6,294.0 6,646.0
Out of which nontraditional exports 876.2 899.7 1,190.0 1,596.6 2,712.2 3034.2
Imports –4,554.3 –3,413.4 –4,710.0 –6,454.0 –7,961.0 –9,358.0
Out of which petroleum –815.6 –535.8 –618.1 –530.5 –931.0 –1,025.0
Services (net) –615.4 –464.5 –628.1 –723.6 –770.1 –832.0
Income (net) –1,398.6 –418.7 –1,363.0 –1,155.0 –1,126.0 –1,323.0
Current transfers (net) 560.1 516.0 431.8 378.0 454.0 424.0
Capital and financial account 1,046.1 –782.0 –1,301.8 –480.9 645.7 428.0
Capital account 230.0 237.3 149.7 151.3 222.7 101.0
Financial account 816.1 –1,019.4 –1,451.5 –632.2 423.0 327.0
Out of which FDI and portfolio investments 932.6 350.4 707.5 1,181.0 1,880.0 2,192.0
Overall balance 12.7 540.1 115.0 202.0 727.0 –401.0
Financing: change in NIR (minus indicates an increase) –12.7 –540.1 –115.0 –202.0 –727.0 401.0
Memorandum items
Current account (percent of GDP) –7.2 3.8 7.1 3.7 0.0 –3.7
Gross international reserves 976 1,758 1,896 2,167 2,457 2,368
in months of prospective imports cover 2.8 3.7 3.0 2.8 2.8 2.4
GDP ($ millions) 14,493.6 14,011.3 16,170.0 19,204.0 20,590.0 22,239.0
FDI is foreign direct investment; NIR is net international reserves.Source: Zambian authorities and IMF estimates.

Z a m b i a E c o n o m i c b r i E f — J o b s c h a l l E n g E : r E a l i t i E s o n t h E g r o u n d
32
Table Zambia’s top 10 trading partners in 2011
A.4 Percentage of trade
Rank Total Importsa Exportsb Nontraditional exportsb
1 China (32.1) South Africa (35.8) China (44.7) China (12.5)
2 South Africa (26.0) Congo, Dem. Rep. (18.6) Korea, Rep. (8.1) Zimbabwe (9.9)
3 Korea, Rep. (4.9) China (9.9) Saudi Arabia (6.3) Belgium (6.8)
4 Saudi Arabia (3.7) Kuwait (4.7) South Africa (6.0) Malawi (5.2)
5 Egypt, Arab Rep. (3.6) India (3.5) Egypt, Arab Rep. (5.7) South Africa (5.2)
6 Italy (3.3) United Arab Emirates (3.4) Italy (5.0) Tanzania (2.6)
7 India (3.0) United Kingdom (2.7) Zimbabwe (3.5) Germany (2.4)
8 Zimbabwe (2.9) Japan (2.1) Belgium (2.4) United States (2.2)
9 Belgium (1.7) Kenya (1.8) Namibia (2.1) United Kingdom (2.2)
10 United States (1.6) United States (1.4) India (2.1) Japan (2.1)
a. Includes fiscal measures, overfinancing, and budget carryovers.Source: Ministry of Finance, IMF, and World Bank estimates.

33
ANNEx B
Basic definitions of labor force and employment
Section 2 uses survey data from the “Eco-nomic Activity” module of 2010 LCMS (CSO 2010b). The following definitions were used:
Labor force (economically active persons): The number of people of working age (ages 15–64) who are employed or who are unemployed and available for work in the last seven days before the survey day (the reference period).
Employed: Those people of working age who performed some work for pay, profit, bar-ter, or family gain in reference period. This definition corresponds to that of “currently employed” in the 2008 Labour Force Survey (CSO 2010a). The Labour Force Survey uses another measurement of employment called
“usually employed” which uses a reference period of 12 months.
Unemployed: Those people of working age who are not working but looking for work or means to do business.
Wage employment: People who reported themselves as in wage employment (employed by someone on fixed monthly, weekly, or daily wages or salary) or as an employer or partner, or a domestic employee.
Nonwage employment: People who are self-employed (running a business and using no hired labor), are in farming, fishing, or for-estry, are pieceworkers, or are unpaid family workers.
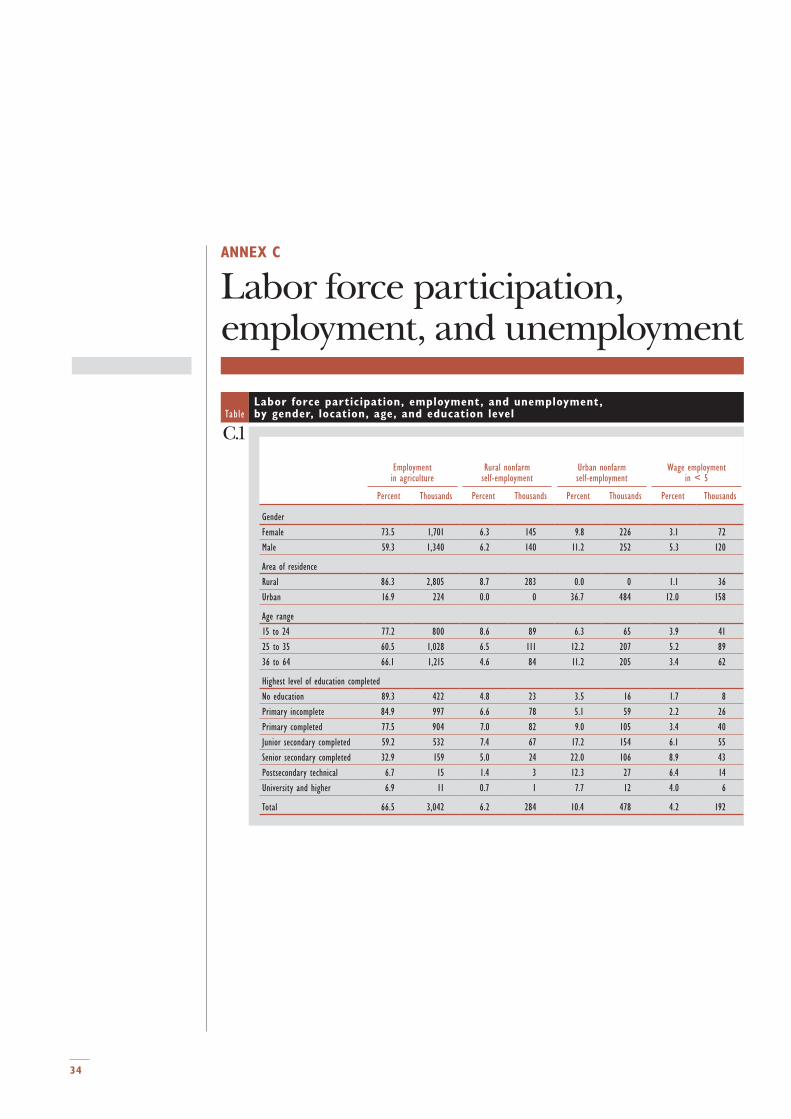
34
ANNEx C
Labor force participation, employment, and unemployment
TableLabor force participation, employment, and unemployment, by gender, location, age, and education level
C.1
Employment in agriculture
Rural nonfarm self-employment
Urban nonfarm self-employment
Wage employment in < 5
Wage employment in > 5 nonpublic sector
Wage employment in > 5 public sector Total
Labor force participation rate (labor
force as a share of working-age population)
Employment rate
(as share of labor force)
Unemployment rate
(as a share of labor force)
Percent Thousands Percent Thousands Percent Thousands Percent Thousands Percent Thousands Percent Thousands Percent Thousands Percent Percent Percent
Gender
Female 73.5 1,701 6.3 145 9.8 226 3.1 72 3.2 75 4.1 96 100.0 2,314 69.6 91.3 8.7
Male 59.3 1,340 6.2 140 11.2 252 5.3 120 10.3 232 7.8 176 100.0 2,260 72.9 91.7 8.3
Area of residence
Rural 86.3 2,805 8.7 283 0.0 0 1.1 36 1.1 37 2.8 92 100.0 3,252 77.8 96.9 3.1
Urban 16.9 224 0.0 0 36.7 484 12.0 158 20.7 273 13.7 182 100.0 1,321 60.6 80.4 19.6
Age range
15 to 24 77.2 800 8.6 89 6.3 65 3.9 41 2.8 29 1.2 13 100.0 1,037 43.7 81.9 18.1
25 to 35 60.5 1,028 6.5 111 12.2 207 5.2 89 8.8 149 6.8 116 100.0 1,700 88.4 92.2 7.8
36 to 64 66.1 1,215 4.6 84 11.2 205 3.4 62 7.0 128 7.7 142 100.0 1,837 92.7 97.3 2.7
Highest level of education completed
No education 89.3 422 4.8 23 3.5 16 1.7 8 0.6 3 0.1 1 100.0 472 91.3 96.0 4.0
Primary incomplete 84.9 997 6.6 78 5.1 59 2.2 26 1.0 11 0.3 3 100.0 1,175 72.0 96.2 3.8
Primary completed 77.5 904 7.0 82 9.0 105 3.4 40 2.2 25 0.8 10 100.0 1,166 65.5 94.1 5.9
Junior secondary completed 59.2 532 7.4 67 17.2 154 6.1 55 7.3 66 2.8 25 100.0 899 62.2 90.2 9.8
Senior secondary completed 32.9 159 5.0 24 22.0 106 8.9 43 20.3 98 10.9 52 100.0 483 82.6 75.1 24.9
Postsecondary technical 6.7 15 1.4 3 12.3 27 6.4 14 28.0 61 45.2 99 100.0 219 73.5 91.1 8.9
University and higher 6.9 11 0.7 1 7.7 12 4.0 6 28.1 45 52.6 84 100.0 160 84.4 95.4 4.6
Total 66.5 3,042 6.2 284 10.4 478 4.2 192 6.7 307 5.9 272 100.0 4,574 71.2 91.5 8.5

35
TableLabor force participation, employment, and unemployment, by gender, location, age, and education level
C.1
Employment in agriculture
Rural nonfarm self-employment
Urban nonfarm self-employment
Wage employment in < 5
Wage employment in > 5 nonpublic sector
Wage employment in > 5 public sector Total
Labor force participation rate (labor
force as a share of working-age population)
Employment rate
(as share of labor force)
Unemployment rate
(as a share of labor force)
Percent Thousands Percent Thousands Percent Thousands Percent Thousands Percent Thousands Percent Thousands Percent Thousands Percent Percent Percent
Gender
Female 73.5 1,701 6.3 145 9.8 226 3.1 72 3.2 75 4.1 96 100.0 2,314 69.6 91.3 8.7
Male 59.3 1,340 6.2 140 11.2 252 5.3 120 10.3 232 7.8 176 100.0 2,260 72.9 91.7 8.3
Area of residence
Rural 86.3 2,805 8.7 283 0.0 0 1.1 36 1.1 37 2.8 92 100.0 3,252 77.8 96.9 3.1
Urban 16.9 224 0.0 0 36.7 484 12.0 158 20.7 273 13.7 182 100.0 1,321 60.6 80.4 19.6
Age range
15 to 24 77.2 800 8.6 89 6.3 65 3.9 41 2.8 29 1.2 13 100.0 1,037 43.7 81.9 18.1
25 to 35 60.5 1,028 6.5 111 12.2 207 5.2 89 8.8 149 6.8 116 100.0 1,700 88.4 92.2 7.8
36 to 64 66.1 1,215 4.6 84 11.2 205 3.4 62 7.0 128 7.7 142 100.0 1,837 92.7 97.3 2.7
Highest level of education completed
No education 89.3 422 4.8 23 3.5 16 1.7 8 0.6 3 0.1 1 100.0 472 91.3 96.0 4.0
Primary incomplete 84.9 997 6.6 78 5.1 59 2.2 26 1.0 11 0.3 3 100.0 1,175 72.0 96.2 3.8
Primary completed 77.5 904 7.0 82 9.0 105 3.4 40 2.2 25 0.8 10 100.0 1,166 65.5 94.1 5.9
Junior secondary completed 59.2 532 7.4 67 17.2 154 6.1 55 7.3 66 2.8 25 100.0 899 62.2 90.2 9.8
Senior secondary completed 32.9 159 5.0 24 22.0 106 8.9 43 20.3 98 10.9 52 100.0 483 82.6 75.1 24.9
Postsecondary technical 6.7 15 1.4 3 12.3 27 6.4 14 28.0 61 45.2 99 100.0 219 73.5 91.1 8.9
University and higher 6.9 11 0.7 1 7.7 12 4.0 6 28.1 45 52.6 84 100.0 160 84.4 95.4 4.6
Total 66.5 3,042 6.2 284 10.4 478 4.2 192 6.7 307 5.9 272 100.0 4,574 71.2 91.5 8.5

Z a m b i a E c o n o m i c b r i E f — J o b s c h a l l E n g E : r E a l i t i E s o n t h E g r o u n d
36
Table Employment by economic sector
C.2Agriculture Rural nonfarm self-employment Urban nonfarm self-employment
Wage employment in < 5
Wage employment in > 5 nonpublic sector
Wage employment in > 5 public sector Total
Percent Thousands Percent Thousands Percent Thousands Percent Thousands Percent Thousands Percent Thousands Percent Thousands
Total primary sector 100.0 3,042 3.5 10 0.8 4 2.3 4 15.4 47 5.6 15 69.9 3,122
Total secondary sector 0.0 0 20.8 59 18.6 89 9.9 19 19.7 61 8.3 23 5.1 250
Total tertiary sector 0.0 0 75.8 215 80.6 385 87.8 169 64.9 199 86.1 234 25.0 1,202
Total 100.0 3,042 100.0 284 100.0 478 100.0 192 100.0 307 100.0 272 100.0 4,574
Primary sector
Agriculture and fishing 100.0 3,042 0.0 0 0.0 0 0.7 1 0.0 0 3.7 10 68.4 3,053
Mining 0.0 0 3.5 10 0.8 4 1.6 3 15.4 47 1.9 5 1.5 69
Secondary sector
Manufacturing 0.0 0 16.2 46 9.7 46 6.7 13 12.3 38 5.8 16 3.2 159
Electricity and utilities 0.0 0 0.0 0 0.2 1 0.0 0 0.5 1 1.3 3 0.1 6
Construction 0.0 0 4.5 13 8.8 42 3.2 6 6.9 21 1.3 3 1.8 86
Tertiary sector
Commerce 0.0 0 58.3 166 59.0 282 19.6 38 12.2 37 0.6 2 10.4 524
Transportation, storage, and communication 0.0 0 6.0 17 4.3 20 16.6 32 14.0 43 4.3 12 2.6 124
Financial, insurance, and real estate 0.0 0 0.1 0 1.7 8 1.3 2 5.0 15 4.4 12 0.8 38
Public administration services 0.0 0 2.2 6 1.3 6 11.1 21 15.1 46 72.6 197 6.1 277
Other services 0.0 0 9.2 26 14.3 68 39.3 75 18.7 57 4.2 11 5.1 238
Total 100.0 3,042 100.0 284 100.0 478 100.0 192 100.0 307 100.0 272 100.0 4,574

37
Table Employment by economic sector
C.2Agriculture Rural nonfarm self-employment Urban nonfarm self-employment
Wage employment in < 5
Wage employment in > 5 nonpublic sector
Wage employment in > 5 public sector Total
Percent Thousands Percent Thousands Percent Thousands Percent Thousands Percent Thousands Percent Thousands Percent Thousands
Total primary sector 100.0 3,042 3.5 10 0.8 4 2.3 4 15.4 47 5.6 15 69.9 3,122
Total secondary sector 0.0 0 20.8 59 18.6 89 9.9 19 19.7 61 8.3 23 5.1 250
Total tertiary sector 0.0 0 75.8 215 80.6 385 87.8 169 64.9 199 86.1 234 25.0 1,202
Total 100.0 3,042 100.0 284 100.0 478 100.0 192 100.0 307 100.0 272 100.0 4,574
Primary sector
Agriculture and fishing 100.0 3,042 0.0 0 0.0 0 0.7 1 0.0 0 3.7 10 68.4 3,053
Mining 0.0 0 3.5 10 0.8 4 1.6 3 15.4 47 1.9 5 1.5 69
Secondary sector
Manufacturing 0.0 0 16.2 46 9.7 46 6.7 13 12.3 38 5.8 16 3.2 159
Electricity and utilities 0.0 0 0.0 0 0.2 1 0.0 0 0.5 1 1.3 3 0.1 6
Construction 0.0 0 4.5 13 8.8 42 3.2 6 6.9 21 1.3 3 1.8 86
Tertiary sector
Commerce 0.0 0 58.3 166 59.0 282 19.6 38 12.2 37 0.6 2 10.4 524
Transportation, storage, and communication 0.0 0 6.0 17 4.3 20 16.6 32 14.0 43 4.3 12 2.6 124
Financial, insurance, and real estate 0.0 0 0.1 0 1.7 8 1.3 2 5.0 15 4.4 12 0.8 38
Public administration services 0.0 0 2.2 6 1.3 6 11.1 21 15.1 46 72.6 197 6.1 277
Other services 0.0 0 9.2 26 14.3 68 39.3 75 18.7 57 4.2 11 5.1 238
Total 100.0 3,042 100.0 284 100.0 478 100.0 192 100.0 307 100.0 272 100.0 4,574

Z a m b i a E c o n o m i c b r i E f — J o b s c h a l l E n g E : r E a l i t i E s o n t h E g r o u n d
38
Table Labor force participation, employment, and unemployment, by province and stratum
C.3 Percent
Composition of employment (working-age population) Labor force participation rate (as a share of
working-age population)
Employment rate
(as a share of labor force)
Unemployment rate
(as a share of labor force)Agriculture
Rural nonfarm self-employment
Urban self-employment
Informal wage employment
Formal wage employment nonpublic sector
Formal wage employment public sector Total
Province
Central 73.3 7.1 7.2 2.9 3.7 5.7 100.0 71.8 93.1 6.9
Copperbelt 35.1 2.0 24.7 9.4 18.7 10.2 100.0 62.5 79.4 20.6
Eastern 84.5 6.9 2.8 1.5 1.9 2.4 100.0 82.2 97.5 2.5
Luapula 80.9 10.9 3.3 0.9 0.8 3.2 100.0 77.7 96.4 3.6
Lusaka 17.9 3.9 31.0 13.3 21.3 12.6 100.0 61.2 84.3 15.7
Northern 83.4 6.2 4.3 1.2 1.3 3.6 100.0 76.4 96.7 3.3
North Western 79.3 4.3 5.5 1.8 4.2 4.9 100.0 68.5 94.5 5.5
Southern 71.6 7.5 7.6 3.1 4.3 5.8 100.0 73.5 92.6 7.4
Western 81.4 7.5 3.5 1.9 1.4 4.4 100.0 74.9 95.0 5.0
Total 66.5 6.2 10.4 4.2 6.7 5.9 100.0 71.2 91.5 8.5
Stratum
Small scale agricultural 88.4 7.6 0.0 0.9 0.9 2.3 100.0 78.8 97.2 2.8
Medium scale agricultural 88.6 7.0 0.0 1.2 0.6 2.6 100.0 72.5 96.5 3.5
Large scale agricultural 92.4 5.3 0.0 0.2 0.2 1.9 100.0 69.6 96.2 3.8
Nonagriculture rural 49.8 28.1 0.0 4.3 5.9 12.0 100.0 67.6 92.3 7.7
Low-cost urban 19.7 0.0 39.6 12.8 18.1 9.8 100.0 61.1 80.4 19.6
Medium-cost urban 10.2 0.0 30.7 8.9 26.6 23.6 100.0 58.9 80.0 20.0
High-cost urban 8.0 0.0 25.5 11.2 29.6 25.6 100.0 60.4 81.8 18.2
Total 66.5 6.2 10.4 4.2 6.7 5.9 100.0 71.2 91.5 8.5

39
Table Economic activity of Zambians ages 15–35 and 36–64
C.4 Percent
Ages 15–35 Ages 36–64
Male Female Total Male Female Total
Area of residence
Rural 60.9 60.1 60.5 61.6 65.4 63.5
Urban 39.1 39.9 39.5 38.4 34.6 36.5
Total 100.0 100.0 100.0 100.0 100.0 100.0
Employment status
Employed 54.9 54.5 54.7 94.3 86.1 90.2
Unemployed 7.7 7.3 7.5 2.2 2.8 2.5
Full-time student 32.5 24.8 28.5 0.1 0.3 0.2
Not in labor force or education 4.9 13.4 9.4 3.3 10.8 7.1
Total 100.0 100.0 100.0 100.0 100.0 100.0
Employment sector
Agriculture 58.3 72.7 65.8 58.6 73.0 65.6
Nonfarm self-employment 18.7 15.5 17.0 14.9 16.4 15.6
Wage employment 22.9 11.9 17.2 26.5 10.6 18.8
Total 100.0 100.0 100.0 100.0 100.0 100.0
40
ANNEx D
Determinants of wages in wage employment sector
An econometric model was estimated to understand what explains the variation of wages among wage employees. Dummy vari-ables were used for the highest education level (omitted variable no education), size of the business (omitted variable size less than 5), employment sectors (omitted vari-able private sector), gender (omitted vari-able female), and location (omitted rural).
Potential experience is defined as age minus years of schooling minus 5. Percentage impact on earnings is calculated as
100 * (exp(beta – 0.5 * Var(beta)) – 1).The preferred specification (3) shows that
having a university education increases wages by 422 percent and being in the central gov-ernment by 17 percent everything else the same.

41
OLS regression Percentage impact on earnings
(1) (2) (3) (1) (2) (3)
Variables ln_earnings ln_earnings ln_earnings ln_earnings ln_earnings ln_earnings
Dprimary 0.240*** 0.179*** 0.100* 18.0% 11.0% 2.6%
(0.0632) (0.0580) (0.0591)
0.149 0.149 0.149
Dsecondary 0.988*** 0.840*** 0.629*** 143.5% 110.0% 70.1%
(0.0552) (0.0545) (0.0544)
0.196 0.196 0.196
Dpostsec 2.052*** 1.800*** 1.546*** 660.8% 491.4% 358.7%
(0.0665) (0.0705) (0.0691)
0.0455 0.0455 0.0455
Duniversity 2.216*** 1.943*** 1.666*** 804.3% 588.2% 421.7%
(0.0611) (0.0707) (0.0650)
0.0281 0.0281 0.0281
experience 0.0344*** 0.0306*** 0.0274***
(0.00501) (0.00494) (0.00459)
220.7 220.7 220.7
experience2 –0.000386*** –0.000343*** –0.000343***
(0.000112) (0.000108) (0.000102)
629,828 629,828 629,828
Dcentralgov3 0.251*** 0.271*** 14.4% 16.7%
(0.0440) (0.0402)
0.233 0.233
Dlocalgov3 0.121* 0.0406 11.6% 3.0%
(0.0714) (0.0727)
0.0227 0.0227
Dquasigov3 0.517*** 0.442*** 64.3% 52.4%
(0.0658) (0.0587)
0.0414 0.0414
Dintorg3 0.620*** 0.437*** 85.6% 54.5%
(0.225) (0.159)
0.00351 0.00351
Dothersector3 –0.322*** –0.114** –31.7% –15.9%
(0.0434) (0.0470)
0.118 0.118
Dmale 0.213*** 9.2%
(0.0319)
0.250
Durban 0.137*** 1.4%
(0.0505)
0.247
Dformal 0.484*** 45.8%
(0.0381)
0.214
Constant 12.02*** 12.18*** 11.78***
(0.0694) (0.0693) (0.0762)
Observations 7,649 7,529 7,459
R-squared 0.430 0.460 0.499
Note: Standard errors in parentheses, variance below.

42
1. By July 2013, 54 percent of the wage budget was spent, yet the significant public sector wage award will take effect only in mid-September 2013. In March 2013 the government awarded public sector workers salary increases (effective mid-September 2013) that exceed the 2013 public sector wage budget by 18 percent in nominal terms and the 2012 budget by 46 percent. The wage bill is expected to grow another 1.3 percent of GDP in 2014 as the full effect of the 2013 wage negotiations comes into effect.
2. By July 2013 the Farmer Input Support Program had exhausted 78 percent of the 2013 budget and yet expectations are that the program will be scaled up.
3. This subsidy is generally not budgeted upfront, but losses in fuel supply are accommodated through the supplemen-tary budget.
4. Adjusted net savings are equal to net national savings plus education spend-ing but minus energy depletion, mineral depletion, and net forest depletion.
5. Zambia remains eligible for World Bank concessional financing under Interna-tional Development Association terms. But its increasing gross national income per capita implies that it is soon likely to graduate to International Bank for Reconstruction and Development terms.
6. Effective lending rates are calculated as the ratio of interest income to loans; effective deposit rates are calculated as the ratio of interest expenses to deposits.
7. Cross-country comparisons draw from World Bank databases, which contain differences in country reporting and coverage. As such, the comparisons are only illustrative. The expected median is based on a global regression model with country characteristics as explanatory variables.
8. The interest rate spread is the difference between the reported weighted lending base rate and the 30-day deposit rate. The net interest margin is the average of net interest income as a percentage of the earning assets of commercial banks.
9. For additional information on interest rate spread decompositions, see Randall (1998), Beck and others (2010), and Beck and Fuchs (2004).
10. In the discussion that follows, “youth” and “young people” refer to peoples ages 15–35, unless otherwise noted. The labor force is defined using the working-age population between ages 15 and 64 (annex B).
11. Demographic projections are based on World Bank (forthcoming a), and using fertility assumptions based on the medium-fertility variant of the United Nations, Department of Economic and Social Affairs, Population Division (2011), which assumes a fertility rate decline from 6.2 children per woman in 2010 to 2.82 children per woman in 2100.
12. Estimated number of youth turning 15 between 2011 and 2040, based on United Nations medium-fertility variant projections.
Notes

43
13. This section uses LCMS 2010 data to estimate various measures of eco-nomic activity such as participation rate, employment, and unemployment. Another source for labor force statistics for Zambia is the Labour Force Surveys; the latest available Labour Force Sur-veys data are for 2008 (CSO 2010a). This section uses definitions of labor force, employment, and unemployment that are similar to the LFS 2008 (see annex B) but estimates may differ slightly. These differences are generally not material to broad conclusions presented in this section. Some researchers have pointed out that in a low-income country labor and employment estimates developed from household surveys such as the LCMS 2010 are sensitive to the type of questions, their framing, recall periods, and computation methods (World Bank 2013a). For example, while a seven-day reference period is an international stan-dard, using it in a low-income country will underestimate, and possibly distort, analysis of employment outcomes such as unemployment and household liveli-hoods. These findings should be kept in mind while interpreting and using data reported in this section. The main advantage of using LCMS data is that it allows linking poverty status of house-holds with economic activity, allowing a much richer picture of the poverty and employment dynamic.
14. Zambia’s urbanization rate is 40 percent compared with 37 percent for the rest of Sub-Saharan Africa. Employment in agriculture ranges from 18 percent in Lusaka province to 85 percent in East-ern province. Except for the Lusaka and Copperbelt provinces, all other provinces have more than 70 percent of employment in agriculture (annex table C.3).
15. Construction is often looked on as a source of job growth, with its share in total employment a rather small 1.8 per-cent. Most of the construction jobs are in self-employment or informal wage categories.
16. Zambians often work in multiple jobs as a mixed livelihood strategy. The quali-tative study also records evidence of
multiple jobs on part of the youth. The total number of self-employed and home businesses is most likely much higher if second jobs are also counted.
17. For the purpose of this section we define microenterprises as those where the organization has fewer than five employees.
18. This statistical exercise is based on a sample of about 7,500 respondent wage employees. Data are from 2010, and wages in the public and the private sec-tor could have changed since then.
19. This shift derives mainly from an increase in agricultural productivity that sustains higher standards of living.
20. As mentioned in section 1, the Cen-tral Statistical Office is in the process of rebasing national accounts. It is likely that the share of primary sector (which includes mining) will go up after rebasing.
21. Using Labour Force Survey data for com-puting employment growth and analyz-ing change in employment structure has to be treated with caution. For example, employment data by industry show huge swings between 2005 and 2008 that do not look plausible.
22. This means a formal employment “elas-ticity” of growth less than 0.2.
23. These data relate to 2008. As section 1 discussed, manufacturing and services have grown fast in the past few years. And it is likely that growth of formal jobs has accelerated in the past five years. But still the base of formal employment is too small to make a big dent in the over-all employment structure in the near future.
24. This unemployment rate is high when compared with Sub-Saharan peers, such as Ghana (5.2 percent in 2005), Mozam-bique (1.8 percent in 2008), Rwanda (0.9 percent in 2010), and Uganda (0.7 percent in 2010). Zambia’s high unemployment rate is perhaps explained by the higher rate of urbanization.
25. In the discussion that follows, a real per capita consumption aggregate is used to assess poverty status, according to an urban and rural poverty line (180,551 kwacha per month per adult equivalent and 146,054 kwacha per month per adult

Z a m b i a E c o n o m i c b r i E f — J o b s c h a l l E n g E : r E a l i t i E s o n t h E g r o u n d
44
equivalent, respectively). For a more detailed description of the methodology, see World Bank (2012d), 115–17.
26. See www.ucw-project.org/Pages/Tables.aspx?id=1393, based on CSO (2010a).
27. Zambia’s education system comprises primary (grades 1–7), junior second-ary (grades 8–9), and senior secondary (grades 10–12). Primary education is compulsory.
28. SACMEQ III results are based on assess-ments covering a nationally representa-tive sample of grade 6 students attending mainstream registered primary schools. Mean literacy and numeracy scores in Zambia on SACMEQ III are 434 and 435 (Hungi and others 2010). Both are more than three-quarters of a standard devia-tion below the mean scores for literacy (512) and numeracy (510) across all par-ticipating countries.
29. Basic literacy is defined as being able to “interpret meaning in a short and sim-ple text”; basic numeracy is measured as being able to perform “multistep
operations using addition and subtrac-tion, fractions, and units of measure-ment” (Hungi and others 2010).
30. Based on comparisons of SACMEQ I, II, and III. SACMEQ I and II can be accessed at www.sacmeq.org.
31. Socioeconomic status in the SACMEQ is defined based on assets, parents’ education levels, and housing materials (Hungi and others 2010).
32. Note that the challenge of interpreting enterprise survey results is that it is not possible to know whether skills were a constraint for those firms that failed or that never started in the first place.
33. The constraints approach is general and can be applied to other industries.
34. This subsection is based on World Bank (2013d).
35. Farm blocks are a special public-private partnership in which the government offers land to a foreign or domestic investor and assists with related invest-ments in roads, utilities, and perhaps marketing or processing facilities.

45
Afrobarometer. 2013. “The Performance of the PF Government in the Past One Year: Results from the Afrobarometer Round 5 Survey in Zambia, 04 July 2013.” www.afrobarometer.org/files/documents/media_briefing/zam_r5_presentation1.pdf.
Bandiera, Oriana, Niklas Buehren, Robin Burgess, Markus Goldstein, Selim Gulesci, Imram Rasul, and Munshi Sulaiman. 2012. “Empowering Adolescent Girls: Evi-dence from a Randomized Control Trial in Uganda.” http://econ.lse.ac.uk/staff/rburgess/wp/.
Bank of Zambia. 2012. “Foreign Private Investment and Investor Perception Sur-vey 2012.” Lusaka.
Beck, Thortsen, Robert Cull, Michael Fuchs, Jared Getenga, Peter Gatere, John Randa, and Mircea Trandafir. 2010. “Banking Sec-tor Stability, Efficiency, and Outreach in Kenya.” Policy Research Working Paper 5442, World Bank, Washington, DC.
Beck, Thortsen, and Michael Fuchs. 2004. “Structural Issues in the Kenyan Finan-cial System: Improving Competition and Access.” Policy Research Working Paper 3363, World Bank, Washington, DC.
CSO (Central Statistical Office of Zambia). 2010a. “Zambia Labour Force Survey 2008.” Labour Statistics Branch, Lusaka.
———. 2010b. “Zambia Living Conditions Monitoring Survey 2010.” Lusaka.
Cuesta, Jose, Pamela Kabaso, and Pablo Suarez-Becerra. 2012. “How Pro-poor and Progressive is Social Spending in Zam-bia?” Policy Research Working Paper 6052, World Bank, Washington, DC.
Dinh, Hinh T. 2013. Light Manufacturing in Zambia: Job Creation and Prosperity in a Resource-Based Economy. Washington, DC: World Bank.
Feyen, Erik, and Katie Kibuuka. 2012. “Fin-Stats 2012: A Ready-to-use Tool to Bench-mark Financial Sectors across Countries and Time.” World Bank, Washington, DC.
Fuglie, Keith O. 2010. “Sources of Growth in Indonesian Agriculture.” Journal of Productivity Analysis 33 (3): 225–40. http://dx.doi.org.ezproxy.cul.columbia.edu/10.1007/s11123–009–0150-x.
Government of Zambia. 2008. “Zambia: Public Financial Management Perfor-mance Report and Indicators.” Ministry of Finance, Lusaka.
———. 2012a. “Zambia: Public Financial Management Performance Report and Indicators.” Ministry of Finance, Lusaka.
———. 2012b. “Strategy Paper on Industrial-ization and Job Creation.” Lusaka.
———. 2013. “Public Financial Management (PFM) Strategy for the Government of Zambia.” Ministry of Finance, Lusaka.
Guarcello, Lorenzo, Irina Kovrova, and Scott Lyon. 2012. “Youth Disadvantage in the Labour Market: Empirical Evidence from Nine Developing Countries.” Background Paper for the Education for All Global Monitor-ing Report 2012. United Nations Educational, Scientific and Cultural Organization, Paris.
Himanshu. 2006. “Agrarian Crisis and Wage Labour: A Regional Perspective.” Indian Journal of Labour Economics 49 (4): 827–46.
Hungi, Njora, Demus Makuwa, Kenneth Ross, Mioko Saito, Stephanie Dolata, Frank van
References

Z a m b i a E c o n o m i c b r i E f — J o b s c h a l l E n g E : r E a l i t i E s o n t h E g r o u n d
46
Cappelle, Laura Paviot, and Jocelyne Vel-lien. 2010. “SACMEQ III Project Results: Pupil Achievement Levels in Reading and Mathematics.” Southern and Eastern Africa Consortium for Monitoring Educa-tional Quality.
Ianchovichina, Elena, and Susanna Lund-strom. 2008. “What Are the Constraints to Inclusive Growth in Zambia?” Background to World Bank 2008 CAS.
Jedwab, Remi. 2012, “Why Is African Urban-ization Different? Evidence from Expe-rience in Ghana and Ivory Coast.” www.econ.yale.edu/conference/neudc11/papers/paper_170.pdf.
Moono, Herryman, and Neil Rankin. 2012. “Education and Employment in Zambia: Evidence from a Scoping Exercise.” Occa-sional Paper, International Growth Centre and Stellenbosch University, London.
Randall, Ruby. 1998. “Interest Rate Spreads in the Eastern Caribbean.” IMF Working Paper WP/98/59, International Monetary Fund, Washington, DC.
Reimers, Malte, and Stephan Klasen. 2011. “Revisiting the Role of Education for Agri-cultural Productivity.” Discussion Papers 214, Ibero-American Institute for Eco-nomic Research, Göttingen, Germany.
Schultz, T. Paul. 1988. “Education Invest-ments and Returns.” In Handbook of Devel-opment Economics, Edition 1, Volume 1, ed. Hollis Chenery and T. N. Srinivasan, 543–630. Amsterdam: Elsevier.
UNICEF (United Nations Children’s Fund). 2005. Early Marriage: A Harmful Traditional Practice—A Statistical Exploration. New York. www.unicef.org/publications/files/Early_Marriage_12.lo.pdf.
United Nations, Department of Economic and Social Affairs, Population Division. 2011. World Population Prospects: The 2010 Revision. New York: United Nations. CD-ROM.
World Bank. 2008. “The Economic Empower-ment of Young People in Zambia.” Poverty Reduction and Economic Management, Africa Region, Lusaka.
———. 2009. “Zambia: Second Investment Climate Assessment Business Environment Issues in Diversifying Growth.” Volume 1: Summary. World Bank, Washington, DC.
———. 2010. “Public Expenditure Review 2010.” World Bank, Poverty Reduction and Economic Management, Africa Region, Lusaka.
———. 2011. World Development Report 2012: Gender Equality and Development. Washing-ton, DC.
———. 2012a. World Development Indicators 2012. Washington, DC.
———. 2012b. World Development Report 2013: Jobs. Washington, DC.
———. 2012c. Zambia Economic Brief: Recent Economic Developments and the State of Basic Human Opportunities for Children. Decem-ber 2012. Washington, DC.
———. 2012d. “Zambia Poverty Assessment: Stagnant Poverty and Inequality in a Nat-ural Resource-Based Economy.” Poverty Reduction and Economic Management Network, Africa Region, Washington, DC.
———. 2013a. “Different Dreams, Same Bed: Collecting, Using, and Interpret-ing Employment Statistics in Sub-Saharan Africa—The Case of Uganda.” Poverty Reduction and Economic Management Policy Research Paper 6436, World Bank, Africa Region, Regional Poverty Reduction and Economic Management Unit, Wash-ington, DC.
———. 2013b. Global Economic Prospects, June 2013: Less Volatile, but Slower Growth. Wash-ington, DC.
———. 2013c. “Public Debt Management Reform Plan for Zambia.” World Bank, Poverty Reduction and Economic Manage-ment Network, Lusaka.
———. 2013d. “Zambia: The Problem of Rural Employment, Policy Note.” Poverty Reduction and Economic Management Network, Lusaka.
———. Forthcoming a. “Africa Regional Demographic Study.” Washington, DC.
———. Forthcoming b. “Regional Study: Youth Employment in Sub-Saharan Africa.” Washington, DC.
ZIPAR (Zambia Institute for Policy Analysis and Research). 2013. “Youth Employment and Unemployment in Zambia—Percep-tions, Experiences and Aspirations of Young Job Seekers, Entrepreneurs, New Entrants to the Job Market and Students.” Lusaka.

ZAMBIA ECONOMIC BRIEF
The World Bank GroupLusaka Country Office2nd Floor, Banc ABC House746 Church RoadLusakaTel: +260 211 373200
+260 211 373217www.worldbank.org/Zambia