Embed Size (px)
Citation preview
Zanaga Project
Investor Presentation
July 2015

This document, which is personal to the recipient, has been issued by Zanaga Iron
Ore Company Limited (the “Company”). This document does not constitute or form
part of any offer or invitation to sell or issue, or any solicitation of any offer to purchase
or subscribe for, any securities of the Company in any jurisdiction, nor shall any part of
it nor the fact of its distribution form part of or be relied on in connection with any
contract or investment decision relating thereto, nor does it constitute a
recommendation or inducement to enter into any contract or commitment regarding
the securities of the Company. In particular, this document and the information
contained herein does not constitute an offer of securities for sale in the United States.
This document is being supplied to you solely for your information. The information in
this document has been provided by the Company or obtained from publicly available
sources. No reliance may be placed for any purposes whatsoever on the information
or opinions contained in this document or on its completeness. No representation or
warranty, express or implied, is given by or on behalf of the Company or any of the
Company’s directors, officers or employees or any other person as to the accuracy or
completeness of the information or opinions contained in this document and no liability
whatsoever is accepted by the Company or any of the Company’s members, directors,
officers or employees nor any other person for any loss howsoever arising, directly or
indirectly, from any use of such information or opinions or otherwise arising in
connection therewith.
This document and its contents are confidential and may not be reproduced,
redistributed or passed on, directly or indirectly, to any other person or published, in
whole or in part, for any purpose. This document is only addressed to and directed at
persons in member states of the European Economic Area who are “qualified
investors” within the meaning of Article 2(1)(e) of the Prospectus Directive (Directive
2003/71/EC) (“Qualified Investors”). In addition, in the United Kingdom, this document
is being distributed only to, and is directed only at, Qualified Investors (i) who have
professional experience in matters relating to investments falling within Article 19(5) of
the Financial Services and Markets Act 2000 (Financial Promotion) Order 2005, as
amended (the “Order”) and Qualified Investors falling within Article 49(2)(a) to (d) of
the Order, and (ii) to whom it may otherwise lawfully be communicated (all such
persons together being referred to as “relevant persons”). This document must not be
acted on or relied on (i) in the United Kingdom, by persons who are not relevant
persons, and (ii) in any member state of the European Economic Area other than the
United Kingdom, by persons who are not Qualified Investors. Any investment or
investment activity to which this document relates is available only to (i) in the United
Kingdom, relevant persons, and (ii) in any member state of the European Economic
Area other than the United Kingdom, Qualified Investors, and will be engaged in only
with such persons.
Neither this document nor any copy of it may be taken or transmitted into the
United States of America, its territories or possessions or distributed, directly or
indirectly, in the United States of America, its territories or possessions. Neither
this document nor any copy of it may be taken or transmitted into Australia,
Canada, Japan or the Republic of South Africa or to any securities analyst or other
person in any of those jurisdictions. Any failure to comply with this restriction may
constitute a violation of United States, Australian, Canadian, Japanese or South
African securities law. The distribution of this document in other jurisdictions may
be restricted by law and persons into whose possession this document comes
should inform themselves about, and observe, any such restrictions.
Nothing in this document or in the documents referred to in it should be considered
as a profit forecast. Past performance of the Company or its shares cannot be
relied on as a guide to future performance.
Certain statements, beliefs and opinions in this document are forward-looking,
which reflect the Company’s or, as appropriate, the Company’s directors’ current
expectations and projections about future events. By their nature, forward-looking
statements involve a number of risks, uncertainties and assumptions that could
cause actual results or events to differ materially from those expressed or implied
by the forward-looking statements. These risks, uncertainties and assumptions
could adversely affect the outcome and financial effects of the plans and events
described herein. Forward-looking statements contained in this document
regarding past trends or activities should not be taken as a representation that
such trends or activities will continue in the future. The Company will not undertake
any obligation to release publicly any revisions to these forward-looking statements
to reflect events, circumstances or unanticipated events occurring after the date of
this presentation, except as required by law or by any appropriate regulatory
authority. You should not place undue reliance on forward-looking statements,
which speak only as of the date of this document.
This document has been prepared in compliance with English law and English
courts will have exclusive jurisdiction over any disputes arising from or connected
with this document.
By attending the presentation to which this document relates or by accepting this
document you will be taken to have represented, warranted and undertaken that: (i)
you are a relevant person (as defined above); (ii) you have read and agree to
comply with the contents of this notice; and (iii) you will not at any time have any
discussion, correspondence or contact concerning the information in this document
with any of the directors or employees of the Company, or their respective
subsidiaries nor with any of their suppliers, customers, sub contractors or any
governmental or regulatory body without the prior written consent of the Company.
Disclaimers
Africa’s position in the global iron ore landscape
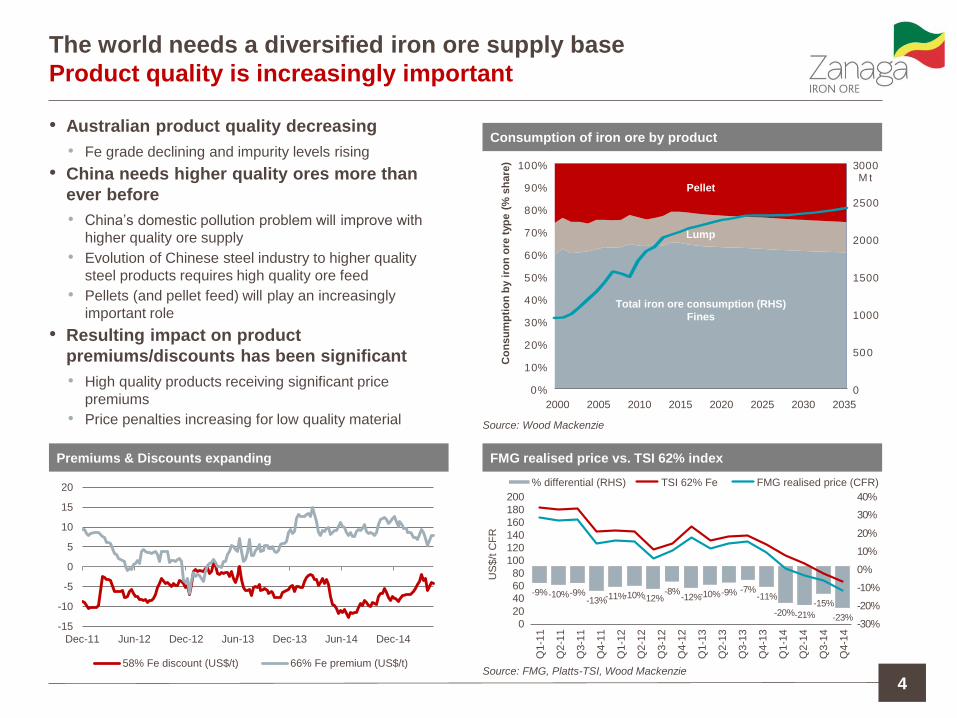
The world needs a diversified iron ore supply base
Product quality is increasingly important
4
• Australian product quality decreasing
• Fe grade declining and impurity levels rising
• China needs higher quality ores more than
ever before
• China’s domestic pollution problem will improve with
higher quality ore supply
• Evolution of Chinese steel industry to higher quality
steel products requires high quality ore feed
• Pellets (and pellet feed) will play an increasingly
important role
• Resulting impact on product
premiums/discounts has been significant
• High quality products receiving significant price
premiums
• Price penalties increasing for low quality material
Consumption of iron ore by product
-15
-10
-5
0
5
10
15
20
Dec-11 Jun-12 Dec-12 Jun-13 Dec-13 Jun-14 Dec-14
58% Fe discount (US$/t) 66% Fe premium (US$/t)
Premiums & Discounts expanding
0
5 0 0
1 0 0 0
1 5 0 0
2 0 0 0
2 5 0 0
3 0 0 0
0 %
1 0 %
2 0 %
3 0 %
4 0 %
5 0 %
6 0 %
7 0 %
8 0 %
9 0 %
1 0 0 % M t
Co
ns
um
pti
on
by i
ron
ore
typ
e (
% s
ha
re)
2000 2005 2010 2015 2020 2025 2030 2035
Pellet
Lump
Total iron ore consumption (RHS)
Fines
Source: Wood Mackenzie
FMG realised price vs. TSI 62% index
- 9 % - 1 0 % - 9 % - 1 3 % - 1 1 % - 1 0 % - 1 2 %
- 8 % - 1 2 % - 1 0 % - 9 % - 7 %
- 1 1 %
- 2 0 % - 2 1 %
- 1 5 %
- 2 3 % - 3 0 %
- 2 0 %
- 1 0 %
0 %
1 0 %
2 0 %
3 0 %
4 0 %
0
2 0
4 0 6 0
8 0
1 0 0
1 2 0
1 4 0
1 6 0
1 8 0
2 0 0 U
S$/t
CF
R
Q1-1
1
Q2-1
1
Q3-1
1
Q4-1
1
Q1-1
2
Q2-1
2
Q3-1
2
Q4-1
2
Q1-1
3
Q2-1
3
Q3-1
3
Q4-1
3
Q1-1
4
Q2-1
4
Q3-1
4
Q4-1
4
% differential (RHS) TSI 62% Fe FMG realised price (CFR)
Source: FMG, Platts-TSI, Wood Mackenzie
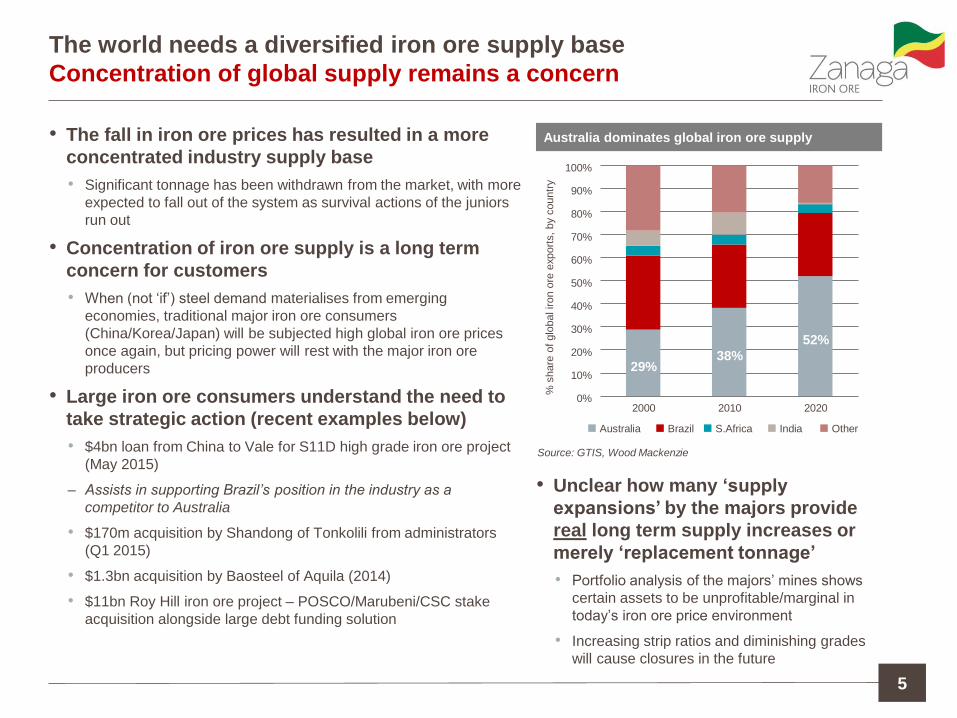
The world needs a diversified iron ore supply base
Concentration of global supply remains a concern
5
• The fall in iron ore prices has resulted in a more
concentrated industry supply base
• Significant tonnage has been withdrawn from the market, with more
expected to fall out of the system as survival actions of the juniors
run out
• Concentration of iron ore supply is a long term
concern for customers
• When (not ‘if’) steel demand materialises from emerging
economies, traditional major iron ore consumers
(China/Korea/Japan) will be subjected high global iron ore prices
once again, but pricing power will rest with the major iron ore
producers
• Large iron ore consumers understand the need to
take strategic action (recent examples below)
• $4bn loan from China to Vale for S11D high grade iron ore project
(May 2015)
– Assists in supporting Brazil’s position in the industry as a
competitor to Australia
• $170m acquisition by Shandong of Tonkolili from administrators
(Q1 2015)
• $1.3bn acquisition by Baosteel of Aquila (2014)
• $11bn Roy Hill iron ore project – POSCO/Marubeni/CSC stake
acquisition alongside large debt funding solution
• Unclear how many ‘supply
expansions’ by the majors provide
real long term supply increases or
merely ‘replacement tonnage’
• Portfolio analysis of the majors’ mines shows
certain assets to be unprofitable/marginal in
today’s iron ore price environment
• Increasing strip ratios and diminishing grades
will cause closures in the future
Australia dominates global iron ore supply
29% 38%
52%
0%
10%
20%
30%
40%
50%
60%
70%
80%
90%
100%
2000 2010 2020
% s
hare
of
glo
bal iron o
re e
xport
s,
by c
ountr
y
Other India S.Africa Brazil Australia
Source: GTIS, Wood Mackenzie
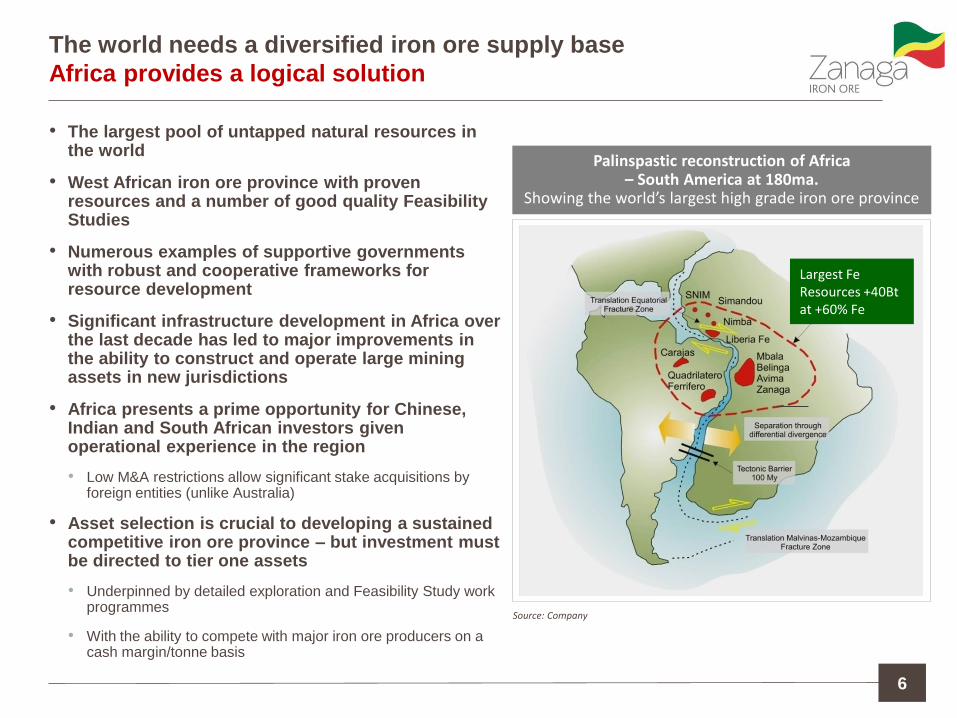
The world needs a diversified iron ore supply base
Africa provides a logical solution
• The largest pool of untapped natural resources in the world
• West African iron ore province with proven resources and a number of good quality Feasibility Studies
• Numerous examples of supportive governments with robust and cooperative frameworks for resource development
• Significant infrastructure development in Africa over the last decade has led to major improvements in the ability to construct and operate large mining assets in new jurisdictions
• Africa presents a prime opportunity for Chinese, Indian and South African investors given operational experience in the region
• Low M&A restrictions allow significant stake acquisitions by foreign entities (unlike Australia)
• Asset selection is crucial to developing a sustained competitive iron ore province – but investment must be directed to tier one assets
• Underpinned by detailed exploration and Feasibility Study work programmes
• With the ability to compete with major iron ore producers on a cash margin/tonne basis
6
Palinspastic reconstruction of Africa – South America at 180ma.
Showing the world’s largest high grade iron ore province
Largest Fe Resources +40Bt at +60% Fe
Source: Company
Zanaga Project Overview
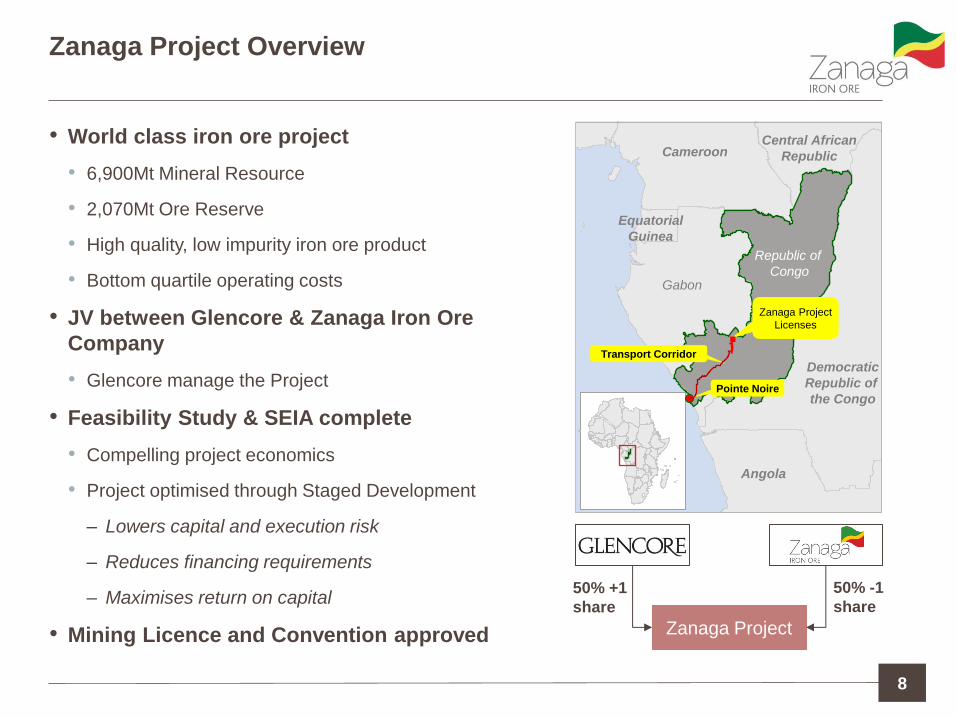
Zanaga Project Overview
• World class iron ore project
• 6,900Mt Mineral Resource
• 2,070Mt Ore Reserve
• High quality, low impurity iron ore product
• Bottom quartile operating costs
• JV between Glencore & Zanaga Iron Ore
Company
• Glencore manage the Project
• Feasibility Study & SEIA complete
• Compelling project economics
• Project optimised through Staged Development
– Lowers capital and execution risk
– Reduces financing requirements
– Maximises return on capital
• Mining Licence and Convention approved
8
Equatorial
Guinea
Gabon
Republic of
Congo
Cameroon Central African
Republic
Democratic
Republic of
the Congo
Angola
Zanaga Project
Licenses
Pointe Noire
Transport Corridor
Zanaga Project
50% -1
share
50% +1
share
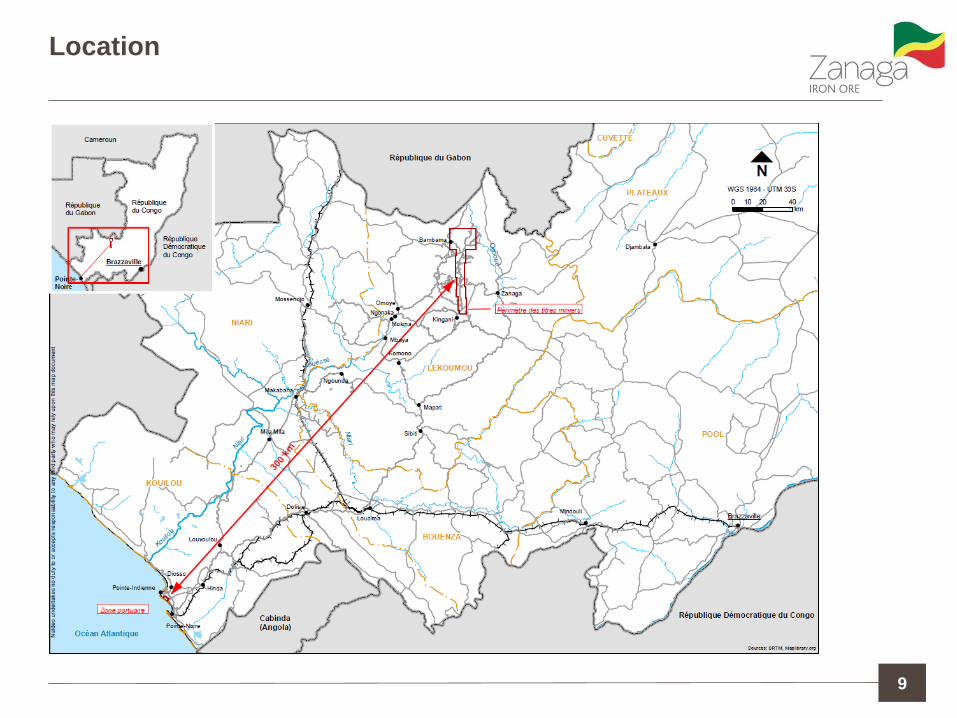
Location
9
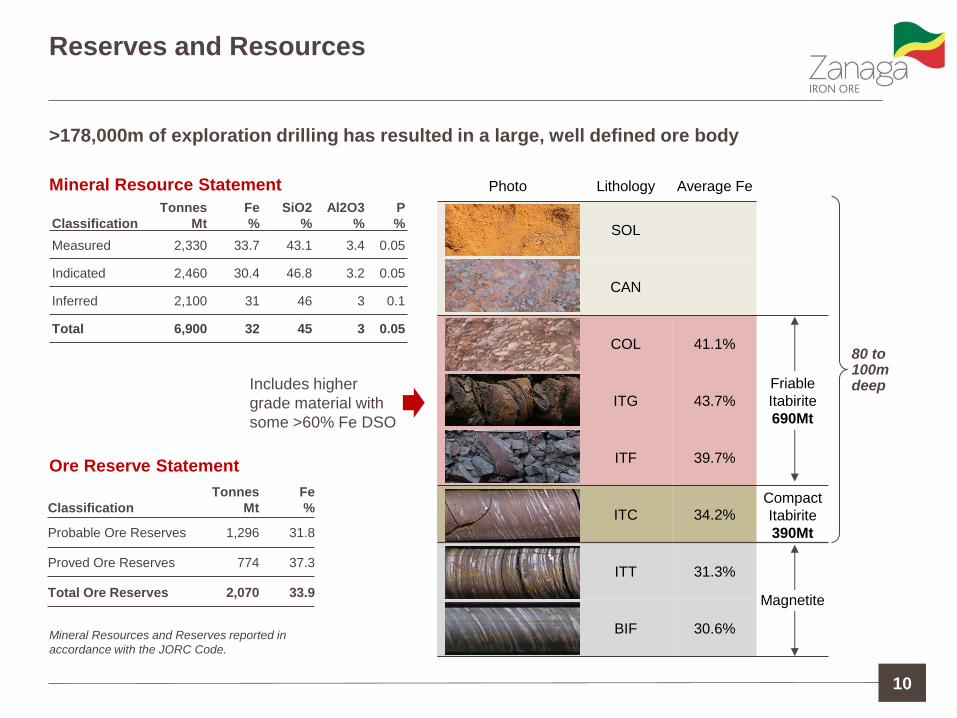
Reserves and Resources
10
Photo Lithology Average Fe
SOL
CAN
COL 41.1%
Friable
Itabirite
690Mt ITG 43.7%
ITF 39.7%
ITC 34.2% Compact
Itabirite
390Mt
ITT 31.3%
Magnetite
BIF 30.6%
>178,000m of exploration drilling has resulted in a large, well defined ore body
Includes higher
grade material with
some >60% Fe DSO
Mineral Resources and Reserves reported in
accordance with the JORC Code.
Classification
Tonnes
Mt
Fe
%
Probable Ore Reserves 1,296 31.8
Proved Ore Reserves 774 37.3
Total Ore Reserves 2,070 33.9
Ore Reserve Statement
Classification
Tonnes
Mt
Fe
%
SiO2
%
Al2O3
%
P
%
Measured 2,330 33.7 43.1 3.4 0.05
Indicated 2,460 30.4 46.8 3.2 0.05
Inferred 2,100 31 46 3 0.1
Total 6,900 32 45 3 0.05
Mineral Resource Statement
80 to 100m deep
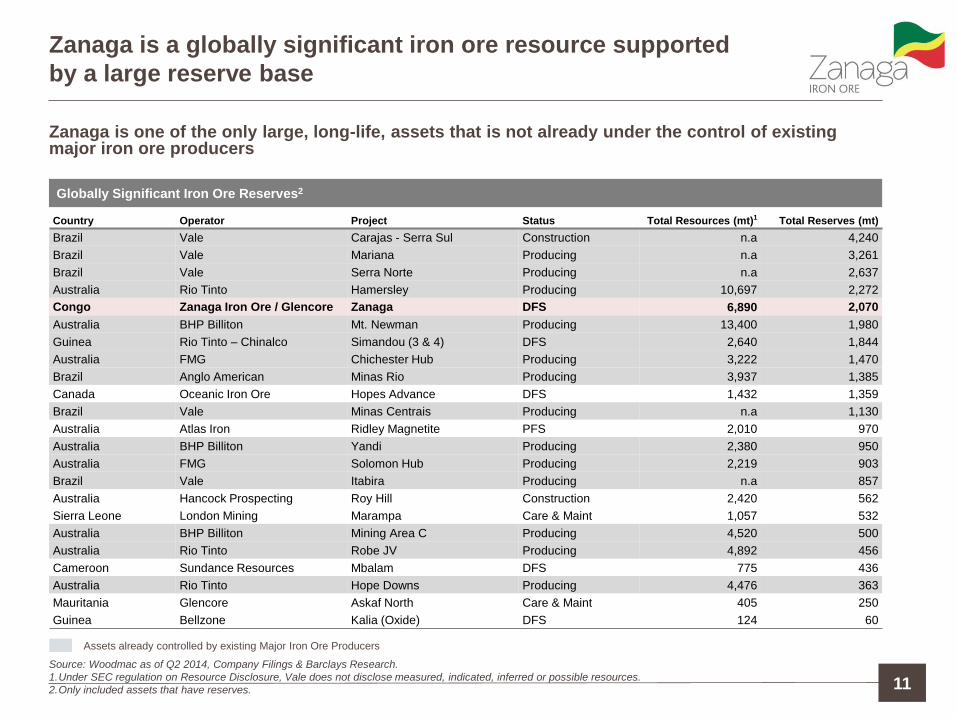
Zanaga is a globally significant iron ore resource supported
by a large reserve base
Zanaga is one of the only large, long-life, assets that is not already under the control of existing major iron ore producers
Country Operator Project Status Total Resources (mt)1 Total Reserves (mt)
Brazil Vale Carajas - Serra Sul Construction n.a 4,240
Brazil Vale Mariana Producing n.a 3,261
Brazil Vale Serra Norte Producing n.a 2,637
Australia Rio Tinto Hamersley Producing 10,697 2,272
Congo Zanaga Iron Ore / Glencore Zanaga DFS 6,890 2,070
Australia BHP Billiton Mt. Newman Producing 13,400 1,980
Guinea Rio Tinto – Chinalco Simandou (3 & 4) DFS 2,640 1,844
Australia FMG Chichester Hub Producing 3,222 1,470
Brazil Anglo American Minas Rio Producing 3,937 1,385
Canada Oceanic Iron Ore Hopes Advance DFS 1,432 1,359
Brazil Vale Minas Centrais Producing n.a 1,130
Australia Atlas Iron Ridley Magnetite PFS 2,010 970
Australia BHP Billiton Yandi Producing 2,380 950
Australia FMG Solomon Hub Producing 2,219 903
Brazil Vale Itabira Producing n.a 857
Australia Hancock Prospecting Roy Hill Construction 2,420 562
Sierra Leone London Mining Marampa Care & Maint 1,057 532
Australia BHP Billiton Mining Area C Producing 4,520 500
Australia Rio Tinto Robe JV Producing 4,892 456
Cameroon Sundance Resources Mbalam DFS 775 436
Australia Rio Tinto Hope Downs Producing 4,476 363
Mauritania Glencore Askaf North Care & Maint 405 250
Guinea Bellzone Kalia (Oxide) DFS 124 60
Assets already controlled by existing Major Iron Ore Producers
11
Globally Significant Iron Ore Reserves2
Source: Woodmac as of Q2 2014, Company Filings & Barclays Research.
1.Under SEC regulation on Resource Disclosure, Vale does not disclose measured, indicated, inferred or possible resources.
2.Only included assets that have reserves.
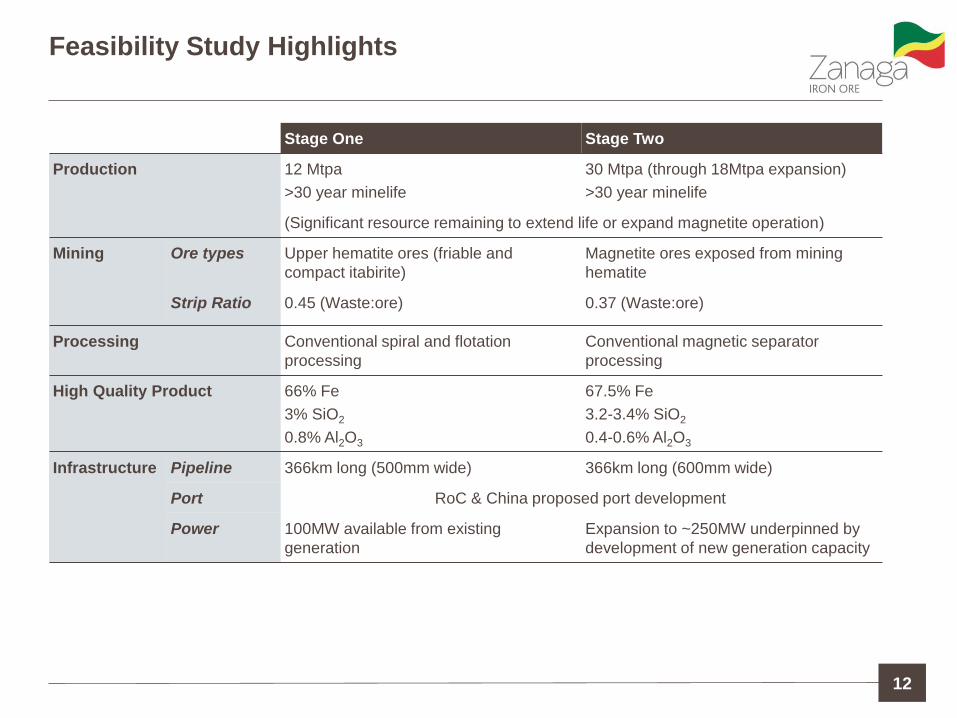
Stage One Stage Two
Production 12 Mtpa
>30 year minelife
30 Mtpa (through 18Mtpa expansion)
>30 year minelife
(Significant resource remaining to extend life or expand magnetite operation)
Mining Ore types Upper hematite ores (friable and
compact itabirite)
Magnetite ores exposed from mining
hematite
Strip Ratio 0.45 (Waste:ore) 0.37 (Waste:ore)
Processing Conventional spiral and flotation
processing
Conventional magnetic separator
processing
High Quality Product 66% Fe
3% SiO2
0.8% Al2O3
67.5% Fe
3.2-3.4% SiO2
0.4-0.6% Al2O3
Infrastructure Pipeline 366km long (500mm wide) 366km long (600mm wide)
Port RoC & China proposed port development
Power 100MW available from existing
generation
Expansion to ~250MW underpinned by
development of new generation capacity
Feasibility Study Highlights
12
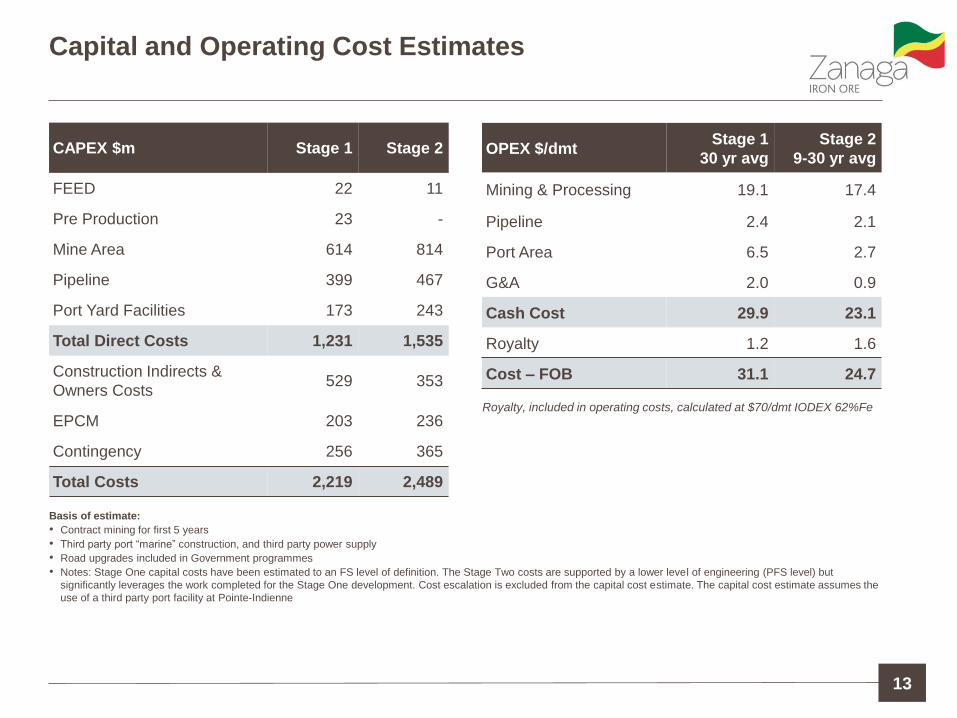
Capital and Operating Cost Estimates
13
Basis of estimate:
• Contract mining for first 5 years
• Third party port “marine” construction, and third party power supply
• Road upgrades included in Government programmes
• Notes: Stage One capital costs have been estimated to an FS level of definition. The Stage Two costs are supported by a lower level of engineering (PFS level) but
significantly leverages the work completed for the Stage One development. Cost escalation is excluded from the capital cost estimate. The capital cost estimate assumes the
use of a third party port facility at Pointe-Indienne
CAPEX $m Stage 1 Stage 2
FEED 22 11
Pre Production 23 -
Mine Area 614 814
Pipeline 399 467
Port Yard Facilities 173 243
Total Direct Costs 1,231 1,535
Construction Indirects &
Owners Costs 529 353
EPCM 203 236
Contingency 256 365
Total Costs 2,219 2,489
OPEX $/dmt Stage 1
30 yr avg
Stage 2
9-30 yr avg
Mining & Processing 19.1 17.4
Pipeline 2.4 2.1
Port Area 6.5 2.7
G&A 2.0 0.9
Cash Cost 29.9 23.1
Royalty 1.2 1.6
Cost – FOB 31.1 24.7
Royalty, included in operating costs, calculated at $70/dmt IODEX 62%Fe
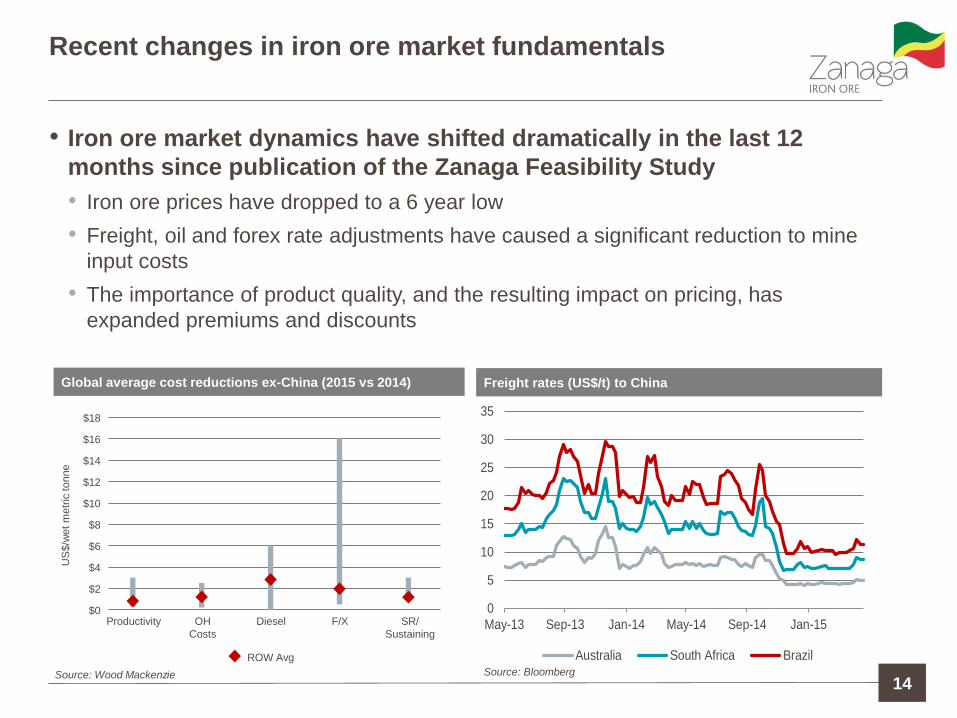
Recent changes in iron ore market fundamentals
• Iron ore market dynamics have shifted dramatically in the last 12
months since publication of the Zanaga Feasibility Study
• Iron ore prices have dropped to a 6 year low
• Freight, oil and forex rate adjustments have caused a significant reduction to mine
input costs
• The importance of product quality, and the resulting impact on pricing, has
expanded premiums and discounts
14
Global average cost reductions ex-China (2015 vs 2014) Freight rates (US$/t) to China
Source: Bloomberg Source: Wood Mackenzie
ROW Avg
$0
$2
$4
$6
$8
$10
$12
$14
$16
$18
Productivity Diesel F/X SR/
Sustaining
US
$/w
et
metr
ic tonne
OH
Costs
0
5
10
15
20
25
30
35
May-13 Sep-13 Jan-14 May-14 Sep-14 Jan-15
Australia South Africa Brazil

Asset benchmarking
Product pricing impact must be factored
• Traditional asset benchmarking based on cost curves can no
longer be applied to iron ore
• FOB cost curve – low relevance, does not factor costs to deliver to
customer
• CFR cost curve – interesting but remains irrelevant as product
premiums/discounts are not factored
• Cash margin/tonne curve – valuable benchmarking metric of asset quality
• EBITDA/tonne adjusted for sustaining capex and financing costs –
preferred benchmarking metric
– Note: Delay in payment of financing costs can destroy a business but
will not destroy a mine – mine will remain in operation under the
stewardship of creditors
– Note: Delay in payment of sustaining capex can destroy a mine in the
long term (e.g. decisions to ‘high-grade’ a mine or delay essential
sustaining capex delays inevitable capex, potentially destroying
economics of long term/sustainable operation)
15
Asset benchmarking
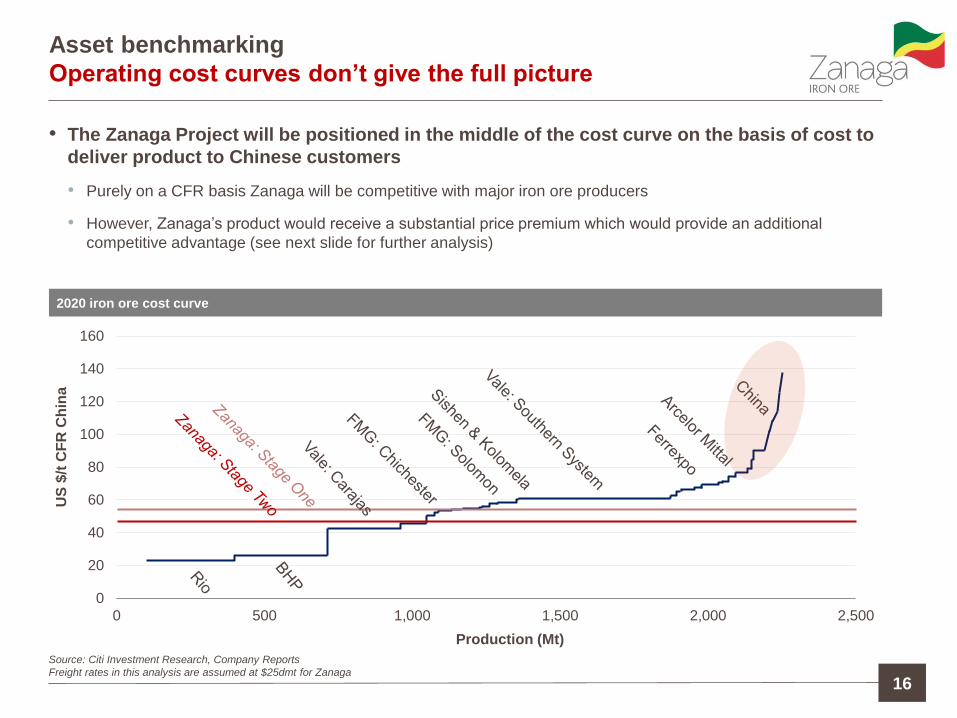
Operating cost curves don’t give the full picture
• The Zanaga Project will be positioned in the middle of the cost curve on the basis of cost to
deliver product to Chinese customers
• Purely on a CFR basis Zanaga will be competitive with major iron ore producers
• However, Zanaga’s product would receive a substantial price premium which would provide an additional
competitive advantage (see next slide for further analysis)
16
0
20
40
60
80
100
120
140
160
0 500 1,000 1,500 2,000 2,500
US
$/t
CF
R C
hin
a
Production (Mt)
Source: Citi Investment Research, Company Reports
Freight rates in this analysis are assumed at $25dmt for Zanaga
2020 iron ore cost curve
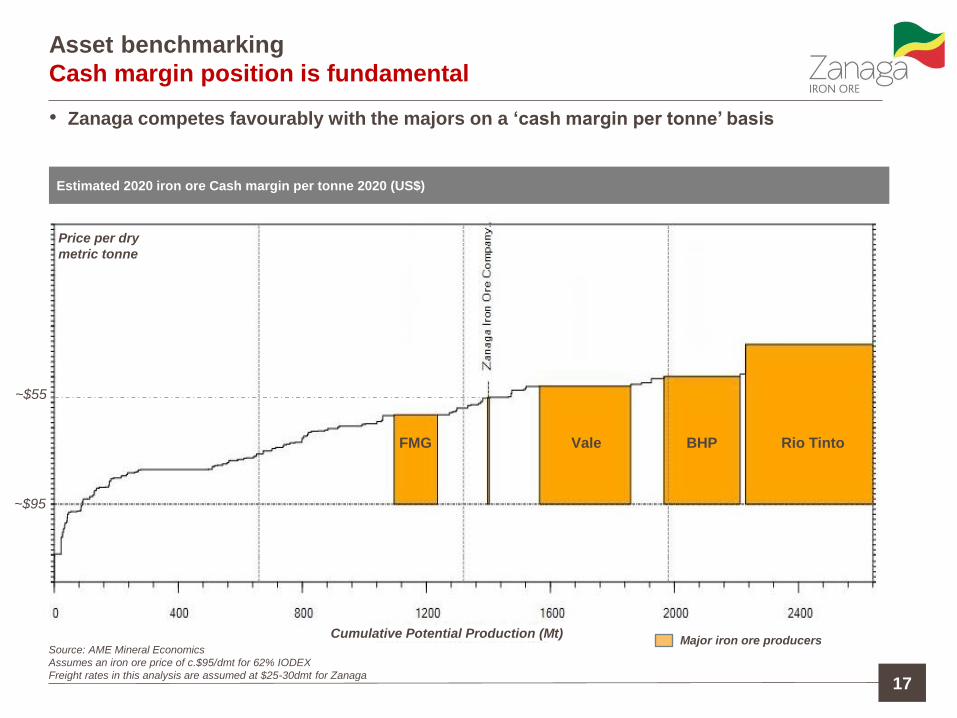
Asset benchmarking
Cash margin position is fundamental
• Zanaga competes favourably with the majors on a ‘cash margin per tonne’ basis
17
Estimated 2020 iron ore Cash margin per tonne 2020 (US$)
Source: AME Mineral Economics
Assumes an iron ore price of c.$95/dmt for 62% IODEX
Freight rates in this analysis are assumed at $25-30dmt for Zanaga
Major iron ore producers
~$95
~$55
Price per dry
metric tonne
Cumulative Potential Production (Mt)
Rio Tinto BHP Vale FMG
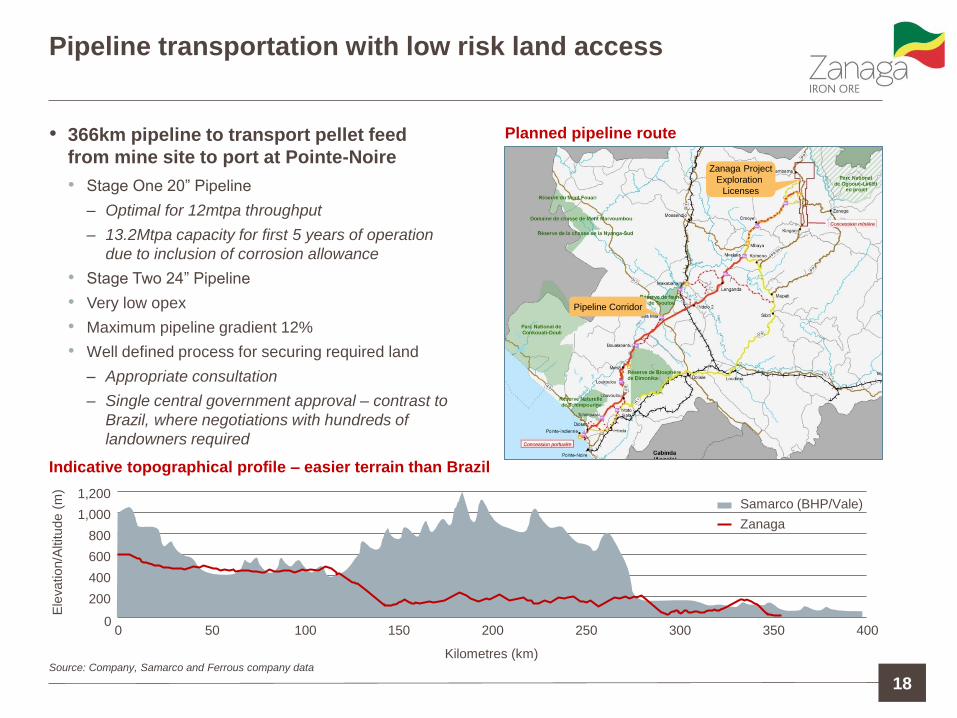
Indicative topographical profile – easier terrain than Brazil
Source: Company, Samarco and Ferrous company data
Pipeline transportation with low risk land access
• 366km pipeline to transport pellet feed
from mine site to port at Pointe-Noire
• Stage One 20” Pipeline
– Optimal for 12mtpa throughput
– 13.2Mtpa capacity for first 5 years of operation
due to inclusion of corrosion allowance
• Stage Two 24” Pipeline
• Very low opex
• Maximum pipeline gradient 12%
• Well defined process for securing required land
– Appropriate consultation
– Single central government approval – contrast to
Brazil, where negotiations with hundreds of
landowners required
Planned pipeline route
18
Kilometres (km)
0
200
400
600
800
1,000
1,200
0 50 100 150 200 250 300 350 400
Ele
vation/A
ltitude (
m)
Samarco (BHP/Vale)
Zanaga
Zanaga Project
Exploration
Licenses
Pipeline Corridor
2.4% 2.2%
1.3% 1.0%
0.8%
0.4%
0.0%
0.5%
1.0%
1.5%
2.0%
2.5%
3.0%
Zanaga(Stage I)
Zanaga(Stage II)
(Pilbara
Fines)
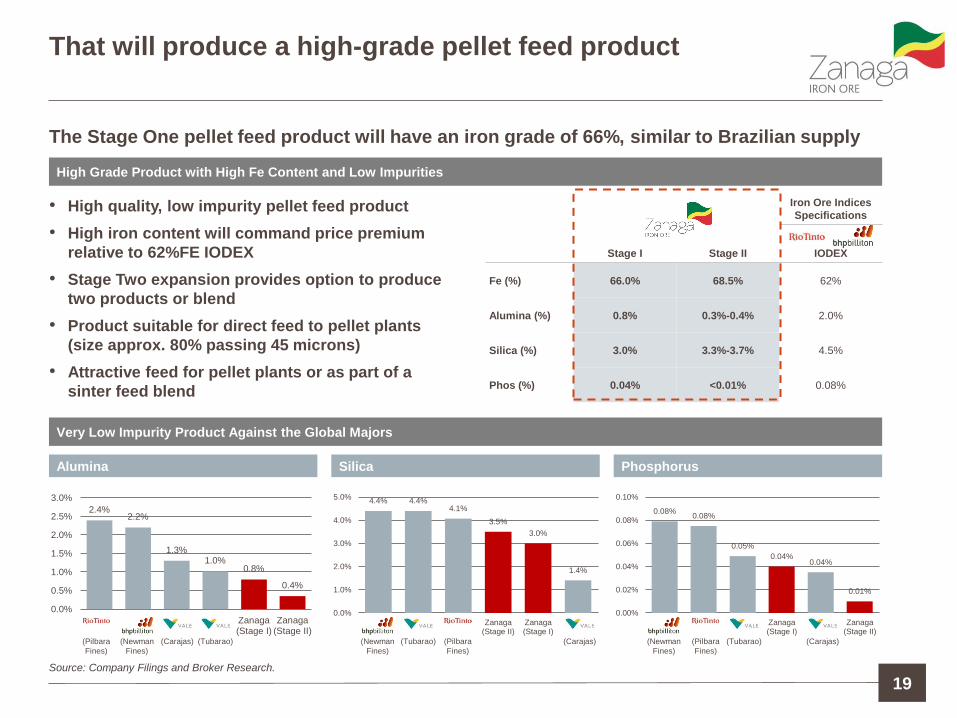
That will produce a high-grade pellet feed product
19
The Stage One pellet feed product will have an iron grade of 66%, similar to Brazilian supply
• High quality, low impurity pellet feed product
• High iron content will command price premium
relative to 62%FE IODEX
• Stage Two expansion provides option to produce
two products or blend
• Product suitable for direct feed to pellet plants
(size approx. 80% passing 45 microns)
• Attractive feed for pellet plants or as part of a
sinter feed blend
Stage I Stage II
Iron Ore Indices
Specifications
IODEX
Fe (%) 66.0% 68.5% 62%
Alumina (%) 0.8% 0.3%-0.4% 2.0%
Silica (%) 3.0% 3.3%-3.7% 4.5%
Phos (%) 0.04% <0.01% 0.08%
Phosphorus Alumina Silica
4.4% 4.4% 4.1%
3.5%
3.0%
1.4%
0.0%
1.0%
2.0%
3.0%
4.0%
5.0%
Zanaga(Stage II)
Zanaga(Stage I)
0.08% 0.08%
0.05%
0.04% 0.04%
0.01%
0.00%
0.02%
0.04%
0.06%
0.08%
0.10%
Zanaga(Stage I)
Zanaga(Stage II)
(Newman
Fines)
(Carajas) (Tubarao) (Newman
Fines)
(Tubarao) (Pilbara
Fines)
(Carajas) (Newman
Fines)
(Pilbara
Fines)
(Tubarao) (Carajas)
High Grade Product with High Fe Content and Low Impurities
Very Low Impurity Product Against the Global Majors
Source: Company Filings and Broker Research.

Development Timeframe
20 20
$350m spent
2007-2012
$2.2bn
2013 2014 2015 4 years
30Mtpa Pipeline Pre-Feasibility Study
Staged Development scoping study
Feasibility Study & SEIA
Exploration, Drilling, and Preliminary Studies
Construction Phase
Mining Commences
First Shipment
Staged Development Studies
Mining Licence & Convention received
Port & Power Agreement Process
Capital cost
Investment Highlights
21
Attractive Project Economics
• Large ore body defined to support long life development
• High quality product specifications
Feasibility Study complete
• Confirms attractive technical and economic basis for development
• Study work conducted by Xstrata & Glencore
Deliverable and financeable project
• Reduced capital intensity and quantum for staged development approach
• Optionality with respect to port and power infrastructure
Mining Licence granted and Convention
signed
• Supported by Feasibility Study and SEIA