Embed Size (px)
Citation preview

Zangezur Copper Molybdenum Combine CJSC
Consolidated financial statements For the year ended 31 December 2020 together with independent auditor’s report

Zangezur Copper Molybdenum Combine CJSC Consolidated financial statements
Contents
Independent auditor’s report
Consolidated financial statements Consolidated statement of financial position ..................................................................................................................... 1 Consolidated statement of profit or loss and other comprehensive income ...................................................................... 2 Consolidated statement of changes in equity ................................................................................................................... 3 Consolidated statement of cash flows .............................................................................................................................. 4
Notes to the consolidated financial statements 1. Background ........................................................................................................................................................... 5 2. Basis of preparation ............................................................................................................................................... 5 3. Basis of consolidation ............................................................................................................................................ 6 4. Significant accounting judgments, estimates and assumptions ............................................................................. 7 5. Segment information ............................................................................................................................................. 9 6. Revenue from contracts with customers ................................................................................................................ 9 7. Cost of sales .......................................................................................................................................................... 9 8. Distribution expenses .......................................................................................................................................... 10 9. Administrative expenses ...................................................................................................................................... 10 10. Donations to social programs .............................................................................................................................. 10 11. Other income and other expenses....................................................................................................................... 11 12. Finance income and finance costs ...................................................................................................................... 11 13. Personnel costs ................................................................................................................................................... 11 14. Income tax expense ............................................................................................................................................ 12 15. Property, plant and equipment ............................................................................................................................ 14 16. Stripping activity asset ......................................................................................................................................... 15 17. Equity investments at fair value through profit or loss ......................................................................................... 15 18. Prepayments ....................................................................................................................................................... 16 19. Loans given ......................................................................................................................................................... 16 20. Inventories ........................................................................................................................................................... 16 21. Trade and other receivables ................................................................................................................................ 17 22. Cash and cash equivalents ................................................................................................................................. 18 23. Capital and reserves ............................................................................................................................................ 18 24. Issued bonds ....................................................................................................................................................... 18 25. Loans and borrowings ......................................................................................................................................... 19 26. Provisions ............................................................................................................................................................ 20 27. Financial instruments at fair value through profit or loss ...................................................................................... 21 28. Trade and other payables .................................................................................................................................... 21 29. Lease liabilities, other financial liabilities ............................................................................................................. 21 30. Contract liabilities, other financial liabilities .......................................................................................................... 22 31. Fair values and risk management........................................................................................................................ 23 32. Contingencies and commitments......................................................................................................................... 30 33. Operational risks.................................................................................................................................................. 30 34. Related parties .................................................................................................................................................... 31 35. Events after the reporting period ......................................................................................................................... 33 36. Standards issued but not yet effective ................................................................................................................. 34 37. Summary of significant accounting policies ......................................................................................................... 34
Independent auditor’s report To the Shareholders and Board of Directors of Zangezur Copper Molybdenum Combine CJSC Opinion We have audited the consolidated financial statements of Zangezur Copper Molybdenum Combine CJSC and its subsidiary (the Group), which comprise the consolidated statement of financial position as at 31 December 2020, and the consolidated statement of profit or loss and other comprehensive income, consolidated statement of changes in equity and consolidated statement of cash flows for the year then ended, and notes to the consolidated financial statements, including a summary of significant accounting policies. In our opinion, the accompanying consolidated financial statements present fairly, in all material respects, the consolidated financial position of the Group as at 31 December 2020 and its consolidated financial performance and its consolidated cash flows for the year then ended in accordance with International Financial Reporting Standards (IFRSs). Basis for opinion We conducted our audit in accordance with International Standards on Auditing (ISAs). Our responsibilities under those standards are further described in the Auditor’s responsibilities for the audit of the consolidated financial statements section of our report. We are independent of the Group in accordance with International Ethics Standards Board for Accountants’ Code of Ethics for Professional Accountants (including International Independence Standards) (IESBA Code), and we have fulfilled our other ethical responsibilities in accordance with the IESBA Code. We believe that the audit evidence we have obtained is sufficient and appropriate to provide a basis for our opinion. Key audit matters Key audit matters are those matters that, in our professional judgment, were of most significance in our audit of the consolidated financial statements of the current period. These matters were addressed in the context of our audit of the consolidated financial statements as a whole, and in forming our opinion thereon, and we do not provide a separate opinion on these matters. For each matter below, our description of how our audit addressed the matter is provided in that context. We have fulfilled the responsibilities described in the Auditor’s responsibilities for the audit of the consolidated financial statements section of our report, including in relation to these matters. Accordingly, our audit included the performance of procedures designed to respond to our assessment of the risks of material misstatement of the consolidated financial statements.
The results of our audit procedures, including the procedures performed to address the matters below, provide the basis for our audit opinion on the accompanying consolidated financial statements.
Key audit matter How our audit addressed the key audit matter
Revenue recognition
Revenue from sales of copper, molybdenum and ferro-molybdenum was one of the matters of most significance in our audit. We identified this as an area of focus due to the high volume of transactions involving provisionally priced contracts and complex calculations of consideration. Amount of revenue depends on changes in future commodity prices over quotational period, which requires management to exercise judgement in assessing significant provisional price estimates to be made at the end of the reporting period.
Information about revenue is disclosed in Notes 6 and 30 to the consolidated financial statements.
During our audit we performed the following procedures:
► We analysed accounting policies in respect of revenue recognition;
► We read selected contracts with customers to understand the terms of the transactions;
► We tested operating effectiveness of relevant internal controls over the revenue recognition process;
► On a sample basis, we compared transaction information in sales invoices to the contract terms and commodity prices;
► We received confirmation letters from the customers and compared sale volumes, revenue for the year and yearend balances confirmed by the customers with accounting records;
► We recalculated the amount of revenue subject to provisional pricing;
► For the sales transactions occurred immediately before and after the yearend, we analysed the period revenue relates to;
► We analysed the satisfaction of performance obligations and amount of revenue recognised under sales contracts;
► We analysed information about revenue disclosed in Note 6 to the consolidated financial statements.
Write down of inventories to net realizable value
We identified write down of inventories to NRV as one of the matters of the most significance to our audit due to the significant judgement exercised by the Group’s management in identifying the slow moving and obsolete inventories and assessing the amount of write down to NRV for inventories. Such judgements include management’s expectations of inventories necessary for operations and available for sale inventories. In addition, management assesses expected market demand taking into account changes in market conditions and technology, and the recent prices.
Information about inventories is disclosed in Note 20 to the consolidated financial statements.
Our procedures in relation to evaluate the appropriateness of the valuation of inventories included:
► Attending physical inventory counts at major locations and observing condition of inventories including analysis of cost and carrying value of items selected on a sample basis;
► Understanding management’s basis of the obsolete inventories identification and the projected excessive quantity of inventories estimated by the Group’s management;
► Testing on a sample basis the accuracy of the aging analysis of inventories used by the Group management to identify the obsolete inventories;
► Comparing the current period write down of inventories to historical inventories write down amounts;
► Understanding the trends in relevant commodity prices and demand forecasts;
► Recalculating the mathematical accuracy of the inventories write down to NRV, on a sample basis;
Key audit matter How our audit addressed the key audit matter
► We analyzed the disclosures in respect of inventories in the consolidated financial statements.
Interest-bearing liabilities
The Group has a significant amount of interest-bearing liabilities at 31 December 2020. During the year the Group incurred AMD 20.9 billion in financing and interest costs of which AMD 18.9 billion has been recognised in the consolidated profit or loss statement and AMD 2.0 billion capitalised to assets under construction. Due to significance of balances of such liabilities and inherent complexity of the terms of bond issuance and loan agreements, this matter was one of the matters of most significance in our audit.
Information about borrowings and related finance costs is disclosed in Notes 12, 24 and 25 to the consolidated financial statements.
Our procedures included, amongst others:
► Obtaining confirmations from banks and comparing outstanding balances of liability, accrued expenses, tenure and conditions in the bank confirmations to the data reflected in the accounting systems;
► Reading the borrowing agreements with the financiers to develop an understanding of the terms associated with the credit facilities;
► Analysis of the classification of outstanding liability balances as current or noncurrent;
► Recalculation of interest recognised in the consolidated statement of profit or loss and other comprehensive income;
► Checking mathematical accuracy of capitalised borrowing costs calculation;
► Analysis of the disclosures in respect of interest bearing liabilities, provided in the consolidated financial statements.
Provisions for restoration and rehabilitation
The Group is involved in mining, metal refining and primary ferromolybdenum production. Given the nature of its operations, the Group incurs obligations to close, restore and rehabilitate its site. Closure and rehabilitation activities are governed by legislative requirements. Significant estimates over life of mine and reserves are made by the Group in determining its rehabilitation provision.
We identified provisions for restoration and rehabilitation as one of the matters of most significance to our audit due to the uncertainty of scope and timing of such obligations and the limited amount of historical data available.
Information about provisions for restoration and rehabilitation is disclosed in Notes 26 to the consolidated financial statements.
Our audit procedures in this area included, amongst others:
► Analysing the estimated cost to restore and rehabilitate the land and expected moment of rehabilitation;
► Evaluating the economic assumptions used in the calculation, including the discount rate, inflation rate applied to calculate the net present value of the provision;
► Considered the additional damage that has taken place during the period that requires additional rehabilitation in the future;
► Testing the mathematical accuracy of the models used to calculate provisions;
► Analysing the adequacy of the disclosures relating to provisions.
Other information included in Group’s 2020 Annual Report Other information consists of the information included in Group’s 2020 Annual Report, other than the consolidated financial statements and our auditor’s report thereon. Management is responsible for the other information. The Group’s 2020 Annual Report is expected to be made available to us after the date of this auditor’s report. Our opinion on the consolidated financial statements does not cover the other information and we will not express any form of assurance conclusion thereon. In connection with our audit of the consolidated financial statements, our responsibility is to read the other information identified above when it becomes available and, in doing so, consider whether the other information is materially inconsistent with the consolidated financial statements or our knowledge obtained in the audit or otherwise appears to be materially misstated. Responsibilities of management for the consolidated financial statements Management is responsible for the preparation and fair presentation of the consolidated financial statements in accordance with IFRSs, and for such internal control as management determines is necessary to enable the preparation of consolidated financial statements that are free from material misstatement, whether due to fraud or error. In preparing the consolidated financial statements, management is responsible for assessing the Group’s ability to continue as a going concern, disclosing, as applicable, matters related to going concern and using the going concern basis of accounting unless management either intends to liquidate the Group or to cease operations, or has no realistic alternative but to do so. Board of Directors are responsible for overseeing the Group’s financial reporting process. Auditor’s responsibilities for the audit of the consolidated financial statements Our objectives are to obtain reasonable assurance about whether the consolidated financial statements as a whole are free from material misstatement, whether due to fraud or error, and to issue an auditor’s report that includes our opinion. Reasonable assurance is a high level of assurance, but is not a guarantee that an audit conducted in accordance with ISAs will always detect a material misstatement when it exists. Misstatements can arise from fraud or error and are considered material if, individually or in the aggregate, they could reasonably be expected to influence the economic decisions of users taken on the basis of these consolidated financial statements. As part of an audit in accordance with ISAs, we exercise professional judgment and maintain professional skepticism throughout the audit. We also:
► Identify and assess the risks of material misstatement of the consolidated financial statements, whether due to fraud or error, design and perform audit procedures responsive to those risks, and obtain audit evidence that is sufficient and appropriate to provide a basis for our opinion. The risk of not detecting a material misstatement resulting from fraud is higher than for one resulting from error, as fraud may involve collusion, forgery, intentional omissions, misrepresentations, or the override of internal control.
►
►
►
Zangezur Copper Molybdenum Combine CJSC Consolidated financial statements
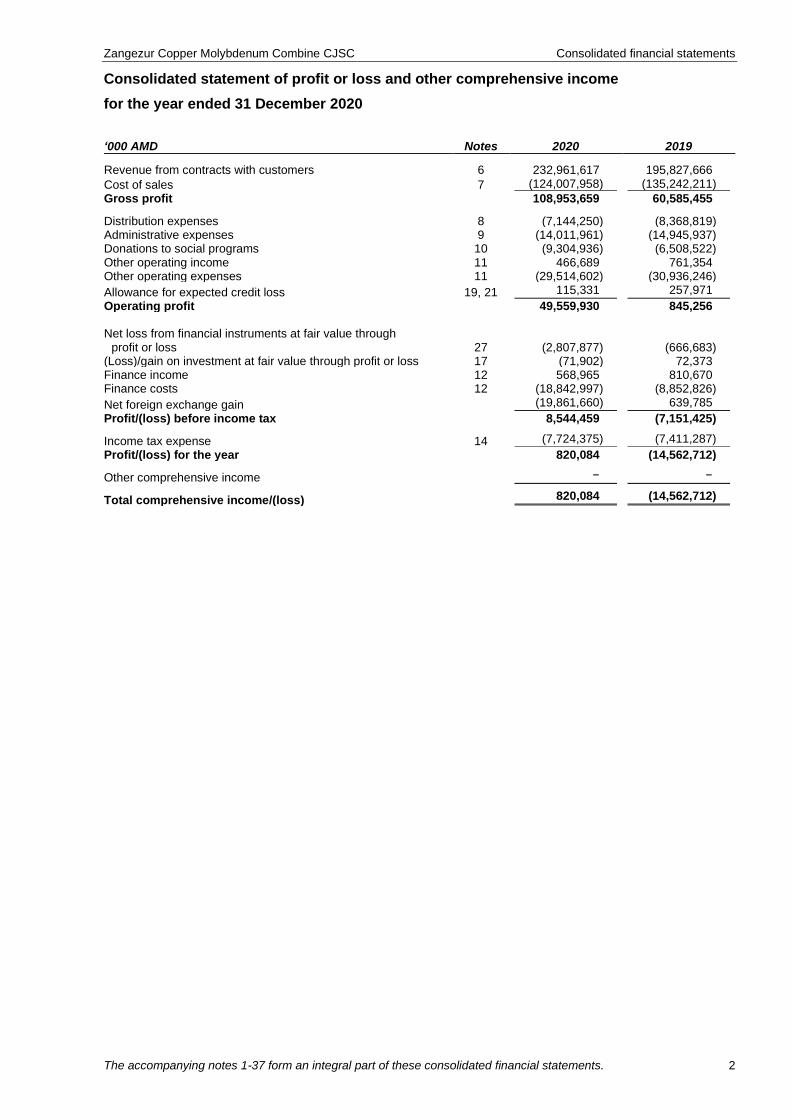
Consolidated statement of profit or loss and other comprehensive income
for the year ended 31 December 2020
The accompanying notes 1-37 form an integral part of these consolidated financial statements. 2
‘000 AMD Notes 2020 2019
Revenue from contracts with customers 6 232,961,617 195,827,666
Cost of sales 7 (124,007,958) (135,242,211)
Gross profit 108,953,659 60,585,455
Distribution expenses 8 (7,144,250) (8,368,819) Administrative expenses 9 (14,011,961) (14,945,937) Donations to social programs 10 (9,304,936) (6,508,522) Other operating income 11 466,689 761,354 Other operating expenses 11 (29,514,602) (30,936,246)
Allowance for expected credit loss 19, 21 115,331 257,971
Operating profit 49,559,930 845,256 Net loss from financial instruments at fair value through
profit or loss 27 (2,807,877) (666,683) (Loss)/gain on investment at fair value through profit or loss 17 (71,902) 72,373 Finance income 12 568,965 810,670 Finance costs 12 (18,842,997) (8,852,826)
Net foreign exchange gain (19,861,660) 639,785
Profit/(loss) before income tax 8,544,459 (7,151,425)
Income tax expense 14 (7,724,375) (7,411,287)
Profit/(loss) for the year 820,084 (14,562,712)
Other comprehensive income − −
Total comprehensive income/(loss) 820,084 (14,562,712)
Zangezur Copper Molybdenum Combine CJSC Consolidated financial statements
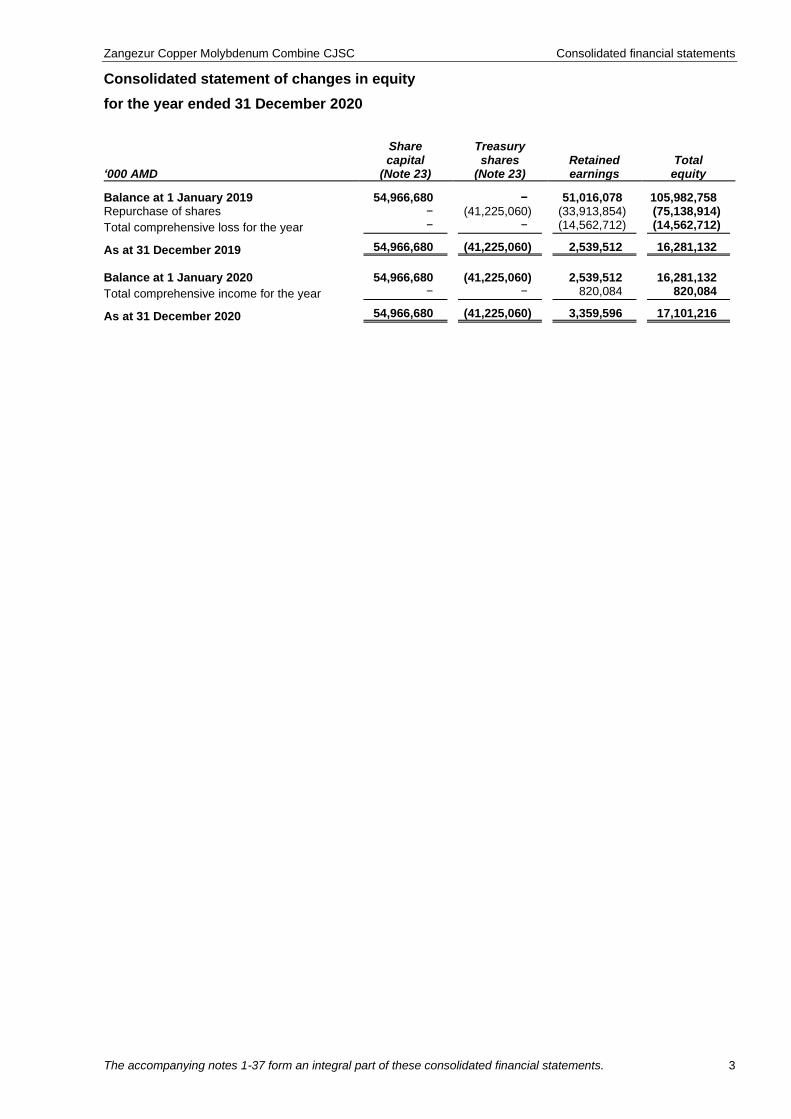
Consolidated statement of changes in equity
for the year ended 31 December 2020
The accompanying notes 1-37 form an integral part of these consolidated financial statements. 3
‘000 AMD
Share capital
(Note 23)
Treasury shares
(Note 23) Retained earnings
Total equity
Balance at 1 January 2019 54,966,680 − 51,016,078 105,982,758 Repurchase of shares − (41,225,060) (33,913,854) (75,138,914)
Total comprehensive loss for the year − − (14,562,712) (14,562,712)
As at 31 December 2019 54,966,680 (41,225,060) 2,539,512 16,281,132
Balance at 1 January 2020 54,966,680 (41,225,060) 2,539,512 16,281,132
Total comprehensive income for the year − − 820,084 820,084
As at 31 December 2020 54,966,680 (41,225,060) 3,359,596 17,101,216
Zangezur Copper Molybdenum Combine CJSC Consolidated financial statements
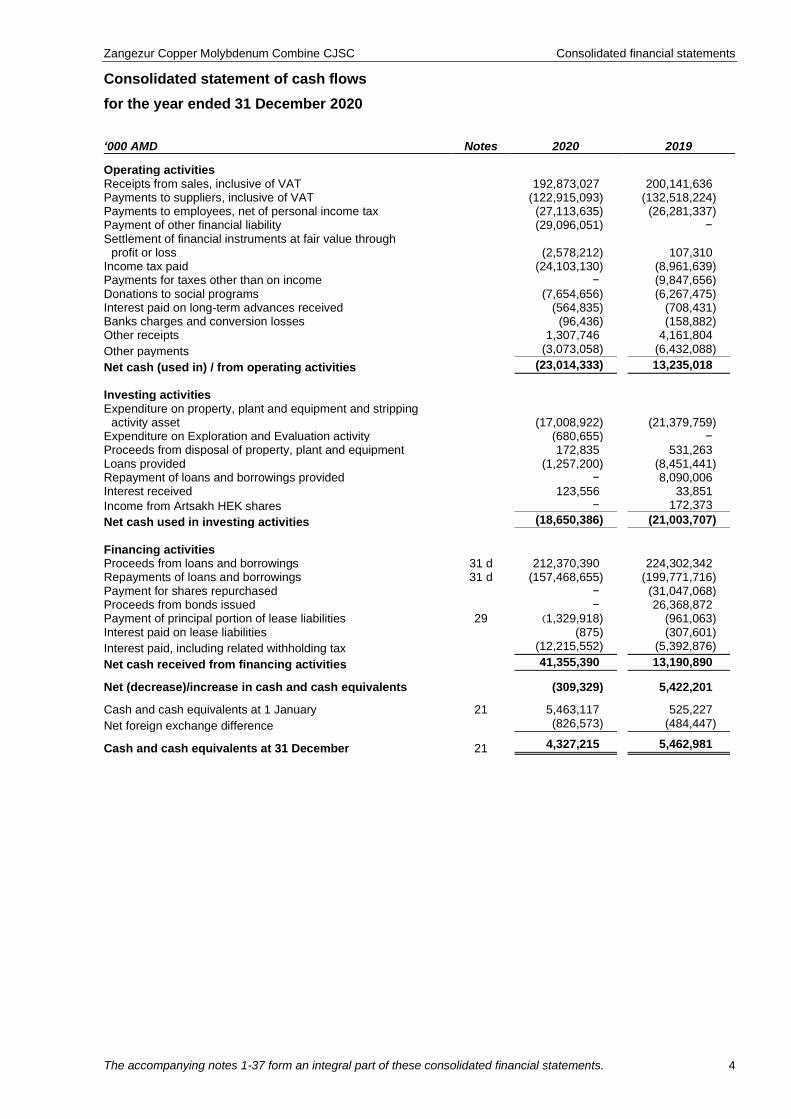
Consolidated statement of cash flows
for the year ended 31 December 2020
The accompanying notes 1-37 form an integral part of these consolidated financial statements. 4
‘000 AMD Notes 2020 2019
Operating activities Receipts from sales, inclusive of VAT 192,873,027 200,141,636 Payments to suppliers, inclusive of VAT (122,915,093) (132,518,224) Payments to employees, net of personal income tax (27,113,635) (26,281,337) Payment of other financial liability (29,096,051) − Settlement of financial instruments at fair value through
profit or loss (2,578,212) 107,310 Income tax paid (24,103,130) (8,961,639) Payments for taxes other than on income − (9,847,656) Donations to social programs (7,654,656) (6,267,475) Interest paid on long-term advances received (564,835) (708,431) Banks charges and conversion losses (96,436) (158,882) Other receipts 1,307,746 4,161,804
Other payments (3,073,058) (6,432,088)
Net cash (used in) / from operating activities (23,014,333) 13,235,018
Investing activities Expenditure on property, plant and equipment and stripping
activity asset (17,008,922) (21,379,759) Expenditure on Exploration and Evaluation activity (680,655) − Proceeds from disposal of property, plant and equipment 172,835 531,263 Loans provided (1,257,200) (8,451,441) Repayment of loans and borrowings provided − 8,090,006 Interest received 123,556 33,851
Income from Artsakh HEK shares − 172,373
Net cash used in investing activities (18,650,386) (21,003,707)
Financing activities Proceeds from loans and borrowings 31 d 212,370,390 224,302,342 Repayments of loans and borrowings 31 d (157,468,655) (199,771,716) Payment for shares repurchased − (31,047,068) Proceeds from bonds issued − 26,368,872 Payment of principal portion of lease liabilities 29 (1,329,918) (961,063) Interest paid on lease liabilities (875) (307,601)
Interest paid, including related withholding tax (12,215,552) (5,392,876)
Net cash received from financing activities 41,355,390 13,190,890
Net (decrease)/increase in cash and cash equivalents (309,329) 5,422,201
Cash and cash equivalents at 1 January 21 5,463,117 525,227
Net foreign exchange difference (826,573) (484,447)
Cash and cash equivalents at 31 December 21 4,327,215 5,462,981
Zangezur Copper Molybdenum Combine CJSC Notes to the consolidated financial statements for 2020
5
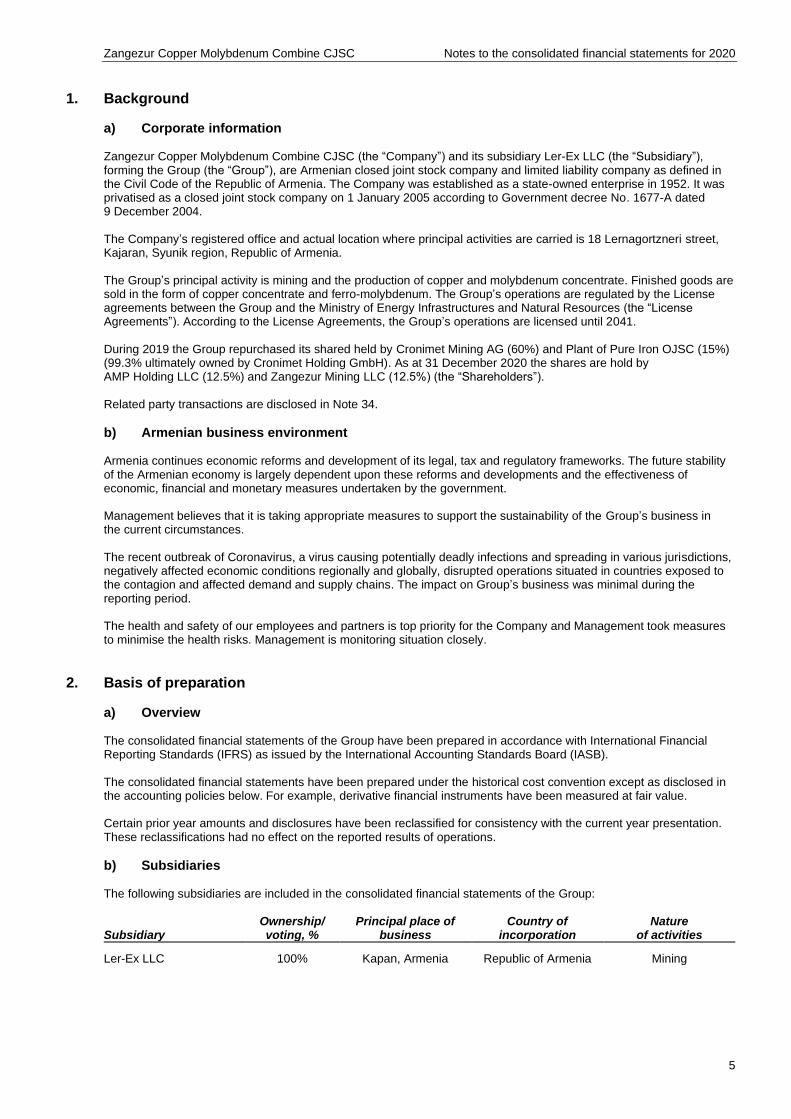
1. Background
a) Corporate information Zangezur Copper Molybdenum Combine CJSC (the “Company”) and its subsidiary Ler-Ex LLC (the “Subsidiary”), forming the Group (the “Group”), are Armenian closed joint stock company and limited liability company as defined in the Civil Code of the Republic of Armenia. The Company was established as a state-owned enterprise in 1952. It was privatised as a closed joint stock company on 1 January 2005 according to Government decree No. 1677-A dated 9 December 2004. The Company’s registered office and actual location where principal activities are carried is 18 Lernagortzneri street, Kajaran, Syunik region, Republic of Armenia. The Group’s principal activity is mining and the production of copper and molybdenum concentrate. Finished goods are sold in the form of copper concentrate and ferro-molybdenum. The Group’s operations are regulated by the License agreements between the Group and the Ministry of Energy Infrastructures and Natural Resources (the “License Agreements”). According to the License Agreements, the Group’s operations are licensed until 2041. During 2019 the Group repurchased its shared held by Cronimet Mining AG (60%) and Plant of Pure Iron OJSC (15%) (99.3% ultimately owned by Cronimet Holding GmbH). As at 31 December 2020 the shares are hold by AMP Holding LLC (12.5%) and Zangezur Mining LLC (12.5%) (the “Shareholders”). Related party transactions are disclosed in Note 34.
b) Armenian business environment Armenia continues economic reforms and development of its legal, tax and regulatory frameworks. The future stability of the Armenian economy is largely dependent upon these reforms and developments and the effectiveness of economic, financial and monetary measures undertaken by the government. Management believes that it is taking appropriate measures to support the sustainability of the Group’s business in the current circumstances. The recent outbreak of Coronavirus, a virus causing potentially deadly infections and spreading in various jurisdictions, negatively affected economic conditions regionally and globally, disrupted operations situated in countries exposed to the contagion and affected demand and supply chains. The impact on Group’s business was minimal during the reporting period. The health and safety of our employees and partners is top priority for the Company and Management took measures to minimise the health risks. Management is monitoring situation closely.
2. Basis of preparation
a) Overview The consolidated financial statements of the Group have been prepared in accordance with International Financial Reporting Standards (IFRS) as issued by the International Accounting Standards Board (IASB). The consolidated financial statements have been prepared under the historical cost convention except as disclosed in the accounting policies below. For example, derivative financial instruments have been measured at fair value. Certain prior year amounts and disclosures have been reclassified for consistency with the current year presentation. These reclassifications had no effect on the reported results of operations.
b) Subsidiaries The following subsidiaries are included in the consolidated financial statements of the Group:
Subsidiary Ownership/ voting, %
Principal place of business
Country of incorporation
Nature of activities
Ler-Ex LLC 100% Kapan, Armenia Republic of Armenia Mining
Zangezur Copper Molybdenum Combine CJSC Notes to the consolidated financial statements for 2020
6
2. Basis of preparation (continued)
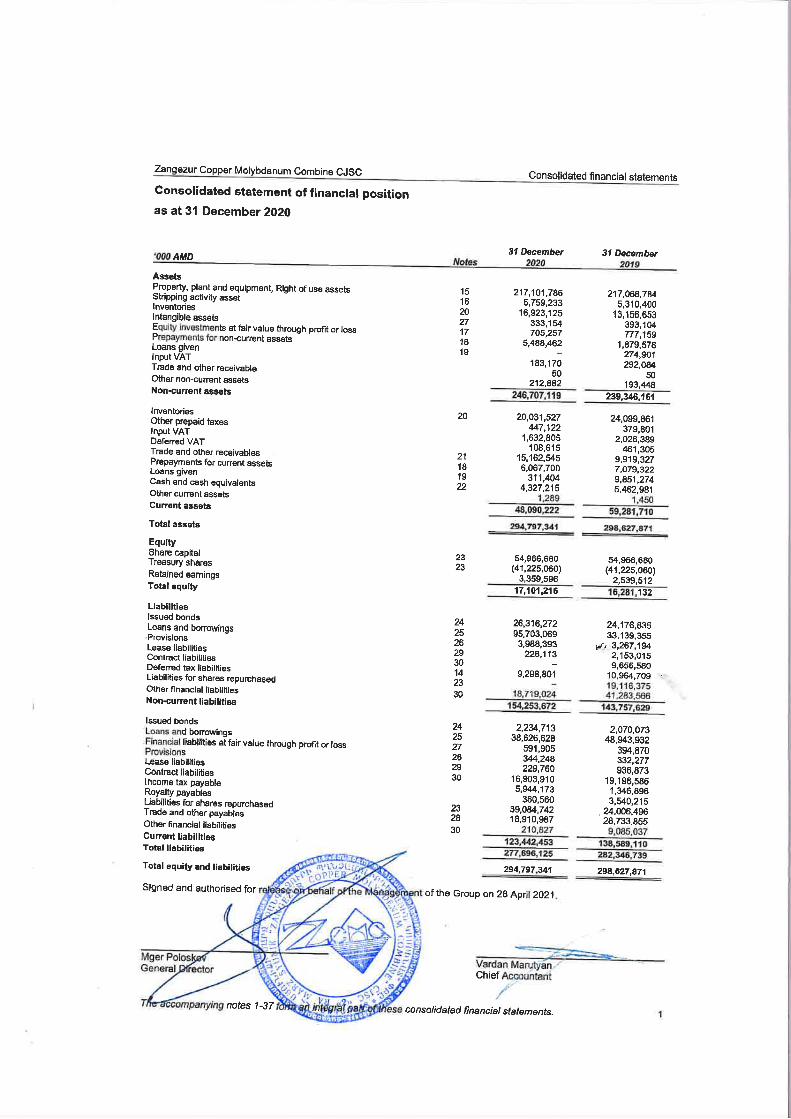
c) Liquidity position As at 31 December 2020 the Group’s current liabilities exceeded its current assets by AMD 75,352,231 thousand (2019: AMD 79,307,400 thousand). The Management have reviewed the Group’s budgeted cash flows and related assumptions including appropriate stress testing of risks (being primarily copper demand and prices). As a result, the Management have a reasonable expectation that the Group has adequate resources to continue its operational existence for the foreseeable future. The Group has obtained additional long-term financing in subsequent period. The management believes that liquidity gap will further improve during upcoming periods.
d) Functional and presentation currency The national currency of the Republic of Armenia is the Armenian Dram (“AMD”), which is the Group companies’ functional currency and the currency in which these consolidated financial statements are presented. Transactions in foreign currencies are initially recorded by the Group at their respective functional currency spot rates at the date the transaction first qualifies for recognition. Monetary assets and liabilities denominated in foreign currencies are translated at the functional currency spot rates of exchange at the reporting date. All differences are taken to the statement of profit or loss and other comprehensive income. Non-monetary items that are measured at historical cost in a foreign currency are translated using the exchange rates at the dates of the initial transaction. Non-monetary items measured at fair value in a foreign currency are translated using the exchange rates at the date when the fair value was determined. All financial information is presented in thousands AMD, unless otherwise indicated. The official Central Bank of Armenia (CBA) exchange rates at 31 December 2020 and 31 December 2019 were 522.59 AMD and 479.7 AMD to 1 USD, 641.11 AMD and 537.26 AMD to 1 EUR respectively.
e) Measurement of fair values A number of the Group’s accounting policies and disclosures require the measurement of fair values, for both financial and non-financial assets and liabilities. When measuring the fair value of an asset or a liability, the Group uses market observable data as far as possible. Fair values are categorised into different levels in a fair value hierarchy based on the inputs used in the valuation techniques as follows:
► Level 1: quoted prices (unadjusted) in active markets for identical assets or liabilities;
► Level 2: inputs other than quoted prices included in Level 1 that are observable for the asset or liability, either directly (i.e. as prices) or indirectly (i.e. derived from prices);
► Level 3: inputs for the asset or liability that are not based on observable market data (unobservable inputs). If the inputs used to measure the fair value of an asset or a liability might be categorised in different levels of the fair value hierarchy, then the fair value measurement is categorised in its entirety in the same level of the fair value hierarchy as the lowest level input that is significant to the entire measurement. Further information about the measuring fair values is included in Note 32.
3. Basis of consolidation The consolidated financial statements comprise the financial statements of Zangezur Copper Molybdenum Combine CJSC and its subsidiary as at 31 December 2020. A subsidiary is an entity controlled by the Group. Control exists when the Group is exposed, or has rights, to variable returns from its involvement with the investee and has the ability to affect those returns through its power over the investee. Specifically, the Group controls an investee if, and only if, the Group has all of the following:
► Power over the investee (i.e., existing rights that give it the current ability to direct the relevant activities of the investee);
► Exposure, or rights, to variable returns from its involvement with the investee;
► The ability to use its power over the investee to affect its returns.
Zangezur Copper Molybdenum Combine CJSC Notes to the consolidated financial statements for 2020
7
3. Basis of consolidation (continued) Generally, there is a presumption that a majority of voting rights results in control. When the Group has less than a majority of the voting, or similar, rights of an investee, it considers all relevant facts and circumstances in assessing whether it has power over an investee, including:
► The contractual arrangement(s) with the other vote holders of the investee;
► Rights arising from other contractual arrangements;
► The Group’s voting rights and potential voting rights. The relevant activities are those which significantly affect the subsidiary’s returns. The ability to approve the operating and capital budget of a subsidiary and the ability to appoint key management personnel are decisions that demonstrate that the Group has the existing rights to direct the relevant activities of a subsidiary. The Group re-assesses whether or not it controls an investee if facts and circumstances indicate that there are changes to one or more of the three elements of control. Consolidation of a subsidiary begins when the Group obtains control over the subsidiary and ceases when the Group loses control of the subsidiary. Assets, liabilities, income and expenses of a subsidiary acquired or disposed of during the year are included in the statement of profit or loss and other comprehensive income from the date the Group gains control until the date the Group ceases to control the subsidiary. Where the Group’s interest is less than 100 per cent, the interest attributable to outside shareholders is reflected in non-controlling interests (NCIs). Profit or loss and each component of other comprehensive income (OCI) are attributed to the equity holders of the parent of the Group and to the NCIs, even if this results in the non-controlling interests having a deficit balance. When necessary, adjustments are made to the financial statements of subsidiaries to bring their accounting policies in line with the Group’s accounting policies. All intra-group assets and liabilities, equity, income, expenses and cash flows relating to transactions between members of the Group are eliminated in full on consolidation. A change in the ownership interest of a subsidiary, without a loss of control, is accounted for as an equity transaction. If the Group loses control over a subsidiary, it derecognises the related assets (including goodwill), liabilities, non-controlling interest and other components of equity, while any resultant gain or loss is recognised in profit or loss. Any investment retained is recognised at fair value.
4. Significant accounting judgments, estimates and assumptions
a) Use of judgments, estimates and assumptions The preparation of the Group’s consolidated financial statements requires management to make judgments, estimates and assumptions that affect the reported amounts of revenues, expenses, assets and liabilities, and the accompanying disclosures, and the disclosure of contingent liabilities at the date of the consolidated financial statements. Estimates and assumptions are continually evaluated and are based on management’s experience and other factors, including expectations of future events that are believed to be reasonable under the circumstances. Uncertainty about these assumptions and estimates could result in outcomes that require a material adjustment to the carrying amount of assets or liabilities affected in future periods. In particular, the Group has identified a number of areas where significant judgments, estimates and assumptions are required. Further information on each of these areas and how they impact the various accounting policies are described with the associated accounting policy note within the related qualitative and quantitative note as described below. These include: Judgments ► Note 16 “Stripping activity asset”;
► Note 2 (d) “Functional currency”;
► Note 37 (c) “Recognition of revenue”;
► Note 37 (h) “Income tax”;
► Note 37 (c) “Principal versus agent considerations”;
► Note 37 (c) “Consideration of significant financing component in a contract”;
► Note 37 (q) “Group as lessee”.
Zangezur Copper Molybdenum Combine CJSC Notes to the consolidated financial statements for 2020
8
4. Significant accounting judgements, estimates and assumptions (continued)
a) Use of judgments, estimates and assumptions (continued) Estimates and assumptions ► Note 11 “Other expenses” − royalty estimation;
► Note 3 (b) “Ore reserves” − valuation of mineral reserves that are the basis for future cash flow estimates;
► Note 37 (k) “Property, plant and equipment” − determination of units of production depreciation calculations;
► Note 37 (k) “Property, plant and equipment” − useful lives of property, plant and equipment;
► Note 26 (a) “Provisions”;
► Note 37 (a) “Recoverability of assets – impairment of non-financial assets”;
► Note 37 (j) “Inventories”;
► Note 37 “Financial instruments and risk management” − fair values of financial instruments;
► Note 37 – “Estimating stand-alone selling price (services)”;
► Note 21 “Trade and other receivables” – impairment of trade and other receivables. The key assumptions concerning the future and other key sources of estimation uncertainty at the reporting date that have a significant risk of causing a material adjustment to the carrying amounts of assets and liabilities within the next financial year, are described below or in the related accounting policy note (see list above for references). The Group based its assumptions and estimates on parameters available when the consolidated financial statements were prepared. Existing circumstances and assumptions about future developments, however, may change due to market change or circumstances arising beyond the control of the Group. Such changes are reflected in the assumptions when they occur. Ore reserves and exploitation license Ore reserves and mineral resource estimates are estimates of the amount of ore that can be economically and legally extracted from the Group’s mining properties. Such reserves and mineral resource estimates and changes to these may impact the Group’s reported consolidated financial position and results, in the following way:
► The carrying value of property, plant and equipment, stripping activity asset, exploration and evaluation assets, may be affected due to changes in estimated future cash flows;
► Depreciation and amortisation charges in the statement of profit or loss and other comprehensive income may change where such charges are determined using the UOP method, or where the useful life of the related assets change;
► Capitalised stripping costs recognised in the statement of financial position as either part of property, plant and equipment, other non-current assets or inventory or charged to profit or loss may change due to changes in stripping ratios;
► Provisions for site restoration and environmental provisions may change where reserve estimate changes affect expectations about when such activities will occur and the associated cost of these activities;
► The recognition and carrying value of deferred income tax assets may change due to changes in the judgments regarding the existence of such assets and in estimates of the likely recovery of such assets.
The Group operates under a License which expires in 2041, in accordance with License Agreement No. PV-232 dated 27 November 2012. In preparing these consolidated financial statements management has assumed that the License will be prolonged beyond 2041. This assumption is based on the provisions of the Mining Code which state that the License can be prolonged based on submitted application. Further, the Group obtained JORC compliant mineral resource estimate report NI43-101 as of October 2015, issued by Golder Associates. The Group uses the above estimates in evaluating the timing of site restoration costs, useful lives and impairment of property, plant and equipment, stripping activity asset and exploration and evaluation asset.
Zangezur Copper Molybdenum Combine CJSC Notes to the consolidated financial statements for 2020
9
5. Segment information The Group’s principal activity is mining and the production of copper and molybdenum concentrate. Majority of the Group’s assets and operations are located in Syunik province, Armenia. The Group has insignificant balances of current and non-current assets outside Armenia, in Ethiopia and Republic off Sudan. For management purposes, the Group is organised into business units based on the main types of activity and has one reportable operating segment:
► The segment develops and mines copper and molybdenum concentrate. The Board of the Group monitors the operating results of the only business unit for the purpose of making decisions about resource allocation and performance assessment and is considered to be the Group’s Chief Operating Decision Maker. Revenue per type of products and services rendered is presented in Note 6 and the concentration per customers is presented in Note 31. Revenues from sale of concentrates and ferro-molybdenum comprised 97% of total revenue with customers (2019: 98%).
6. Revenue from contracts with customers ‘000 AMD 2020 2019
Revenue from sale of copper concentrate 132,812,424 123,064,659 Revenue from the sale of molybdenum concentrate 46,787,491 1,486,907 Revenue from sale of ferro-molybdenum 45,541,253 66,157,603 Revenue from freight/shipping services 7,738,608 5,013,839
Revenue from sale of other products 81,841 104,658
232,961,617 195,827,666
During 2019 a contract cancelation fee in the amount of AMD 21,199,155 thousand was allocated to the Revenue from contracts with customers, by deducting revenue from sale of copper concentrate. Revenues from sale of concentrates and ferro-molybdenum: 2020 2019
‘000 AMD Dry metric
tonnes ‘000 AMD Dry metric
tonnes
Copper concentrate 132,812,424 238,817 123,064,659 302,674 Molybdenum concentrate 46,787,491 12,498 1,486,907 383
Ferro-molybdenum 45,541,253 7,250 66,157,603 8,851
225,141,168 190,709,169 All revenue from copper and molybdenum concentrate and ferro-molybdenum is recognised at a point in time when control transfers (Note 33) and revenue from freight/shipping services is recognised over time as the services are provided. At 31 December 2020 the Group had outstanding provisionally priced sales of AMD 14,924,549 thousand consisting of 8,747 dry metric tonnes of copper concentrate, 419 dry metric tonnes of ferro-molybdenum and 365 dry metric tonnes of molybdenum concentrate (2019: AMD 21,692,936 thousand consisting of 30,277 dry metric tonnes of copper concentrate, 513 dry metric tonnes of ferro-molybdenum and 104 dry metric tonnes of molybdenum concentrate) which had a fair value of approximately AMD 15,440,561 thousand (2019: AMD 22,391,338 thousand).
7. Cost of sales ‘000 AMD 2020 2019
Cost of sales of copper, molybdenum concentrate and ferro-molybdenum 123,902,644 134,704,926
Cost of other sales 105,314 537,285
124,007,958 135,242,211
Zangezur Copper Molybdenum Combine CJSC Notes to the consolidated financial statements for 2020
10
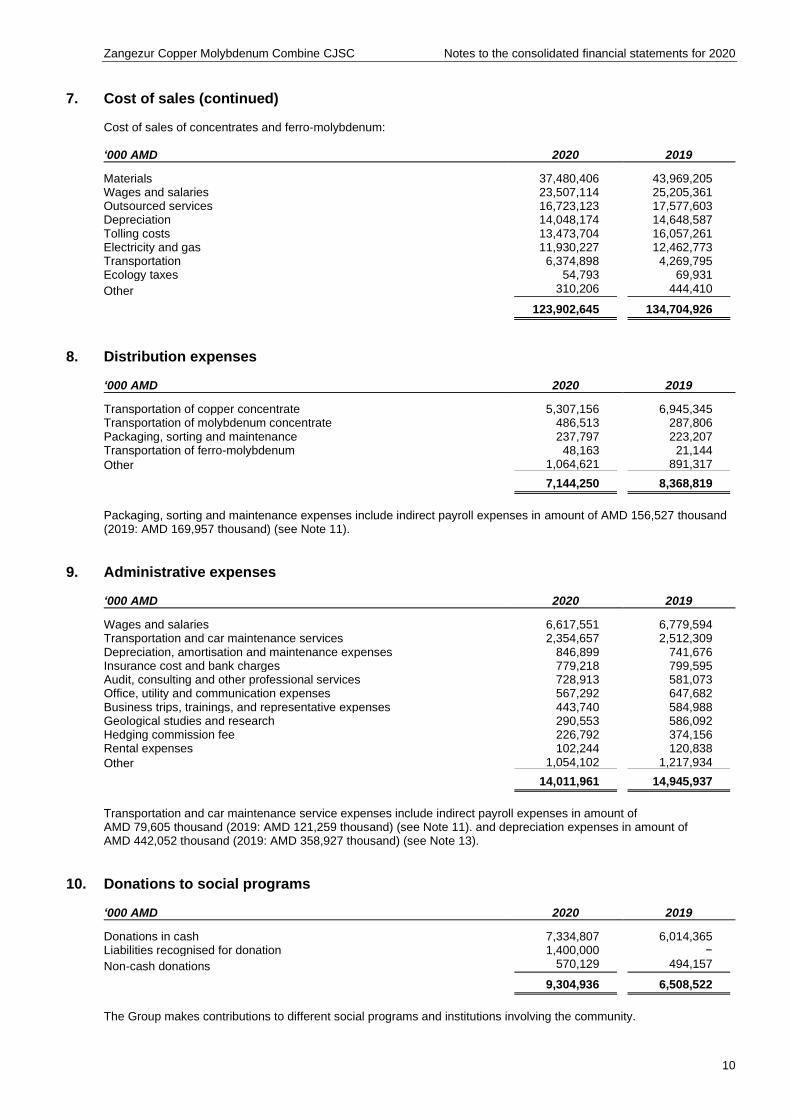
7. Cost of sales (continued) Cost of sales of concentrates and ferro-molybdenum: ‘000 AMD 2020 2019
Materials 37,480,406 43,969,205 Wages and salaries 23,507,114 25,205,361 Outsourced services 16,723,123 17,577,603 Depreciation 14,048,174 14,648,587 Tolling costs 13,473,704 16,057,261 Electricity and gas 11,930,227 12,462,773 Transportation 6,374,898 4,269,795 Ecology taxes 54,793 69,931
Other 310,206 444,410
123,902,645 134,704,926
8. Distribution expenses ‘000 AMD 2020 2019
Transportation of copper concentrate 5,307,156 6,945,345 Transportation of molybdenum concentrate 486,513 287,806 Packaging, sorting and maintenance 237,797 223,207 Transportation of ferro-molybdenum 48,163 21,144
Other 1,064,621 891,317
7,144,250 8,368,819
Packaging, sorting and maintenance expenses include indirect payroll expenses in amount of AMD 156,527 thousand (2019: AMD 169,957 thousand) (see Note 11).
9. Administrative expenses ‘000 AMD 2020 2019
Wages and salaries 6,617,551 6,779,594 Transportation and car maintenance services 2,354,657 2,512,309 Depreciation, amortisation and maintenance expenses 846,899 741,676 Insurance cost and bank charges 779,218 799,595 Audit, consulting and other professional services 728,913 581,073 Office, utility and communication expenses 567,292 647,682 Business trips, trainings, and representative expenses 443,740 584,988 Geological studies and research 290,553 586,092 Hedging commission fee 226,792 374,156 Rental expenses 102,244 120,838
Other 1,054,102 1,217,934
14,011,961 14,945,937
Transportation and car maintenance service expenses include indirect payroll expenses in amount of AMD 79,605 thousand (2019: AMD 121,259 thousand) (see Note 11). and depreciation expenses in amount of AMD 442,052 thousand (2019: AMD 358,927 thousand) (see Note 13).
10. Donations to social programs ‘000 AMD 2020 2019
Donations in cash 7,334,807 6,014,365 Liabilities recognised for donation 1,400,000 −
Non-cash donations 570,129 494,157
9,304,936 6,508,522
The Group makes contributions to different social programs and institutions involving the community.
Zangezur Copper Molybdenum Combine CJSC Notes to the consolidated financial statements for 2020
11
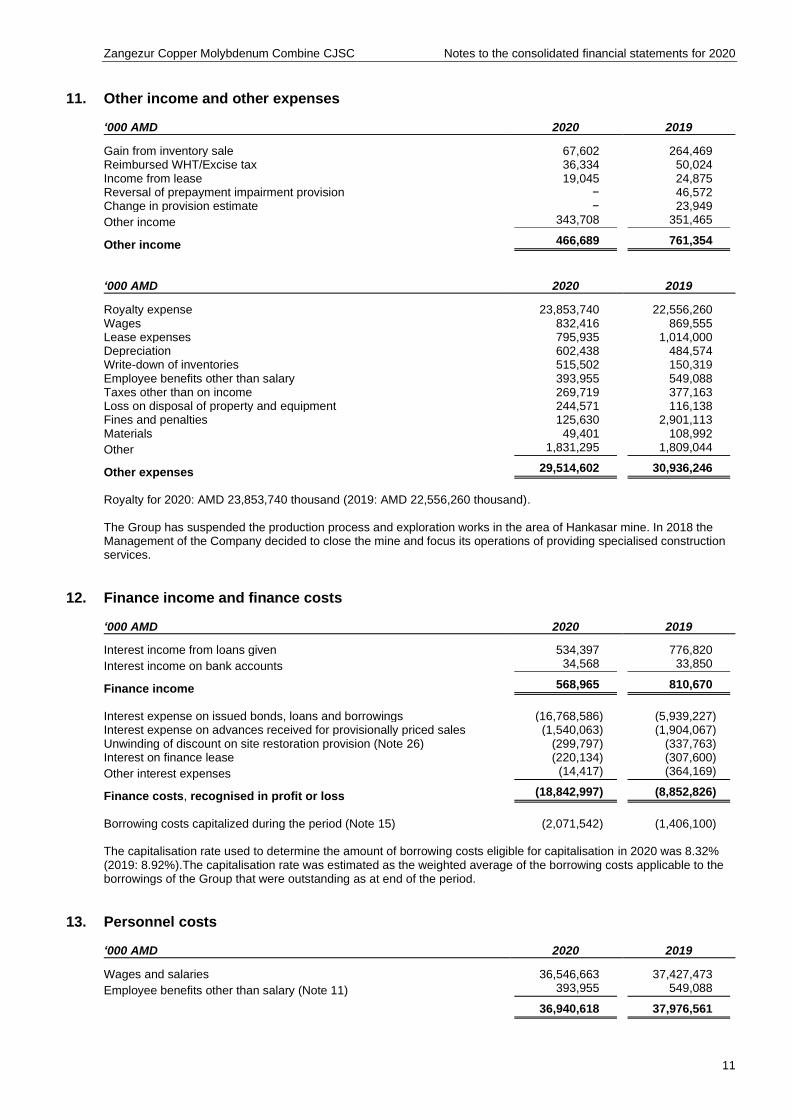
11. Other income and other expenses ‘000 AMD 2020 2019
Gain from inventory sale 67,602 264,469 Reimbursed WHT/Excise tax 36,334 50,024 Income from lease 19,045 24,875 Reversal of prepayment impairment provision − 46,572 Change in provision estimate − 23,949
Other income 343,708 351,465
Other income 466,689 761,354
‘000 AMD 2020 2019
Royalty expense 23,853,740 22,556,260 Wages 832,416 869,555 Lease expenses 795,935 1,014,000 Depreciation 602,438 484,574 Write-down of inventories 515,502 150,319 Employee benefits other than salary 393,955 549,088 Taxes other than on income 269,719 377,163 Loss on disposal of property and equipment 244,571 116,138 Fines and penalties 125,630 2,901,113 Materials 49,401 108,992
Other 1,831,295 1,809,044
Other expenses 29,514,602 30,936,246
Royalty for 2020: AMD 23,853,740 thousand (2019: AMD 22,556,260 thousand). The Group has suspended the production process and exploration works in the area of Hankasar mine. In 2018 the Management of the Company decided to close the mine and focus its operations of providing specialised construction services.
12. Finance income and finance costs ‘000 AMD 2020 2019
Interest income from loans given 534,397 776,820
Interest income on bank accounts 34,568 33,850
Finance income 568,965 810,670
Interest expense on issued bonds, loans and borrowings (16,768,586) (5,939,227) Interest expense on advances received for provisionally priced sales (1,540,063) (1,904,067) Unwinding of discount on site restoration provision (Note 26) (299,797) (337,763) Interest on finance lease (220,134) (307,600)
Other interest expenses (14,417) (364,169)
Finance costs, recognised in profit or loss (18,842,997) (8,852,826)
Borrowing costs capitalized during the period (Note 15) (2,071,542) (1,406,100) The capitalisation rate used to determine the amount of borrowing costs eligible for capitalisation in 2020 was 8.32% (2019: 8.92%).The capitalisation rate was estimated as the weighted average of the borrowing costs applicable to the borrowings of the Group that were outstanding as at end of the period.
13. Personnel costs ‘000 AMD 2020 2019
Wages and salaries 36,546,663 37,427,473
Employee benefits other than salary (Note 11) 393,955 549,088
36,940,618 37,976,561
Zangezur Copper Molybdenum Combine CJSC Notes to the consolidated financial statements for 2020
12
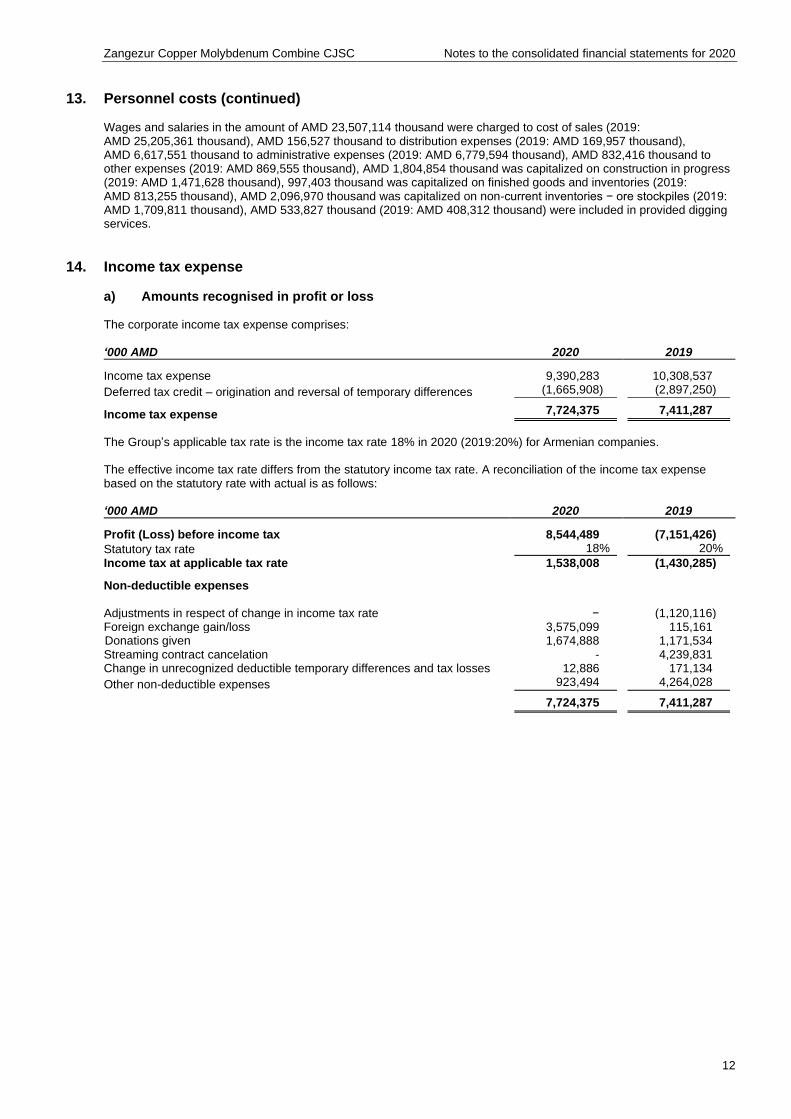
13. Personnel costs (continued) Wages and salaries in the amount of AMD 23,507,114 thousand were charged to cost of sales (2019: AMD 25,205,361 thousand), AMD 156,527 thousand to distribution expenses (2019: AMD 169,957 thousand), AMD 6,617,551 thousand to administrative expenses (2019: AMD 6,779,594 thousand), AMD 832,416 thousand to other expenses (2019: AMD 869,555 thousand), AMD 1,804,854 thousand was capitalized on construction in progress (2019: AMD 1,471,628 thousand), 997,403 thousand was capitalized on finished goods and inventories (2019: AMD 813,255 thousand), AMD 2,096,970 thousand was capitalized on non-current inventories − ore stockpiles (2019: AMD 1,709,811 thousand), AMD 533,827 thousand (2019: AMD 408,312 thousand) were included in provided digging services.
14. Income tax expense
a) Amounts recognised in profit or loss The corporate income tax expense comprises: ‘000 AMD 2020 2019
Income tax expense 9,390,283 10,308,537
Deferred tax credit – origination and reversal of temporary differences (1,665,908) (2,897,250)
Income tax expense 7,724,375 7,411,287
The Group’s applicable tax rate is the income tax rate 18% in 2020 (2019:20%) for Armenian companies. The effective income tax rate differs from the statutory income tax rate. A reconciliation of the income tax expense based on the statutory rate with actual is as follows: ‘000 AMD 2020 2019
Profit (Loss) before income tax 8,544,489 (7,151,426)
Statutory tax rate 18% 20%
Income tax at applicable tax rate 1,538,008 (1,430,285)
Non-deductible expenses Adjustments in respect of change in income tax rate − (1,120,116) Foreign exchange gain/loss 3,575,099 115,161 Donations given 1,674,888 1,171,534 Streaming contract cancelation - 4,239,831 Change in unrecognized deductible temporary differences and tax losses 12,886 171,134
Other non-deductible expenses 923,494 4,264,028
7,724,375 7,411,287
Zangezur Copper Molybdenum Combine CJSC Notes to the consolidated financial statements for 2020
13
14. Income tax expense (continued)
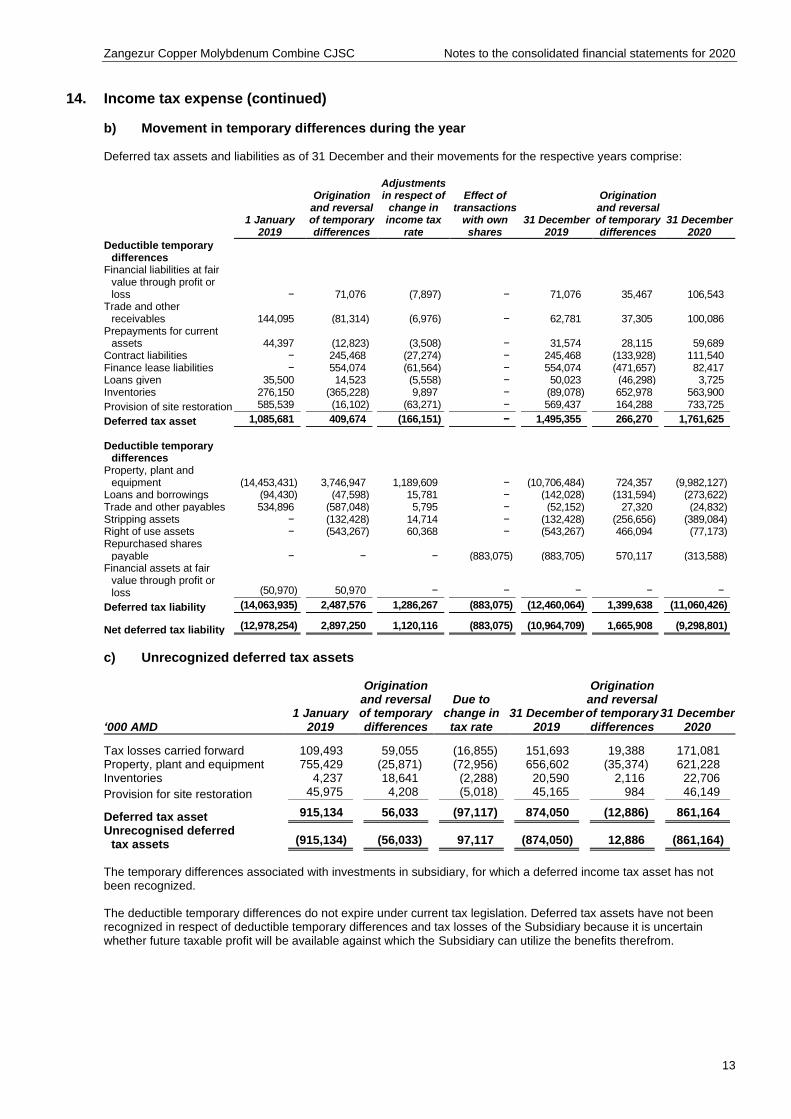
b) Movement in temporary differences during the year Deferred tax assets and liabilities as of 31 December and their movements for the respective years comprise:
1 January 2019
Origination and reversal of temporary differences
Adjustments in respect of
change in income tax
rate
Effect of transactions
with own shares
31 December 2019
Origination and reversal of temporary differences
31 December 2020
Deductible temporary differences
Financial liabilities at fair value through profit or loss − 71,076 (7,897) − 71,076 35,467 106,543
Trade and other receivables 144,095 (81,314) (6,976) − 62,781 37,305 100,086
Prepayments for current assets 44,397 (12,823) (3,508) − 31,574 28,115 59,689
Contract liabilities − 245,468 (27,274) − 245,468 (133,928) 111,540 Finance lease liabilities − 554,074 (61,564) − 554,074 (471,657) 82,417 Loans given 35,500 14,523 (5,558) − 50,023 (46,298) 3,725 Inventories 276,150 (365,228) 9,897 − (89,078) 652,978 563,900
Provision of site restoration 585,539 (16,102) (63,271) − 569,437 164,288 733,725
Deferred tax asset 1,085,681 409,674 (166,151) − 1,495,355 266,270 1,761,625
Deductible temporary
differences Property, plant and
equipment (14,453,431) 3,746,947 1,189,609 − (10,706,484) 724,357 (9,982,127) Loans and borrowings (94,430) (47,598) 15,781 − (142,028) (131,594) (273,622) Trade and other payables 534,896 (587,048) 5,795 − (52,152) 27,320 (24,832) Stripping assets − (132,428) 14,714 − (132,428) (256,656) (389,084) Right of use assets − (543,267) 60,368 − (543,267) 466,094 (77,173) Repurchased shares
payable − − − (883,075) (883,705) 570,117 (313,588) Financial assets at fair
value through profit or loss (50,970) 50,970 − − − − −
Deferred tax liability (14,063,935) 2,487,576 1,286,267 (883,075) (12,460,064) 1,399,638 (11,060,426)
Net deferred tax liability (12,978,254) 2,897,250 1,120,116 (883,075) (10,964,709) 1,665,908 (9,298,801)
c) Unrecognized deferred tax assets
‘000 AMD 1 January
2019
Origination and reversal of temporary differences
Due to change in tax rate
31 December 2019
Origination and reversal of temporary differences
31 December 2020
Tax losses carried forward 109,493 59,055 (16,855) 151,693 19,388 171,081 Property, plant and equipment 755,429 (25,871) (72,956) 656,602 (35,374) 621,228 Inventories 4,237 18,641 (2,288) 20,590 2,116 22,706
Provision for site restoration 45,975 4,208 (5,018) 45,165 984 46,149
Deferred tax asset 915,134 56,033 (97,117) 874,050 (12,886) 861,164
Unrecognised deferred tax assets (915,134) (56,033) 97,117 (874,050) 12,886 (861,164)
The temporary differences associated with investments in subsidiary, for which a deferred income tax asset has not been recognized. The deductible temporary differences do not expire under current tax legislation. Deferred tax assets have not been recognized in respect of deductible temporary differences and tax losses of the Subsidiary because it is uncertain whether future taxable profit will be available against which the Subsidiary can utilize the benefits therefrom.
Zangezur Copper Molybdenum Combine CJSC Notes to the consolidated financial statements for 2020
14
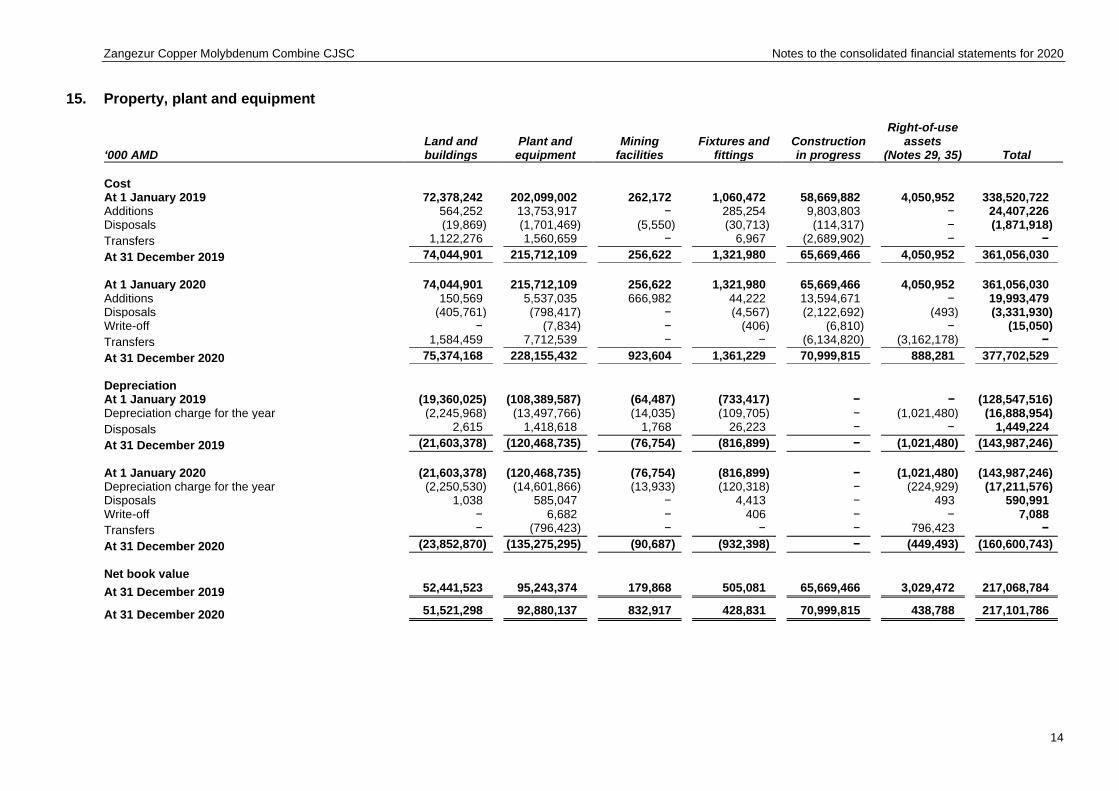
15. Property, plant and equipment
‘000 AMD Land and buildings
Plant and equipment
Mining facilities
Fixtures and fittings
Construction in progress
Right-of-use assets
(Notes 29, 35) Total
Cost At 1 January 2019 72,378,242 202,099,002 262,172 1,060,472 58,669,882 4,050,952 338,520,722 Additions 564,252 13,753,917 − 285,254 9,803,803 − 24,407,226 Disposals (19,869) (1,701,469) (5,550) (30,713) (114,317) − (1,871,918)
Transfers 1,122,276 1,560,659 − 6,967 (2,689,902) − −
At 31 December 2019 74,044,901 215,712,109 256,622 1,321,980 65,669,466 4,050,952 361,056,030
At 1 January 2020 74,044,901 215,712,109 256,622 1,321,980 65,669,466 4,050,952 361,056,030 Additions 150,569 5,537,035 666,982 44,222 13,594,671 − 19,993,479 Disposals (405,761) (798,417) − (4,567) (2,122,692) (493) (3,331,930) Write-off − (7,834) − (406) (6,810) − (15,050)
Transfers 1,584,459 7,712,539 − − (6,134,820) (3,162,178) −
At 31 December 2020 75,374,168 228,155,432 923,604 1,361,229 70,999,815 888,281 377,702,529
Depreciation At 1 January 2019 (19,360,025) (108,389,587) (64,487) (733,417) − − (128,547,516) Depreciation charge for the year (2,245,968) (13,497,766) (14,035) (109,705) − (1,021,480) (16,888,954)
Disposals 2,615 1,418,618 1,768 26,223 − − 1,449,224
At 31 December 2019 (21,603,378) (120,468,735) (76,754) (816,899) − (1,021,480) (143,987,246)
At 1 January 2020 (21,603,378) (120,468,735) (76,754) (816,899) − (1,021,480) (143,987,246) Depreciation charge for the year (2,250,530) (14,601,866) (13,933) (120,318) − (224,929) (17,211,576) Disposals 1,038 585,047 − 4,413 − 493 590,991 Write-off − 6,682 − 406 − − 7,088
Transfers − (796,423) − − − 796,423 −
At 31 December 2020 (23,852,870) (135,275,295) (90,687) (932,398) − (449,493) (160,600,743)
Net book value
At 31 December 2019 52,441,523 95,243,374 179,868 505,081 65,669,466 3,029,472 217,068,784
At 31 December 2020 51,521,298 92,880,137 832,917 428,831 70,999,815 438,788 217,101,786
Zangezur Copper Molybdenum Combine CJSC Notes to the consolidated financial statements for 2020
15
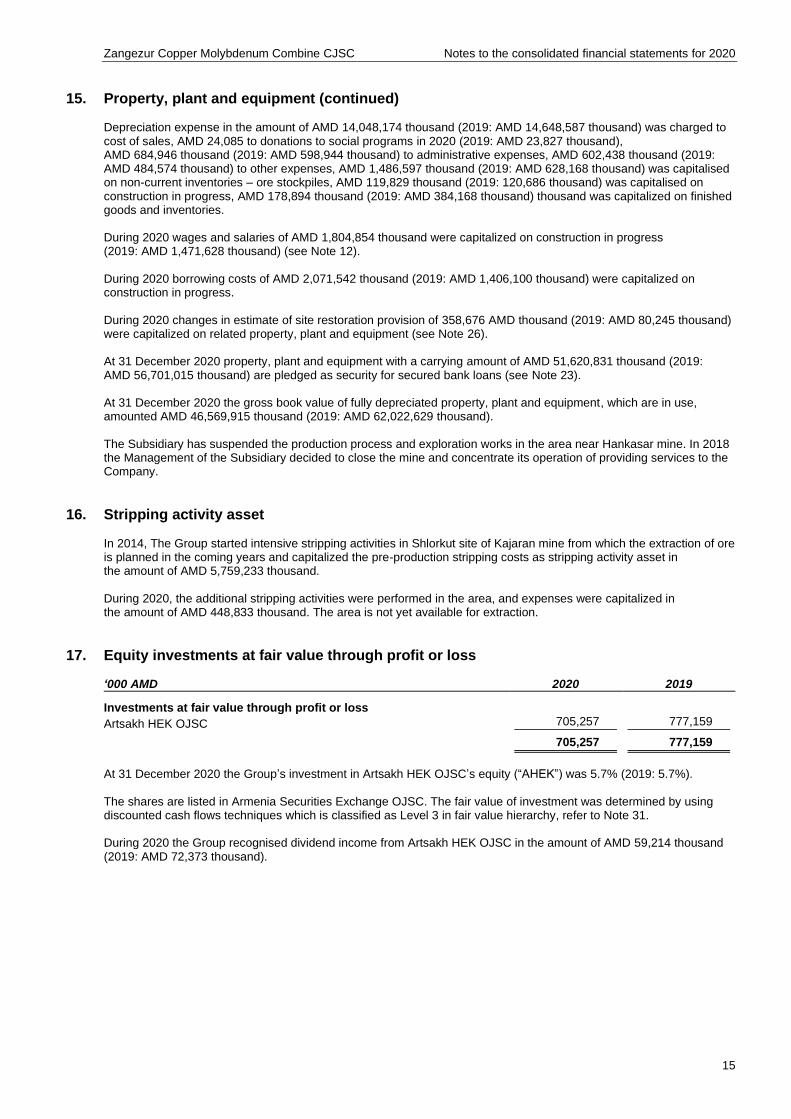
15. Property, plant and equipment (continued) Depreciation expense in the amount of AMD 14,048,174 thousand (2019: AMD 14,648,587 thousand) was charged to cost of sales, AMD 24,085 to donations to social programs in 2020 (2019: AMD 23,827 thousand), AMD 684,946 thousand (2019: AMD 598,944 thousand) to administrative expenses, AMD 602,438 thousand (2019: AMD 484,574 thousand) to other expenses, AMD 1,486,597 thousand (2019: AMD 628,168 thousand) was capitalised on non-current inventories – ore stockpiles, AMD 119,829 thousand (2019: 120,686 thousand) was capitalised on construction in progress, AMD 178,894 thousand (2019: AMD 384,168 thousand) thousand was capitalized on finished goods and inventories. During 2020 wages and salaries of AMD 1,804,854 thousand were capitalized on construction in progress (2019: AMD 1,471,628 thousand) (see Note 12). During 2020 borrowing costs of AMD 2,071,542 thousand (2019: AMD 1,406,100 thousand) were capitalized on construction in progress. During 2020 changes in estimate of site restoration provision of 358,676 AMD thousand (2019: AMD 80,245 thousand) were capitalized on related property, plant and equipment (see Note 26). At 31 December 2020 property, plant and equipment with a carrying amount of AMD 51,620,831 thousand (2019: AMD 56,701,015 thousand) are pledged as security for secured bank loans (see Note 23). At 31 December 2020 the gross book value of fully depreciated property, plant and equipment, which are in use, amounted AMD 46,569,915 thousand (2019: AMD 62,022,629 thousand). The Subsidiary has suspended the production process and exploration works in the area near Hankasar mine. In 2018 the Management of the Subsidiary decided to close the mine and concentrate its operation of providing services to the Company.
16. Stripping activity asset In 2014, The Group started intensive stripping activities in Shlorkut site of Kajaran mine from which the extraction of ore is planned in the coming years and capitalized the pre-production stripping costs as stripping activity asset in the amount of AMD 5,759,233 thousand. During 2020, the additional stripping activities were performed in the area, and expenses were capitalized in the amount of AMD 448,833 thousand. The area is not yet available for extraction.
17. Equity investments at fair value through profit or loss ‘000 AMD 2020 2019
Investments at fair value through profit or loss
Artsakh HEK OJSC 705,257 777,159
705,257 777,159
At 31 December 2020 the Group’s investment in Artsakh HEK OJSC’s equity (“AHEK”) was 5.7% (2019: 5.7%). The shares are listed in Armenia Securities Exchange OJSC. The fair value of investment was determined by using discounted cash flows techniques which is classified as Level 3 in fair value hierarchy, refer to Note 31. During 2020 the Group recognised dividend income from Artsakh HEK OJSC in the amount of AMD 59,214 thousand (2019: AMD 72,373 thousand).
Zangezur Copper Molybdenum Combine CJSC Notes to the consolidated financial statements for 2020
16
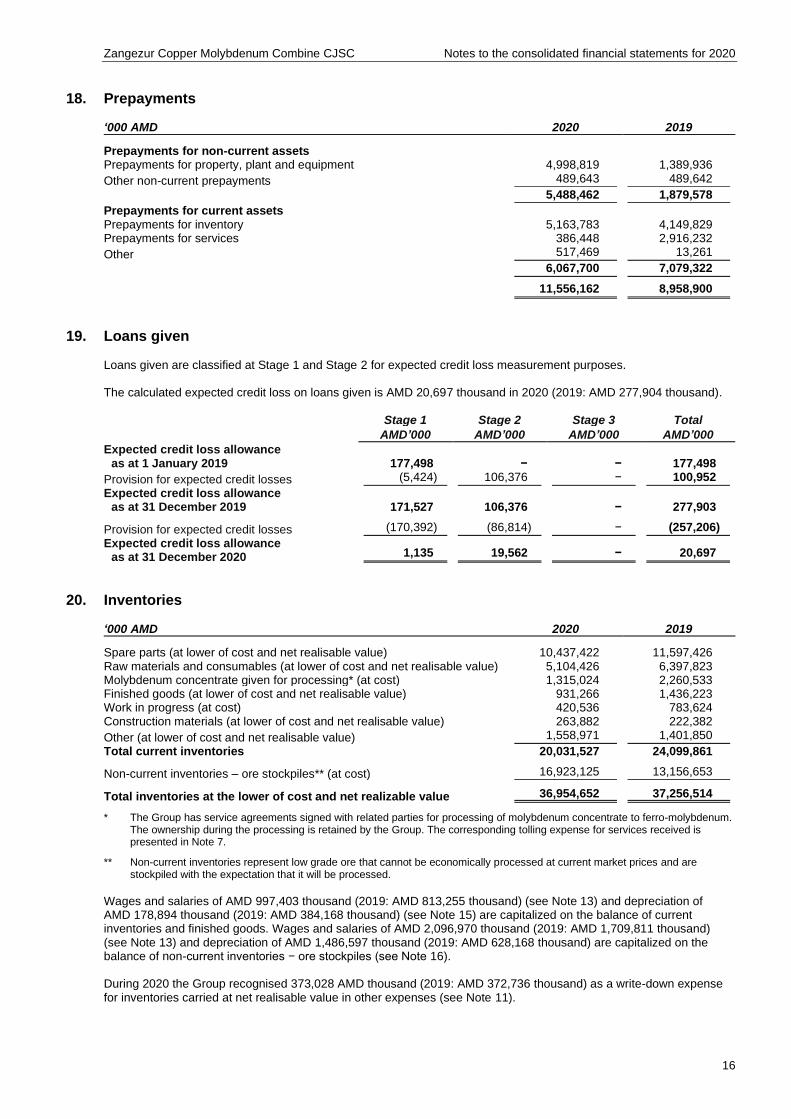
18. Prepayments ‘000 AMD 2020 2019
Prepayments for non-current assets Prepayments for property, plant and equipment 4,998,819 1,389,936
Other non-current prepayments 489,643 489,642
5,488,462 1,879,578
Prepayments for current assets Prepayments for inventory 5,163,783 4,149,829 Prepayments for services 386,448 2,916,232
Other 517,469 13,261
6,067,700 7,079,322
11,556,162 8,958,900
19. Loans given Loans given are classified at Stage 1 and Stage 2 for expected credit loss measurement purposes. The calculated expected credit loss on loans given is AMD 20,697 thousand in 2020 (2019: AMD 277,904 thousand).
Stage 1 Stage 2 Stage 3 Total
AMD’000 AMD’000 AMD’000 AMD’000
Expected credit loss allowance as at 1 January 2019 177,498 − − 177,498
Provision for expected credit losses (5,424) 106,376 − 100,952
Expected credit loss allowance as at 31 December 2019 171,527 106,376 − 277,903
Provision for expected credit losses (170,392) (86,814) − (257,206)
Expected credit loss allowance as at 31 December 2020 1,135 19,562 − 20,697
20. Inventories ‘000 AMD 2020 2019
Spare parts (at lower of cost and net realisable value) 10,437,422 11,597,426 Raw materials and consumables (at lower of cost and net realisable value) 5,104,426 6,397,823 Molybdenum concentrate given for processing* (at cost) 1,315,024 2,260,533 Finished goods (at lower of cost and net realisable value) 931,266 1,436,223 Work in progress (at cost) 420,536 783,624 Construction materials (at lower of cost and net realisable value) 263,882 222,382
Other (at lower of cost and net realisable value) 1,558,971 1,401,850
Total current inventories 20,031,527 24,099,861
Non-current inventories – ore stockpiles** (at cost) 16,923,125 13,156,653
Total inventories at the lower of cost and net realizable value 36,954,652 37,256,514
* The Group has service agreements signed with related parties for processing of molybdenum concentrate to ferro-molybdenum. The ownership during the processing is retained by the Group. The corresponding tolling expense for services received is presented in Note 7.
** Non-current inventories represent low grade ore that cannot be economically processed at current market prices and are stockpiled with the expectation that it will be processed.
Wages and salaries of AMD 997,403 thousand (2019: AMD 813,255 thousand) (see Note 13) and depreciation of AMD 178,894 thousand (2019: AMD 384,168 thousand) (see Note 15) are capitalized on the balance of current inventories and finished goods. Wages and salaries of AMD 2,096,970 thousand (2019: AMD 1,709,811 thousand) (see Note 13) and depreciation of AMD 1,486,597 thousand (2019: AMD 628,168 thousand) are capitalized on the balance of non-current inventories − ore stockpiles (see Note 16). During 2020 the Group recognised 373,028 AMD thousand (2019: AMD 372,736 thousand) as a write-down expense for inventories carried at net realisable value in other expenses (see Note 11).
Zangezur Copper Molybdenum Combine CJSC Notes to the consolidated financial statements for 2020
17
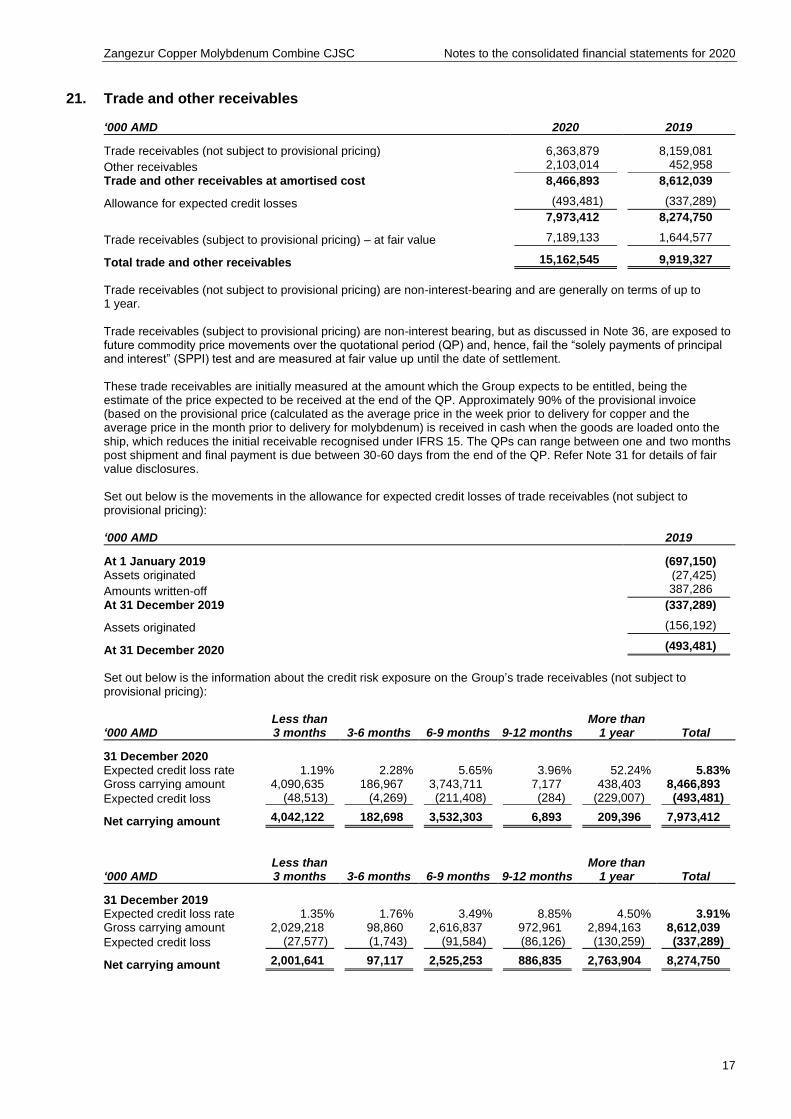
21. Trade and other receivables ‘000 AMD 2020 2019
Trade receivables (not subject to provisional pricing) 6,363,879 8,159,081
Other receivables 2,103,014 452,958
Trade and other receivables at amortised cost 8,466,893 8,612,039
Allowance for expected credit losses (493,481) (337,289)
7,973,412 8,274,750
Trade receivables (subject to provisional pricing) – at fair value 7,189,133 1,644,577
Total trade and other receivables 15,162,545 9,919,327
Trade receivables (not subject to provisional pricing) are non-interest-bearing and are generally on terms of up to 1 year. Trade receivables (subject to provisional pricing) are non-interest bearing, but as discussed in Note 36, are exposed to future commodity price movements over the quotational period (QP) and, hence, fail the “solely payments of principal and interest” (SPPI) test and are measured at fair value up until the date of settlement. These trade receivables are initially measured at the amount which the Group expects to be entitled, being the estimate of the price expected to be received at the end of the QP. Approximately 90% of the provisional invoice (based on the provisional price (calculated as the average price in the week prior to delivery for copper and the average price in the month prior to delivery for molybdenum) is received in cash when the goods are loaded onto the ship, which reduces the initial receivable recognised under IFRS 15. The QPs can range between one and two months post shipment and final payment is due between 30-60 days from the end of the QP. Refer Note 31 for details of fair value disclosures. Set out below is the movements in the allowance for expected credit losses of trade receivables (not subject to provisional pricing): ‘000 AMD 2019
At 1 January 2019 (697,150) Assets originated (27,425)
Amounts written-off 387,286
At 31 December 2019 (337,289)
Assets originated (156,192)
At 31 December 2020 (493,481)
Set out below is the information about the credit risk exposure on the Group’s trade receivables (not subject to provisional pricing):
‘000 AMD Less than 3 months 3-6 months 6-9 months 9-12 months
More than 1 year Total
31 December 2020 Expected credit loss rate 1.19% 2.28% 5.65% 3.96% 52.24% 5.83% Gross carrying amount 4,090,635 186,967 3,743,711 7,177 438,403 8,466,893
Expected credit loss (48,513) (4,269) (211,408) (284) (229,007) (493,481)
Net carrying amount 4,042,122 182,698 3,532,303 6,893 209,396 7,973,412
‘000 AMD Less than 3 months 3-6 months 6-9 months 9-12 months
More than 1 year Total
31 December 2019 Expected credit loss rate 1.35% 1.76% 3.49% 8.85% 4.50% 3.91% Gross carrying amount 2,029,218 98,860 2,616,837 972,961 2,894,163 8,612,039
Expected credit loss (27,577) (1,743) (91,584) (86,126) (130,259) (337,289)
Net carrying amount 2,001,641 97,117 2,525,253 886,835 2,763,904 8,274,750
Zangezur Copper Molybdenum Combine CJSC Notes to the consolidated financial statements for 2020
18
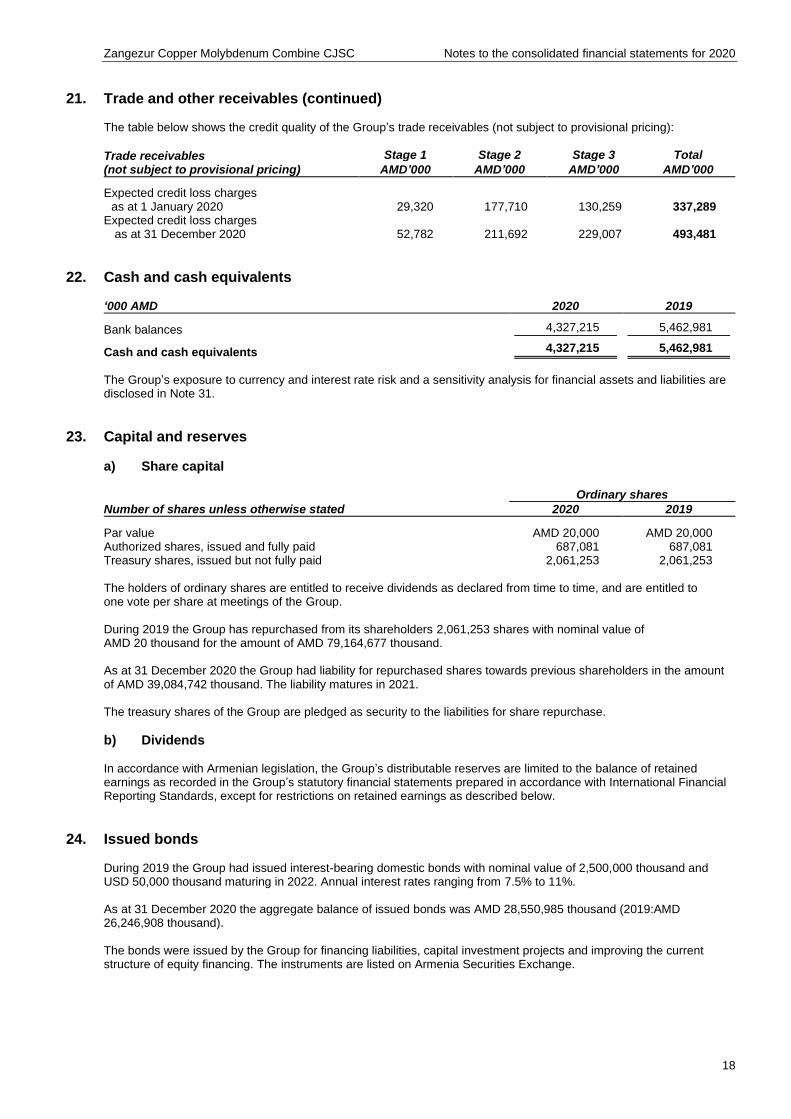
21. Trade and other receivables (continued) The table below shows the credit quality of the Group’s trade receivables (not subject to provisional pricing):
Trade receivables (not subject to provisional pricing)
Stage 1 Stage 2 Stage 3 Total
AMD’000 AMD’000 AMD’000 AMD’000
Expected credit loss charges
as at 1 January 2020 29,320 177,710 130,259 337,289 Expected credit loss charges
as at 31 December 2020 52,782 211,692 229,007 493,481
22. Cash and cash equivalents ‘000 AMD 2020 2019
Bank balances 4,327,215 5,462,981
Cash and cash equivalents 4,327,215 5,462,981
The Group’s exposure to currency and interest rate risk and a sensitivity analysis for financial assets and liabilities are disclosed in Note 31.
23. Capital and reserves
a) Share capital
Number of shares unless otherwise stated
Ordinary shares
2020 2019
Par value AMD 20,000 AMD 20,000 Authorized shares, issued and fully paid 687,081 687,081 Treasury shares, issued but not fully paid 2,061,253 2,061,253 The holders of ordinary shares are entitled to receive dividends as declared from time to time, and are entitled to one vote per share at meetings of the Group. During 2019 the Group has repurchased from its shareholders 2,061,253 shares with nominal value of AMD 20 thousand for the amount of AMD 79,164,677 thousand. As at 31 December 2020 the Group had liability for repurchased shares towards previous shareholders in the amount of AMD 39,084,742 thousand. The liability matures in 2021. The treasury shares of the Group are pledged as security to the liabilities for share repurchase.
b) Dividends In accordance with Armenian legislation, the Group’s distributable reserves are limited to the balance of retained earnings as recorded in the Group’s statutory financial statements prepared in accordance with International Financial Reporting Standards, except for restrictions on retained earnings as described below.
24. Issued bonds During 2019 the Group had issued interest-bearing domestic bonds with nominal value of 2,500,000 thousand and USD 50,000 thousand maturing in 2022. Annual interest rates ranging from 7.5% to 11%. As at 31 December 2020 the aggregate balance of issued bonds was AMD 28,550,985 thousand (2019:AMD 26,246,908 thousand). The bonds were issued by the Group for financing liabilities, capital investment projects and improving the current structure of equity financing. The instruments are listed on Armenia Securities Exchange.

Zangezur Copper Molybdenum Combine CJSC Notes to the consolidated financial statements for 2020
19
25. Loans and borrowings This note provides information about the contractual terms of the Group’s interest-bearing loans and borrowings. For more information about the Group’s exposure to interest rate, foreign currency and liquidity risk, see Note 31. ‘000 AMD 2020 2019
Non-current liabilities Secured bank loans and credit lines/overdrafts 54,430,964 21,170,845
Unsecured loans from other organizations 41,272,105 11,968,510
95,703,069 33,139,355
Current liabilities Secured bank loans and credit lines/overdrafts 11,921,844 17,499,038
Unsecured loans from other non-financial organizations 26,704,784 31,444,894
38,626,628 48,943,932
During 2019, the Group signed credit line agreement with Armenian bank with a maximum limit of USD 18,000 thousand, which expires in 2025. During 2020 the agreement was amended and the limit increased to USD 20,000 thousand. Secured bank loans include loan agreements signed in 2019 and 2020 with an Armenian bank which mature in 2025. Loans and borrowing include also secured bank revolving overdraft facilities with two Armenian banks with maximum limits of USD 13,000 thousand and USD 13,400 thousand. As at 31 December 2020 the outstanding balances are AMD 2,390,027 thousand (2019: AMD 6,088,709 thousand) and AMD 5,894,765 thousand (2019: AMD 5,985,396 thousand) respectively. The agreements were amended during 2019, as a result the overdraft agreements were prolonged and mature in December 2025. Secured bank loans and overdrafts are from the same Armenian banks and are secured by bank account balances and property, plant and equipment of the Group and by bank account balances of the Group and lands respectively (see Note 13). At 31 December 2020, the Group had available USD 10,567 thousand (2019: USD 1,261 thousand) of undrawn committed borrowing facilities. Terms and conditions of outstanding loans were as follows:
‘000 AMD Currency Nominal
interest rate Year of maturity
Carrying amount
31 December 2020 Secured bank loans USD 7.5%-9% 2025 48,077,928 Secured bank overdrafts USD 8%-9% 2021-2025 8,284,793 Unsecured loans from non-financial
organizations USD (LIBOR + 5.5%) –
(LIBOR + 7%) 2021-2022 42,193,383 Unsecured loans from non-financial
organizations USD 8.5%-10.53% 2021-2022 25,282,847
Secured bank line of credit USD 8% 2025 10,490,745
Total interest-bearing liabilities 134,329,696
‘000 AMD Currency Nominal
interest rate Year of
maturity Carrying amount
31 December 2019 Secured bank loans USD 9% 2020-2023 18,197,398 Secured bank overdrafts USD 8%-9% 2020-2025 12,074,105 Unsecured loans from non-financial
organizations USD (LIBOR + 5.5%) –
9.9% 2020-2022 43,146,904
Secured bank line of credit USD 8% 2025 8,664,880
Total interest-bearing liabilities 82,083,287
Zangezur Copper Molybdenum Combine CJSC Notes to the consolidated financial statements for 2020
20
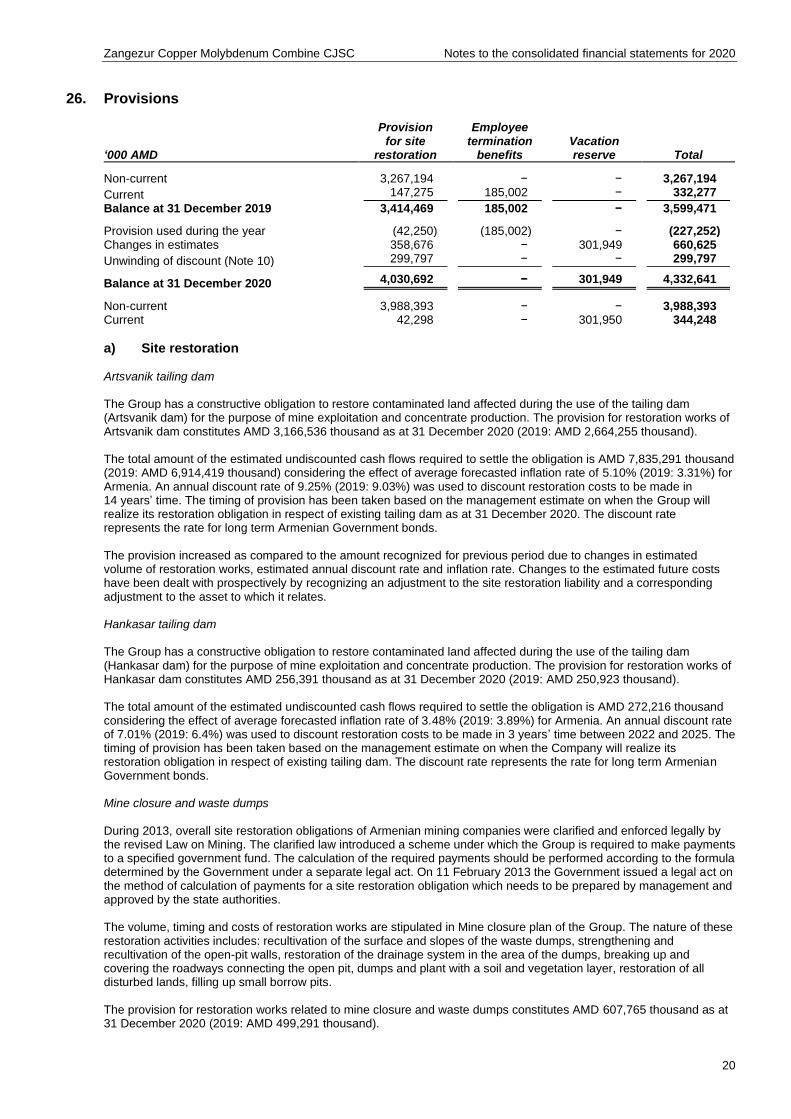
26. Provisions
‘000 AMD
Provision for site
restoration
Employee termination
benefits Vacation reserve Total
Non-current 3,267,194 − − 3,267,194
Current 147,275 185,002 − 332,277
Balance at 31 December 2019 3,414,469 185,002 − 3,599,471
Provision used during the year (42,250) (185,002) − (227,252) Changes in estimates 358,676 − 301,949 660,625
Unwinding of discount (Note 10) 299,797 − − 299,797
Balance at 31 December 2020 4,030,692 − 301,949 4,332,641
Non-current 3,988,393 − − 3,988,393 Current 42,298 − 301,950 344,248
a) Site restoration Artsvanik tailing dam The Group has a constructive obligation to restore contaminated land affected during the use of the tailing dam (Artsvanik dam) for the purpose of mine exploitation and concentrate production. The provision for restoration works of Artsvanik dam constitutes AMD 3,166,536 thousand as at 31 December 2020 (2019: AMD 2,664,255 thousand). The total amount of the estimated undiscounted cash flows required to settle the obligation is AMD 7,835,291 thousand (2019: AMD 6,914,419 thousand) considering the effect of average forecasted inflation rate of 5.10% (2019: 3.31%) for Armenia. An annual discount rate of 9.25% (2019: 9.03%) was used to discount restoration costs to be made in 14 years’ time. The timing of provision has been taken based on the management estimate on when the Group will realize its restoration obligation in respect of existing tailing dam as at 31 December 2020. The discount rate represents the rate for long term Armenian Government bonds. The provision increased as compared to the amount recognized for previous period due to changes in estimated volume of restoration works, estimated annual discount rate and inflation rate. Changes to the estimated future costs have been dealt with prospectively by recognizing an adjustment to the site restoration liability and a corresponding adjustment to the asset to which it relates. Hankasar tailing dam The Group has a constructive obligation to restore contaminated land affected during the use of the tailing dam (Hankasar dam) for the purpose of mine exploitation and concentrate production. The provision for restoration works of Hankasar dam constitutes AMD 256,391 thousand as at 31 December 2020 (2019: AMD 250,923 thousand). The total amount of the estimated undiscounted cash flows required to settle the obligation is AMD 272,216 thousand considering the effect of average forecasted inflation rate of 3.48% (2019: 3.89%) for Armenia. An annual discount rate of 7.01% (2019: 6.4%) was used to discount restoration costs to be made in 3 years’ time between 2022 and 2025. The timing of provision has been taken based on the management estimate on when the Company will realize its restoration obligation in respect of existing tailing dam. The discount rate represents the rate for long term Armenian Government bonds. Mine closure and waste dumps During 2013, overall site restoration obligations of Armenian mining companies were clarified and enforced legally by the revised Law on Mining. The clarified law introduced a scheme under which the Group is required to make payments to a specified government fund. The calculation of the required payments should be performed according to the formula determined by the Government under a separate legal act. On 11 February 2013 the Government issued a legal act on the method of calculation of payments for a site restoration obligation which needs to be prepared by management and approved by the state authorities. The volume, timing and costs of restoration works are stipulated in Mine closure plan of the Group. The nature of these restoration activities includes: recultivation of the surface and slopes of the waste dumps, strengthening and recultivation of the open-pit walls, restoration of the drainage system in the area of the dumps, breaking up and covering the roadways connecting the open pit, dumps and plant with a soil and vegetation layer, restoration of all disturbed lands, filling up small borrow pits. The provision for restoration works related to mine closure and waste dumps constitutes AMD 607,765 thousand as at 31 December 2020 (2019: AMD 499,291 thousand).
Zangezur Copper Molybdenum Combine CJSC Notes to the consolidated financial statements for 2020
21
26. Provisions (continued)
a) Site restoration (continued) The total amount of the estimated undiscounted cash flows required to settle the obligation is AMD 2,943,820 thousand. An annual discount rate of 9.46% (2019: 10.12%) was used to discount restoration costs to be made in 23 years’ time. The timing of provision has been taken based on the term of existing License Agreement of the Group. The discount rate represents the rate for long term Armenian Government bonds.
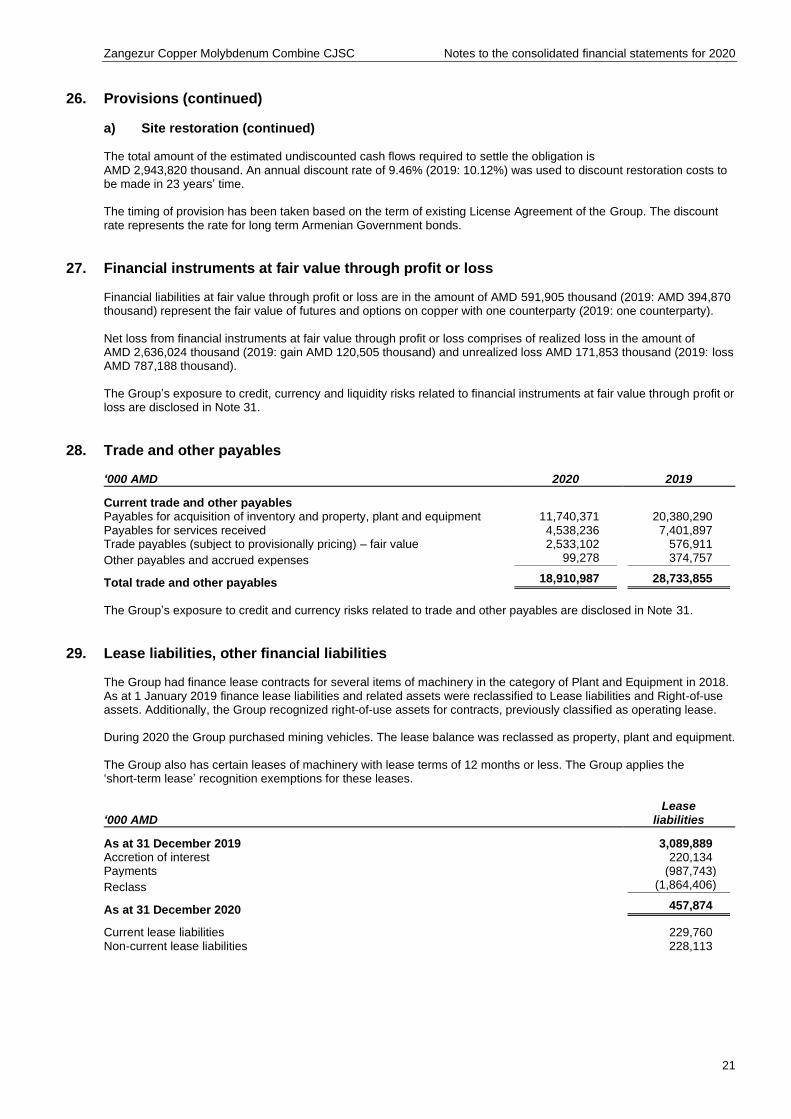
27. Financial instruments at fair value through profit or loss Financial liabilities at fair value through profit or loss are in the amount of AMD 591,905 thousand (2019: AMD 394,870 thousand) represent the fair value of futures and options on copper with one counterparty (2019: one counterparty). Net loss from financial instruments at fair value through profit or loss comprises of realized loss in the amount of AMD 2,636,024 thousand (2019: gain AMD 120,505 thousand) and unrealized loss AMD 171,853 thousand (2019: loss AMD 787,188 thousand). The Group’s exposure to credit, currency and liquidity risks related to financial instruments at fair value through profit or loss are disclosed in Note 31.
28. Trade and other payables ‘000 AMD 2020 2019
Current trade and other payables Payables for acquisition of inventory and property, plant and equipment 11,740,371 20,380,290 Payables for services received 4,538,236 7,401,897 Trade payables (subject to provisionally pricing) – fair value 2,533,102 576,911
Other payables and accrued expenses 99,278 374,757
Total trade and other payables 18,910,987 28,733,855
The Group’s exposure to credit and currency risks related to trade and other payables are disclosed in Note 31.
29. Lease liabilities, other financial liabilities The Group had finance lease contracts for several items of machinery in the category of Plant and Equipment in 2018. As at 1 January 2019 finance lease liabilities and related assets were reclassified to Lease liabilities and Right-of-use assets. Additionally, the Group recognized right-of-use assets for contracts, previously classified as operating lease. During 2020 the Group purchased mining vehicles. The lease balance was reclassed as property, plant and equipment. The Group also has certain leases of machinery with lease terms of 12 months or less. The Group applies the ‘short-term lease’ recognition exemptions for these leases.
‘000 AMD Lease
liabilities
As at 31 December 2019 3,089,889 Accretion of interest 220,134 Payments (987,743)
Reclass (1,864,406)
As at 31 December 2020 457,874
Current lease liabilities 229,760 Non-current lease liabilities 228,113
Zangezur Copper Molybdenum Combine CJSC Notes to the consolidated financial statements for 2020
22
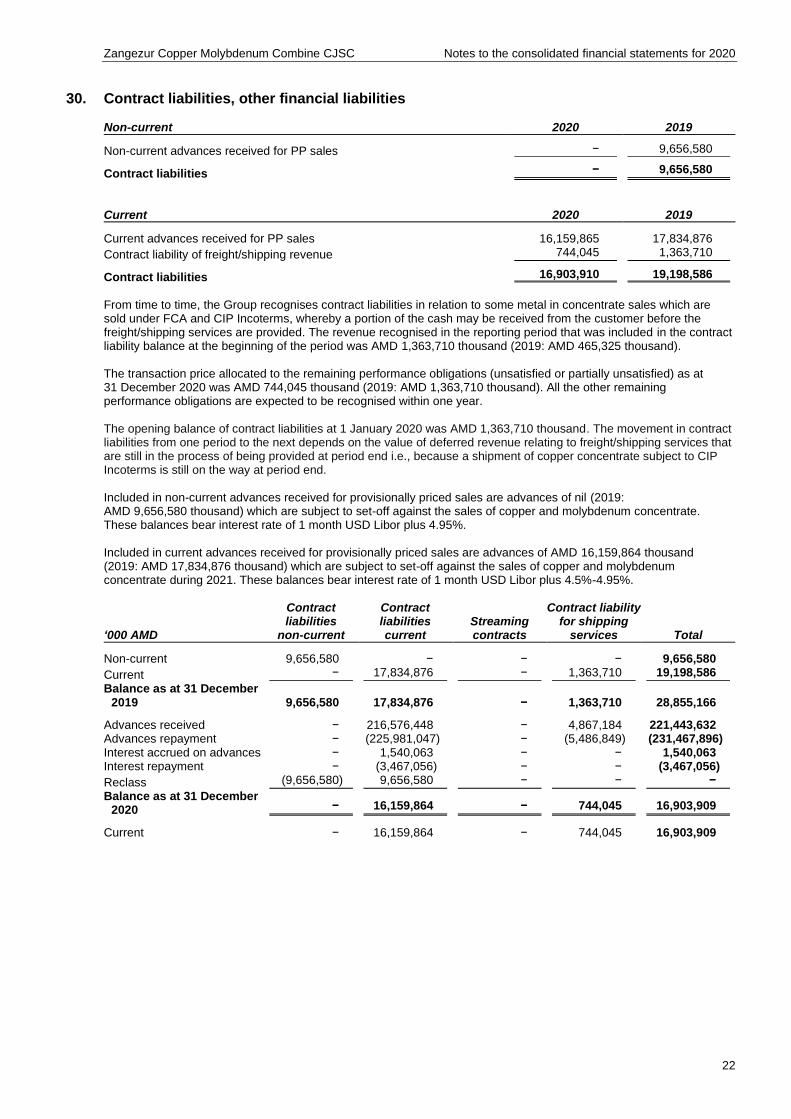
30. Contract liabilities, other financial liabilities Non-current 2020 2019
Non-current advances received for PP sales − 9,656,580
Contract liabilities − 9,656,580
Current 2020 2019
Current advances received for PP sales 16,159,865 17,834,876
Contract liability of freight/shipping revenue 744,045 1,363,710
Contract liabilities 16,903,910 19,198,586
From time to time, the Group recognises contract liabilities in relation to some metal in concentrate sales which are sold under FCA and CIP Incoterms, whereby a portion of the cash may be received from the customer before the freight/shipping services are provided. The revenue recognised in the reporting period that was included in the contract liability balance at the beginning of the period was AMD 1,363,710 thousand (2019: AMD 465,325 thousand). The transaction price allocated to the remaining performance obligations (unsatisfied or partially unsatisfied) as at 31 December 2020 was AMD 744,045 thousand (2019: AMD 1,363,710 thousand). All the other remaining performance obligations are expected to be recognised within one year. The opening balance of contract liabilities at 1 January 2020 was AMD 1,363,710 thousand. The movement in contract liabilities from one period to the next depends on the value of deferred revenue relating to freight/shipping services that are still in the process of being provided at period end i.e., because a shipment of copper concentrate subject to CIP Incoterms is still on the way at period end. Included in non-current advances received for provisionally priced sales are advances of nil (2019: AMD 9,656,580 thousand) which are subject to set-off against the sales of copper and molybdenum concentrate. These balances bear interest rate of 1 month USD Libor plus 4.95%. Included in current advances received for provisionally priced sales are advances of AMD 16,159,864 thousand (2019: AMD 17,834,876 thousand) which are subject to set-off against the sales of copper and molybdenum concentrate during 2021. These balances bear interest rate of 1 month USD Libor plus 4.5%-4.95%.
‘000 AMD
Contract liabilities
non-current
Contract liabilities current
Streaming contracts
Contract liability for shipping
services Total
Non-current 9,656,580 − − − 9,656,580
Current − 17,834,876 − 1,363,710 19,198,586
Balance as at 31 December 2019 9,656,580 17,834,876 − 1,363,710 28,855,166
Advances received − 216,576,448 − 4,867,184 221,443,632 Advances repayment − (225,981,047) − (5,486,849) (231,467,896) Interest accrued on advances − 1,540,063 − − 1,540,063 Interest repayment − (3,467,056) − − (3,467,056)
Reclass (9,656,580) 9,656,580 − − −
Balance as at 31 December 2020 − 16,159,864 − 744,045 16,903,909
Current − 16,159,864 − 744,045 16,903,909
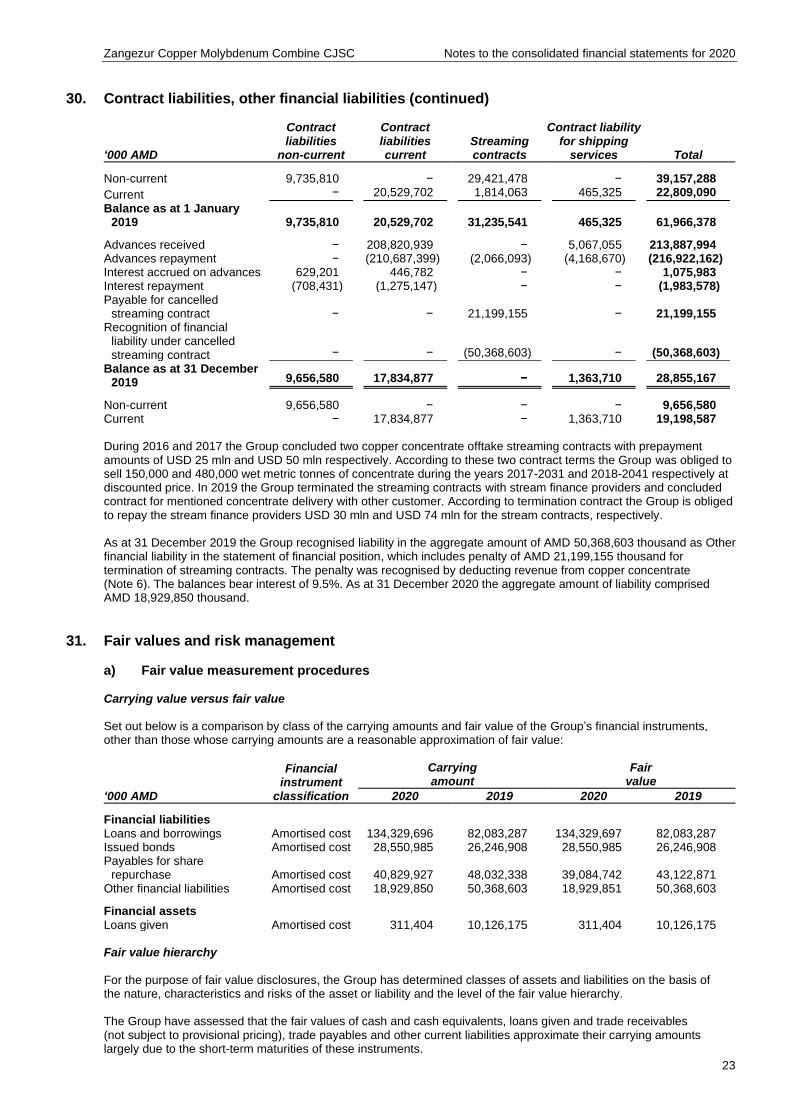
Zangezur Copper Molybdenum Combine CJSC Notes to the consolidated financial statements for 2020
23
30. Contract liabilities, other financial liabilities (continued)
‘000 AMD
Contract liabilities
non-current
Contract liabilities current
Streaming contracts
Contract liability for shipping
services Total
Non-current 9,735,810 − 29,421,478 − 39,157,288
Current − 20,529,702 1,814,063 465,325 22,809,090
Balance as at 1 January 2019 9,735,810 20,529,702 31,235,541 465,325 61,966,378
Advances received − 208,820,939 − 5,067,055 213,887,994 Advances repayment − (210,687,399) (2,066,093) (4,168,670) (216,922,162) Interest accrued on advances 629,201 446,782 − − 1,075,983 Interest repayment (708,431) (1,275,147) − − (1,983,578) Payable for cancelled
streaming contract − − 21,199,155 − 21,199,155 Recognition of financial
liability under cancelled streaming contract − − (50,368,603) − (50,368,603)
Balance as at 31 December 2019 9,656,580 17,834,877 − 1,363,710 28,855,167
Non-current 9,656,580 − − − 9,656,580 Current − 17,834,877 − 1,363,710 19,198,587 During 2016 and 2017 the Group concluded two copper concentrate offtake streaming contracts with prepayment amounts of USD 25 mln and USD 50 mln respectively. According to these two contract terms the Group was obliged to sell 150,000 and 480,000 wet metric tonnes of concentrate during the years 2017-2031 and 2018-2041 respectively at discounted price. In 2019 the Group terminated the streaming contracts with stream finance providers and concluded contract for mentioned concentrate delivery with other customer. According to termination contract the Group is obliged to repay the stream finance providers USD 30 mln and USD 74 mln for the stream contracts, respectively. As at 31 December 2019 the Group recognised liability in the aggregate amount of AMD 50,368,603 thousand as Other financial liability in the statement of financial position, which includes penalty of AMD 21,199,155 thousand for termination of streaming contracts. The penalty was recognised by deducting revenue from copper concentrate (Note 6). The balances bear interest of 9.5%. As at 31 December 2020 the aggregate amount of liability comprised AMD 18,929,850 thousand.
31. Fair values and risk management
a) Fair value measurement procedures Carrying value versus fair value Set out below is a comparison by class of the carrying amounts and fair value of the Group’s financial instruments, other than those whose carrying amounts are a reasonable approximation of fair value:
‘000 AMD
Financial instrument
classification
Carrying amount
Fair value
2020 2019 2020 2019
Financial liabilities Loans and borrowings Amortised cost 134,329,696 82,083,287 134,329,697 82,083,287 Issued bonds Amortised cost 28,550,985 26,246,908 28,550,985 26,246,908 Payables for share
repurchase Amortised cost 40,829,927 48,032,338 39,084,742 43,122,871 Other financial liabilities Amortised cost 18,929,850 50,368,603 18,929,851 50,368,603
Financial assets Loans given Amortised cost 311,404 10,126,175 311,404 10,126,175 Fair value hierarchy For the purpose of fair value disclosures, the Group has determined classes of assets and liabilities on the basis of the nature, characteristics and risks of the asset or liability and the level of the fair value hierarchy. The Group have assessed that the fair values of cash and cash equivalents, loans given and trade receivables (not subject to provisional pricing), trade payables and other current liabilities approximate their carrying amounts largely due to the short-term maturities of these instruments.
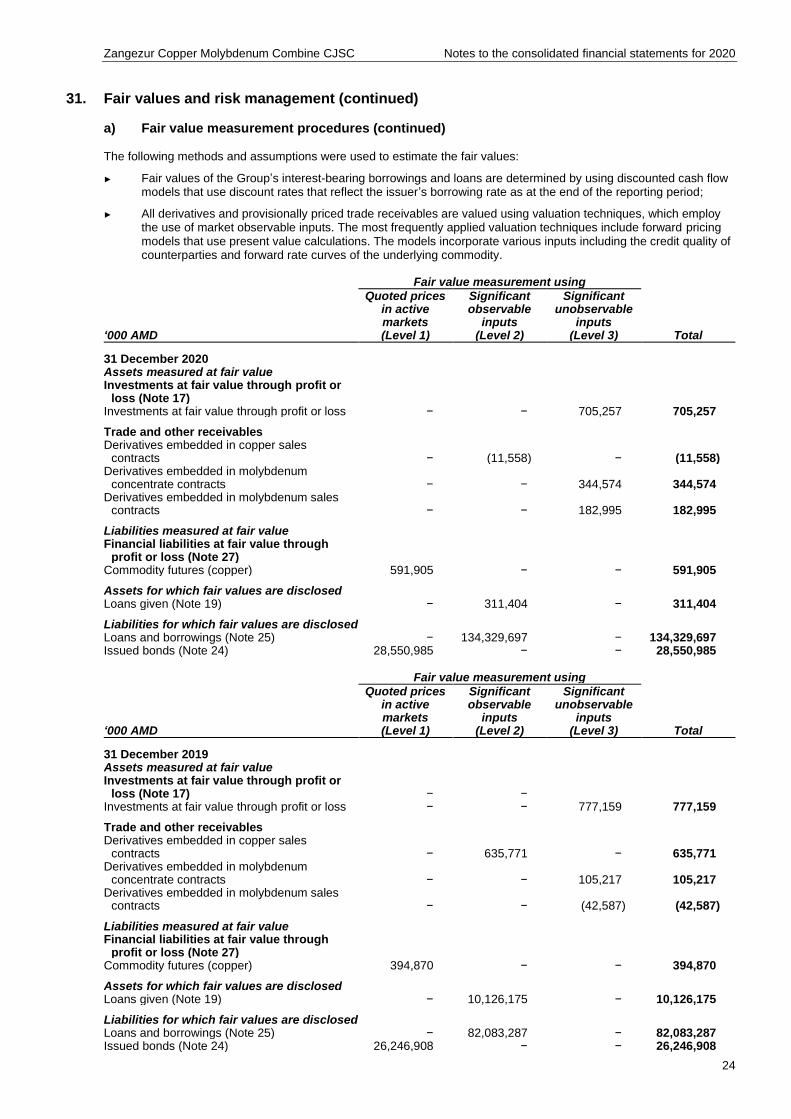
Zangezur Copper Molybdenum Combine CJSC Notes to the consolidated financial statements for 2020
24
31. Fair values and risk management (continued)
a) Fair value measurement procedures (continued) The following methods and assumptions were used to estimate the fair values:
► Fair values of the Group’s interest-bearing borrowings and loans are determined by using discounted cash flow models that use discount rates that reflect the issuer’s borrowing rate as at the end of the reporting period;
► All derivatives and provisionally priced trade receivables are valued using valuation techniques, which employ the use of market observable inputs. The most frequently applied valuation techniques include forward pricing models that use present value calculations. The models incorporate various inputs including the credit quality of counterparties and forward rate curves of the underlying commodity.
Fair value measurement using
‘000 AMD
Quoted prices in active markets (Level 1)
Significant observable
inputs (Level 2)
Significant unobservable
inputs (Level 3) Total
31 December 2020 Assets measured at fair value Investments at fair value through profit or
loss (Note 17) Investments at fair value through profit or loss − − 705,257 705,257 Trade and other receivables Derivatives embedded in copper sales
contracts − (11,558) − (11,558) Derivatives embedded in molybdenum
concentrate contracts − − 344,574 344,574 Derivatives embedded in molybdenum sales
contracts − − 182,995 182,995 Liabilities measured at fair value Financial liabilities at fair value through
profit or loss (Note 27) Commodity futures (copper) 591,905 − − 591,905 Assets for which fair values are disclosed Loans given (Note 19) − 311,404 − 311,404 Liabilities for which fair values are disclosed Loans and borrowings (Note 25) − 134,329,697 − 134,329,697 Issued bonds (Note 24) 28,550,985 − − 28,550,985 Fair value measurement using
‘000 AMD
Quoted prices in active markets (Level 1)
Significant observable
inputs (Level 2)
Significant unobservable
inputs (Level 3) Total
31 December 2019 Assets measured at fair value Investments at fair value through profit or
loss (Note 17) − − Investments at fair value through profit or loss − − 777,159 777,159 Trade and other receivables Derivatives embedded in copper sales
contracts − 635,771 − 635,771 Derivatives embedded in molybdenum
concentrate contracts − − 105,217 105,217 Derivatives embedded in molybdenum sales
contracts − − (42,587) (42,587) Liabilities measured at fair value Financial liabilities at fair value through
profit or loss (Note 27) Commodity futures (copper) 394,870 − − 394,870 Assets for which fair values are disclosed Loans given (Note 19) − 10,126,175 − 10,126,175 Liabilities for which fair values are disclosed Loans and borrowings (Note 25) − 82,083,287 − 82,083,287 Issued bonds (Note 24) 26,246,908 − − 26,246,908
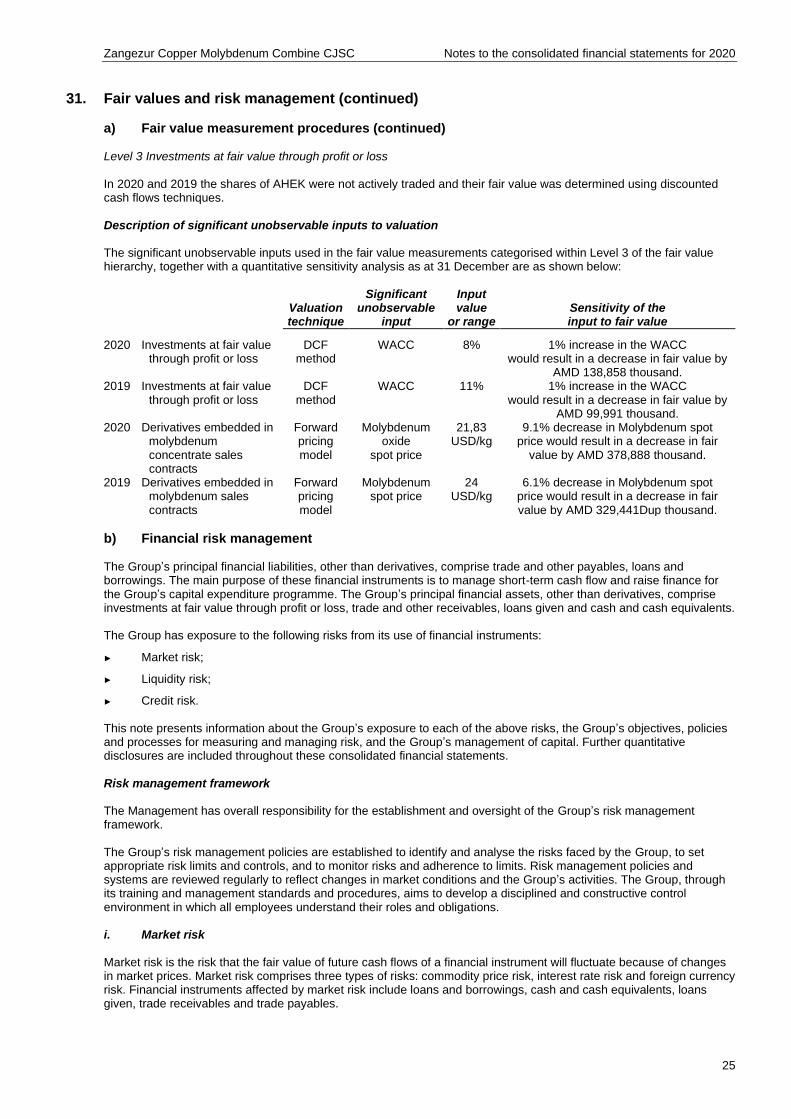
Zangezur Copper Molybdenum Combine CJSC Notes to the consolidated financial statements for 2020
25
31. Fair values and risk management (continued)
a) Fair value measurement procedures (continued) Level 3 Investments at fair value through profit or loss In 2020 and 2019 the shares of AHEK were not actively traded and their fair value was determined using discounted cash flows techniques. Description of significant unobservable inputs to valuation The significant unobservable inputs used in the fair value measurements categorised within Level 3 of the fair value hierarchy, together with a quantitative sensitivity analysis as at 31 December are as shown below:
Valuation technique
Significant unobservable
input
Input value
or range Sensitivity of the input to fair value
2020 Investments at fair value
through profit or loss DCF
method WACC 8% 1% increase in the WACC
would result in a decrease in fair value by AMD 138,858 thousand.
2019 Investments at fair value through profit or loss
DCF method
WACC 11% 1% increase in the WACC would result in a decrease in fair value by
AMD 99,991 thousand. 2020 Derivatives embedded in
molybdenum concentrate sales contracts
Forward pricing model
Molybdenum oxide
spot price
21,83 USD/kg
9.1% decrease in Molybdenum spot price would result in a decrease in fair
value by AMD 378,888 thousand.
2019 Derivatives embedded in molybdenum sales contracts
Forward pricing model
Molybdenum spot price
24 USD/kg
6.1% decrease in Molybdenum spot price would result in a decrease in fair value by AMD 329,441Dup thousand.
b) Financial risk management The Group’s principal financial liabilities, other than derivatives, comprise trade and other payables, loans and borrowings. The main purpose of these financial instruments is to manage short-term cash flow and raise finance for the Group’s capital expenditure programme. The Group’s principal financial assets, other than derivatives, comprise investments at fair value through profit or loss, trade and other receivables, loans given and cash and cash equivalents. The Group has exposure to the following risks from its use of financial instruments:
► Market risk;
► Liquidity risk;
► Credit risk. This note presents information about the Group’s exposure to each of the above risks, the Group’s objectives, policies and processes for measuring and managing risk, and the Group’s management of capital. Further quantitative disclosures are included throughout these consolidated financial statements. Risk management framework The Management has overall responsibility for the establishment and oversight of the Group’s risk management framework. The Group’s risk management policies are established to identify and analyse the risks faced by the Group, to set appropriate risk limits and controls, and to monitor risks and adherence to limits. Risk management policies and systems are reviewed regularly to reflect changes in market conditions and the Group’s activities. The Group, through its training and management standards and procedures, aims to develop a disciplined and constructive control environment in which all employees understand their roles and obligations. i. Market risk Market risk is the risk that the fair value of future cash flows of a financial instrument will fluctuate because of changes in market prices. Market risk comprises three types of risks: commodity price risk, interest rate risk and foreign currency risk. Financial instruments affected by market risk include loans and borrowings, cash and cash equivalents, loans given, trade receivables and trade payables.
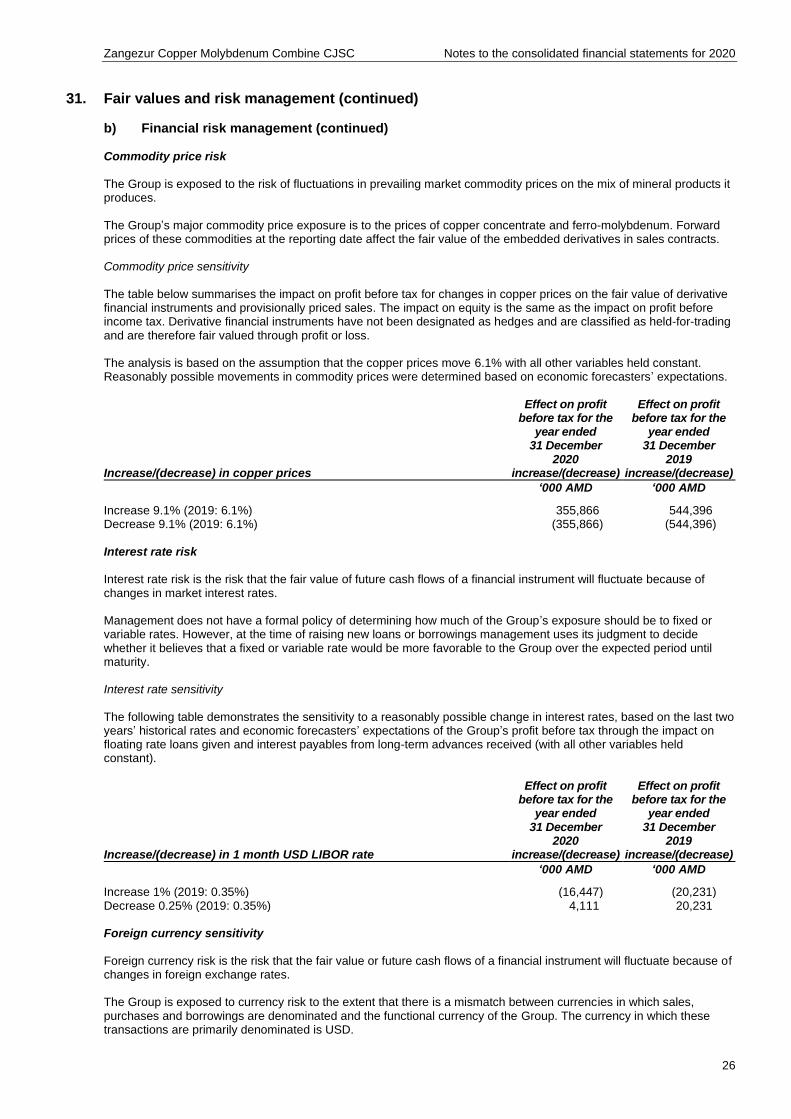
Zangezur Copper Molybdenum Combine CJSC Notes to the consolidated financial statements for 2020
26
31. Fair values and risk management (continued)
b) Financial risk management (continued) Commodity price risk The Group is exposed to the risk of fluctuations in prevailing market commodity prices on the mix of mineral products it produces. The Group’s major commodity price exposure is to the prices of copper concentrate and ferro-molybdenum. Forward prices of these commodities at the reporting date affect the fair value of the embedded derivatives in sales contracts. Commodity price sensitivity The table below summarises the impact on profit before tax for changes in copper prices on the fair value of derivative financial instruments and provisionally priced sales. The impact on equity is the same as the impact on profit before income tax. Derivative financial instruments have not been designated as hedges and are classified as held-for-trading and are therefore fair valued through profit or loss. The analysis is based on the assumption that the copper prices move 6.1% with all other variables held constant. Reasonably possible movements in commodity prices were determined based on economic forecasters’ expectations.
Increase/(decrease) in copper prices
Effect on profit before tax for the
year ended 31 December
2020 increase/(decrease)
Effect on profit before tax for the
year ended 31 December
2019 increase/(decrease)
‘000 AMD ‘000 AMD
Increase 9.1% (2019: 6.1%) 355,866 544,396 Decrease 9.1% (2019: 6.1%) (355,866) (544,396) Interest rate risk Interest rate risk is the risk that the fair value of future cash flows of a financial instrument will fluctuate because of changes in market interest rates. Management does not have a formal policy of determining how much of the Group’s exposure should be to fixed or variable rates. However, at the time of raising new loans or borrowings management uses its judgment to decide whether it believes that a fixed or variable rate would be more favorable to the Group over the expected period until maturity. Interest rate sensitivity The following table demonstrates the sensitivity to a reasonably possible change in interest rates, based on the last two years’ historical rates and economic forecasters’ expectations of the Group’s profit before tax through the impact on floating rate loans given and interest payables from long-term advances received (with all other variables held constant).
Increase/(decrease) in 1 month USD LIBOR rate
Effect on profit before tax for the
year ended 31 December
2020 increase/(decrease)
Effect on profit before tax for the
year ended 31 December
2019 increase/(decrease)
‘000 AMD ‘000 AMD
Increase 1% (2019: 0.35%) (16,447) (20,231) Decrease 0.25% (2019: 0.35%) 4,111 20,231 Foreign currency sensitivity Foreign currency risk is the risk that the fair value or future cash flows of a financial instrument will fluctuate because of changes in foreign exchange rates. The Group is exposed to currency risk to the extent that there is a mismatch between currencies in which sales, purchases and borrowings are denominated and the functional currency of the Group. The currency in which these transactions are primarily denominated is USD.
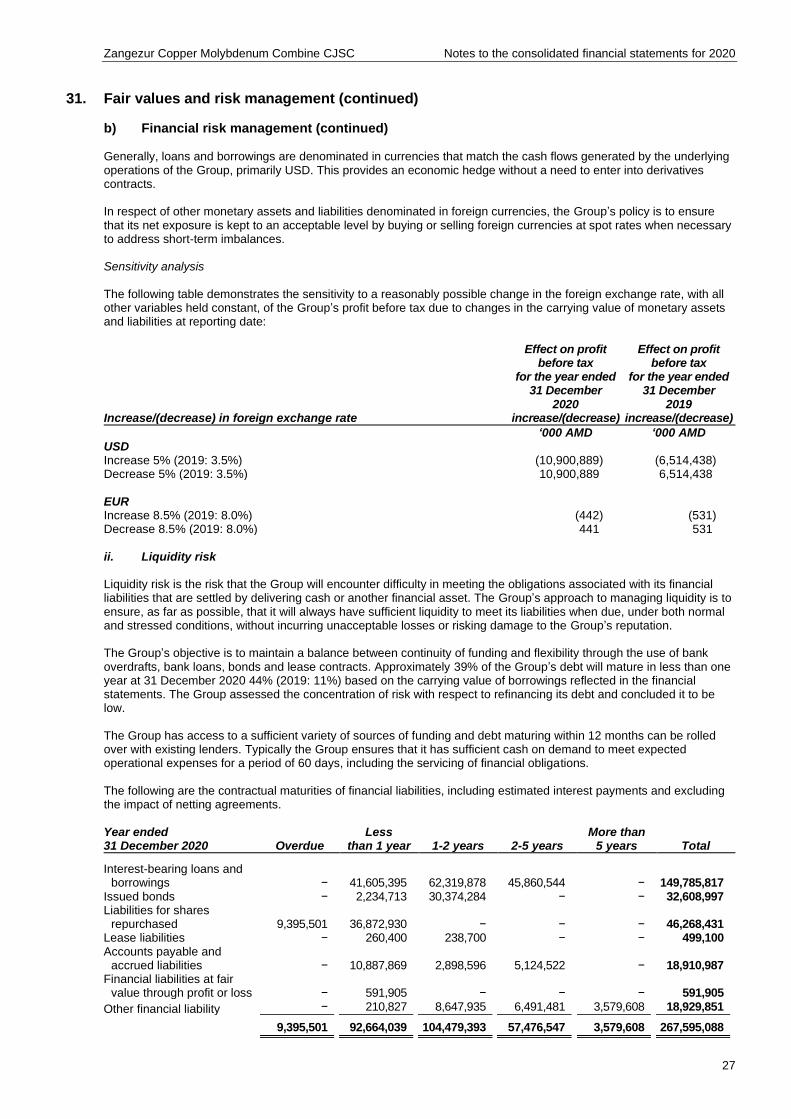
Zangezur Copper Molybdenum Combine CJSC Notes to the consolidated financial statements for 2020
27
31. Fair values and risk management (continued)
b) Financial risk management (continued) Generally, loans and borrowings are denominated in currencies that match the cash flows generated by the underlying operations of the Group, primarily USD. This provides an economic hedge without a need to enter into derivatives contracts. In respect of other monetary assets and liabilities denominated in foreign currencies, the Group’s policy is to ensure that its net exposure is kept to an acceptable level by buying or selling foreign currencies at spot rates when necessary to address short-term imbalances. Sensitivity analysis The following table demonstrates the sensitivity to a reasonably possible change in the foreign exchange rate, with all other variables held constant, of the Group’s profit before tax due to changes in the carrying value of monetary assets and liabilities at reporting date:
Increase/(decrease) in foreign exchange rate
Effect on profit before tax
for the year ended 31 December
2020 increase/(decrease)
Effect on profit before tax
for the year ended 31 December
2019 increase/(decrease)
‘000 AMD ‘000 AMD USD Increase 5% (2019: 3.5%) (10,900,889) (6,514,438) Decrease 5% (2019: 3.5%) 10,900,889 6,514,438 EUR Increase 8.5% (2019: 8.0%) (442) (531) Decrease 8.5% (2019: 8.0%) 441 531 ii. Liquidity risk Liquidity risk is the risk that the Group will encounter difficulty in meeting the obligations associated with its financial liabilities that are settled by delivering cash or another financial asset. The Group’s approach to managing liquidity is to ensure, as far as possible, that it will always have sufficient liquidity to meet its liabilities when due, under both normal and stressed conditions, without incurring unacceptable losses or risking damage to the Group’s reputation. The Group’s objective is to maintain a balance between continuity of funding and flexibility through the use of bank overdrafts, bank loans, bonds and lease contracts. Approximately 39% of the Group’s debt will mature in less than one year at 31 December 2020 44% (2019: 11%) based on the carrying value of borrowings reflected in the financial statements. The Group assessed the concentration of risk with respect to refinancing its debt and concluded it to be low. The Group has access to a sufficient variety of sources of funding and debt maturing within 12 months can be rolled over with existing lenders. Typically the Group ensures that it has sufficient cash on demand to meet expected operational expenses for a period of 60 days, including the servicing of financial obligations. The following are the contractual maturities of financial liabilities, including estimated interest payments and excluding the impact of netting agreements. Year ended 31 December 2020 Overdue
Less than 1 year 1-2 years 2-5 years
More than 5 years Total
Interest-bearing loans and
borrowings − 41,605,395 62,319,878 45,860,544 − 149,785,817 Issued bonds − 2,234,713 30,374,284 − − 32,608,997 Liabilities for shares
repurchased 9,395,501 36,872,930 − − − 46,268,431 Lease liabilities − 260,400 238,700 − − 499,100 Accounts payable and
accrued liabilities − 10,887,869 2,898,596 5,124,522 − 18,910,987 Financial liabilities at fair
value through profit or loss − 591,905 − − − 591,905
Other financial liability − 210,827 8,647,935 6,491,481 3,579,608 18,929,851
9,395,501 92,664,039 104,479,393 57,476,547 3,579,608 267,595,088
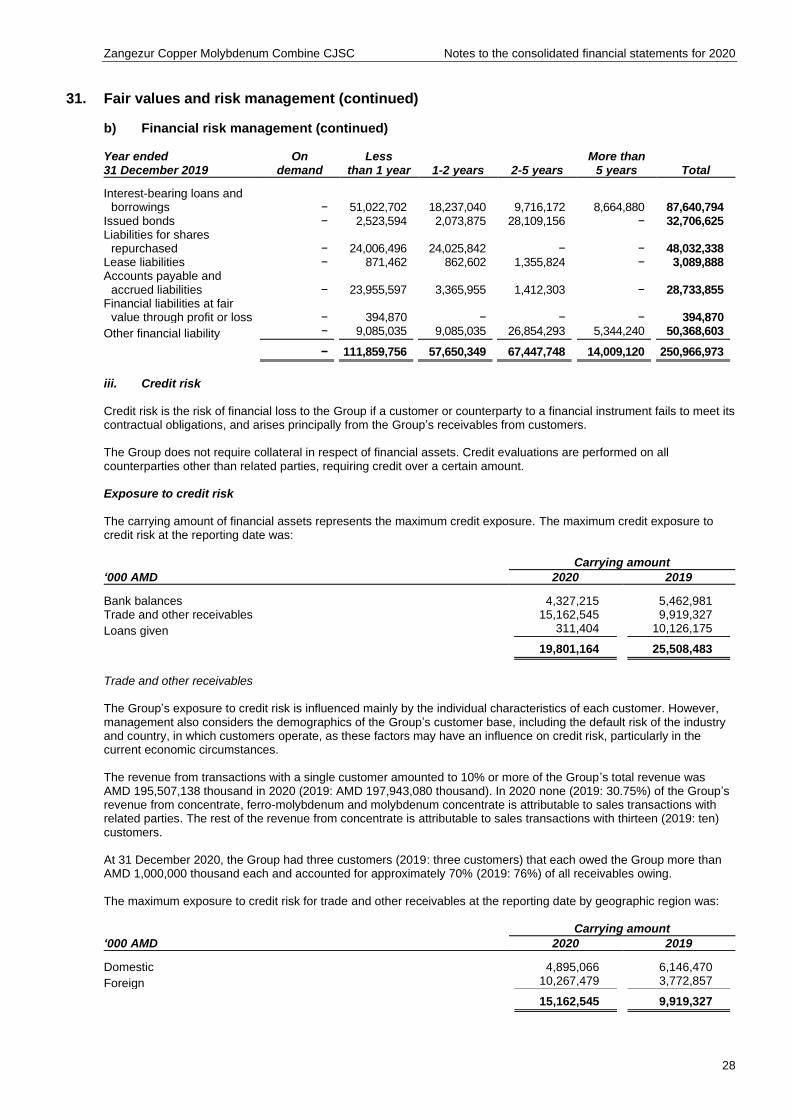
Zangezur Copper Molybdenum Combine CJSC Notes to the consolidated financial statements for 2020
28
31. Fair values and risk management (continued)
b) Financial risk management (continued) Year ended 31 December 2019
On demand
Less than 1 year 1-2 years 2-5 years
More than 5 years Total
Interest-bearing loans and
borrowings − 51,022,702 18,237,040 9,716,172 8,664,880 87,640,794 Issued bonds − 2,523,594 2,073,875 28,109,156 − 32,706,625 Liabilities for shares
repurchased − 24,006,496 24,025,842 − − 48,032,338 Lease liabilities − 871,462 862,602 1,355,824 − 3,089,888 Accounts payable and
accrued liabilities − 23,955,597 3,365,955 1,412,303 − 28,733,855 Financial liabilities at fair
value through profit or loss − 394,870 − − − 394,870
Other financial liability − 9,085,035 9,085,035 26,854,293 5,344,240 50,368,603
− 111,859,756 57,650,349 67,447,748 14,009,120 250,966,973
iii. Credit risk Credit risk is the risk of financial loss to the Group if a customer or counterparty to a financial instrument fails to meet its contractual obligations, and arises principally from the Group’s receivables from customers. The Group does not require collateral in respect of financial assets. Credit evaluations are performed on all counterparties other than related parties, requiring credit over a certain amount. Exposure to credit risk The carrying amount of financial assets represents the maximum credit exposure. The maximum credit exposure to credit risk at the reporting date was: Carrying amount
‘000 AMD 2020 2019
Bank balances 4,327,215 5,462,981 Trade and other receivables 15,162,545 9,919,327
Loans given 311,404 10,126,175
19,801,164 25,508,483
Trade and other receivables The Group’s exposure to credit risk is influenced mainly by the individual characteristics of each customer. However, management also considers the demographics of the Group’s customer base, including the default risk of the industry and country, in which customers operate, as these factors may have an influence on credit risk, particularly in the current economic circumstances. The revenue from transactions with a single customer amounted to 10% or more of the Group’s total revenue was AMD 195,507,138 thousand in 2020 (2019: AMD 197,943,080 thousand). In 2020 none (2019: 30.75%) of the Group’s revenue from concentrate, ferro-molybdenum and molybdenum concentrate is attributable to sales transactions with related parties. The rest of the revenue from concentrate is attributable to sales transactions with thirteen (2019: ten) customers. At 31 December 2020, the Group had three customers (2019: three customers) that each owed the Group more than AMD 1,000,000 thousand each and accounted for approximately 70% (2019: 76%) of all receivables owing. The maximum exposure to credit risk for trade and other receivables at the reporting date by geographic region was: Carrying amount
‘000 AMD 2020 2019
Domestic 4,895,066 6,146,470
Foreign 10,267,479 3,772,857
15,162,545 9,919,327
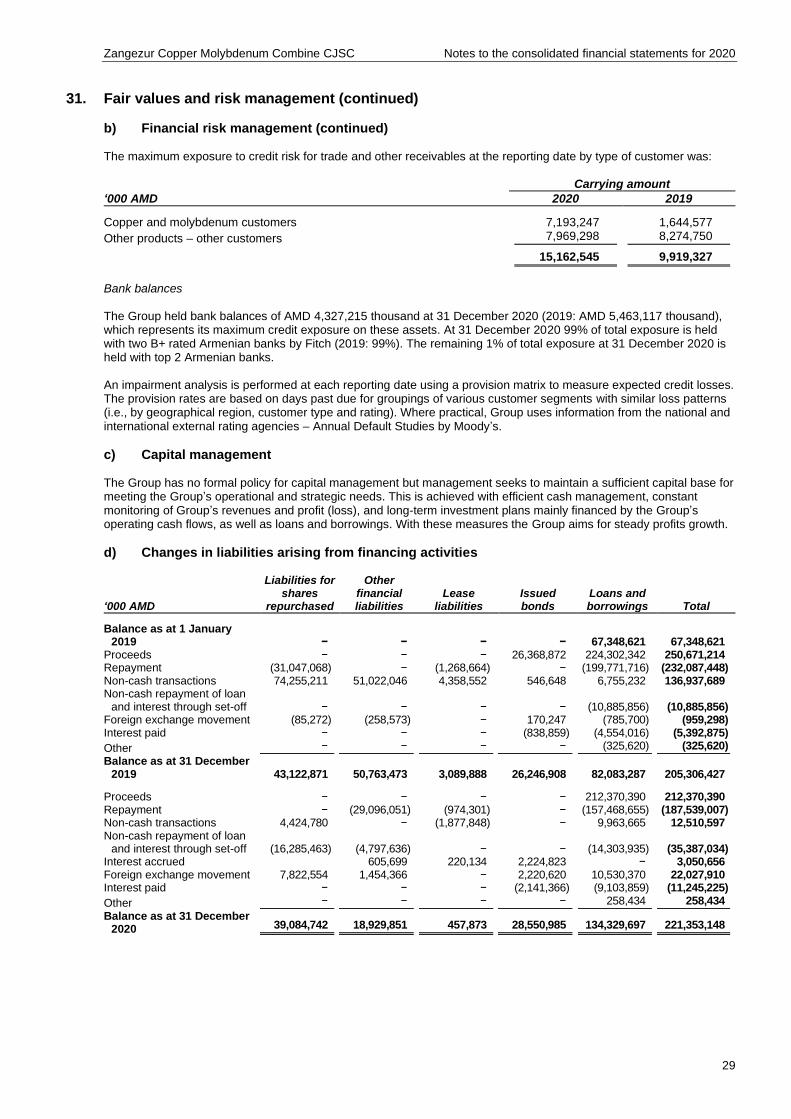
Zangezur Copper Molybdenum Combine CJSC Notes to the consolidated financial statements for 2020
29
31. Fair values and risk management (continued)
b) Financial risk management (continued) The maximum exposure to credit risk for trade and other receivables at the reporting date by type of customer was: Carrying amount
‘000 AMD 2020 2019
Copper and molybdenum customers 7,193,247 1,644,577
Other products – other customers 7,969,298 8,274,750
15,162,545 9,919,327
Bank balances The Group held bank balances of AMD 4,327,215 thousand at 31 December 2020 (2019: AMD 5,463,117 thousand), which represents its maximum credit exposure on these assets. At 31 December 2020 99% of total exposure is held with two B+ rated Armenian banks by Fitch (2019: 99%). The remaining 1% of total exposure at 31 December 2020 is held with top 2 Armenian banks. An impairment analysis is performed at each reporting date using a provision matrix to measure expected credit losses. The provision rates are based on days past due for groupings of various customer segments with similar loss patterns (i.e., by geographical region, customer type and rating). Where practical, Group uses information from the national and international external rating agencies – Annual Default Studies by Moody’s.
c) Capital management The Group has no formal policy for capital management but management seeks to maintain a sufficient capital base for meeting the Group’s operational and strategic needs. This is achieved with efficient cash management, constant monitoring of Group’s revenues and profit (loss), and long-term investment plans mainly financed by the Group’s operating cash flows, as well as loans and borrowings. With these measures the Group aims for steady profits growth.
d) Changes in liabilities arising from financing activities
‘000 AMD
Liabilities for shares
repurchased
Other financial liabilities
Lease liabilities
Issued bonds
Loans and borrowings Total
Balance as at 1 January
2019 − − − − 67,348,621 67,348,621 Proceeds − − − 26,368,872 224,302,342 250,671,214 Repayment (31,047,068) − (1,268,664) − (199,771,716) (232,087,448) Non-cash transactions 74,255,211 51,022,046 4,358,552 546,648 6,755,232 136,937,689 Non-cash repayment of loan
and interest through set-off − − − − (10,885,856) (10,885,856) Foreign exchange movement (85,272) (258,573) − 170,247 (785,700) (959,298) Interest paid − − − (838,859) (4,554,016) (5,392,875)
Other − − − − (325,620) (325,620)
Balance as at 31 December 2019 43,122,871 50,763,473 3,089,888 26,246,908 82,083,287 205,306,427
Proceeds − − − − 212,370,390 212,370,390 Repayment − (29,096,051) (974,301) − (157,468,655) (187,539,007) Non-cash transactions 4,424,780 − (1,877,848) − 9,963,665 12,510,597 Non-cash repayment of loan
and interest through set-off (16,285,463) (4,797,636) − − (14,303,935) (35,387,034) Interest accrued 605,699 220,134 2,224,823 − 3,050,656 Foreign exchange movement 7,822,554 1,454,366 − 2,220,620 10,530,370 22,027,910 Interest paid − − − (2,141,366) (9,103,859) (11,245,225)
Other − − − − 258,434 258,434
Balance as at 31 December 2020 39,084,742 18,929,851 457,873 28,550,985 134,329,697 221,353,148
Zangezur Copper Molybdenum Combine CJSC Notes to the consolidated financial statements for 2020
30
32. Contingencies and commitments
a) Insurance The insurance industry in Armenia is in a developing state and many forms of insurance protection common in other parts of the world are not yet generally available. The Group does not have full coverage for its plant facilities, business interruption, or third party liability in respect of property or environmental damage arising from accidents on Group property or relating to Group operations. Until the Group obtains adequate insurance coverage, there is a risk that the loss or destruction of certain assets could have a material adverse effect on the Group’s operations and financial position.
b) Taxation contingencies The taxation system in Armenia is relatively new and is characterised by frequent changes in legislation, official pronouncements and court decisions, which are sometimes unclear, contradictory and subject to varying interpretation. Taxes are subject to review and investigation by tax authorities, which have the authority to impose fines and penalties. In the event of a breach of tax legislation, no liabilities for additional taxes, fines or penalties may be imposed by tax authorities once three years have elapsed from the date of the breach. These circumstances may create tax risks in Armenia that are more significant than in other countries. Management believes that it has provided adequately for tax liabilities based on its interpretations of applicable Armenian tax legislation, official pronouncements and court decisions. However, the interpretations of the relevant authorities could differ and the effect on these consolidated financial statements, if the authorities were successful in enforcing their interpretations, could be significant.
c) Environmental contingencies The Group is subject to various state laws and regulations that govern emissions of air pollutants; discharges of water pollutants; and generation, handling, storage and disposal of hazardous substances, hazardous wastes and other toxic materials. The Group has not provided for any potential environmental contingency as the management does not consider any environmental contingent liability to be probable in the foreseeable future. However, environmental legislation in Armenia is in the process of development and potential changes in the legislation and its interpretation may give rise to material liabilities in the future.
33. Operational risks
a) Mines Mines by their nature are subject to many operational risks and factors that are generally outside of the Group’s control and could impact the Group’s business, operating results and cash flows. These operational risks and factors include, but are not limited to (i) unanticipated ground and water conditions and adverse claims to water rights, (ii) geological problems, including earthquakes and other natural disasters, (iii) metallurgical and other processing problems, (iv) the occurrence of unusual weather or operating conditions and other force majeure events, (v) lower than expected ore grades or recovery rates, (vi) accidents, (vii) delays in the receipt of or failure to receive necessary government permits, (viii) the results of litigation, including appeals of agency decisions, (ix) uncertainty of exploration and development, (x) delays in transportation, (xi) labour disputes, (xii) inability to obtain satisfactory insurance coverage, (xiii) unavailability of materials and equipment, (xiv) the failure of equipment or processes to operate in accordance with specifications or expectations, (xv) unanticipated difficulties consolidating acquired operations and obtaining expected synergies and (xvi) the results of financing efforts and financial market conditions.
b) Copper and molybdenum price volatility The Group’s financial performance is heavily dependent on the price of copper, which is affected by many factors beyond the Group’s control. Copper is a commodity traded on the London Metal Exchange (LME), the New York Commodity Exchange (COMEX) and the Shanghai Futures Exchange (SHFE). The Group’s copper is sold at prices based on those quoted on the LME. The price of copper as reported on this exchange is influenced significantly by numerous factors, including (i) the worldwide balance of copper demand and supply, (ii) rates of global economic growth, trends in industrial production and conditions in the housing and automotive industries, all of which correlate with demand for copper, (iii) economic growth and political conditions in China, which has become the largest consumer of refined copper in the world, and other major developing economies, (iv) speculative investment positions in copper and copper futures, (v) the availability and cost of substitute materials and (vi) currency exchange fluctuations, including the relative strength of the USD. The copper market is volatile and cyclical. During the year ended 31 December 2020, LME monthly average closing spot prices ranged from USD 4,617 to USD 7,964 per ton for copper. The LME monthly average copper price closed at USD 9,006 per ton on 31 March 2021.
Zangezur Copper Molybdenum Combine CJSC Notes to the consolidated financial statements for 2020
31
33. Operational risks (continued)
b) Copper and molybdenum price volatility (continued) The Group’s financial performance is also significantly dependent on the price of molybdenum. Molybdenum is characterized by volatile, cyclical prices, even more so than copper. Molybdenum prices are influenced by numerous factors, including (i) the worldwide balance of molybdenum demand and supply, (ii) rates of global economic growth, especially construction and infrastructure activity that requires significant amounts of steel, (iii) the volume of molybdenum produced as a by-product of copper production, (iv) inventory levels, (v) currency exchange fluctuations, including the relative strength of the USD and (vi) production costs of U.S. and foreign competitors. Molybdenum demand depends heavily on the global steel industry, which uses the metal as a hardening and corrosion inhibiting agent. Approximately 80 percent of molybdenum production is used in this application. The remainder is used in specialty chemical applications such as catalysts, water treatment agents and lubricants. Approximately 65 percent of global molybdenum production is a by-product of copper mining, which is relatively insensitive to molybdenum prices. The price of molybdenum was averaging to approximately USD 21.29 per ton during 2020 in comparison with USD 26.58 per ton during 2019. The LME monthly average price of USD 27.64 per ton of molybdenum was registered on 31 March 2021. Global economics conditions remained uncertain throughout 2019 due to escalated trade tensions and heightened political instability. And this gradual deceleration is expected to continue, despite the volatility created by the advent of COVID-19 in the longer term the trend of the income growth in emerging markets will continue to drive global commodity demand. Longer term demand is expected to remain robust as a result of urbanization, industrialization and electrification of emerging markets.
34. Related parties
a) Control relationships In accordance with Government Decree No. 1677-A dated 9 December 2004 the Group was privatised by the state. The ownership structure of the Group is disclosed in Note 1. During 2019 the Group repurchased its shared held by Cronimet Mining AG (60%) and Plant of Pure Iron OJSC (15%), the latter continues to remain related party as at 31 December 2019.
b) Transactions with key management personnel Board of Directors and key management remuneration Key management received the following remuneration during the year, which is included in personnel costs (see Note 13): ‘000 AMD 2020 2019
Salaries and bonuses Short-term employee benefits 1,171,730 1,290,606
Termination benefits (Note 26) − 185,003
1,171,730 1,475,609
There have been no guarantees provided or received for any related party receivables or payables.
Zangezur Copper Molybdenum Combine CJSC Notes to the consolidated financial statements for 2020
32
34. Related parties (continued)
b) Transactions with key management personnel (continued) The Group’s related party transactions are disclosed below. The changes in the structure of shareholders is presented in Note 1. i. Revenues
‘000 AMD
Transaction value
Outstanding balance
2020 2020
Services provided Other related parties 800 1,830,080 Other income
Other related parties 1,584 −
2,384 1,830,080
‘000 AMD
Transaction value
Outstanding balance
2019 2019
Sale of molybdenum concentrate and ferro-molybdenum Shareholders 39,959,592 − Entities under common control 25,558,725 − Services provided Shareholders 837 − Other related parties − 2,006,266 Other income Shareholder 5,854 −
Entities under common control 1,438 −
65,526,446 2,006,266
ii. Expenses
‘000 AMD
Transaction value
Outstanding balance
2020 2020
Purchase of materials Shareholders − (396,552) Other related parties 1,320 − Purchase of property, plant and equipment Shareholders − (30,000) Services received Other related parties 6,452,384 (5,889,996) Donations provided Other related parties 4,538,175 −
10,991,879 (6,316,548)
Zangezur Copper Molybdenum Combine CJSC Notes to the consolidated financial statements for 2020
33
34. Related parties (continued)
b) Transactions with key management personnel (continued)
‘000 AMD
Transaction value
Outstanding balance
2019 2019
Purchase of materials Shareholders 5,852 (562,503) Entities under common control 1,436 − Other related parties − − Purchase of property, plant and equipment Shareholders − (88,800) Entities under common control 273,110 − Services received Shareholders 8,868,646 − Entities under common control 802,285 − Other related parties − (1,200,201) Donations provided Other related parties 3,796,522 − Entities under common control 273,000 − Commission fee Shareholder 240 −
Entities under common control 374,157 −
14,395,248 (1,851,504)
All outstanding balances with related parties are to be settled in cash within six months of the reporting date. None of the balances are secured. Long-term liabilities towards previous shareholders are disclosed in Note 23. Services received from the entities under common control mainly include geological studies and research performed by non-related parties sub-contracted by the related parties. Other related parties include entities under significant influence of the Board of Directors. iii. Loans and borrowings
‘000 AMD
Transaction value
Transaction value
Outstanding balance
Outstanding balance
2020 2019 2020 2019
Loans given Shareholders − 333,431 − − Interest income on loans given Shareholders − 686,396 − − Interest expense on loans and borrowings
Shareholders − − − −
− 1,019,827 − −
35. Events after the reporting period In March 2021 the Group entered into a bank overdraft agreement with Armenian bank and received a loan in amount of USD 7,452 thousand with maturity date 2025.
Zangezur Copper Molybdenum Combine CJSC Notes to the consolidated financial statements for 2020
34
36. Standards issued but not yet effective The standards and interpretations that are issued, but not yet effective, up to the date of issuance of the Group’s financial statements that the Group reasonably expects will have an impact on its disclosures, financial position or performance when applied at a future date, are disclosed below. The Group intends to adopt these standards when they become effective. Of the other standards and interpretations that are issued, but not yet effective, as these are not expected to impact the Group, they have not been listed. Amendments to IFRS 3: Definition of a Business In October 2018, the IASB issued amendments to the definition of a business in IFRS 3 Business Combinations to help entities determine whether an acquired set of activities and assets is a business or not. They clarify the minimum requirements for a business, remove the assessment of whether market participants are capable of replacing any missing elements, add guidance to help entities assess whether an acquired process is substantive, narrow the definitions of a business and of outputs, and introduce an optional fair value concentration test. New illustrative examples were provided along with the amendments. Since the amendments apply prospectively to transactions or other events that occur on or after the date of first application, the Group will not be affected by these amendments on the date of transition. Amendments to IAS 1 and IAS 8: Definition of Material In October 2018, the IASB issued amendments to IAS 1 Presentation of Financial Statements and IAS 8 Accounting Policies, Changes in Accounting Estimates and Errors to align the definition of ‘material’ across the standards and to clarify certain aspects of the definition. The new definition states that, ‘Information is material if omitting, misstating or obscuring it could reasonably be expected to influence decisions that the primary users of general purpose financial statements make on the basis of those financial statements, which provide financial information about a specific reporting entity’. The amendments to the definition of material is not expected to have a significant impact on the Group’s financial statements.
37. Summary of significant accounting policies The accounting policies set out below have been applied consistently to all periods presented in these consolidated financial statements.
a) Business combinations Business combinations are accounted for using the acquisition method. The cost of an acquisition is measured as the aggregate of the consideration transferred, measured at acquisition date fair value and the amount of any non-controlling interest (“NCI”) in the acquiree. For each business combination, the Group elects whether to measure the NCI in the acquiree at fair value or at the proportionate share of the acquiree’s identifiable net assets. Acquisition related costs are expensed as incurred and included in administrative expenses. When the Group acquires a business, it assesses the assets and liabilities assumed for appropriate classification and designation in accordance with the contractual terms, economic circumstances and pertinent conditions as at the acquisition date. This includes the separation of embedded derivatives in host contracts by the acquiree. As part of a business combination, the Group assesses whether there are any operating lease contracts of the acquiree that may be onerous – that is, where the lease premiums being paid on that contract exceed the current market rate for such lease arrangements. Mineral reserves, resources and exploration potential that can be reliably measured are recognised separately in the assessment of fair values on acquisition. Other potential reserves, resources and rights, for which fair values cannot be reliably measured, are not recognized separately, but instead are subsumed in goodwill. If the business combination is achieved in stages, any previously held equity interest is re-measured at its acquisition-date fair value, and any resulting gain or loss is recognised in the statement of profit or loss and other comprehensive income. It is then considered in the determination of goodwill. Any contingent consideration to be transferred by the acquirer will be recognised at fair value at the acquisition date. Subsequent changes to the fair value of the contingent consideration which is deemed to be an asset or liability, will be recognised in accordance with IFRS 9 either in profit or loss or in other comprehensive income. If the contingent consideration is classified as equity, it shall not be remeasured until it is finally settled within equity. Goodwill is initially measured at cost (being the excess of the aggregate of the consideration transferred and the amount recognised for NCI over the fair value of the identifiable net assets acquired and liabilities assumed).
Zangezur Copper Molybdenum Combine CJSC Notes to the consolidated financial statements for 2020
35
37. Summary of significant accounting policies (continued)
a) Business combinations (continued) If the fair value of the identifiable net assets acquired is in excess of the aggregate consideration transferred, the Group reassesses whether it has correctly identified all of the assets acquired and all of the liabilities assumed and reviews the procedures used to measure the amounts to be recognised at the acquisition date. If the reassessment still results in an excess of the fair value of net assets acquired over the aggregate consideration transferred, then the gain is recognised in statement of profit or loss and other comprehensive income. After initial recognition, goodwill is measured at cost less any accumulated impairment losses. For the purpose of impairment testing, goodwill acquired in a business combination is, from the acquisition date, allocated to each of the Group’s cash-generating units (“CGUs”) that are expected to benefit from the combination, irrespective of whether other assets or liabilities of the acquiree are assigned to those units. Where goodwill forms part of a CGU and part of the operation in that unit is disposed of, the goodwill associated with the disposed operation is included in the carrying amount of the operation when determining the gain or loss on disposal. Goodwill disposed of in these circumstances is measured based on the relative value of the disposed operation of and the portion of the CGU retained. The Group has identified two CGUs which represent the two companies of the Group: Zangezur Copper Molybdenum Combine CJSC and Ler-Ex LLC.
b) Financial instruments – initial recognition and subsequent measurement A financial instrument is any contract that gives rise to a financial asset of one entity and a financial liability or equity instrument of another entity. Financial assets Initial recognition and measurement Financial assets are classified, at initial recognition, and subsequently measured at amortised cost, fair value through OCI, or fair value through profit or loss. The classification of financial assets at initial recognition that are debt instruments depends on the financial asset’s contractual cash flow characteristics and the Group’s business model for managing them. With the exception of trade receivables that do not contain a significant financing component or for which the Group has applied the practical expedient, the Group initially measures a financial asset at its fair value plus, in the case of a financial asset not at fair value through profit or loss, transaction costs. Trade receivables that do not contain a significant financing component or for which the Group has applied the practical expedient for contracts that have a maturity of one year or less, are measured at the transaction price determined under IFRS 15. In order for a financial asset to be classified and measured at amortised cost or fair value through OCI, it needs to give rise to cash flows that are ‘solely payments of principal and interest (SPPI)’ on the principal amount outstanding. This assessment is referred to as the SPPI test and is performed at an instrument level. Financial assets with cash flows that are not SPPI are classified and measured at fair value through profit or loss, irrespective of the business model. The Group’s business model for managing financial assets refers to how it manages its financial assets in order to generate cash flows. The business model determines whether cash flows will result from collecting contractual cash flows, selling the financial assets, or both. Purchases or sales of financial assets that require delivery of assets within a time frame established by regulation or convention in the market place (regular way trades) are recognised on the trade date, i.e., the date that the Group commits to purchase or sell the asset. Subsequent measurement For purposes of subsequent measurement, financial assets are classified in four categories:
► Financial assets at amortised cost (debt instruments);
► Financial assets at fair value through OCI with recycling of cumulative gains and losses (debt instruments);
► Financial assets designated at fair value through OCI with no recycling of cumulative gains and losses upon derecognition (equity instruments);
► Financial assets at fair value through profit or loss.
Zangezur Copper Molybdenum Combine CJSC Notes to the consolidated financial statements for 2020
36
37. Summary of significant accounting policies (continued)
b) Financial instruments – initial recognition and subsequent measurement (continued) This category is the most relevant to the Group. The Group measures financial assets at amortised cost if both of the following conditions are met:
► The financial asset is held within a business model with the objective to hold financial assets in order to collect contractual cash flows; and
► The contractual terms of the financial asset give rise on specified dates to cash flows that are solely payments of principal and interest on the principal amount outstanding.
Financial assets at amortised cost are subsequently measured using the effective interest rate (EIR) method and are subject to impairment. Interest received is recognised as part of finance income in the statement of profit or loss and other comprehensive income. Gains and losses are recognised in profit or loss when the asset is derecognised, modified or impaired. The Group’s financial assets at amortised cost include trade and other receivables (not subject to provisional pricing), cash and cash equivalents, and loans given. Refer below to ‘Financial assets at fair value through profit or loss’ for a discussion of trade receivables (subject to provisional pricing). Financial assets at fair value through profit or loss Financial assets at fair value through profit or loss include financial assets held for trading, e.g., derivative instruments, financial assets designated upon initial recognition at fair value through profit or loss, e.g., debt or equity instruments, or financial assets mandatorily required to be measured at fair value, i.e., where they fail the SPPI test. Financial assets are classified as held for trading if they are acquired for the purpose of selling or repurchasing in the near term. Derivatives, including separated embedded derivatives, are also classified as held for trading unless they are designated as effective hedging instruments. Financial assets with cash flows that do not pass the SPPI test are required to be classified and measured at fair value through profit or loss, irrespective of the business model. Notwithstanding the criteria for debt instruments to be classified at amortised cost or at fair value through OCI, as described above, debt instruments may be designated at fair value through profit or loss on initial recognition if doing so eliminates, or significantly reduces, an accounting mismatch. This category includes listed equity investments which the Group had not irrevocably elected to classify at fair value through OCI. Dividends on Equity investments at fair value through profit or loss are recognised as other income in the statement of profit or loss when the right of payment has been established. Financial assets at fair value through profit or loss are carried in the statement of financial position at fair value with net changes in fair value recognised in profit or loss. A derivative embedded in a hybrid contract with a financial liability or non-financial host, is separated from the host and accounted for as a separate derivative if: the economic characteristics and risks are not closely related to the host; a separate instrument with the same terms as the embedded derivative would meet the definition of a derivative; and the hybrid contract is not measured at fair value through profit or loss. Embedded derivatives are measured at fair value with changes in fair value recognised in profit or loss. Reassessment only occurs if there is either a change in the terms of the contract that significantly modifies the cash flows that would otherwise be required or a reclassification of a financial asset out of the fair value through profit or loss category. As IFRS 9 now has the SPPI test for financial assets, the requirements relating to the separation of embedded derivatives is no longer needed for financial assets. An embedded derivative will often make a financial asset fail the SPPI test thereby requiring the instrument to be measured at fair value through profit or loss in its entirety. This is applicable to the Group’s trade receivables (subject to provisional pricing). These receivables relate to sales contracts where the selling price is determined after delivery to the customer, based on the market price at the relevant QP stipulated in the contract. This exposure to the commodity price causes such trade receivables to fail the SPPI test. As a result, these receivables are measured at fair value through profit or loss from the date of recognition of the corresponding sale, with subsequent movements being recognised adjustment to revenue in the statement of profit or loss and other comprehensive income.
Zangezur Copper Molybdenum Combine CJSC Notes to the consolidated financial statements for 2020
37
37. Summary of significant accounting policies (continued)
b) Financial instruments – initial recognition and subsequent measurement (continued) Derecognition A financial asset (or, where applicable, a part of a financial asset or part of a group of similar financial assets) is primarily derecognised (i.e., removed from the Group’s consolidated statement of financial position) when:
► The rights to receive cash flows from the asset have expired; or
► The Group has transferred its rights to receive cash flows from the asset or has assumed an obligation to pay the received cash flows in full without material delay to a third party under a ‘pass-through’ arrangement; and either (a) the Group has transferred substantially all the risks and rewards of the asset, or (b) the Group has neither transferred nor retained substantially all the risks and rewards of the asset, but has transferred control of the asset.
When the Group has transferred its rights to receive cash flows from an asset or has entered into a pass-through arrangement, it evaluates if, and to what extent, it has retained the risks and rewards of ownership. When it has neither transferred nor retained substantially all of the risks and rewards of the asset, nor transferred control of the asset, the Group continues to recognise the transferred asset to the extent of its continuing involvement. In that case, the Group also recognises an associated liability. The transferred asset and the associated liability are measured on a basis that reflects the rights and obligations that the Group has retained. Continuing involvement that takes the form of a guarantee over the transferred asset is measured at the lower of the original carrying amount of the asset and the maximum amount of consideration that the Group could be required to repay. Impairment of financial assets Further disclosures relating to impairment of financial assets are also provided in the following notes:
► Disclosure of significant assumptions (Note 21);
► Trade and other receivables (Note 21);
► Loans given (Note 19). The Group recognises an allowance for ECLs for all debt instruments not held at fair value through profit or loss. ECLs are based on the difference between the contractual cash flows due in accordance with the contract and all the cash flows that the Group expects to receive, discounted at an approximation of the original EIR. The expected cash flows will include cash flows from the sale of collateral held or other credit enhancements that are integral to the contractual terms. ECLs are recognised in two stages. For credit exposures for which there has not been a significant increase in credit risk since initial recognition, ECLs are provided for credit losses that result from default events that are possible within the next 12-months (a 12-month ECL). For those credit exposures for which there has been a significant increase in credit risk since initial recognition, a loss allowance is required for credit losses expected over the remaining life of the exposure, irrespective of the timing of the default (a lifetime ECL). For trade receivables (not subject to provisional pricing) and other receivables due in less than 12 months, the Group applies the simplified approach in calculating ECLs, as permitted by IFRS 9. Therefore, the Group tracks changes in credit risk and calculates ECLs based on sectoral PD per Moody’s. For any other financial assets carried at amortised cost (which are due in more than 12 months), the ECL is based on the 12-month ECL. The 12-month ECL is the proportion of lifetime ECLs that results from default events on a financial instrument that are possible within 12 months after the reporting date. However, when there has been a significant increase in credit risk since origination, the allowance will be based on the lifetime ECL. When determining whether the credit risk of a financial asset has increased significantly since initial recognition and when estimating ECLs, the Group considers reasonable and supportable information that is relevant and available without undue cost or effort. This includes both quantitative and qualitative information and analysis, based on the Group’s historical experience and informed credit assessment including forward-looking information. The Group considers a financial asset in default when contractual payments are 1 year past due. However, in certain cases, the Group may also consider a financial asset to be in default when internal or external information indicates that the Group is unlikely to receive the outstanding contractual amounts in full before taking into account any credit enhancements held by the Group. A financial asset is written off when there is no reasonable expectation of recovering the contractual cash flows and usually occurs when past due for more than one year and not subject to enforcement activity.

Zangezur Copper Molybdenum Combine CJSC Notes to the consolidated financial statements for 2020
38
37. Summary of significant accounting policies (continued)
b) Financial instruments – initial recognition and subsequent measurement (continued) At each reporting date, the Group assesses whether financial assets carried at amortised cost are credit-impaired. A financial asset is credit-impaired when one or more events that have a detrimental impact on the estimated future cash flows of the financial asset have occurred. Refer Note 31 and Note 21 for further discussion on impairment assessments of financial assets. Financial liabilities Initial recognition and measurement Financial liabilities are classified, at initial recognition, as financial liabilities at fair value through profit or loss, loans and borrowings, payables, or as derivatives designated as hedging instruments in an effective hedge, as appropriate. All financial liabilities are recognised initially at fair value and, in the case of loans and borrowings and payables, net of directly attributable transaction costs. Subsequent measurement The measurement of financial liabilities depends on their classification, as described below: Financial liabilities at fair value through profit or loss Financial liabilities at fair value through profit or loss include financial liabilities held for trading and financial liabilities designated upon initial recognition as at fair value through profit or loss. Financial liabilities are classified as held for trading if they are incurred for the purpose of repurchasing in the near term. This category also includes derivative financial instruments entered into by the Group that are not designated as hedging instruments in hedge relationships as defined by IFRS 9. Separated embedded derivatives are also classified as held for trading unless they are designated as effective hedging instruments. Gains or losses on liabilities held for trading are recognised in the statement of profit or loss and other comprehensive income. Loans and borrowings, issued bonds and trade and other payables After initial recognition, interest-bearing loans and borrowings and trade and other payables are subsequently measured at amortised cost using the EIR method. Gains and losses are recognised in the statement of profit or loss and other comprehensive income when the liabilities are derecognised, as well as through the EIR amortisation process. Amortised cost is calculated by taking into account any discount or premium on acquisition and fees or costs that are an integral part of the EIR. The EIR amortisation is included as finance costs in the statement of profit or loss and other comprehensive income. This category generally applies to interest-bearing loans and borrowings and trade and other payables. For more information, refer to Note 25 and Note 28. Derecognition A financial liability is derecognised when the associated obligation is discharged or cancelled or expires. When an existing financial liability is replaced by another from the same lender on substantially different terms, or the terms of an existing liability are substantially modified, such an exchange or modification is treated as the derecognition of the original liability and the recognition of a new liability. The difference in the respective carrying amounts is recognised in profit or loss and other comprehensive income. Offsetting of financial instruments Financial assets and financial liabilities are offset and the net amount is reported in the consolidated statement of financial position if there is a currently enforceable legal right to offset the recognised amounts and there is an intention to settle on a net basis, to realise the assets and settle the liabilities simultaneously.
Zangezur Copper Molybdenum Combine CJSC Notes to the consolidated financial statements for 2020
39
37. Summary of significant accounting policies (continued)
b) Financial instruments – initial recognition and subsequent measurement (continued) Cash and cash equivalents Cash and cash equivalents in the consolidated statement of financial position comprise cash at banks and on hand and short-term deposits with an original maturity of three months or less, but exclude any restricted cash. Restricted cash is not available for use by the Group and therefore is not considered highly liquid – for example, cash set aside to cover site restoration obligations. For the purpose of the consolidated statement of cash flows, cash and cash equivalents consist of cash and cash equivalents as defined above. Derivative financial instruments The Group uses derivative financial instruments, such as forward commodity contracts, to hedge its commodity price risks. Such derivative financial instruments are initially recognised at fair value on the date on which a derivative contract is entered into and are subsequently re-measured at fair value. Derivatives are carried as financial assets when the fair value is positive and as financial liabilities when the fair value is negative. Any gains or losses arising from changes in the fair value of derivatives are taken directly to the statement of profit or loss and other comprehensive income.
c) Revenue from contracts with customers The Group is principally engaged in the business of producing copper/molibdenym concentrate and in some instances, provides freight/shipping services. Revenue from contracts with customers is recognized when control of the goods or services is transferred to the customer at an amount that reflects the consideration to which the Group expects to be entitled in exchange for those goods or services. Contract balances Contract assets A contract asset is the right to consideration in exchange for goods or services transferred to the customer. If the Group performs by transferring goods or services to a customer before the customer pays consideration or before payment is due, a contract asset is recognised for the earned consideration that is conditional. The Group does not have any contract assets as performance and a right to consideration occurs within a short period of time and all rights to consideration are unconditional. Trade receivables A receivable represents the Group’s right to an amount of consideration that is unconditional (i.e., only the passage of time is required before payment of the consideration is due). Contract liabilities A contract liability is the obligation to transfer goods or services to a customer for which the Group has received consideration (or an amount of consideration is due) from the customer. If a customer pays consideration before the Group transfers goods or services to the customer, a contract liability is recognised when the payment is made or the payment is due (whichever is earlier). Contract liabilities are recognised as revenue when the Group performs under the contract. From time to time, the Group recognises contract liabilities in relation to some metal in concentrate sales which are sold under CIP Incoterms, whereby a portion of the cash may be received from the customer before the freight/shipping services are provided. See Note 30 for further details of contract liabilities.
Zangezur Copper Molybdenum Combine CJSC Notes to the consolidated financial statements for 2020
40
37. Summary of significant accounting policies (continued)
c) Revenue from contracts with customers (continued) Copper/molybdenum in concentrate (metal in concentrate) sales The majority of the Group’s sales of metal in concentrate allow for price adjustments based on the market price at the end of the relevant QP stipulated in the contract. These are referred to as provisional pricing arrangements and are such that the selling price for metal in concentrate is based on prevailing spot prices on a specified future date after shipment to the customer. Adjustments to the sales price occur based on movements in quoted market prices up to the end of the QP. The period between provisional invoicing and the end of the QP can be between one and three months. Revenue is recognised when control passes to the customer, which occurs at a point in time when the metal in concentrate is physically transferred onto a vessel, train, conveyor or other delivery mechanism. The revenue is measured at the amount to which the Group expects to be entitled, being the estimate of the price expected to be received at the end of the QP, i.e., the forward price, and a corresponding trade receivable is recognised. For those arrangements subject to CIP shipping terms, a portion of the transaction price is allocated to the separate freight/shipping services provided. For these provisional pricing arrangements, any future changes that occur over the QP are embedded within the provisionally priced trade receivables and are, therefore, within the scope of IFRS 9 and not within the scope of IFRS 15. Given the exposure to the commodity price, these provisionally priced trade receivables will fail the cash flow characteristics test within IFRS 9 and will be required to be measured at fair value through profit or loss up from initial recognition and until the date of settlement. These subsequent changes in fair value are recognised in the statement of profit or loss and other comprehensive income each period and presented as revenue adjustment. Changes in fair value over, and until the end of, the QP, are estimated by reference to updated forward market prices for gold and copper as well as taking into account relevant other fair value considerations as set out in IFRS 13, including interest rate and credit risk adjustments. Freight/shipping services As noted above, a proportion of the Group’s metal in concentrate sales are sold under CIP Incoterms, whereby the Group is responsible for providing freight/shipping services (as principal) after the date that the Group transfers control of the metal in concentrate to its customers. The Group, therefore, has separate performance obligations for freight/shipping services which are provided solely to facilitate sale of the commodities it produces. Other Incoterms commonly used by the Group are CPT, FCA, where the Group has no responsibility for freight or insurance once control of the products has passed at the loading port in Yerevan, and Delivered at Place (DAP) where control of the goods passes when the product is delivered to the agreed destination. For arrangements which have these Incoterms, the only performance obligations are the provision of the product at the point where control passes. For CIP arrangements, the transaction price (as determined above) is allocated to the metal in concentrate and freight/shipping services using the relative stand-alone selling price method. Under these arrangements, a portion of consideration may be received from the customer in cash at, or around, the date of shipment under a provisional invoice. Therefore, some of the upfront consideration that relates to the freight/shipping services yet to be provided, is deferred. It is then recognised as revenue upon completion of the Group’s performance obligation. The costs associated with these freight/shipping services are also recognised upon completion of the Group’s performance obligation. Payment of the freight/shipping costs may occur in advance of the services being provided (and is therefore recognised as a contract liability). The final portion is paid once the services have been completed. The period of time between receipt of these upfront amounts and the satisfaction of the freight/shipping services is usually up to four months. Given the quantum of these amounts and the short time frame between receipt of cash and satisfaction of the performance obligation, the Group has applied the practical expedient to not adjust the promised consideration for the effects of a significant financing component as the period between the transfer of the promised good or service to a customer and when the customer pays for that good or service is one year or less. Principal versus agent considerations The Group has generally concluded that it is the principal in its revenue contracts because it typically controls the goods or services before transferring them to the customer.
Zangezur Copper Molybdenum Combine CJSC Notes to the consolidated financial statements for 2020
41
37. Summary of significant accounting policies (continued)
c) Revenue from contracts with customers (continued) In some arrangements subject to CIP Incoterms, the Group is responsible for providing freight/shipping services. While the Group does not actually provide nor operate the vessels, trucks or trains, the Group has determined that it is principal in these arrangements because it has concluded it controls the specified services before they are provided to the customer. This is on the basis that the Group obtains control of a right to freight/shipping services after entering into the contract with the customer, but before those services are provided to the customer. The terms of the Group’s contract with the service provider give the Group the ability to direct the service provider to provide the specified services on the Group’s behalf. In addition, the Group has concluded that the following indicators provide evidence that it controls the freight/shipping services before they are provided to the customer:
► The Group is primarily responsible for fulfilling the promise to provide freight/shipping services. Although the Group has hired a service provider to perform the services promised to the customer, it is the Group itself that is responsible for ensuring that the services are performed and are acceptable to the customer (i.e., the Group is responsible for fulfilment of the promise in the contract, regardless of whether the Group performs the services itself or engages a third-party service provider to perform the services);
► The Group has discretion in setting the price for the services to the customer as this is negotiated directly with the customer.
Determining the timing of satisfaction of freight/shipping services The Group concluded that revenue for freight/shipping services is to be recognised over time because the customer simultaneously receives and consumes the benefits provided by the Group. The fact that another entity would not need to re-perform the freight/shipping services that the Group has provided to date demonstrates that the customer simultaneously receives and consumes the benefits of the Group’s performance as it performs. The Group determined that the input method is the best method for measuring progress of the freight/shipping services because there is a direct relationship between the Group’s effort (i.e., time elapsed) and the transfer of service to the customer. The Group recognises revenue on the basis of the time elapsed relative to the total expected time to complete the service. Stripping activity services The Group provides stripping activity services to a customer. The Group recognises revenue from services at the point in time when the customer receives the benefits provided to at the customer’s location. The Group considers whether there are other promises in the contract that are separate performance obligations to which a portion of the transaction price needs to be allocated.
d) Donations to social programs To the extent that the Group’s contributions to social programs benefit the community at large and are not restricted to the Group’s employees, they are recognised as Donations to social programs in profit or loss as incurred.
e) Finance income and costs The Group’s finance income and finance costs include:
► Interest income;
► Interest expense;
► Unwinding of discount on provision for site restoration and provision for termination benefits;
► Net fair value gains/losses on financial instruments through profit and loss. Interest income or expense is recognised using the effective interest method. Gain/losses on financial instruments through profit or loss are realized only when cash settlement is made.
Zangezur Copper Molybdenum Combine CJSC Notes to the consolidated financial statements for 2020
42
37. Summary of significant accounting policies (continued)
f) Foreign currency Foreign currency translation Transactions in foreign currencies are initially recorded in the functional currency, converted at the rate of exchange ruling at the date of the transaction. Monetary assets and liabilities denominated in foreign currencies at the reporting date are retranslated at the functional currency rate of exchange ruling at the reporting date. The foreign currency gain or loss on monetary items is the difference between amortised cost in the functional currency at the beginning of the period, adjusted for effective interest and payments during the period, and the amortised cost in foreign currency translated at the exchange rate at the end of the reporting period. Non-monetary items that are measured at historical cost in a foreign currency are translated using the exchange rates at the dates of the initial transaction. Foreign currency differences arising in retranslation are recognised in profit or loss.
g) Employee benefits Short-term employee benefit obligations are measured on an undiscounted basis and are expensed as the related service is provided. A liability is recognised for the amount expected to be paid under short-term cash bonus if the Group has a present legal or constructive obligation to pay this amount as a result of past service provided by the employee, and the obligation can be estimated reliably. i. Termination benefits Termination benefits are expensed when the Group can no longer withdraw the offer of those benefits. If benefits are not expected to be settled wholly within 12 months of the end of the reporting period, then they are discounted.
h) Income tax Income tax expense comprises current and deferred tax. Current tax and deferred tax are recognised in profit or loss except to the extent that it relates to items recognised directly in equity or in other comprehensive income. i. Current income tax Current income tax assets and liabilities for the current and prior periods are measured at the amount expected to be recovered from, or paid to, the taxation authorities. The tax rates and tax laws used to compute the amount are those that are enacted or substantively enacted at the reporting date in the countries where the Group operates and generates taxable income. Current income tax relating to items recognised directly in other comprehensive income or equity is recognized in other comprehensive income or equity and not in profit or loss. Management periodically evaluates positions taken in the tax returns with respect to situations where applicable tax regulations are subject to interpretation and establishes provisions where appropriate. ii. Deferred tax Deferred tax is provided using the balance sheet method on temporary differences between the tax bases of assets and liabilities and their carrying amounts for financial reporting purposes at the reporting date. Deferred tax liabilities are recognised for all taxable temporary differences, except:
► Where the deferred tax liability arises from the initial recognition of goodwill or an asset or liability in a transaction that is not a business combination and, at the time of the transaction, affects neither the accounting profit nor taxable profit (tax loss);
► In respect of taxable temporary differences associated with investments in subsidiaries, associates and interests in joint ventures, where the timing of the reversal of the temporary differences can be controlled by the parent, investor or venturer and it is probable that the temporary differences will not reverse in the foreseeable future.
Zangezur Copper Molybdenum Combine CJSC Notes to the consolidated financial statements for 2020
43
37. Summary of significant accounting policies (continued)
h) Income tax (continued) Deferred tax assets are recognised for all deductible temporary differences, the carry-forward of unused tax credits and any unused tax losses, to the extent that it is probable that taxable profit will be available against which the deductible temporary differences, and the carry-forward of unused tax credits and unused tax losses can be utilised, except:
► Where the deferred tax asset relating to the deductible temporary difference arises from the initial recognition of an asset or liability in a transaction that is not a business combination and, at the time of the transaction, affects neither the accounting profit nor taxable profit or loss;
► In respect of deductible temporary differences associated with investments in subsidiaries, associates and interests in joint ventures, deferred tax assets are recognised only to the extent that it is probable that the temporary differences will reverse in the foreseeable future and taxable profit will be available, against which the temporary differences can be utilized.
The carrying amount of deferred tax assets is reviewed at the end of each reporting period and reduced to the extent that it is no longer probable that sufficient taxable profit will be available to allow all or part of the deferred income tax asset to be utilised. Unrecognised deferred tax assets are reassessed at the end of each reporting period and are recognised to the extent that it has become probable that future taxable profit will be available to allow the deferred tax asset to be recovered. Deferred tax assets and liabilities are measured at the tax rates that are expected to apply to the year when the asset is realised or the liability is settled, based on tax rates (and tax laws) that have been enacted or substantively enacted by the end of the reporting period. Deferred tax relating to items recognised in other comprehensive income or equity is recognised in other comprehensive income or equity and not in profit or loss. Deferred tax assets and deferred tax liabilities are offset, if a legally enforceable right exists to set off current tax assets against current tax liabilities and the deferred taxes relate to the same taxable entity and the same taxation authority. Tax benefits acquired as part of a business combination, but not satisfying the criteria for separate recognition at that date, are recognised subsequently if new information about facts and circumstances arises. The adjustment is either treated as a reduction to goodwill (as long as it does not exceed goodwill) if it occurred during the measurement period or if outside the measurement period, it is recognised in the statement of profit or loss and other comprehensive income. Significant judgements, estimates and assumptions Judgement is required to determine which arrangements are considered to be a tax on income as opposed to an operating cost. Judgement is also required to determine whether deferred tax assets are recognised in the statement of financial position. Deferred tax assets, including those arising from unutilised tax losses, require the Group to assess the likelihood that the Group will generate sufficient taxable earnings in future periods, in order to utilise recognised deferred tax assets. Assumptions about the generation of future taxable profits depend on management’s estimates of future cash flows. These estimates of future taxable income are based on forecast cash flows from operations (which are impacted by production and sales volumes, commodity prices, reserves, operating costs, closure and site restoration costs, capital expenditure, dividends and other capital management transactions). To the extent that future cash flows and taxable income differ significantly from estimates, the ability of the Group to realise the net deferred tax assets recorded at the reporting date could be impacted.
i) Royalties In addition to corporate income taxes, the Group’s consolidated financial statements also include, and recognize as taxes on income, other types of taxes on net income. Royalties, resource rent taxes and revenue-based taxes are accounted for under IAS 12 when they have the characteristics of an income tax. This is considered to be the case when they are imposed under government authority and the amount payable is based on taxable income – rather than physical quantities produced or as a percentage of revenue – after adjustment for temporary differences. For such arrangements, current and deferred income tax is provided on the same basis as described above for other forms of taxation. Obligations arising from royalty arrangements and other types of taxes that do not satisfy these criteria are recognised as current provisions and included in other expenses.
Zangezur Copper Molybdenum Combine CJSC Notes to the consolidated financial statements for 2020
44
37. Summary of significant accounting policies (continued)
i) Royalties (continued) Royalties are calculated using rates enacted or substantively enacted at the reporting date. Royalties are recognised in profit or loss annually based on the combination of the revenues and taxable income adjusted as per the guidelines and requirements in the applicable laws and regulations. Royalties consist of two components: royalty calculated at 4% of revenue and royalty calculated as 12.5% of taxable income adjusted as per the guidelines and requirements in the applicable laws and regulations. Management believes that royalty expense does not represent an income tax as the total revenue factor (a gross measure) is significant in determining the amount of royalty payable. Royalties are treated as other operating expenses.
j) Inventories Copper and molybdenum in concentrate, metal in circuit and ore stockpiles are physically measured or estimated and valued at the lower of cost or net realisable value. Net realisable value is the estimated future sales price of the product the entity expects to realise when the product is processed and sold, less estimated costs to complete production and bring the product to sale. Where the time value of money is material, these future prices and costs to complete are discounted. If the ore stockpile is not expected to be processed in 12 months after the reporting date, it is included in non-current assets and the net realisable value is calculated on a discounted cash flow basis. Cost is determined by using the weighted-average method and comprises direct purchase costs and an appropriate portion of fixed and variable overhead costs, including depreciation and amortisation, incurred in converting materials into finished goods, based on the normal production capacity. The allocation of costs between joint products is based on the relative sales value of each product at the completion of production. Separately identifiable costs of conversion of each metal are specifically allocated. Materials and supplies are valued at the lower of cost or net realisable value. The costs of materials and supplies are based on the first-in first-out principle, and include expenditure incurred in acquiring the inventories, production or conversion costs and other costs incurred in bringing them to their existing location and condition. Any provision for obsolescence is determined by reference to specific items of stock. A regular review is undertaken to determine the extent of any provision for obsolescence.
k) Property, plant and equipment i. Recognition and measurement Items of property, plant and equipment are measured at cost less accumulated depreciation and impairment losses. Cost includes expenditure that is directly attributable to the acquisition of the asset. The cost of self-constructed assets includes the cost of materials and direct labour, any other costs directly attributable to bringing the asset to a working condition for their intended use, the costs of dismantling and removing the items and restoring the site on which they are located, and capitalised borrowing costs. Purchased software that is integral to the functionality of the related equipment is capitalised as part of that equipment. If significant parts of an item of property, plant and equipment have different useful lives, they are accounted for as separate items (major components) of property, plant and equipment. Any gain or loss on disposal of an item of property, plant and equipment is determined by comparing the proceeds from disposal with the carrying amount of property, plant and equipment, and is recognised net within other income/other expenses in profit or loss. ii. Subsequent expenditure The cost of replacing a component of an item of property, plant and equipment is recognised in the carrying amount of the item if it is probable that the future economic benefits embodied within the component will flow to the Group, and its cost can be measured reliably. The carrying amount of the replaced component is derecognised. The costs of the day-to-day servicing of property, plant and equipment are recognised in profit or loss as incurred. iii. Depreciation Items of property, plant and equipment are depreciated from the date that they are installed and are ready for use, or in respect of internally constructed assets, from the date that the asset is completed and ready for use. Depreciation is based on the cost of an asset less its residual value.
Zangezur Copper Molybdenum Combine CJSC Notes to the consolidated financial statements for 2020
45
37. Summary of significant accounting policies (continued)
k) Property, plant and equipment (continued) For assets used in the production line, depreciation is charged based on the units of production method using the total estimated productivity and the actual extracted and treated ore. For all other assets, depreciation is recognised in profit or loss on a straight-line basis over the estimated useful lives of each part of an item of property, plant and equipment, since this most closely reflects the expected pattern of consumption of the future economic benefits embodied in the asset. Land is not depreciated. The estimated useful lives of significant items of property, plant and equipment for the current and comparative periods are as follows:
Units of
production method Straight-line
method
Buildings Mine related workshop buildings and constructions Average capacity from 182
to 303 million tons Other buildings 10 to 100 years Plant and equipment Mine related plant and equipment Average capacity from 18
to 352 million tons Other plant and equipment 2 to 100 years Fixtures and fittings 2 to 70 years Mining facilities 25 years Depreciation methods, useful lives and residual values are reviewed at each reporting date and adjusted if appropriate.
l) Stripping (waste removal) costs As a part of its mining operations, the Group incurs stripping (waste removal) costs both during the development phase and production phase of its operations. Stripping costs incurred in the development phase of a mine, before the production phase commences (development stripping), are capitalised as part of the cost of constructing the mine and subsequently amortised over its useful life using a units of production (UOP) method. The capitalization of development stripping costs ceases when the mine/component is commissioned and ready for use as intended by management. Stripping activities undertaken during the production phase of a surface mine (production stripping) are accounted for as set out below. After the commencement of production, further development of the mine may require a phase of unusually high stripping that is similar in nature to development phase stripping. The cost of such stripping is accounted for in the same way as development stripping (as outlined above). Production stripping is generally considered to create two benefits, being either the production of inventory or improved access to the ore to be mined in the future. Where the benefits are realised in the form of inventory produced in the period, the production stripping costs are accounted for as part of the cost of producing those inventories. Where the benefits are realised in the form of improved access to ore to be mined in the future, the costs are recognised as a non-current asset, referred to as a ‘stripping activity asset’, if the following criteria are met:
► Future economic benefits (being improved access to the ore body) are probable;
► The component of the ore body for which access will be improved can be accurately identified;
► The costs associated with the improved access can be reliably measured. If any of the criteria are not met, the production stripping costs are charged to profit or loss as operating costs as they are incurred. In identifying components of the ore body, the Group works closely with the mining operations personnel for each mining operation to analyse each of the mine plans. Generally, a component will be a subset of the total ore body, and a mine may have several components. The mine plans, and therefore the identification of components, can vary between mines for a number of reasons. These include, but are not limited to: the type of commodity, the geological characteristics of the ore body, the geographical location, and/or financial considerations. Given the nature of the Group’s operations, components are generally either major pushbacks or phases and they generally form part of a larger investment decision which requires board approval. The stripping activity asset is initially measured at cost, which is the accumulation of costs directly incurred to perform the stripping activity that improves access to the identified component of ore, plus an allocation of directly attributable overhead costs. If incidental operations are occurring at the same time as the production stripping activity, but are not necessary for the production stripping activity to continue as planned, these costs are not included in the cost of the stripping activity asset.
Zangezur Copper Molybdenum Combine CJSC Notes to the consolidated financial statements for 2020
46
37. Summary of significant accounting policies (continued)
l) Stripping (waste removal) costs (continued) If the costs of the inventory produced and the stripping activity asset are not separately identifiable, a relevant production measure is used to allocate the production stripping costs between the inventory produced and the stripping activity asset. This production measure is calculated for the identified component of the ore body and is used as a benchmark to identify the extent to which the additional activity of creating a future benefit has taken place. The Group uses the expected volume of waste extracted compared with the actual volume for a given volume of ore production of each component. The stripping activity asset is accounted for as an addition to, or an enhancement of, an existing asset, being the mine asset, and is presented as a separate line in the statement of financial position. This forms part of the total investment in the relevant cash generating unit(s), which is reviewed for impairment if events or changes of circumstances indicate that the carrying value may not be recoverable. The stripping activity asset is subsequently depreciated using the UOP method over the life of the identified component of the ore body that became more accessible as a result of the stripping activity. Economically recoverable reserves, which comprise proven and probable reserves, are used to determine the expected useful life of the identified component of the ore body. The stripping activity asset is then carried at cost less depreciation and any impairment losses. Significant judgements, estimates and assumptions Significant judgement is required to distinguish between development stripping and production stripping and to distinguish between the production stripping that relates to the extraction of inventory and that which relates to the creation of a stripping activity asset. Once the Group has identified its production stripping for each surface mining operation, it identifies the separate components of the ore bodies for each of its mining operations. An identifiable component is a specific volume of the ore body that is made more accessible by the stripping activity. Significant judgement is required to identify and define these components, and also to determine the expected volumes (e.g., in tonnes) of waste to be stripped and ore to be mined in each of these components. These assessments are undertaken for each individual mining operation based on the information available in the mine plan. The mine plans and, therefore, the identification of components, will vary between mines for a number of reasons. These include, but are not limited to, the type of commodity, the geological characteristics of the ore body, the geographical location and/or financial considerations.
m) Intangible assets Software Software that are acquired by the Group, which have finite useful lives, are measured at cost less accumulated amortisation and accumulated impairment losses. Subsequent expenditure is capitalised only when it increases the future economic benefits embodied in the specific asset to which it relates. All other expenditure is recognised in the profit or loss as incurred. Amortisation is calculated over the cost of the asset, or other amount substituted for cost, less its residual value. Amortisation is recognised in profit or loss on a straight-line basis over the estimated useful lives of intangible assets from the date that they are available for use since this most closely reflects the expected pattern of consumption of future economic benefits embodied in the asset. The estimated useful lives for the current and comparative periods are as follows:
► Software 10 years. Amortisation methods, useful lives and residual values are reviewed at each financial year end and adjusted if appropriate.
n) Exploration and evaluation assets i. Pre-licence costs Pre-licence costs relate to costs incurred before the Group has obtained legal rights to explore in a specific area. Such costs may include the acquisition of exploration data and the associated costs of analysing that data. These costs are expensed in the period in which they are incurred.
Zangezur Copper Molybdenum Combine CJSC Notes to the consolidated financial statements for 2020
47
37. Summary of significant accounting policies (continued)
n) Exploration and evaluation assets (continued) ii. Exploration and evaluation expenditure Exploration and evaluation (E&E) activity involves the search for mineral resources, the determination of technical feasibility and the assessment of commercial viability of an identified resource. Exploration and evaluation activity includes:
► Researching and analysing historical exploration data;
► Gathering exploration data through geophysical studies;
► Exploratory drilling and sampling;
► Determining and examining the volume and grade of the resource;
► Surveying transportation and infrastructure requirements;
► Conducting market and finance studies. License costs paid in connection with a right to explore in an existing exploration area are capitalised and amortised over the term of the permit. Once the legal right to explore has been acquired, exploration and evaluation expenditure is charged to profit or loss as incurred, unless the Group concludes that a future economic benefit is more likely than not to be realised. These costs include directly attributable employee remuneration, materials and fuel used, surveying costs, drilling costs and payments made to contractors. In evaluating whether the expenditures meet the criteria to be capitalised, several different sources of information are used. The information that is used to determine the probability of future benefits depends on the extent of exploration and evaluation that has been performed. E&E expenditure incurred on licenses where a resource has not yet been established is expensed as incurred until sufficient evaluation has occurred in order to establish that the technical feasibility and commercial viability of extracting a mineral resource are demonstrable. Costs expensed during this phase are included in ‘Other expenses’ in the statement of profit or loss and other comprehensive income. E&E assets acquired in a business combination are initially recognised at fair value, including resources and exploration potential that is considered to represent value beyond proven and probable reserves. Similarly, the costs associated with acquiring an E&E asset (that does not represent a business) are also capitalised. They are subsequently measured at cost less accumulated impairment. Once commercial reserves are found, E&E assets are tested for impairment and transferred to ‘Mine facilities’ which is a sub-category of ‘Property, plant and equipment’. No amortisation is charged during the E&E phase. iii. Impairment of E&E assets E&E assets should be assessed for impairment when facts and circumstances suggest that the carrying amount of an E&E asset may exceed its recoverable amount. Under IFRS 6 one or more of the following facts and circumstances could indicate that an impairment test is required. The list is not intended to be exhaustive:
► The period for which the entity has the right to explore in the specific area has expired during the period or will expire in the near future, and is not expected to be renewed;
► Substantive expenditure on further exploration for and evaluation of mineral resources in the specific area is neither budgeted nor planned;
► Exploration for and evaluation of mineral resources in the specific area have not led to the discovery of commercially viable quantities of mineral resources and the entity has decided to discontinue such activities in the specific area; and
► Sufficient data exist to indicate that, although a development in the specific area is likely to proceed, the carrying amount of the E&E asset is unlikely to be recovered in full from successful development or by sale.
Significant judgements, estimates and assumptions The application of the Group’s accounting policy for E&E expenditure requires judgement to determine whether future economic benefits are likely from either future exploitation or sale, or whether activities have not reached a stage that permits a reasonable assessment of the existence of reserves.
Zangezur Copper Molybdenum Combine CJSC Notes to the consolidated financial statements for 2020
48
37. Summary of significant accounting policies (continued)
n) Exploration and evaluation assets (continued) In addition to applying judgement to determine whether future economic benefits are likely to arise from the Group’s E&E assets or whether activities have not reached a stage that permits a reasonable assessment of the existence of reserves, the Group has to apply a number of estimates and assumptions. The estimates directly impact when the Group defers E&E expenditure. The deferral policy requires management to make certain estimates and assumptions about future events and circumstances, particularly, whether an economically viable extraction operation can be established. Any such estimates and assumptions may change as new information becomes available. If, after expenditure is capitalised, information becomes available suggesting that the recovery of expenditure is unlikely, the relevant capitalised amount is written off to the statement of profit or loss and other comprehensive income in the period when the new information becomes available.
o) Impairment of non-financial assets The Group assesses, at each reporting date, whether there is an indication that an asset (or CGU) may be impaired. If any indication exists, or when annual impairment testing for an asset is required, the Group estimates the asset’s or CGU’s recoverable amount. The recoverable amount is the higher of an asset’s or CGU’s FVLCD and its VIU. If the carrying amount of an asset or CGU exceeds its recoverable amount, the asset/CGU is considered impaired and is written down to its recoverable amount. In calculating VIU, the estimated future cash flows are discounted to their present value using a pre-tax discount rate that reflects current market assessments of the time value of money and the risks specific to the asset/CGU. In determining FVLCD, recent market transactions (where available) are taken into account. If no such transactions can be identified, an appropriate valuation model is used. The Group bases its impairment calculation on detailed budgets and forecasts. The estimated cash flows are based on expected future production, metal selling prices, operating costs and forecast capital expenditure, and cash flows beyond ten years are based on life-of-mine plans. Impairment losses of continuing operations, including impairment of inventories, are recognised in the statement of profit or loss and other comprehensive income in those expense categories consistent with the function of the impaired asset. Significant estimates and assumptions Impairment assessments require the use of estimates and assumptions such as long-term commodity prices (considering current and historical prices, price trends and related factors), discount rates, operating costs, future capital requirements, closure and rehabilitation costs, exploration potential, reserves and operating performance (which includes production and sales volumes). These estimates and assumptions are subject to risk and uncertainty. Therefore, there is a possibility that changes in circumstances will impact these projections, which may impact the recoverable amount of assets and/or CGUs.
p) Provisions i. Site restoration provision Site restoration costs will be incurred by the Group either while operating, or at the end of the operating life of, the Group’s facilities and mine properties. The Group assesses its site restoration provision at each reporting date. The Group recognises a site restoration provision where it has a legal and constructive obligation as a result of past events, and it is probable that an outflow of resources will be required to settle the obligation, and a reliable estimate of the amount of obligation can be made. The nature of these restoration activities includes: closing mine, waste sites, tailings dams and related constructions and restoring, reclaiming and revegetating affected areas. When the liability is initially recognised, the present value of the estimated costs is capitalised by increasing the carrying amount of the related mining assets to the extent that it was incurred as a result of the development/construction of the mine. Costs related to restoration of waste damps and mine closure are provided for at their net present values and recognised in profit or loss. Changes in the estimated timing of site restoration or changes to the estimated future costs are dealt with prospectively by recognising an adjustment to the site restoration liability and a corresponding adjustment to the asset to which it relates, if the initial estimate was originally recognised as part of an asset measured in accordance with IAS 16, otherwise the change is recognised in profit or loss. Any reduction in the site restoration liability and, therefore, any deduction from the asset to which it relates, may not exceed the carrying amount of that asset. If it does, any excess over the carrying value is taken immediately to the statement of profit or loss and other comprehensive income. If the change in estimate results in an increase in the site restoration liability and, therefore, an addition to the carrying value of the asset, the Group considers whether this is an indication of impairment of the asset as a whole, and if so, tests for impairment.
Zangezur Copper Molybdenum Combine CJSC Notes to the consolidated financial statements for 2020
49
37. Summary of significant accounting policies (continued)
p) Provisions (continued) Over time, the discounted liability is increased for the change in present value based on the discount rates that reflect current market assessments and the risks specific to the liability. The periodic unwinding of the discount is recognised in the statement of profit or loss and other comprehensive income as part of finance costs. For closed sites, changes to estimated costs are recognised immediately in the statement of profit or loss and other comprehensive income.
q) Leases Group as a lessor Leases in which the Group does not transfer substantially all the risks and rewards of ownership of an asset are classified as operating leases. Rental income arising is accounted for on a straight-line basis over the lease terms and is included in revenue in the statement of profit or loss due to its operating nature. Initial direct costs incurred in negotiating and arranging an operating lease are added to the carrying amount of the leased asset and recognised over the lease term on the same basis as rental income. Contingent rents are recognised as revenue in the period in which they are earned. Group as a lessee The Group assesses at contract inception whether a contract is, or contains, a lease. That is, if the contract conveys the right to control the use of an identified asset for a period of time in exchange for consideration. The Group applies a single recognition and measurement approach for all leases, except for short-term leases and leases of low-value assets. The Group recognises lease liabilities to make lease payments and right-of-use assets representing the right to use the underlying assets. Right-of-use assets The Group recognises right-of-use assets at the commencement date of the lease (i.e., the date the underlying asset is available for use). Right-of-use assets are measured at cost, less any accumulated depreciation and impairment losses, and adjusted for any remeasurement of lease liabilities. The cost of right-of-use assets includes the amount of lease liabilities recognised, initial direct costs incurred, and lease payments made at or before the commencement date less any lease incentives received. Right-of-use assets are depreciated on a straight-line basis over the shorter of the lease term and the estimated useful lives of the assets, as follows:
► Plant and machinery 3 to 15 years;
► Motor vehicles and other equipment 3 to 5 years. If ownership of the leased asset transfers to the Group at the end of the lease term or the cost reflects the exercise of a purchase option, depreciation is calculated using the estimated useful life of the asset. The right-of-use assets are also subject to impairment. Lease liabilities At the commencement date of the lease, the Group recognises lease liabilities measured at the present value of lease payments to be made over the lease term. The lease payments include fixed payments (including in-substance fixed payments) less any lease incentives receivable, variable lease payments that depend on an index or a rate, and amounts expected to be paid under residual value guarantees. The lease payments also include the exercise price of a purchase option reasonably certain to be exercised by the Group and payments of penalties for terminating the lease, if the lease term reflects the Group exercising the option to terminate. Variable lease payments that do not depend on an index or a rate are recognised as expenses (unless they are incurred to produce inventories) in the period in which the event or condition that triggers the payment occurs. In calculating the present value of lease payments, the Group uses its incremental borrowing rate at the lease commencement date because the interest rate implicit in the lease is not readily determinable. After the commencement date, the amount of lease liabilities is increased to reflect the accretion of interest and reduced for the lease payments made. In addition, the carrying amount of lease liabilities is remeasured if there is a modification, a change in the lease term, a change in the lease payments (e.g., changes to future payments resulting from a change in an index or rate used to determine such lease payments) or a change in the assessment of an option to purchase the underlying asset.
Zangezur Copper Molybdenum Combine CJSC Notes to the consolidated financial statements for 2020
50
37. Summary of significant accounting policies (continued)
q) Leases (continued) Short-term leases and leases of low-value assets The Group applies the short-term lease recognition exemption to its short-term leases of machinery and equipment (i.e., those leases that have a lease term of 12 months or less from the commencement date and do not contain a purchase option). It also applies the lease of low-value assets recognition exemption to leases of office equipment that are considered to be low value. Lease payments on short-term leases and leases of low-value assets are recognised as expense on a straight-line basis over the lease term.
r) Current versus non-current classification The Group presents assets and liabilities in the consolidated statement of financial position based on current/ non-current classification. An asset is current when it is either:
► Expected to be realized or intended to be sold or consumed in normal operating cycle;
► Held primarily for the purpose of trading;
► Expected to be realized within 12 months after the reporting period; or
► Cash and cash equivalents unless restricted from being executed or used to settle a liability at least 12 months after the reporting period.
All other assets are classified as non-current. A liability is current when either:
► It is expected to be settled in normal operating cycle;
► It is held primarily for the purpose of trading;
► It is expected to be settled within 12 months after the reporting period; or
► There is no unconditional right to defer the settlement of the liability for at least 12 months after the reporting period.
The Group classifies all other liabilities as non-current. Deferred tax assets and liabilities are classified as non-current assets and liabilities.
s) Borrowing costs Borrowing costs directly attributable to the acquisition, construction or production of an asset that necessarily takes a substantial period of time to get ready for its intended use or sale (a qualifying asset) are capitalised as part of the cost of the respective asset. Borrowing costs consist of interest and other costs that an entity incurs in connection with the borrowing of funds. Where funds are borrowed specifically to finance a project, the amount capitalised represents the actual borrowing costs incurred. Where the funds used to finance a project form part of general borrowings, the amount capitalised is calculated using a weighted average of rates applicable to relevant general borrowings of the Group during the period. All other borrowing costs are recognised in the statement of profit or loss and other comprehensive income in the period in which they are incurred.