Embed Size (px)
Citation preview
The Rockefeller University Press, 0021-9525/98/11/613/12 $2.00The Journal of Cell Biology, Volume 143, Number 3, November 2, 1998 613–624http://www.jcb.org 613
ZAP-70 Association with T Cell Receptor
z
(TCR
z
):Fluorescence Imaging of Dynamic Changes uponCellular Stimulation
Joanne Sloan-Lancaster,* John Presley,
‡
Jan Ellenberg,
‡
Tetsuo Yamazaki,*Jennifer Lippincott-Schwartz,
‡
and Lawrence E. Samelson*
*The Section on Lymphocyte Signaling,
‡
The Unit of Organelle Biology, Cell Biology and Metabolism Branch, National Institute of Child Health and Human Development, National Institutes of Health, Bethesda, Maryland 20892
Abstract.
The nonreceptor protein tyrosine kinase ZAP-70 is a critical enzyme required for successful T lymphocyte activation. After antigenic stimulation, ZAP-70 rapidly associates with T cell receptor (TCR) subunits. The kinetics of its translocation to the cell sur-face, the properties of its specific interaction with the TCR
z
chain expressed as a chimeric protein (TT
z
and T
zz
), and its mobility in different intracellular compart-ments were studied in individual live HeLa cells, using ZAP-70 and T
zz
fused to green fluorescent protein (ZAP-70 GFP and T
zz
–GFP, respectively). Time-lapse imaging using confocal microscopy indicated that the activation-induced redistribution of ZAP-70 to the plasma membrane, after a delayed onset, is of long du-ration. The presence of the TCR
z
chain is critical for the redistribution, which is enhanced when an active form of the protein tyrosine kinase Lck is coexpressed.
Binding specificity to TT
z
was indicated using mutant ZAP-70 GFPs and a truncated
z
chimera. Photobleach-ing techniques revealed that ZAP-70 GFP has de-creased mobility at the plasma membrane, in contrast to its rapid mobility in the cytosol and nucleus. T
zz
–GFP is relatively immobile, while peripherally located ZAP-70 in stimulated cells is less mobile than cytosolic ZAP-70 in unstimulated cells, a phenotype confirmed by determining the respective diffusion constants. Ex-amination of the specific molecular association of sig-naling proteins using these approaches has provided new insights into the TCR
z
–ZAP-70 interaction and will be a powerful tool for continuing studies of lym-phocyte activation.
Key words: ZAP-70 • TCR
z
• protein tyrosine kinase • intracellular signaling • GFP
E
ngagement
of the T cell receptor (TCR)
1
by anti-genic ligand, in the form of a short linear peptidebound in the cleft of a major histocompatibility
complex (MHC) class I or II molecule, is the critical bind-ing event leading to T cell activation (Babbitt et al., 1985;Townsend et al., 1986; Bentley and Mariuzza, 1996; Garciaet al., 1996). The TCR is comprised of multiple integralmembrane proteins (Jorgensen et al., 1992; Weiss, 1993;
Weissman, 1994) and serves to initiate intracellular signal-ing, leading to new gene expression, protein synthesis, in-duction of multiple effector functions, and clonal expan-sion (Samelson and Klausner, 1992; Weiss and Littman,1994). The
ab
heterodimer binds to the antigen-MHCligand, and the CD3
g
,
d
,
e
, and TCR
z
chains translate thisevent into biochemical signals within the cell (Cantrell,1996; Garcia et al., 1996; Wange and Samelson, 1996; Qianand Weiss, 1997). Since none of these molecules containsany intrinsic enzymatic activity, they recruit and bind sig-naling proteins via their conserved immunoreceptor ty-rosine-based activation motifs (ITAMs), which are presentas a single copy in each of the CD3 chains and in triplicatein TCR
z
(Reth, 1989; Weiss and Littman, 1994; Wangeand Samelson, 1996). The CD3 and TCR
z
chains are phos-phorylated on the tyrosines within their ITAMs withinseconds of TCR engagement by the Src kinases Lck andFyn (Iwashima et al., 1994; van Oers et al., 1996; Sloan-Lancaster and Samelson, 1998). The phospho-ITAMs arethen able to bind SH2 domain–containing proteins, allow-
J. Sloan-Lancaster’s current address is Division of Research Technologiesand Proteins, Eli Lilly and Company, Lilly Corporate Center, Indianapo-lis, IN 46285.
Address all correspondence to Lawrence E. Samelson, NICHD,CBMB, Bldg. 18T, Rm 101, Bethesda, MD 20892. Tel.: (301) 496-6368.Fax: (301) 402-0078. E-mail: [email protected]
1.
Abbreviations used in this paper
:
FLIP, fluorescence loss in pho-tobleaching; FRAP, fluorescence recovery after photobleaching; GFP,green fluorescent protein; ITAM, immunoreceptor tyrosine-based activa-tion motif; MHC, major histocompatibility complex; PV, pervanadate;ROI, region of interest; TCR, T cell antigen receptor; TT
z
, Tac Tac zeta;T
zz
, Tac zeta zeta.
on April 10, 2019jcb.rupress.org Downloaded from http://doi.org/10.1083/jcb.143.3.613Published Online: 2 November, 1998 | Supp Info:
The Journal of Cell Biology, Volume 143, 1998 614
ing a multiprotein complex to form under the membrane,which includes enzymes and adaptors responsible for trig-gering the various intracellular signaling pathways for suc-cessful T cell activation (Weiss and Littman, 1994; Wangeand Samelson, 1996).
ZAP-70, a nonreceptor protein tyrosine kinase ex-pressed exclusively in T cells, thymocytes, and naturalkiller cells, is a critical enzyme in early T cell signaling(Chan et al., 1992; Wange et al., 1992; Arpaia et al., 1994;Chan et al., 1994; Elder et al., 1994; Negishi et al., 1995).After binding via its tandem SH2 domains to the twophosphotyrosines of an individual ITAM during TCR en-gagement (Wange et al., 1993), ZAP-70 is phosphorylatedby Lck and/or Fyn and is thus activated (Iwashima et al.,1994; Wange et al., 1995
a
; Kong et al., 1996). Subse-quently, these kinases phosphorylate other specific sub-strates, resulting in the activation of the various intracel-lular signaling pathways required for T cell function.Although the absolute requirement of functional ZAP-70for T cell activation has been clearly demonstrated bothbiochemically and genetically (Wange et al., 1995
b
; Qianet al., 1996; Williams et al., 1998), few studies have exam-ined its intracellular localization and how this is affectedby cellular stimulation. The primary structure predicts thatZAP-70 is a cytosolic protein (Chan et al., 1992), and bio-chemical data have shown that it rapidly translocates tothe TCR upon activation (Wange et al., 1992; Chan et al.,1991). We have recently developed a cellular approach toexamine the location and movement of ZAP-70 in singlecells over real time, using a chimera of ZAP-70 fused tothe green fluorescent protein (GFP) and time-lapse imag-ing confocal microscopy (Sloan-Lancaster et al., 1997).Our initial study revealed that ZAP-70 GFP was presentnot only throughout the cytosol but also in the nucleus, inboth transiently transfected COS 7 cells and ZAP-70–defi-cient T cells stably reconstituted with the chimera. In COS7 cells, ZAP-70 GFP rapidly moved from the cytosol to thecell surface in response to pharmacological stimulation.This was surprising since COS 7 cells do not express anyTCR chains or other molecules known to contain ITAMs.We reasoned that another membrane-associated protein,which becomes tyrosine phosphorylated upon cellularstimulation, was able to bind ZAP-70 in order for thistranslocation and apparent binding to occur (Sloan-Lan-caster et al., 1997).
Since the current model of T cell activation dictates thatZAP-70 is bound and concentrated at the region of acti-vated TCR via a specific interaction with the phosphory-lated ITAMs of TCR subunits, we wanted to refine our ex-perimental system to study this association. This wouldenable us not only to assess the real time binding kinetics,but also to demonstrate the fine specificity of the molecu-lar interaction in individual living cells. In addition, wewanted to measure the mobility of ZAP-70 in the differentintracellular compartments to understand the mechanismsof retention at the plasma membrane. Here we report thestimulation-dependent translocation of ZAP-70 to the cellsurface in HeLa cells is dependent on expression of a chi-meric TCR
z
chain. We describe the kinetics of this interac-tion and show that ZAP-70 translocation is enhanced bycoexpressing active Lck. Moreover, we provide evidencethat relocated ZAP-70 is specifically bound to the chi-
meric
z
chain, with properties that correspond preciselywith the data generated biochemically (Wange et al., 1993;Koyasu et al., 1994). Using photobleaching techniques, wehave revealed the highly mobile and freely diffusible na-ture of cytosolic and nuclear ZAP-70 and its conversion toa more static state accompanying its translocation to thecell periphery. Cell surface–located ZAP-70 is more dif-fusible than TCR
z
, a transmembrane protein, a phenotypeconfirmed by calculating the diffusion constants for the in-dividual proteins, which indicated that peripheral ZAP-70diffuses 20-fold faster than TCR
z
. Such observations sug-gest that the interaction between ZAP-70 and TCR
z
uponcellular stimulation is dynamic.
Materials and Methods
Cells, Antibodies, and Reagents
HeLa cells were grown in complete D10 medium (DME containing 10%FBS, 2 mM glutamine, and 50
m
g/ml gentamicin). All stably transfectedlines were cultured in complete D10 medium supplemented with 1 mg/mlgeneticin (G418; GIBCO BRL, Gaithersburg, MD) for maintenance oftransgene expression. H/TT
z
, H/T
zz
, and H/T
zz
truncated (H/T
zz
trunc)cells stably expressed the appropriate fusion protein as determined by fre-quent FACS
®
and immunoprecipitation analyses.mAbs used include anti–IL-2 receptor
a
chain, 33B3.1 (Immunotech,Inc., Westbrook, ME), for FACS
®
analysis; rabbit anti–ZAP-70 antiserum(Wange et al., 1995
a
); mouse anti–human
a
-tubulin (Sigma Chemical Co.,St. Louis, MO); rhodamine-coupled goat anti–mouse IgG; and fluores-cein-coupled goat anti–rat IgG (KPL, Inc., Gaithersburg, MD).
Plasmids, Constructs, and Transfection
The generation of pSXSR
a
-Lck F505, pEGFP/ZAP-70, and pEGFP/kin.neg. (with deleted kinase domain) ZAP-70 have been described previ-ously (Wange et al., 1995
a
; Sloan-Lancaster et al., 1997). pEGFP/doubleSH2 was made by ligating the NheI/XmnI fragment from pEGFP/ZAP-70, containing both SH2 domains and both interdomains, to the NheI/SmaI-digested pEGFP-N1 vector. For construction of pEGFP/ZAP-70kin.dom. (expressing the kinase domain alone), the NheI/XmnI fragmentwas removed from pEGFP/ZAP-70, and the vector was religated usingthe oligos 5
9
CTA GCA CCG GTG GAT CCT CTA GAA TGA AGC 3
9
and 5
9
GCT TCA TTC TAG AGG ATC CAC CGG TG 3
9
. For pEGFP/SH2(C)
1
kin.dom., the NheI/KpnI fragment of pEGFP/ZAP-70 was re-moved, and the vector religated using the oligos 5
9
CTA GCG ATA TCATGC CAG ACC CCG CGG CGC ACC TGC CCT GGT AC 3
9
and 5
9
CAG GGC AGG TGC GCC GCG GGG TCT GGC ATG ATA TCG 3
9
.pEGFP/SH2(N)
1
kin.dom. was made in two steps. First, an intermediatevector, ZAP 1
1
2, encoding the kinase domain alone with an insertedKpnI site, was derived by annealing the NheI/XmnI-digested pEGFP/ZAP-70 to the oligos 5
9
CTA GCG ATA TCT GCA GGG TAC CTCGAG AAG C 3
9
and 5
9
GCT TCT CGA GGT ACC CTG CAG ATATCG 3
9
. The NheI/KpnI fragment of pEGFP/ZAP-70, encoding the NH
2
-terminal SH2 and interdomain 1, was then ligated to the NheI/KpnI-cutZAP 1
1
2. pEGFP/T
zz
was constructed as follows: the EcoRI/BamHIfragment from pXSSR
a
/T
zz
(Letourneur and Klausner, 1991) was li-gated to EcoRI/BamHI-digested pEGFP-N1 vector to create the inter-mediate plasmid pEGFP/T
zz
/BamHI. A PCR fragment from the BamHIsite of T
zz
was created with an introduced COOH-terminal AgeI site, us-ing the oligos 5
9
GCA GGG ATC CAG AGA TGG GAG GC 3
9
and 5
9
GAC GAC CGG TGA GCG AGG GGC CAG GGT CTG 3
9
. ThenBamHI/AgeI-digested PCR product and BamHI/AgeI-digested pEGFP/T
zz
/BamH1 vector were ligated together to produce the final construct,pEGFP/T
zz
.
The construction of the TT
z
, T
zz
, and T
zz
trunc chimerashave been described elsewhere (Letourneur and Klausner, 1991). Allthree contain the extracellular domain of the human IL-2 receptor
a
chainand the intracellular domain of TCR
z
. TT
z
includes the transmembrane re-gion of the IL-2 receptor
a
chain, while T
zz
contains the transmembraneregion of TCR
z
. T
zz
trunc is a shortened form of the latter chimera, termi-nated after TCR
z
amino acid residue 65, and thus lacks all three ITAMs(Letourneur and Klausner, 1991). HeLa cells, or their stably transfectedcounterparts, were electroporated using 15
m
g of each DNA construct at
Sloan-Lancaster et al.
Dynamics of ZAP-70 and TCR
z
615
250 V and 500
m
F using a Gene Pulser (Bio-Rad Labs., Hercules, CA) andused 20–24 h after transfection.
Immunofluorescence Staining
HeLa cells were grown overnight on sterile glass coverslips (10-mm diam-eter, No. 1 thickness). Cells, untreated or pretreated with nocodazole (33
m
M, 30 min incubation at 4
8
C, followed by 30 min at 37
8
C), were thenfixed in 3.7% paraformaldehyde in PBS for 30 min at room temperature,washed (three times) in PBS containing 10% fetal bovine serum (PBS/FBS), permeabilized using 0.1% Triton X-100 in PBS for 4 min at roomtemperature, washed (three times), and incubated for 45 min in PBS/FBSfor preblocking. Cells were then incubated with a mouse anti–human tu-bulin Ab in PBS/FBS for 45 min at room temperature, washed, and incu-bated with rhodamine-coupled goat anti–mouse IgG for 45 min, followedby washing with PBS (three times). The coverslips were then mountedonto glass slides using Fluoromount G (Southern Biotechnology Associ-ates, Inc., Birmingham, AL) and viewed using the 568-nm laser line of aconfocal laser scanning microscope (model LSM 410; Carl Zeiss, Inc.,Thornwood, NY) with a 100
3
planapochromat oil immersion objective(NA 1.4) and optics for rhodamine.
Fluorescence Microscopy, Time-Lapse Imaging, and Image Processing
Transfected cells were grown overnight in coverglass chambers (LabTek,Naperville, IL) in complete D10 medium. For time-lapse imaging experi-ments, the slides were mounted on a custom-made platform (of a confocallaser scanning microscope; Yona Microscope and Instrument Co., Rock-ville, MD) equipped with a triple line Kr/Ar laser, a 100
3
1.4 NA Pla-napochromat oil immersion objective, a 25
3
0.8 NA Neofluar immersioncorrected objective, and a temperature-controlled stage. Time-lapse se-quences were recorded with macros programmed with the Zeiss LSMsoftware package that allow autofocusing on the coverslip surface in re-flection mode before taking confocal fluorescence images. The media wasreplaced by PBS supplemented with magnesium and calcium salts beforethe start of imaging. In Fig. 4
d
, cells were treated with nocodazole asabove before beginning the time-lapse imaging. Two images of each cellwere taken before addition of the pervanadate (PV) stimulant directly tothe chambered coverglass, and subsequent images were taken at 30-s in-tervals thereafter until 15 min after stimulation, as previously described(Sloan-Lancaster et al., 1997).
Photobleaching Experiments
Fluorescence loss in photobleaching (FLIP) experiments were performedat room temperature on a custom-made stage of a confocal microscope(model LSM 410; Carl Zeiss, Inc.) using the 63
3
objective and the 488-nmline of a 400-mW Kr/Ar laser, which delivered 0.9 mW power (Cole et al.,1996). In brief, HeLa cells expressing ZAP-70 GFP alone, ZAP-70 GFPtogether with Lck F505, or T
zz
GFP were left untreated or stimulatedwith PV for 12 min before beginning the FLIP experiment, as indicated infigure legends. A small rectangular region defined by the boxed area wasrepeatedly illuminated with the laser at 100% power, 100% transmission.Between each intense illumination, the entire field of view was imaged atlow-power laser light (20% power, 1% transmission) to assess the extentof loss of fluorescence outside the box as a consequence of photobleach-ing within the box. The time lapse between images was
z
25 s. The possi-bility that regions on the edge of the illuminated box are progressivelybleached by light leakage during FLIP was ruled out by repeating FLIPidentically on fixed cells, which showed bleaching only in the area exposedto illumination. Furthermore, there was no significant photobleachingwhile imaging the recovering cell since control cells in the field did notlose any significant fluorescence intensity during the time followed.
Fluorescence recovery after photobleaching (FRAP; Edidin, 1994) wasperformed at room temperature on a confocal microscope (model LSM410; Carl Zeiss, Inc.) essentially as described (Ellenberg et al., 1997). Forthe qualitative
D
measurements shown in Fig. 7, cells were stimulated for12 min before commencement of photobleaching. The width of the rectan-gular regions of interest used were 2
m
m (T
zz
GFP, some ZAP-70 GFP)or 4
m
m (ZAP-70 GFP). Fluorescence within the strip was measured atlow laser power (20% power, 1% transmission) before the bleach (pre-bleach intensity) and then photobleached with full laser power (100%power, 100% transmission) for 0.218 s (T
zz
GFP) or 0.436 s (ZAP-70GFP) (which effectively reduced the fluorescence to background levels in
fixed material). Recovery was followed after 2 s with low laser power at2-s intervals for 200 s (T
zz
GFP) or 1-s intervals for 50 s (ZAP-70 GFP)and then at 10-s intervals until the recovered fluorescence intensity withinthe strip had reached a plateau. Zero of time
t
, taken as the midpoint ofthe bleach, was 2.399 s for T
zz
GFP and 2.513 s for ZAP-70 GFP.
Numeri-cal simulations were used to determine
D
using the prebleach intensity ofentire cells (to assess the effects of geometry and nonuniform fluorescencedensity) and compared with experimentally derived
D
values, as described(Ellenberg et al., 1997; Sciaky et al., 1997).
Results
Redistribution of ZAP-70 to the Plasma Membranein HeLa Cells Requires Both Cellular Activation and Coexpression of a TCR Chain
In a previous report, we made use of a ZAP-70 GFP chi-mera to study the intracellular location of this protein ty-rosine kinase, and how it changed in response to cellularstimulation, using time-lapse imaging (Sloan-Lancasteret al., 1997). This approach revealed the very rapid redis-tribution of cytosolic ZAP-70 to the cell surface, with sig-nificant membrane accumulation detected as early as 1min after stimulation. The phenotype was enhanced whenan active form of Lck was coexpressed, which itself in-duced some ZAP-70 translocation. These results weresomewhat surprising since the COS 7 cells, in which thechimeric ZAP-70 GFP was expressed, do not contain anyTCR chains. We were therefore curious to determinewhether the introduction of a TCR chain in this experi-mental system had any observable effect on the redistribu-tion of ZAP-70.
To compare results in the presence or absence of a TCRchain, we made use of the HeLa cell line, which lacks anyTCR chains, and its transfected derivative, H/TT
z
, whichstably expresses a chimeric form of TCR
z
comprised ofthe extracellular and transmembrane portions of the hu-man IL-2 receptor
a
chain, Tac, fused to the entire intra-cellular region of TCR
z
(Letourneur and Klausner, 1991).The fusion protein is successfully expressed on the cell sur-face as an integral membrane protein independent of anyother TCR component and provides an experimental sys-tem in which the contribution of the tandem ITAMs ofTCR
z can be examined apart from the CD3 molecules(Letourneur and Klausner, 1991). In non–T cells, cross-linking TTz at the cell surface does not induce cellular ac-tivation. Thus, to stimulate the cells, we used the pharma-cological agent pervanadate (PV). PV inhibits intracellularphosphatases, thereby creating a steady state in which ty-rosine residues are phosphorylated normally but not de-phosphorylated and which is used as a surrogate for anti-gen or anti-TCR cross-linking (O’Shea et al., 1992; Secristet al., 1993). Both HeLa and H/TTz cells were transfectedwith ZAP-70 GFP, and time-lapse imaging was used tomonitor the movement of the chimeric fluorescent mole-cule in response to pharmacological stimulation. Two im-ages were taken before PV addition, with subsequent im-ages taken at 30-s intervals thereafter.
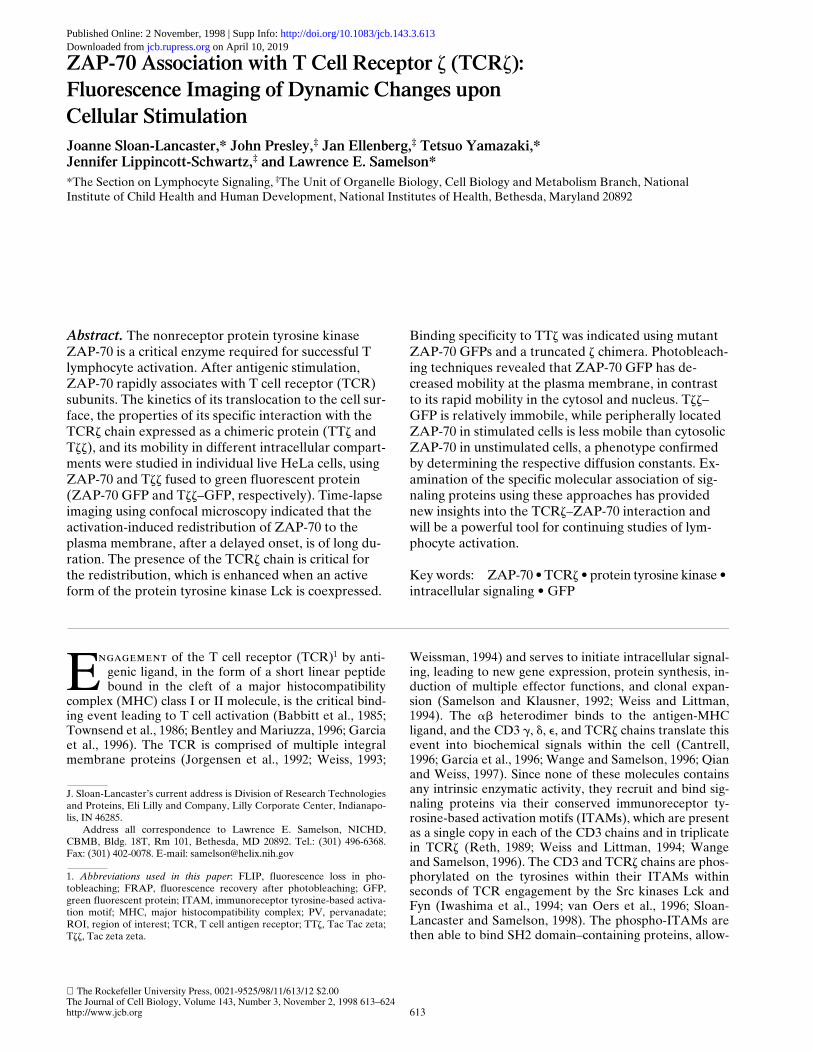
Little if any ZAP-70 redistributed to the plasma mem-brane in HeLa cells with PV stimulation (Fig. 1, top row),while significant membrane accumulation was evident asearly as 2 min after stimulation in COS 7 cells (Sloan-Lan-caster et al., 1997). The lack of a similar phenotype in
The Journal of Cell Biology, Volume 143, 1998 616
HeLa cells suggests that no phosphotyrosine- or ITAM-containing proteins capable of binding ZAP-70 are ex-pressed in these cells. Thus, in the absence of a TCR chain,pharmacological stimulation had little effect on ZAP-70redistribution in HeLa cells. However, when H/TTz cellswere stimulated with PV, ZAP-70 dramatically redistrib-uted to the cell surface in all cells examined (Fig. 1, secondrow). Unlike its rapid accumulation to the plasma mem-brane in COS 7, there was a significant delay in H/TTz, withlittle detectable redistribution until 8–10 min after stimula-tion. At this time, movement to the plasma membrane,accompanied by cytosolic clearing, continued steadilyaround each cell until z15 min after stimulation, whenZAP-70 was uniformly distributed over the inner surface.Results from a semiquantitative analysis of individual cellsconfirmed this phenotype, in which mean fluorescence in-tensity in a region of interest (ROI) over the center ofeach cell (cytosol and plasma membrane) was comparedwith an ROI at the edge (plasma membrane). These dataindicated that there was, on average, a 1.1-fold increase inthe surface to cytosolic fluorescence ratio 4 min after stim-ulation, which increased to 1.5-fold by 8 min and to 3.1-fold by 15 min after PV addition. The uniform distributionaround the cell surface was consistent with ZAP-70 bind-ing specifically to the chimeric TTz molecule, which is lo-calized throughout the plasma membrane under theseconditions (data not shown).
Lck F505 Enhances ZAP-70 GFP Movement to theCell Surface
The current model of physiological early T cell signalingsuggests that ZAP-70 binds to the ITAMs of TCRz onlyafter they have been phosphorylated by Lck and/or Fyn(Iwashima et al., 1994; Wange and Samelson, 1996; Qianand Weiss, 1997). Our earlier studies in COS 7 suggestedthat expression of active Lck followed by PV stimulationenhances the redistribution of ZAP-70 to the cell surfaceover that induced by PV alone (Sloan-Lancaster et al.,1997). Thus, we performed time-lapse imaging in cells co-expressing the constitutively active Lck F505 to determineif this kinase influenced the recruitment of ZAP-70 and itsbinding to TCRz. In HeLa cells, the coexpression of LckF505 had no apparent effect on the location of ZAP-70 be-fore or after PV stimulation, since ZAP-70 was not de-tected at the plasma membrane at any time point (Fig. 1,third row). This further confirmed the lack of other ZAP-70–binding proteins in HeLa cells, and thus the specificityof the interaction with the ITAMs in H/TTz. With the ex-pression of the chimeric TCRz chain, Lck F505 enhancedthe redistribution of ZAP-70 to the cell surface, and pre-sumably its binding to TTz (Fig. 1, bottom row). The time-lapse imaging results suggested that Lck F505 kineticallyenhanced the accumulation of ZAP-70 at the cell surface.ZAP-70 accumulation was detected at the plasma mem-
Figure 1. Activation-induced movement of ZAP-70 to the cell surface in TCRz-expressing HeLa cells and its enhancement by Lck F505.Individual live HeLa or H/TTz cells were monitored by time-lapse imaging confocal microscopy. Lck F505 was cotransfected with ZAP-70 GFP in the bottom two rows. Two images were taken before PV addition, with subsequent images collected every 30 s thereafter.One prestimulation image is shown for each experimental group, followed by those at 4, 8, 12, and 15 min after stimulation. Bar: (Rows1, 3, and 4) 21 mm; (row 2) 27 mm.
Sloan-Lancaster et al. Dynamics of ZAP-70 and TCRz 617
brane as early as 4–5 min after stimulation, reaching a pla-teau by 8 min (Fig. 1, bottom row). This was determined inseveral cells by comparing fluorescence intensities withinROIs over the center of the cell (cytoplasm and plasmamembrane) and at the edge (plasma membrane only) withtime. These data showed an increase in fluorescence inten-sity at the plasma membrane at a much earlier time afterstimulation in cells coexpressing Lck F505. However,there was no apparent quantitative enhancement by LckF505, since surface fluorescence increased threefold com-pared with cytosolic levels whether or not Lck F505 wascoexpressed.
The Specificity of ZAP-70–TTz Interaction
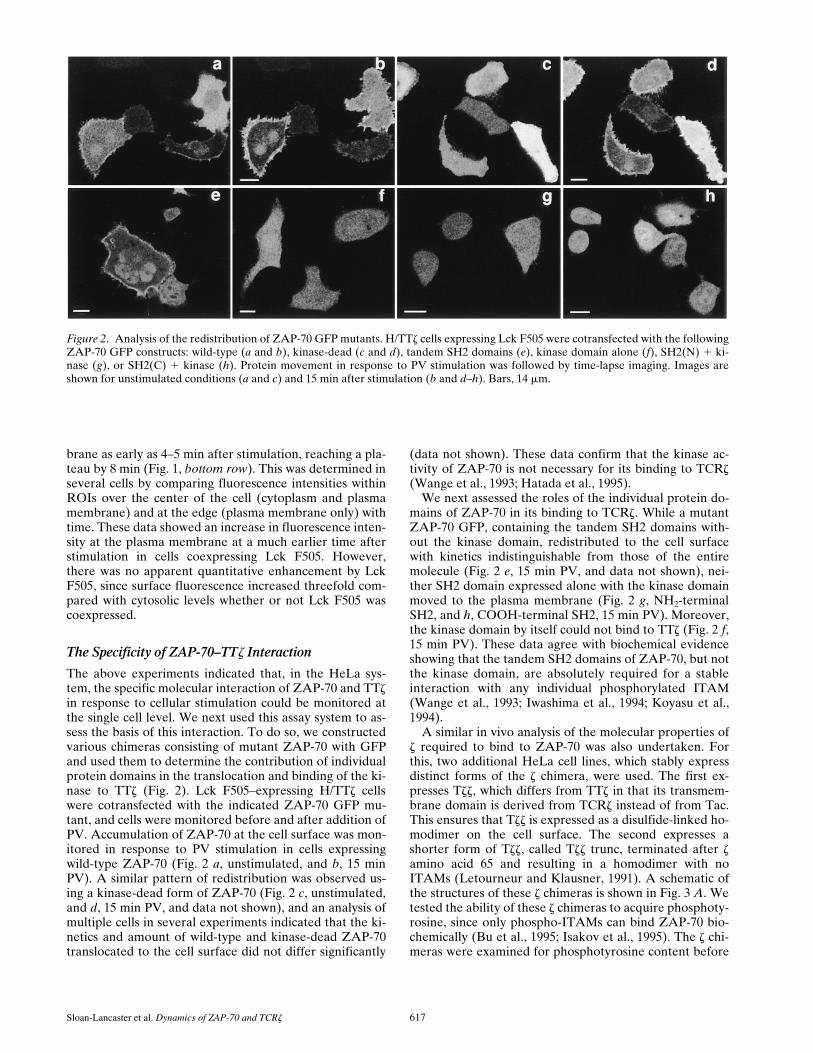
The above experiments indicated that, in the HeLa sys-tem, the specific molecular interaction of ZAP-70 and TTzin response to cellular stimulation could be monitored atthe single cell level. We next used this assay system to as-sess the basis of this interaction. To do so, we constructedvarious chimeras consisting of mutant ZAP-70 with GFPand used them to determine the contribution of individualprotein domains in the translocation and binding of the ki-nase to TTz (Fig. 2). Lck F505–expressing H/TTz cellswere cotransfected with the indicated ZAP-70 GFP mu-tant, and cells were monitored before and after addition ofPV. Accumulation of ZAP-70 at the cell surface was mon-itored in response to PV stimulation in cells expressingwild-type ZAP-70 (Fig. 2 a, unstimulated, and b, 15 minPV). A similar pattern of redistribution was observed us-ing a kinase-dead form of ZAP-70 (Fig. 2 c, unstimulated,and d, 15 min PV, and data not shown), and an analysis ofmultiple cells in several experiments indicated that the ki-netics and amount of wild-type and kinase-dead ZAP-70translocated to the cell surface did not differ significantly
(data not shown). These data confirm that the kinase ac-tivity of ZAP-70 is not necessary for its binding to TCRz(Wange et al., 1993; Hatada et al., 1995).
We next assessed the roles of the individual protein do-mains of ZAP-70 in its binding to TCRz. While a mutantZAP-70 GFP, containing the tandem SH2 domains with-out the kinase domain, redistributed to the cell surfacewith kinetics indistinguishable from those of the entiremolecule (Fig. 2 e, 15 min PV, and data not shown), nei-ther SH2 domain expressed alone with the kinase domainmoved to the plasma membrane (Fig. 2 g, NH2-terminalSH2, and h, COOH-terminal SH2, 15 min PV). Moreover,the kinase domain by itself could not bind to TTz (Fig. 2 f,15 min PV). These data agree with biochemical evidenceshowing that the tandem SH2 domains of ZAP-70, but notthe kinase domain, are absolutely required for a stableinteraction with any individual phosphorylated ITAM(Wange et al., 1993; Iwashima et al., 1994; Koyasu et al.,1994).
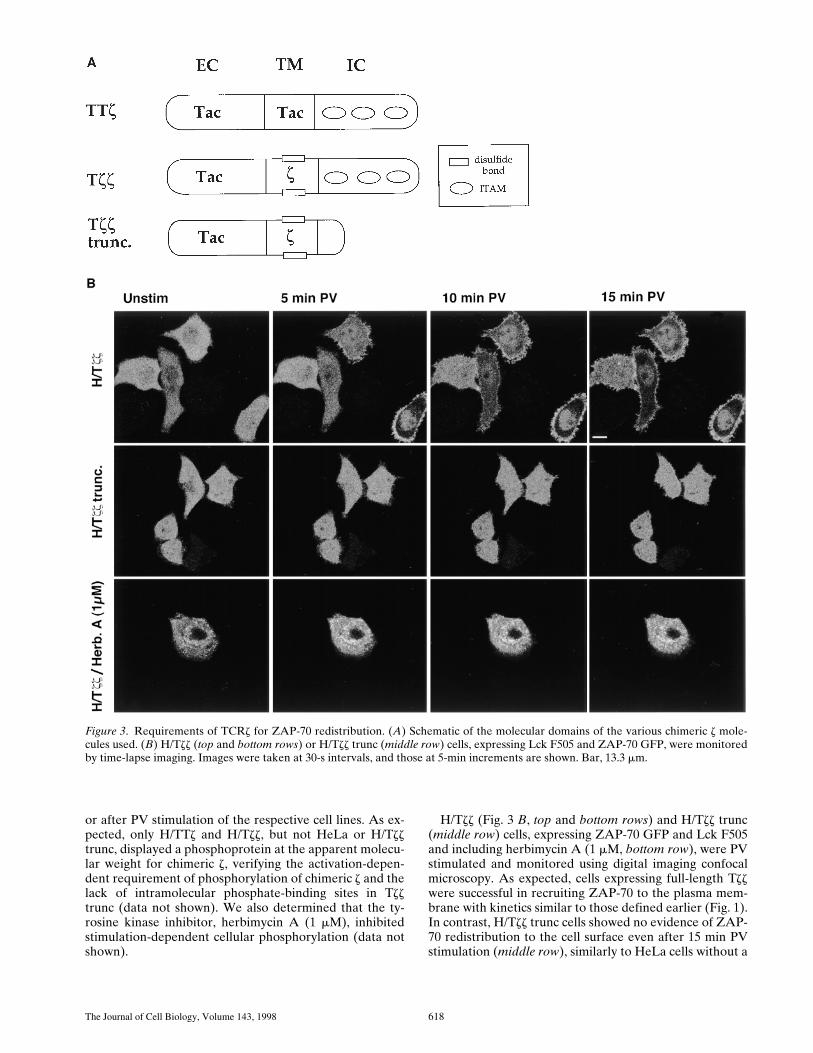
A similar in vivo analysis of the molecular properties ofz required to bind to ZAP-70 was also undertaken. Forthis, two additional HeLa cell lines, which stably expressdistinct forms of the z chimera, were used. The first ex-presses Tzz, which differs from TTz in that its transmem-brane domain is derived from TCRz instead of from Tac.This ensures that Tzz is expressed as a disulfide-linked ho-modimer on the cell surface. The second expresses ashorter form of Tzz, called Tzz trunc, terminated after zamino acid 65 and resulting in a homodimer with noITAMs (Letourneur and Klausner, 1991). A schematic ofthe structures of these z chimeras is shown in Fig. 3 A. Wetested the ability of these z chimeras to acquire phosphoty-rosine, since only phospho-ITAMs can bind ZAP-70 bio-chemically (Bu et al., 1995; Isakov et al., 1995). The z chi-meras were examined for phosphotyrosine content before
Figure 2. Analysis of the redistribution of ZAP-70 GFP mutants. H/TTz cells expressing Lck F505 were cotransfected with the followingZAP-70 GFP constructs: wild-type (a and b), kinase-dead (c and d), tandem SH2 domains (e), kinase domain alone (f), SH2(N) 1 ki-nase (g), or SH2(C) 1 kinase (h). Protein movement in response to PV stimulation was followed by time-lapse imaging. Images areshown for unstimulated conditions (a and c) and 15 min after stimulation (b and d–h). Bars, 14 mm.
The Journal of Cell Biology, Volume 143, 1998 618
or after PV stimulation of the respective cell lines. As ex-pected, only H/TTz and H/Tzz, but not HeLa or H/Tzztrunc, displayed a phosphoprotein at the apparent molecu-lar weight for chimeric z, verifying the activation-depen-dent requirement of phosphorylation of chimeric z and thelack of intramolecular phosphate-binding sites in Tzztrunc (data not shown). We also determined that the ty-rosine kinase inhibitor, herbimycin A (1 mM), inhibitedstimulation-dependent cellular phosphorylation (data notshown).
H/Tzz (Fig. 3 B, top and bottom rows) and H/Tzz trunc(middle row) cells, expressing ZAP-70 GFP and Lck F505and including herbimycin A (1 mM, bottom row), were PVstimulated and monitored using digital imaging confocalmicroscopy. As expected, cells expressing full-length Tzzwere successful in recruiting ZAP-70 to the plasma mem-brane with kinetics similar to those defined earlier (Fig. 1).In contrast, H/Tzz trunc cells showed no evidence of ZAP-70 redistribution to the cell surface even after 15 min PVstimulation (middle row), similarly to HeLa cells without a
Figure 3. Requirements of TCRz for ZAP-70 redistribution. (A) Schematic of the molecular domains of the various chimeric z mole-cules used. (B) H/Tzz (top and bottom rows) or H/Tzz trunc (middle row) cells, expressing Lck F505 and ZAP-70 GFP, were monitoredby time-lapse imaging. Images were taken at 30-s intervals, and those at 5-min increments are shown. Bar, 13.3 mm.
Sloan-Lancaster et al. Dynamics of ZAP-70 and TCRz 619
TCR chain (Fig. 1, first and third rows). While herbimycinA pretreatment prevented ZAP-70 redistribution to theplasma membrane, there was some redistribution of thechimera under these conditions (Fig. 3, bottom row). Thisdrug is likely causing several effects in the cells, many ofwhich may be tyrosine kinase dependent. However, thelack of redistribution of ZAP-70 to the plasma membranein the presence of herbimycin A is consistent with its inhi-bition of ITAM phosphorylation. Thus, the cytosolic tailof TCR containing ITAMs and tyrosine phosphorylationafter activation were critical for movement of ZAP-70 tothe membrane. TTz and Tzz appeared to perform equiva-lently for ZAP-70 recruitment, suggesting that TCRzdimerization has no effect on the binding efficiency forZAP-70 in this system (data not shown).
Intact Microtubules or Actin Cytoskeleton Are Not Required for ZAP-70 Translocation to the Cell Surface
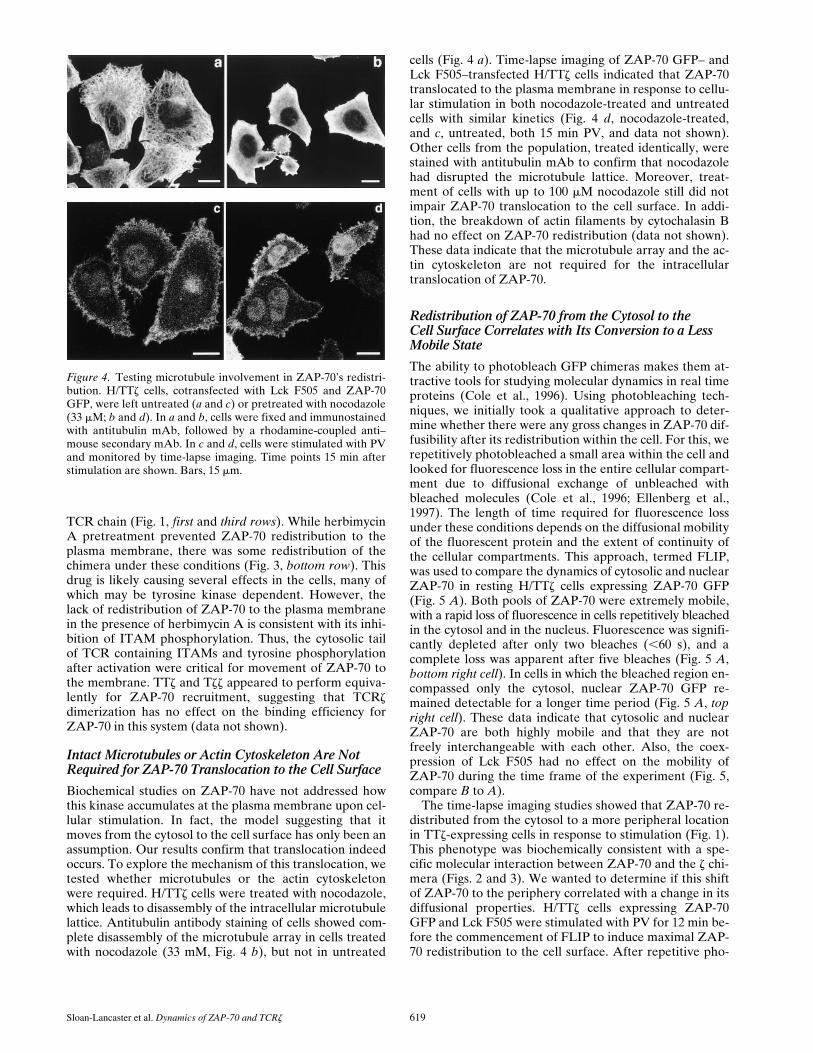
Biochemical studies on ZAP-70 have not addressed howthis kinase accumulates at the plasma membrane upon cel-lular stimulation. In fact, the model suggesting that itmoves from the cytosol to the cell surface has only been anassumption. Our results confirm that translocation indeedoccurs. To explore the mechanism of this translocation, wetested whether microtubules or the actin cytoskeletonwere required. H/TTz cells were treated with nocodazole,which leads to disassembly of the intracellular microtubulelattice. Antitubulin antibody staining of cells showed com-plete disassembly of the microtubule array in cells treatedwith nocodazole (33 mM, Fig. 4 b), but not in untreated
cells (Fig. 4 a). Time-lapse imaging of ZAP-70 GFP– andLck F505–transfected H/TTz cells indicated that ZAP-70translocated to the plasma membrane in response to cellu-lar stimulation in both nocodazole-treated and untreatedcells with similar kinetics (Fig. 4 d, nocodazole-treated,and c, untreated, both 15 min PV, and data not shown).Other cells from the population, treated identically, werestained with antitubulin mAb to confirm that nocodazolehad disrupted the microtubule lattice. Moreover, treat-ment of cells with up to 100 mM nocodazole still did notimpair ZAP-70 translocation to the cell surface. In addi-tion, the breakdown of actin filaments by cytochalasin Bhad no effect on ZAP-70 redistribution (data not shown).These data indicate that the microtubule array and the ac-tin cytoskeleton are not required for the intracellulartranslocation of ZAP-70.
Redistribution of ZAP-70 from the Cytosol to theCell Surface Correlates with Its Conversion to a Less Mobile State
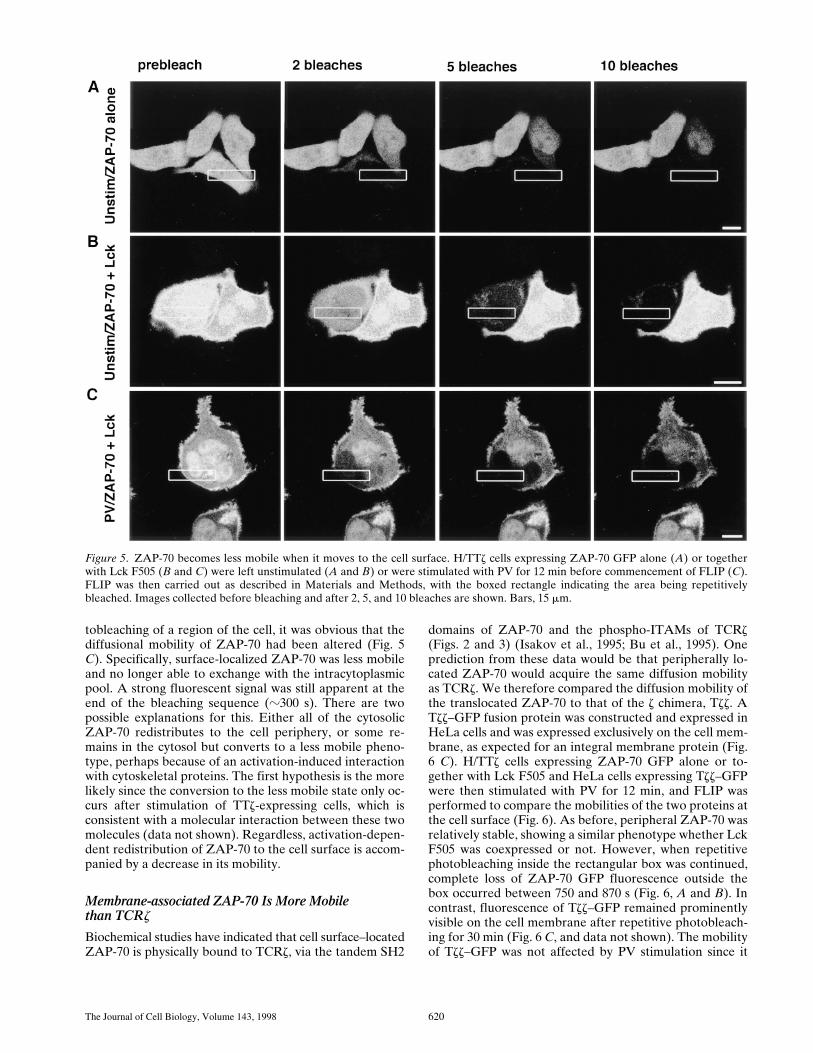
The ability to photobleach GFP chimeras makes them at-tractive tools for studying molecular dynamics in real timeproteins (Cole et al., 1996). Using photobleaching tech-niques, we initially took a qualitative approach to deter-mine whether there were any gross changes in ZAP-70 dif-fusibility after its redistribution within the cell. For this, werepetitively photobleached a small area within the cell andlooked for fluorescence loss in the entire cellular compart-ment due to diffusional exchange of unbleached withbleached molecules (Cole et al., 1996; Ellenberg et al.,1997). The length of time required for fluorescence lossunder these conditions depends on the diffusional mobilityof the fluorescent protein and the extent of continuity ofthe cellular compartments. This approach, termed FLIP,was used to compare the dynamics of cytosolic and nuclearZAP-70 in resting H/TTz cells expressing ZAP-70 GFP(Fig. 5 A). Both pools of ZAP-70 were extremely mobile,with a rapid loss of fluorescence in cells repetitively bleachedin the cytosol and in the nucleus. Fluorescence was signifi-cantly depleted after only two bleaches (,60 s), and acomplete loss was apparent after five bleaches (Fig. 5 A,bottom right cell). In cells in which the bleached region en-compassed only the cytosol, nuclear ZAP-70 GFP re-mained detectable for a longer time period (Fig. 5 A, topright cell). These data indicate that cytosolic and nuclearZAP-70 are both highly mobile and that they are notfreely interchangeable with each other. Also, the coex-pression of Lck F505 had no effect on the mobility ofZAP-70 during the time frame of the experiment (Fig. 5,compare B to A).
The time-lapse imaging studies showed that ZAP-70 re-distributed from the cytosol to a more peripheral locationin TTz-expressing cells in response to stimulation (Fig. 1).This phenotype was biochemically consistent with a spe-cific molecular interaction between ZAP-70 and the z chi-mera (Figs. 2 and 3). We wanted to determine if this shiftof ZAP-70 to the periphery correlated with a change in itsdiffusional properties. H/TTz cells expressing ZAP-70GFP and Lck F505 were stimulated with PV for 12 min be-fore the commencement of FLIP to induce maximal ZAP-70 redistribution to the cell surface. After repetitive pho-
Figure 4. Testing microtubule involvement in ZAP-70’s redistri-bution. H/TTz cells, cotransfected with Lck F505 and ZAP-70GFP, were left untreated (a and c) or pretreated with nocodazole(33 mM; b and d). In a and b, cells were fixed and immunostainedwith antitubulin mAb, followed by a rhodamine-coupled anti–mouse secondary mAb. In c and d, cells were stimulated with PVand monitored by time-lapse imaging. Time points 15 min afterstimulation are shown. Bars, 15 mm.
The Journal of Cell Biology, Volume 143, 1998 620
tobleaching of a region of the cell, it was obvious that thediffusional mobility of ZAP-70 had been altered (Fig. 5C). Specifically, surface-localized ZAP-70 was less mobileand no longer able to exchange with the intracytoplasmicpool. A strong fluorescent signal was still apparent at theend of the bleaching sequence (z300 s). There are twopossible explanations for this. Either all of the cytosolicZAP-70 redistributes to the cell periphery, or some re-mains in the cytosol but converts to a less mobile pheno-type, perhaps because of an activation-induced interactionwith cytoskeletal proteins. The first hypothesis is the morelikely since the conversion to the less mobile state only oc-curs after stimulation of TTz-expressing cells, which isconsistent with a molecular interaction between these twomolecules (data not shown). Regardless, activation-depen-dent redistribution of ZAP-70 to the cell surface is accom-panied by a decrease in its mobility.
Membrane-associated ZAP-70 Is More Mobilethan TCRz
Biochemical studies have indicated that cell surface–locatedZAP-70 is physically bound to TCRz, via the tandem SH2
domains of ZAP-70 and the phospho-ITAMs of TCRz(Figs. 2 and 3) (Isakov et al., 1995; Bu et al., 1995). Oneprediction from these data would be that peripherally lo-cated ZAP-70 would acquire the same diffusion mobilityas TCRz. We therefore compared the diffusion mobility ofthe translocated ZAP-70 to that of the z chimera, Tzz. ATzz–GFP fusion protein was constructed and expressed inHeLa cells and was expressed exclusively on the cell mem-brane, as expected for an integral membrane protein (Fig.6 C). H/TTz cells expressing ZAP-70 GFP alone or to-gether with Lck F505 and HeLa cells expressing Tzz–GFPwere then stimulated with PV for 12 min, and FLIP wasperformed to compare the mobilities of the two proteins atthe cell surface (Fig. 6). As before, peripheral ZAP-70 wasrelatively stable, showing a similar phenotype whether LckF505 was coexpressed or not. However, when repetitivephotobleaching inside the rectangular box was continued,complete loss of ZAP-70 GFP fluorescence outside thebox occurred between 750 and 870 s (Fig. 6, A and B). Incontrast, fluorescence of Tzz–GFP remained prominentlyvisible on the cell membrane after repetitive photobleach-ing for 30 min (Fig. 6 C, and data not shown). The mobilityof Tzz–GFP was not affected by PV stimulation since it
Figure 5. ZAP-70 becomes less mobile when it moves to the cell surface. H/TTz cells expressing ZAP-70 GFP alone (A) or togetherwith Lck F505 (B and C) were left unstimulated (A and B) or were stimulated with PV for 12 min before commencement of FLIP (C).FLIP was then carried out as described in Materials and Methods, with the boxed rectangle indicating the area being repetitivelybleached. Images collected before bleaching and after 2, 5, and 10 bleaches are shown. Bars, 15 mm.
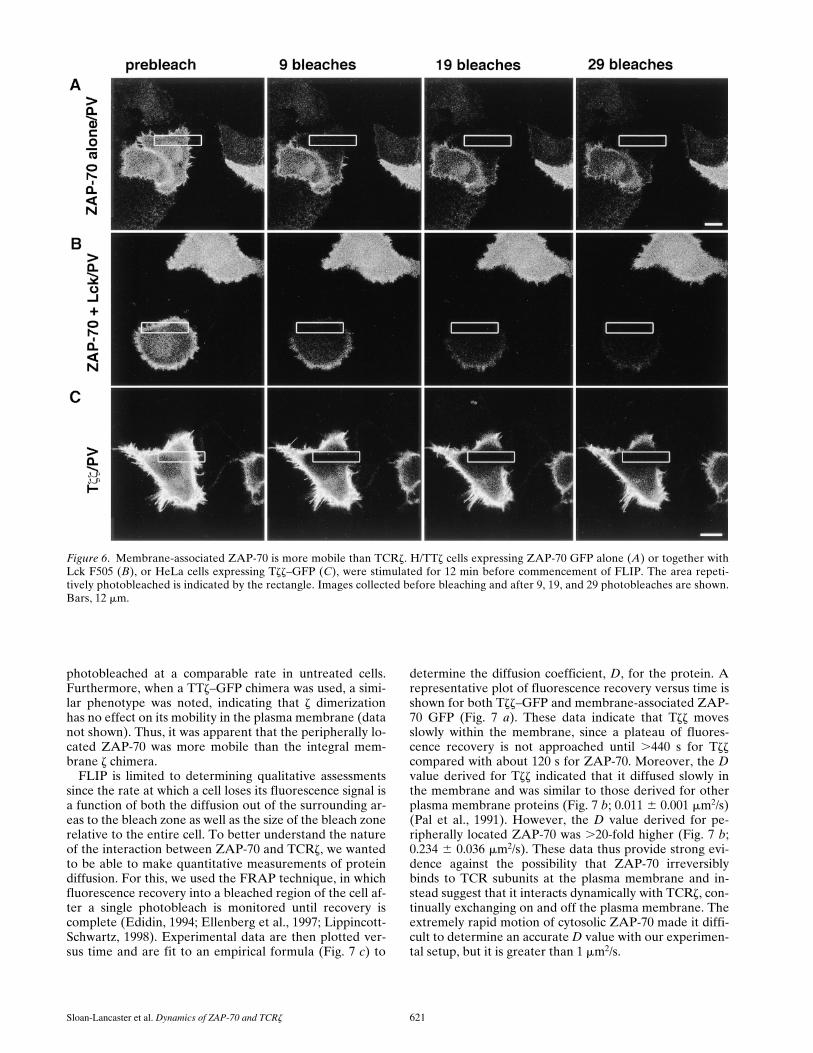
Sloan-Lancaster et al. Dynamics of ZAP-70 and TCRz 621
photobleached at a comparable rate in untreated cells.Furthermore, when a TTz–GFP chimera was used, a simi-lar phenotype was noted, indicating that z dimerizationhas no effect on its mobility in the plasma membrane (datanot shown). Thus, it was apparent that the peripherally lo-cated ZAP-70 was more mobile than the integral mem-brane z chimera.
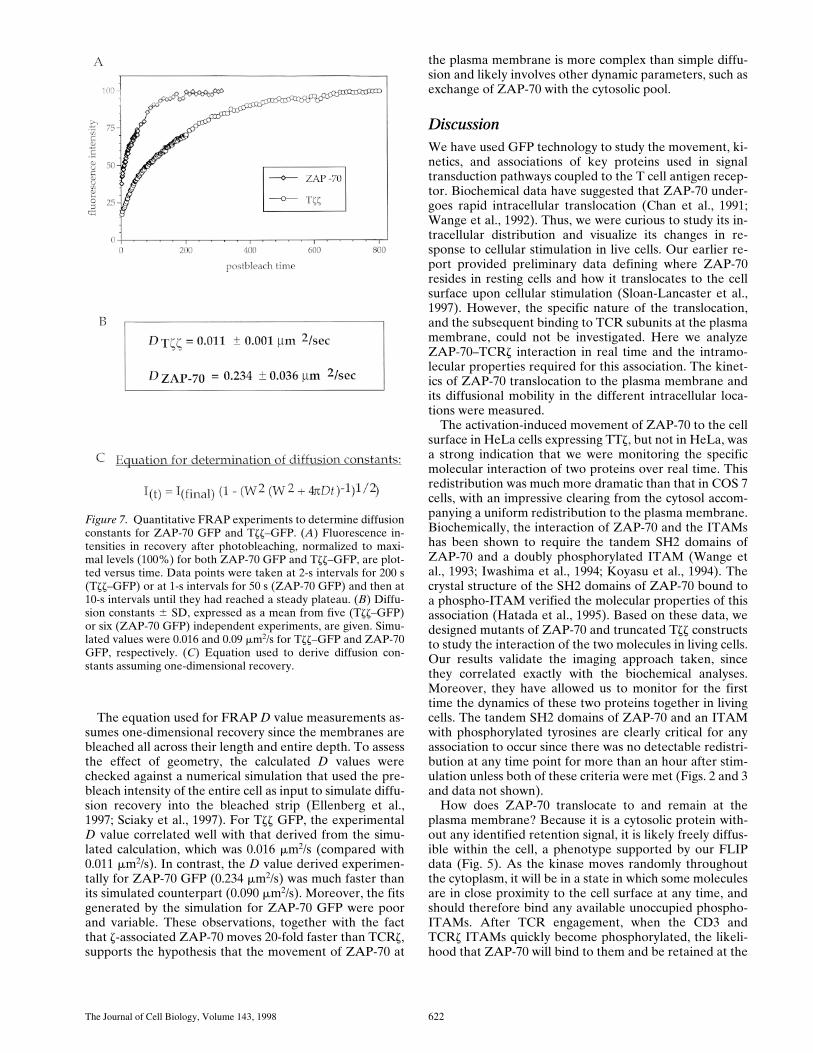
FLIP is limited to determining qualitative assessmentssince the rate at which a cell loses its fluorescence signal isa function of both the diffusion out of the surrounding ar-eas to the bleach zone as well as the size of the bleach zonerelative to the entire cell. To better understand the natureof the interaction between ZAP-70 and TCRz, we wantedto be able to make quantitative measurements of proteindiffusion. For this, we used the FRAP technique, in whichfluorescence recovery into a bleached region of the cell af-ter a single photobleach is monitored until recovery iscomplete (Edidin, 1994; Ellenberg et al., 1997; Lippincott-Schwartz, 1998). Experimental data are then plotted ver-sus time and are fit to an empirical formula (Fig. 7 c) to
determine the diffusion coefficient, D, for the protein. Arepresentative plot of fluorescence recovery versus time isshown for both Tzz–GFP and membrane-associated ZAP-70 GFP (Fig. 7 a). These data indicate that Tzz movesslowly within the membrane, since a plateau of fluores-cence recovery is not approached until .440 s for Tzzcompared with about 120 s for ZAP-70. Moreover, the Dvalue derived for Tzz indicated that it diffused slowly inthe membrane and was similar to those derived for otherplasma membrane proteins (Fig. 7 b; 0.011 6 0.001 mm2/s)(Pal et al., 1991). However, the D value derived for pe-ripherally located ZAP-70 was .20-fold higher (Fig. 7 b;0.234 6 0.036 mm2/s). These data thus provide strong evi-dence against the possibility that ZAP-70 irreversiblybinds to TCR subunits at the plasma membrane and in-stead suggest that it interacts dynamically with TCRz, con-tinually exchanging on and off the plasma membrane. Theextremely rapid motion of cytosolic ZAP-70 made it diffi-cult to determine an accurate D value with our experimen-tal setup, but it is greater than 1 mm2/s.
Figure 6. Membrane-associated ZAP-70 is more mobile than TCRz. H/TTz cells expressing ZAP-70 GFP alone (A) or together withLck F505 (B), or HeLa cells expressing Tzz–GFP (C), were stimulated for 12 min before commencement of FLIP. The area repeti-tively photobleached is indicated by the rectangle. Images collected before bleaching and after 9, 19, and 29 photobleaches are shown.Bars, 12 mm.
The Journal of Cell Biology, Volume 143, 1998 622
The equation used for FRAP D value measurements as-sumes one-dimensional recovery since the membranes arebleached all across their length and entire depth. To assessthe effect of geometry, the calculated D values werechecked against a numerical simulation that used the pre-bleach intensity of the entire cell as input to simulate diffu-sion recovery into the bleached strip (Ellenberg et al.,1997; Sciaky et al., 1997). For Tzz GFP, the experimentalD value correlated well with that derived from the simu-lated calculation, which was 0.016 mm2/s (compared with0.011 mm2/s). In contrast, the D value derived experimen-tally for ZAP-70 GFP (0.234 mm2/s) was much faster thanits simulated counterpart (0.090 mm2/s). Moreover, the fitsgenerated by the simulation for ZAP-70 GFP were poorand variable. These observations, together with the factthat z-associated ZAP-70 moves 20-fold faster than TCRz,supports the hypothesis that the movement of ZAP-70 at
the plasma membrane is more complex than simple diffu-sion and likely involves other dynamic parameters, such asexchange of ZAP-70 with the cytosolic pool.
DiscussionWe have used GFP technology to study the movement, ki-netics, and associations of key proteins used in signaltransduction pathways coupled to the T cell antigen recep-tor. Biochemical data have suggested that ZAP-70 under-goes rapid intracellular translocation (Chan et al., 1991;Wange et al., 1992). Thus, we were curious to study its in-tracellular distribution and visualize its changes in re-sponse to cellular stimulation in live cells. Our earlier re-port provided preliminary data defining where ZAP-70resides in resting cells and how it translocates to the cellsurface upon cellular stimulation (Sloan-Lancaster et al.,1997). However, the specific nature of the translocation,and the subsequent binding to TCR subunits at the plasmamembrane, could not be investigated. Here we analyzeZAP-70–TCRz interaction in real time and the intramo-lecular properties required for this association. The kinet-ics of ZAP-70 translocation to the plasma membrane andits diffusional mobility in the different intracellular loca-tions were measured.
The activation-induced movement of ZAP-70 to the cellsurface in HeLa cells expressing TTz, but not in HeLa, wasa strong indication that we were monitoring the specificmolecular interaction of two proteins over real time. Thisredistribution was much more dramatic than that in COS 7cells, with an impressive clearing from the cytosol accom-panying a uniform redistribution to the plasma membrane.Biochemically, the interaction of ZAP-70 and the ITAMshas been shown to require the tandem SH2 domains ofZAP-70 and a doubly phosphorylated ITAM (Wange etal., 1993; Iwashima et al., 1994; Koyasu et al., 1994). Thecrystal structure of the SH2 domains of ZAP-70 bound toa phospho-ITAM verified the molecular properties of thisassociation (Hatada et al., 1995). Based on these data, wedesigned mutants of ZAP-70 and truncated Tzz constructsto study the interaction of the two molecules in living cells.Our results validate the imaging approach taken, sincethey correlated exactly with the biochemical analyses.Moreover, they have allowed us to monitor for the firsttime the dynamics of these two proteins together in livingcells. The tandem SH2 domains of ZAP-70 and an ITAMwith phosphorylated tyrosines are clearly critical for anyassociation to occur since there was no detectable redistri-bution at any time point for more than an hour after stim-ulation unless both of these criteria were met (Figs. 2 and 3and data not shown).
How does ZAP-70 translocate to and remain at theplasma membrane? Because it is a cytosolic protein with-out any identified retention signal, it is likely freely diffus-ible within the cell, a phenotype supported by our FLIPdata (Fig. 5). As the kinase moves randomly throughoutthe cytoplasm, it will be in a state in which some moleculesare in close proximity to the cell surface at any time, andshould therefore bind any available unoccupied phospho-ITAMs. After TCR engagement, when the CD3 andTCRz ITAMs quickly become phosphorylated, the likeli-hood that ZAP-70 will bind to them and be retained at the
Figure 7. Quantitative FRAP experiments to determine diffusionconstants for ZAP-70 GFP and Tzz–GFP. (A) Fluorescence in-tensities in recovery after photobleaching, normalized to maxi-mal levels (100%) for both ZAP-70 GFP and Tzz–GFP, are plot-ted versus time. Data points were taken at 2-s intervals for 200 s(Tzz–GFP) or at 1-s intervals for 50 s (ZAP-70 GFP) and then at10-s intervals until they had reached a steady plateau. (B) Diffu-sion constants 6 SD, expressed as a mean from five (Tzz–GFP)or six (ZAP-70 GFP) independent experiments, are given. Simu-lated values were 0.016 and 0.09 mm2/s for Tzz–GFP and ZAP-70GFP, respectively. (C) Equation used to derive diffusion con-stants assuming one-dimensional recovery.
Sloan-Lancaster et al. Dynamics of ZAP-70 and TCRz 623
membrane increases tremendously. This should result inan accumulation of ZAP-70 at the cell surface and a recip-rocal decrease in its cytosolic concentration, as seen in ourtime-lapse imaging studies (Fig. 1). Thus, the phosphoryla-tion of the TCR ITAMs seems to be the only triggeringevent for ZAP-70 redistribution. Our data using mutantZAP-70 GFPs indicate that the domains required for itsredistribution and membrane retention parallel those re-quired to bind TTz (Fig. 2). Moreover, the enhancementof ZAP-70 redistribution accompanied by coexpression ofLck F505 indicates that simply increasing the level ofITAM phosphorylation results in more ZAP-70 at theplasma membrane (Fig. 1). Finally, neither the organizedmicrotubular network nor the actin microfilaments are re-quired for successful movement of ZAP-70 to the cell sur-face (Fig. 4).
The data reported by Huby et al. (1998) indicated thatnocodazole treatment of T cells can prevent ZAP-70 acti-vation, independently of the location of ZAP-70 at the cellsurface. Moreover, in that study ZAP-70 appeared to be ina membrane proximal region in resting T cells, before cel-lular activation. The differences between this study andour data might reflect the presence of additional proteinsin T cells that engage ZAP-70 and affect its dynamics andactivation. Our studies in HeLa cells represent an early ef-fort in studying these molecules in real time. The dynamicproperties of ZAP-70 must now be analyzed with thesemethods in T cells.
The kinetics by which ZAP-70 relocated to the HeLacell surface were much slower than would be predictedfrom the biochemical analyses in T cells, which indicatethat ZAP-70 binds TCRz within seconds of TCR cross-linking (Chan et al., 1991; Wange et al., 1992). Surpris-ingly, there was a significant delay between cellular activa-tion and any detectable, redistributed ZAP-70 (Fig. 1).Perhaps the rate-limiting step is the tyrosine phosphoryla-tion of proteins within the cells due to time required forPV, when delivered in the media, to be incorporated intothe cells. Moreover, the live cell experiments were con-ducted at room temperature, and we anticipate that in-creasing the temperature to 378C would also result in afaster translocation initiation time. Of course, the systememployed here using HeLa cells and recombinant proteinsis a simplification of the complexity of early T cell signal-ing events, in which multiple protein–protein interactionsparticipate to initiate signal transduction. In the T cell en-vironment, such interactions might affect the mobility ofboth ZAP-70 and TCRz. However, in the HeLa system,once ZAP-70 began to translocate to the cell surface itquickly reached a steady state, without evidence of any re-accumulation in the cytosol even as long as several hoursafter PV addition (data not shown). Whether it moves backafter the pharmacological or physiological stimulus ceasesor is degraded at the plasma membrane is not known.
The data derived using the photobleaching techniquesallowed us not only to qualitatively compare the move-ment of different pools of ZAP-70 with itself and with chi-meric z, but also to calculate diffusion constants for thesemolecules. While a role for nuclear ZAP-70 has still notbeen defined, it clearly is not rapidly interchangeable withthe cytosolic pool (Fig. 5 A). Both nuclear and cytosolicZAP-70 are extremely mobile, so we could not determine
a lower limit for their diffusion constants. This suggeststhat the protein is not associated with any anchoring mole-cules in these compartments. However, membrane-associ-ated ZAP-70 in stimulated cells has dramatically differentcharacteristics in that it is much less mobile. Clearly, mem-brane-associated ZAP-70 moves slowly relative to the cy-tosolic pool of unstimulated cells and is likely part of alarge multiprotein lattice under the cell surface, containingmany of the downstream molecules involved in intracellu-lar signaling.
The peripherally located ZAP-70 had a faster diffusionrate than the chimeric z molecule. This was confirmedwhen the diffusion constants were determined, indicatingthat ZAP-70 moved z20-fold faster than z (Fig. 7). Thisindicated that the binding between z and ZAP-70 is morecomplex than an irreversible and stationary interaction.The simulation data also confirmed that the movement ofZAP-70 at or near the membrane is not explained by a singlediffusion constant. Instead, it seems that the SH2–phos-photyrosine interaction is dynamic, with specific on- andoff-rates. Indeed, this dynamic relationship could explainhow an immune response is regulated at the cellular level.Once initiated, T cell activation must eventually be turnedoff as antigen is cleared from the system. ITAM phos-phorylation is a key initiating event of intracellular T cellactivation, but dephosphorylation of these domains is crit-ical for the disassembly of the activating lattice under themembrane. In fact, a proposed role of ZAP-70 is that itprotects the phosphates of the TCR ITAMs by binding viaits SH2 domains, thus maintaining the receptor in an “on”state (Iwashima et al., 1994). Only if ZAP-70 has a dy-namic relationship with TCRz will the phospho-ITAMs beexposed to phosphatases, which will then have an opportu-nity to dephosphorylate the tyrosine residues. As a result,the now dephosphorylated ITAMs will no longer be suit-able targets for ZAP-70, which may eventually recycle tothe cytosol or be degraded over time. As fewer activeZAP-70 molecules remain at the cell surface, all subse-quent signaling events in the cell will also sequentially beturned off, until the cell returns to its quiescent state.
The ability to study intracellular signal transduction inreal time now provides one with the tools to begin to an-swer many unaddressed questions. With the availability ofseveral GFP variants that excite and emit at differentwavelengths (Heim et al., 1994; Heim and Tsien, 1996;Ormo et al., 1996), the movements of several proteinshave been successfully monitored simultaneously by time-lapse imaging (Rizzuto et al., 1995; Ellenberg et al., 1998).Moreover, the relationship of protein location and secondmessenger stimulation has also been studied (Miyawakiet al., 1997; Oancea et al., 1998; Stauffer et al., 1998). Flu-orescence resonance energy transfer to assess protein–protein interactions will provide detailed information re-garding how intracellular networks are established andmaintained (Miyawaki et al., 1997; Romoser et al., 1997;Tsien and Miyawaki, 1998). As these techniques are refinedand applied, more studies on how intracellular complexesform in many signaling systems should be performed.
J. Sloan-Lancaster is a fellow of the Damon Runyon-Walter WinchellCancer Research Fund. T. Yamazaki is a fellow of the Japan Society forthe Promotion of Science.
The Journal of Cell Biology, Volume 143, 1998 624
Received for publication 16 July 1998 and in revised form 11 September1998.
References
Arpaia, E., M. Shahar, H. Dadi, A. Cohen, and C.M. Roifman. 1994. DefectiveT cell receptor signaling and CD81 thymocyte selection in humans lackingZAP-70 kinase. Cell. 76:947–958.
Babbitt, B.P., P.M. Allen, G. Matsueda, E. Haber, and E.R. Unanue. 1985.Binding of immunogenic peptides to Ia histocompatibility molecules. Na-ture. 317:359–361.
Bentley, G.A., and R.A. Mariuzza. 1996. The structure of the T cell antigen re-ceptor. Annu. Rev. Immunol. 14:563–590.
Bu, J.-Y., A.S. Shaw, and A.C. Chan. 1995. Analysis of the interaction of ZAP-70 and syk protein-tyrosine kinases with the T-cell antigen receptor by plas-mon resonance. Proc. Natl. Acad. Sci. USA. 92:5106–5110.
Cantrell, D. 1996. T cell antigen receptor signal transduction pathways. Annu.Rev. Immunol. 14:259–274.
Chan, A.C., B. Irving, J.D. Fraser, and A. Weiss. 1991. TCRz chain associateswith a tyrosine kinase and upon TCR stimulation associates with ZAP-70, a70K Mr tyrosine phosphoprotein. Proc. Natl. Acad. Sci. USA. 88:9166–9170.
Chan, A.C., M. Iwashima, C.W. Turck, and A. Weiss. 1992. ZAP-70: a 70 kdprotein-tyrosine kinase that associates with the TCRz chain. Cell. 71:649–662.
Chan, A.C., T.A. Kadlecek, M.E. Elder, A.H. Filipovich, W.-L. Kuo, M. Iwa-shima, T.G. Parslow, and A. Weiss. 1994. ZAP-70 deficiency in an autosomal re-cessive form of severe combined immunodeficiency. Science. 264:1599–1601.
Cole, N.B., C.L. Smith, N. Sciaky, M. Terasaki, M. Edidin, and J. Lippincott-Schwartz. 1996. Diffusional mobility of Golgi proteins in membranes of liv-ing cells. Science. 273:797–801.
Edidin, M. 1994. Fluorescence photobleaching and recovery, FPR, in the analy-sis of membrane structure and dynamics. In Mobility and Proximity in Bio-logical Membranes. S. Damjanocich, M. Edidin, and J. Szollosi, editors.CRC Press, Inc., Boca Raton, FL. 109–135.
Elder, M.E., D. Lin, J. Clever, A.C. Chan, T.J. Hope, A. Weiss, and T.G.Parslow. 1994. Human severe combined immunodeficiency due to a defect inZAP-70, a T cell tyrosine kinase. Science. 264:1596–1599.
Ellenberg, J., E.D. Siggia, J.E. Moreira, C.L. Smith, J.F. Presley, H.J. Worman,and J. Lippincott-Schwartz. 1997. Nuclear membrane dynamics and reas-sembly in living cells: targeting of an inner nuclear membrane protein in in-terphase and mitosis. J. Cell Biol. 138:1193–1206.
Ellenberg, J., J. Lippincott-Schwartz, and J.F. Presley. 1998. Two color greenfluorescent protein time-lapse imaging. Biotechniques. In press.
Garcia, K.C., M. Degano, R.L. Stanfield, A. Brunmark, M.R. Jackson, P.A.Peterson, L. Teyton, and I.A. Wilson. 1996. An ab T cell receptor structureat 2.5 Å and its orientation in the TCR-MHC complex. Science. 274:209–219.
Hatada, M.H., X. Lu, E.R. Laird, J. Green, J.P. Morgenstern, M. Lou, C.S.Marr, T.B. Phillips, M.K. Ram, K. Theriault, M.J. Zoller, and J.L. Karas.1995. Molecular basis for interaction of the protein tyrosine kinase ZAP-70with the T-cell receptor. Nature. 377:32–38.
Heim, R., and R.Y. Tsien. 1996. Engineering green fluorescent protein for im-proved brightness, longer wavelengths and fluorescence resonance energytransfer. Curr. Biol. 6:178–182.
Heim, R., D.C. Prasher, and R.Y. Tsein. 1994. Wavelength mutations and post-translational autoxidation of green fluorescent protein. Proc. Natl. Acad. Sci.USA. 91:12501–12504.
Huby, R.D., A. Weiss, and S.C. Ley. 1998. Nocodazole inhibits signal transduc-tion by the T cell antigen receptor. J Biol. Chem. 273:12024–12031.
Isakov, N., R.L. Wange, W.H. Burgess, J.D. Watts, R. Aebersold, and L.E.Samelson. 1995. ZAP-70 binding specificity to T cell receptor tyrosine-basedactivation motifs: the tandem SH2 domains of ZAP-70 bind distinct tyrosine-based activation motifs with varying affinity. J. Exp. Med. 181:375–380.
Iwashima, M., B.A. Irving, N.S.C. van Oers, A.C. Chan, and A. Weiss. 1994. Se-quential interactions of the TCR with two distinct cytoplasmic tyrosine ki-nases. Science. 263:1136–1139.
Jorgensen, J.L., P.A. Reay, E.W. Ehrich, and M.M. Davis. 1992. Molecularcomponents of T-cell recognition. Annu. Rev. Immunol. 10:835–873.
Kong, G., M. Dalton, J.B. Wardenburg, D. Straus, T. Kurosaki, and A.C. Chan.1996. Distinct tyrosine phosphorylation sites within ZAP-70 mediate activa-tion and negative regulation of antigen receptor function. Mol. Cell. Biol. 16:5026–5035.
Koyasu, S., A.G.D. Tse, P. Moingeon, R.E. Hussey, A. Mildonian, J. Hannisian,L.K. Clayton, and E.L. Reinherz. 1994. Delineation of a T-cell activationmotif required for binding of protein tyrosine kinases containing tandemSH2 domains. Proc. Natl. Acad. Sci. USA. 91:6693–6697.
Letourneur, F., and R.D. Klausner. 1991. T-cell and basophil activation throughthe cytoplasmic tail of T-cell-receptor zeta family proteins. Proc. Natl. Acad.Sci. USA. 88:8905–8909.
Lippincott-Schwartz, J., J. Presley, K. Zaal, K. Hirschberg, C, Miller, and J. El-lenberg. 1998. Monitoring the dynamics and mobility of membrane proteinstagged with green fluorescent protein. In GFP Biofluorescence: ImagingGene Expression and Protein Dynamics in Living Cells. K. Sullivan and S.Kay, editors. Academic Press, New York. In press.
Miyawaki, A., J. Llopis, R. Heim, J.M. McCaffrey, J.A. Adams, M. Ikura, andR.Y. Tsien. 1997. Fluorescent indicators for Ca21 based on green fluorescent
proteins and calmodulin. Nature. 388:882–887.Negishi, I., N. Motoyama, K.-i. Nakayama, K. Nakayama, S. Senju, S.
Hatakeyama, Q. Zheng, A.C. Chan, and D.Y. Loh. 1995. Essential role forZAP-70 in both positive and negative selection of thymocytes. Nature. 376:435–438.
O’Shea, J.J., D.W. McVicar, T.L. Bailey, C. Burns, and M.J. Smyth. 1992. Acti-vation of human peripheral blood T lymphocytes by pharmacological induc-tion of protein-tyrosine phosphorylation. Proc. Natl. Acad. Sci. USA. 89:10306–10310.
Oancea, E., M.N. Teruel, A.F.G. Quest, and T. Meyer. 1998. Green fluorescentprotein (GFP)-tagged cysteine-rich domains from protein kinase C as fluo-rescent indicators for diacylglycerol signaling in living cells. J. Cell Biol. 140:485–498.
Ormo, M., A.B. Cubitt, K. Kallio, L.A. Gross, R.Y. Tsien, and S.J. Remington.1996. Crystal structure of the Aequorea victoria green fluorescent protein.Science. 273:1392–1395.
Pal, R., B.C. Nair, G.M. Hoke, M.G. Sarngadharan, and M. Edidin. 1991. Lat-eral diffusion of CD4 on the surface of a human neoplastic T-cell line probedwith a fluorescent derivative of the envelope glycoprotein (gp120) of humanimmunodeficiency virus type 1 (HIV-1). J. Cell Physiol. 147:326–332.
Qian, D., and A. Weiss. 1997. T cell antigen receptor signal transduction. Curr.Opin. Cell Biol. 9:205–212.
Qian, D., M.N. Mollenauer, and A. Weiss. 1996. Dominant-negative z associatedprotein 70 inhibits T cell antigen receptor signaling. J. Exp. Med. 183:611–620.
Reth, M. 1989. Antigen receptor tail clue. Nature. 338:383–384.Rizzuto, R., M. Brini, P. Pizzo, M. Murgia, and T. Pozzan. 1995. Chimeric green
fluorescent protein as a tool for visualizing subcellular organelles in livingcells. Curr. Biol. 5:635–642.
Romoser, V.A., P.M. Hinkle, and A. Persechini. 1997. Detection in living cellsof Ca21-dependent changes in the fluorescence emission of an indicatorcomposed of two green fluorescent protein variants linked by a calmodulin-binding sequence. J. Biol. Chem. 272:13270–13274.
Samelson, L.E., and R.D. Klausner. 1992. Tyrosine kinases and tyrosine-basedactivation motifs. J. Biol. Chem. 267:24913–24916.
Sciaky, N., J. Presley, C. Smith, K.J. Zaal, N. Cole, J.E. Moreira, M. Terasaki,E. Siggia, and J. Lippincott-Schwartz. 1997. Golgi tubule traffic and the ef-fects if brefeldin A visualized in living cells. J. Cell Biol. 139:1137–1155.
Secrist, J.P., L.A. Burns, L. Karnitz, G.A. Koretzky, and R.T. Abraham. 1993.Stimulatory effects of the protein tyrosine phosphatase inhibitor, pervana-date, on T-cell activation events. J. Biol. Chem. 268:5886–5893.
Sloan-Lancaster, J., and L.E. Samelson. 1998. Proximal events in T cell activa-tion. In Signal Transduction and Cell Cycle Inhibitors. J.S. Gutkind, editor.Humana Press, Totowa, NJ. In press.
Sloan-Lancaster, J., W. Zhang, J. Presley, B.L. Williams, R.T. Abraham, J. Lip-pincott-Schwartz, and L.E. Samelson. 1997. Regulation of ZAP-70 intracel-lular localization: visualization with the green fluorescent protein. J. Exp.Med. 186:1713–1724.
Stauffer, T.P., S. Ahn, and T. Meyer. 1998. Receptor-induced transient reduc-tion in plasma membrane PtdIns(4,5)P2 concentration monitored in livingcells. Curr. Biol. 8:343–346.
Townsend, A.R.M., J. Rothbard, F.M. Gotch, G. Bahadur, D. Wraith, and A.J.McMichael. 1986. The epitopes of influenza nucleoprotein recognized by cy-totoxic T clymphocytes can be defined with short synthetic peptides. Cell. 44:959–968.
Tsien, R.Y., and A. Miyawaki. 1998. Seeing the machinery of live cells. Science.280:1954–1955.
van Oers, N.S., N. Killeen, and A. Weiss. 1996. Lck regulates the tyrosine phos-phorylation of the T cell receptor subunits and ZAP-70 in murine thy-mocytes. J. Exp. Med. 183:1053–1062.
Wange, R.L., and L.E. Samelson. 1996. Complex complexes: signaling at theTCR. Immunity. 5:197–205.
Wange, R.L., A.-N. Kong, and L.E. Samelson. 1992. A tyrosine-phosphorylated70-KDa protein binds a photoaffinity analogue of ATP and associates withboth the z chain and CD3 components of the activated T cell antigen recep-tor. J. Biol. Chem. 267:11685–11688.
Wange, R.L., S.N. Malek, S. Desiderio, and L.E. Samelson. 1993. Tandem SH2domains of ZAP-70 bind to T cell antigen receptor z and CD3e from acti-vated jurkat T cells. J. Biol. Chem. 268:19797–19801.
Wange, R.L., R. Guitian, N. Isakov, J.D. Watts, R. Aebersold, and L.E. Samel-son. 1995a. Activating and inhibitory mutations in adjacent tyrosines in thekinase domain of ZAP-70. J. Biol. Chem. 270:18730–18733.
Wange, R.L., N. Isakov, T. Burke, Jr., A. Otaka, P.P. Roller, J.D. Watts, R.Aebersold, and L.E. Samelson. 1995b. F2(Pmp)2-TAMz3, a novel competi-tive inhibitor of the binding of ZAP-70 to the T cell antigen receptor, blocksearly T cell signaling. J. Biol. Chem. 270:944–948.
Weiss, A. 1993. T cell antigen receptor signal transduction: a tale of tails and cy-toplasmic protein-tyrosine kinases. Cell. 73:209–212.
Weiss, A., and D.R. Littman. 1994. Signal transduction by lymphocyte antigenreceptors. Cell. 76:263–274.
Weissman, A.M. 1994. The T-cell antigen receptor: a multisubunit signalingcomplex. Chem. Immunol. 59:1–18.
Williams, B.L., K.L. Schreiber, W. Zhang, R.L. Wange, L.E. Samelson, P.J.Leibson, and R.T. Abraham. 1998. Genetic evidence for differential cou-pling of Syk family kinases to the T-cell receptor: reconstitution studies in aZAP-70-deficient jurkat T-cell line. Mol. Cell. Biol. 18:1388–1399.