Embed Size (px)
Citation preview
Journal of Water Resource and Protection, 2013, 5, 919-929 http://dx.doi.org/10.4236/jwarp.2013.510095 Published Online October 2013 (http://www.scirp.org/journal/jwarp)
Zavkhan River and Its Catchment Area Delineation Using Satellite Image*
Ochir Altansukh, Munkhjargal Munkhdavaa, Bat-Erdene Ariunsanaa, Tsetsgee Solongo The Professor’s Team of Environmental Science, School of Earth Sciences,
National University of Mongolia, Ulaanbaatar, Mongolia Email: [email protected]
Received August 2, 2013; revised September 5, 2013; accepted September 28, 2013
Copyright © 2013 Ochir Altansukh et al. This is an open access article distributed under the Creative Commons Attribution License, which permits unrestricted use, distribution, and reproduction in any medium, provided the original work is properly cited.
ABSTRACT
The purpose of this research is to define initial parameters of Khyargas Lake-Zavkhan River and its catchment area us- ing satellite images. The study has been done by two datasets: 1) Shuttle Radar Topography Mission (SRTM) at a hori- zontal spatial resolution of 90 meters, 2) The Advanced Spaceborne Thermal Emission and Reflection Radiometer (ASTER) at a horizontal spatial resolution of 30 meters, using two different models of ArcHydro and Integrated Land and Water Information System (ILWIS) softwares. Main methods of models, that were used in this research are the De- terministic-8, the steepest slope, the spread, the seek computations and the trace analysis. Moreover, input data of the modeling are digital elevation model (DEM) and lake position, outlet location of the river. DEM based ArcHydro model was run on the both datasets, and ILWIS model was run on SRTM data. Several intermediate results were produced while the models run, and initial parameters of the Zavkhan River, its catchment area have been defined at the end of the model. Moreover, final results of the models were compared with each other and with the result of previous research, and with the reality. The result of this study can be used in baseline and advanced research on the catchment area. Be- sides of that, the result can define a spatial boundary of study on Zavkhan River and its catchment area. Moreover, it would have supported for decision-making on ground and surface water resource, distribution and management. Further research, which will cover the entire territory of Mongolia, has to be done using same methodology. The 332nd decision on “River catchment areas of Mongolia” of the Minister of Nature, Environment and Tourism in 2009 has to renew, if a result of that study would be accepted from vocational organization and experts. Keywords: Khyargas Lake-Zavkhan River; Catchment Area; Initial Parameters of the River; Satellite Image; Modeling
1. Introduction
The Khyargas Lake-Zavkhan River catchment, located in the western region of Mongolia, is one of 29 catchments in Mongolia and 4th biggest catchment of Mongolia [1]. It belongs to the Central Asian Closed Basin. Moreover, there are various scientific researches, such as soil, water, flora, fauna, geomorphology and environmental economy on the catchment area. Most recent studies are “Socio- economic study of Khyargas Lake-Zavkhan River catch- ment” research report was written by Kadirbyek. D in 2013, “Hydrologic situation of Zavkhan River” field study was done by Dorjsuren. D and others in 2013, “In- tegrated water management-National assessment report” book was published by “Strengthening Integrated Water Resources Management in Mongolia” project and the
Ministry of Environment and Green Development of Mongoliain 2012 and many more. Spatial boundary of all these studies has been defined by catchment area of Zavkhan River, which was delineated from the topog- raphic map of Mongolia, scaled 1:1,000,000 and pro- duced in 1980th, using the traditional method.
A traditional method is catchment area delineation from the topographic map, drawing lines by hand to connecting elevation points and contour lines. It is not an easy task precisely to define watershed lines, and related hydrographic and morphometric parameters in plane land areas using topographic map. The manual delineation of drainage networks and catchments from topographic maps has been widely replaced by the automatic extrac- tion from Digital Elevation Model [3].
Figure 1 shows the Zavkhan River and its catchment area that were defined by the traditional method, men- tioned inmajority of research reports and papers. For in-
*The research is supported by World Wildlife Fund in Mongolia (WWF Mongolia) and Asian Research Center.
Copyright © 2013 SciRes. JWARP

O. ALTANSUKH ET AL. 920
Figure 1. Zavkhan River and its catchment area delineation from the topographic map. Source: [2]. stance, main sources that researchers cite are: 1) “Cli- mate and surface water resource atlas of Mongolian Re- public” published in 1985, 2) “Scheme of integrated wa- ter resource management in the catchment area of Se- lenge River” published in 1986, 3) “National atlas of Mongolian Republic” pressed in 1990, 4) “National atlas of Mongolia” pressed in 2009, 5) the 332nd decision on “River catchment areas of Mongolia” by the Minister of Nature, Environment and Tourism in 2009, 6) WWF, River catchments in Mongolia printed 2011, and many more. Shapes of the river and its catchment area, de- scribed in above-mentioned publications are shown in Figure 2.
The catchment area of Zavkhan River was drawn same in aforesaid publications and according to the 332nd deci- sion by the Minister; its area is 120706.9 km2.
The research implementation is important in recent time when a water resource management is recognized a vital issue in the world and national level. Therefore, basic parameters of river and its catchment area have to define by modern method, and the result will be used in research in different scientific field and would have sup- ported for decision-making in the near future. The pur- pose of this research is to define basic parameters of
Khyarg as Lake-Zavkhan River and its catchment area using satellite images.
2. Study Area, Data and Method
2.1. Study Area
The Minister of Nature, Environment and Tourism of Mongolia made a decision #332 in 2009 on river catch- ment areas and according to it, whole territory of Mon- golia was divided into 29 larger river catchments (Figure 3). It is being used to water resource management of Mongolia.
From these, catchment area of Zavkhan River that is located in the western region of Mongolia has been se- lected as a study field for this research.
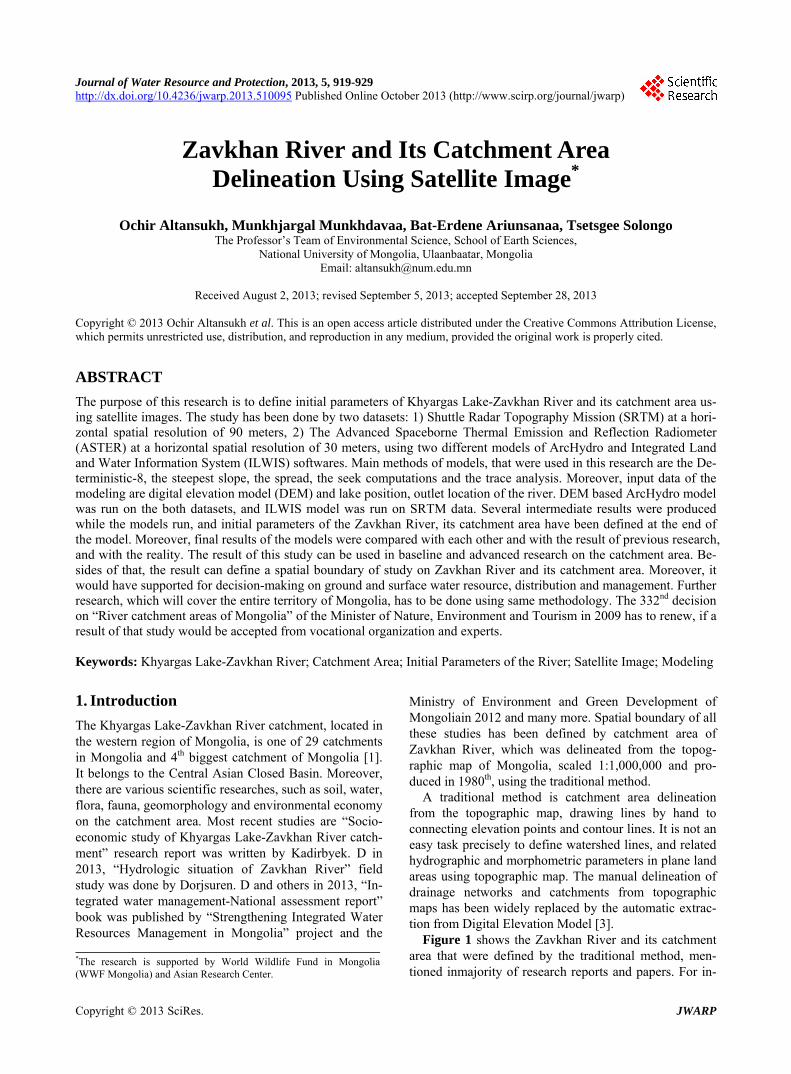
The origins of the Zavkhan River are the Buyant and the Shar Us streams of the Khangai mountain range. Ac- cording to 1:100,000 scaled topographic map of Mongo- lia, total length of the river is approximately 808 km. The drainage density is 0.36 km·km2−1; the length of perma- nent rivers in the catchment is 25203.9 km, and the drainage mean altitude is 1427 m. The Zavkhan River flows from the northeast to southwest and meanders to the northwest (Figure 4). The catchment area is located in The Central Asian Closed Basin [9].
2.2. Dataset
Two datasets: 1) Shuttle Radar Topographic Mission (SRTM)-DEM at a horizontal spatial resolution of 90 meters, 2) ASTER-DEM at a horizontal spatial resolu- tion of 30 metershave been used in this study. Fourth versions of SRTM-DEM datasets, ID 55-03 and 56-03 have been downloaded freely, mosaiced and processed (Figure 5). Columns and rows of the raster data are 12,000:6000, the spatial extent is 90.0, 50.0 decimal de- grees at the top left and 100.0, 45.0 decimal degrees at the bottom right.
Totally, 41 ASTER-DEM datasets, ID N45-50 E90- 100 have been downloaded, mosaiced and processed (Figure 6). Columns and rows of the raster data are 36,000:18,000.
Aforesaid two datasets, SRTM and ASTER, can be downloaded from online database and can be used in scientific research. For that reason, these datasets are widely applied in worldwide.
2.3. Research Method and Methodology
This research has been done by two different models of ArcHydro and ILWIS softwares using aforesaid two datasets. Main methods of the research are the Determi- nistic-8 [12], the steepest slope [13], the spread, the seek computations and the trace analysis [14]. Seek computa- tion will mainly apply for primary data processing. Briefly, we illustrate the principle of the seek computation with a
Copyright © 2013 SciRes. JWARP

O. ALTANSUKH ET AL.
Copyright © 2013 SciRes. JWARP
921
(a) (b)
(c) (d)
(e) (f)
Figure 2. Zavkhan River and its catchment area in the previous publications. Sources: (a) [4]; (b) [5]; (c) [6]; (d) [7]; (e) [1]; (f) [8]. simple elevation data, provided in Figure 7. For each cell in that data, the steepest downward slope to a neighbor cell is computed, and its direction is stored in a new raster data. This computation determines the elevation differ- ence between the cell and a neighbor cell, and takes into account cell distance 1 for neighbor cells in N-S or W-E direction, 2 for cells in NE-SW or NW-SE direction. Among its eight neighbor cells, it picks the one with the steepest path to it. The directions in data, thus obtained, are encoded in integer values, and we have decoded them
for the estimation of flow direction. Cells with a high accumulated flow count represent
areas of concentrated flow, and thus may belong to a stream. Cells with an accumulated flow count of zero are local topographic highs, and can be used to identify ridges [14].
2.3.1. ILWIS Model Using ILWIS model, basic parameters of the Zavkhan
iver and its catchment area have been defined and flow- R
O. ALTANSUKH ET AL. 922
Figure 3. River catchment areas of Mongolia. Source: [1].
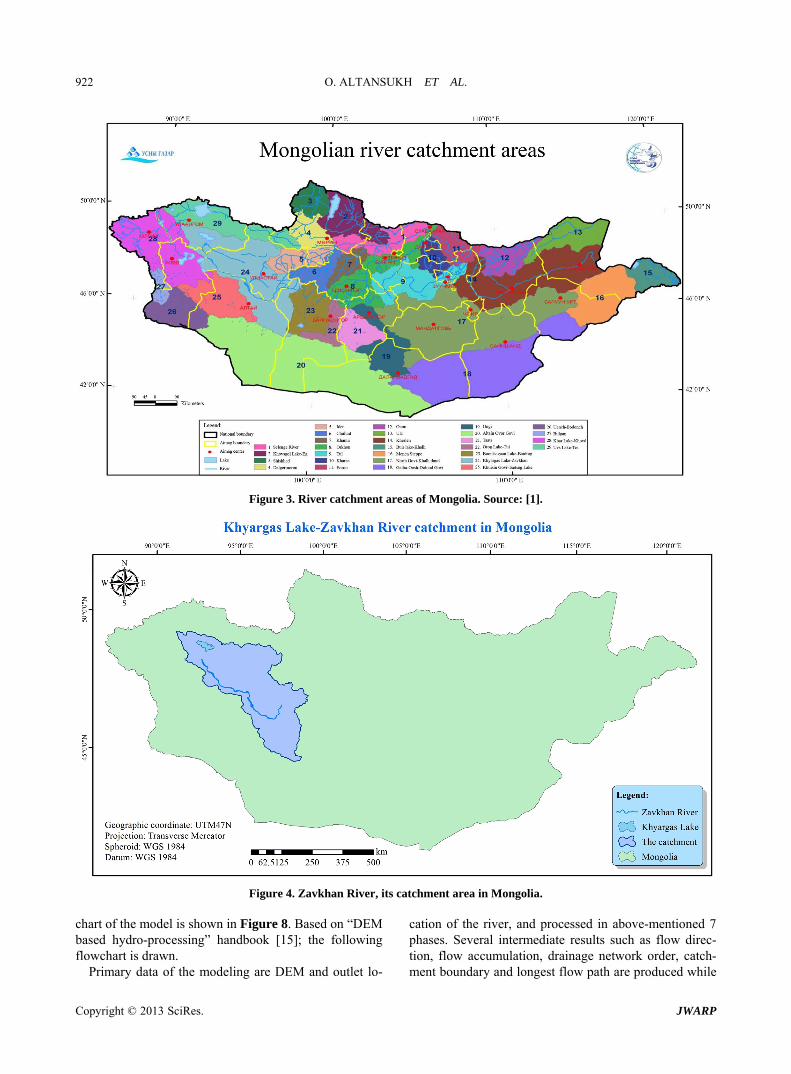
Figure 4. Zavkhan River, its catchment area in Mongolia. chart of the model is shown in Figure 8. Based on “DEM based hydro-processing” handbook [15]; the following flowchart is drawn.
Primary data of the modeling are DEM and outlet lo-
cation of the river, and processed in above-mentioned 7 phases. Several intermediate results such as flow direc- tion, flow accumulation, drainage network order, catch- ment boundary and longest flow path are produced while
Copyright © 2013 SciRes. JWARP

O. ALTANSUKH ET AL. 923
Figure 5. Digital elevation model, SRTM. Data source: [10].
Figure 6. Digital elevation model, ASTER. Data source: [11]. the models run [16].
2.3.2. ArcHydro Model Using ArcHydro model, basic parameters of the Zavk- han River and its catchment area have been defined and flowchart of the model is shown in Figure 9. Based on “ArcHydro tools-Tutorial” handbook [17]; the following flowchart is drawn.
Primary data of the modeling are DEM, lake and outlet location of the river, and processed in above-mentioned 15 phases. Several intermediate results such as flow di- rection, flow accumulation, stream definition, drainage
(a) (b) (c)
Figure 7. Seek computation. (a) The original elevation data; (b) The flow direction data computed from it; (c) The ma- thematical model of catchment gathered from it. line, catchment boundary, watershed point, drainage area centroid and longest flow path are produced while the models run.
3. Results
3.1. Results of ArcHydro Model
DEM based ArcHydro model was run on the both data- sets. A horizontal spatial resolution of the SRTM-DEM is coarser than ASTER-DEM. Depending on data qual- ity; a result can be different than actuality. Fourteen in- termediate results are produced and basic parameters of the Zavkhan River, and its catchment area have been defined at the end. Some of the intermediate results are shown in Figure 10.
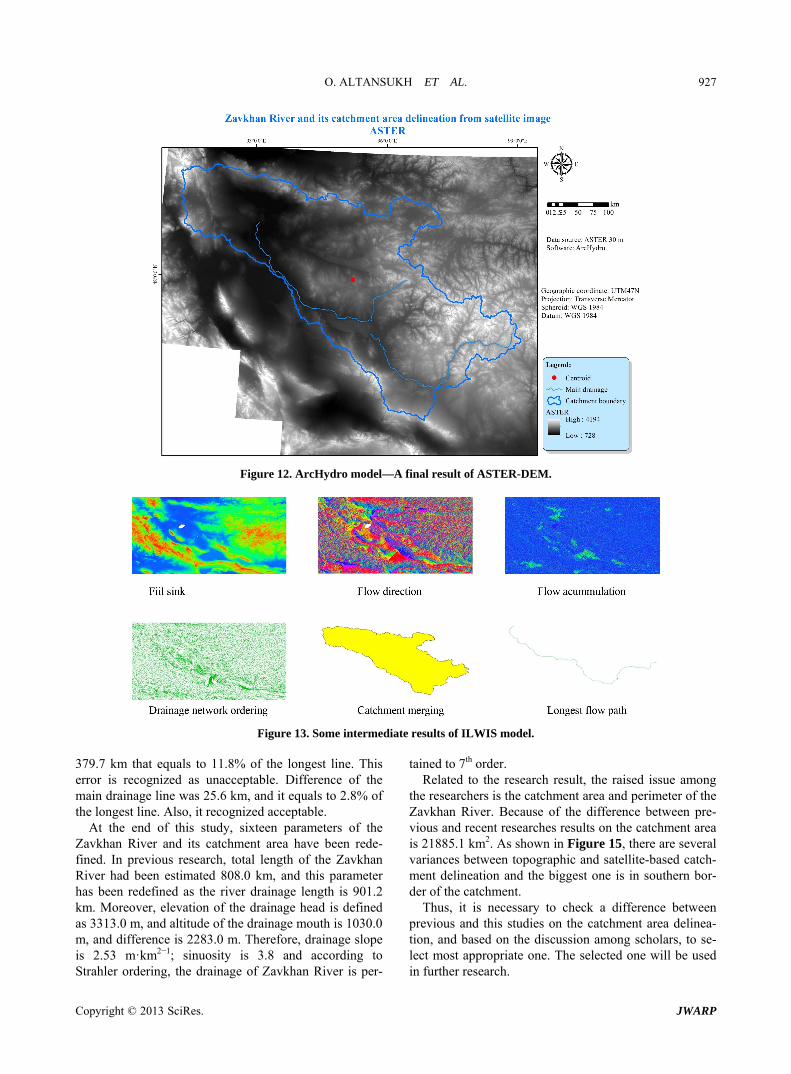
Final results of the model are mapped, and a result of SRTM-DEM data is shown in Figure 11; a result of ASTER-DEM data is shown in Figure 12.
According to the final result of ArcHydro model, which SRTM-DEM was used, the geographic coordinate of the Zavkhan River drainage head is 99˚04'36.0", 47˚28'57.0", location of the drainage mouth is 93˚17'33.0", 48˚52'51.0", length of the drainage is 875.6 km, perime- ter of the catchment area is 3201.3 km, area of the catch- ment is 99040.0 km2, location of the catchment centeris 95˚19'29.8", 48˚07'54.2".
According to the final result of ArcHydro model, which ASTER-DEM was applied, the geographic coor- dinate of the Zavkhan River drainage head is 98˚59'17.0", 48˚28'31.0", location of the drainage mouth is 93˚20'30.9", 48˚52'37.5", length of the drainage is 841.8 km, perime- ter of the catchment area is 3408.4 km, area of the catch- ment is 98821.8 km2, location of the catchment centeris 95˚21'25.9", 48˚08'08.7".
3.2. Results of ILWIS Model
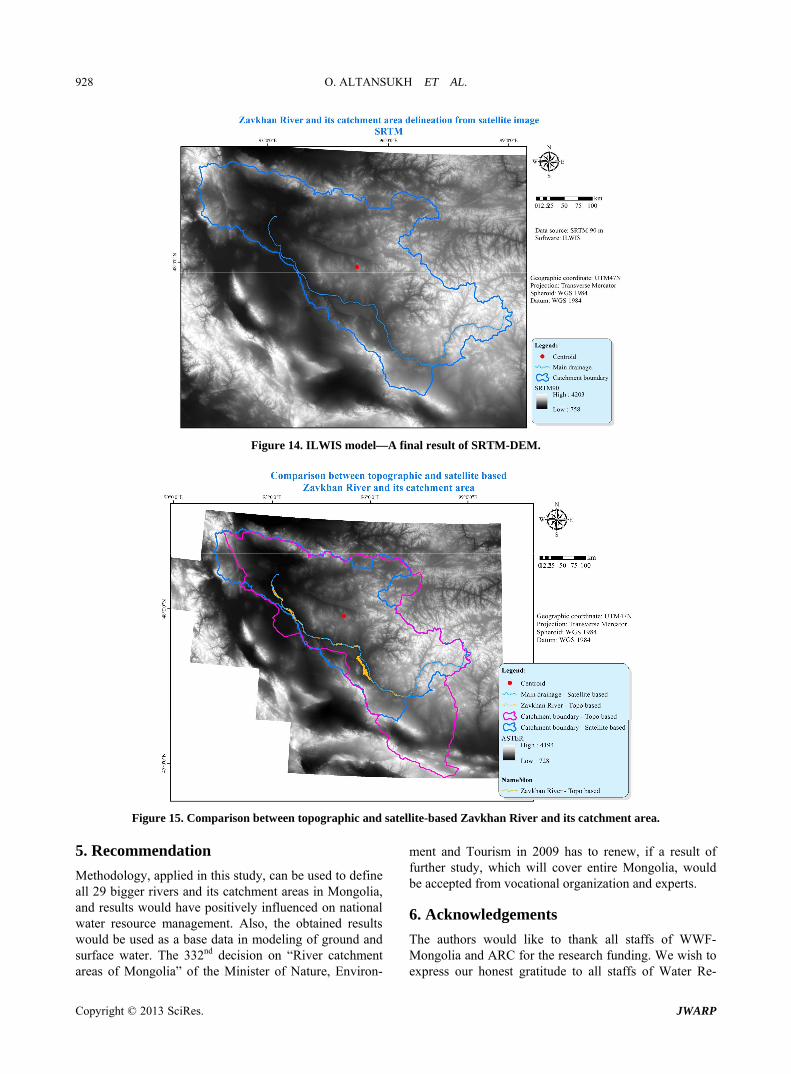
ILWIS model was run on SRTM data. Due to weakness of the software, ASTER data was not run. It occupied 1400 Mb on a computer system. Nine figures and three tabular intermediate results are produced and basic pa- rameters of the Zavkhan River; its catchment area have been defined at the end. Some of the intermediate results are shown in Figure 13.
Copyright © 2013 SciRes. JWARP
O. ALTANSUKH ET AL.
Copyright © 2013 SciRes. JWARP
924
Figure 8. Methodology of ILWIS model.
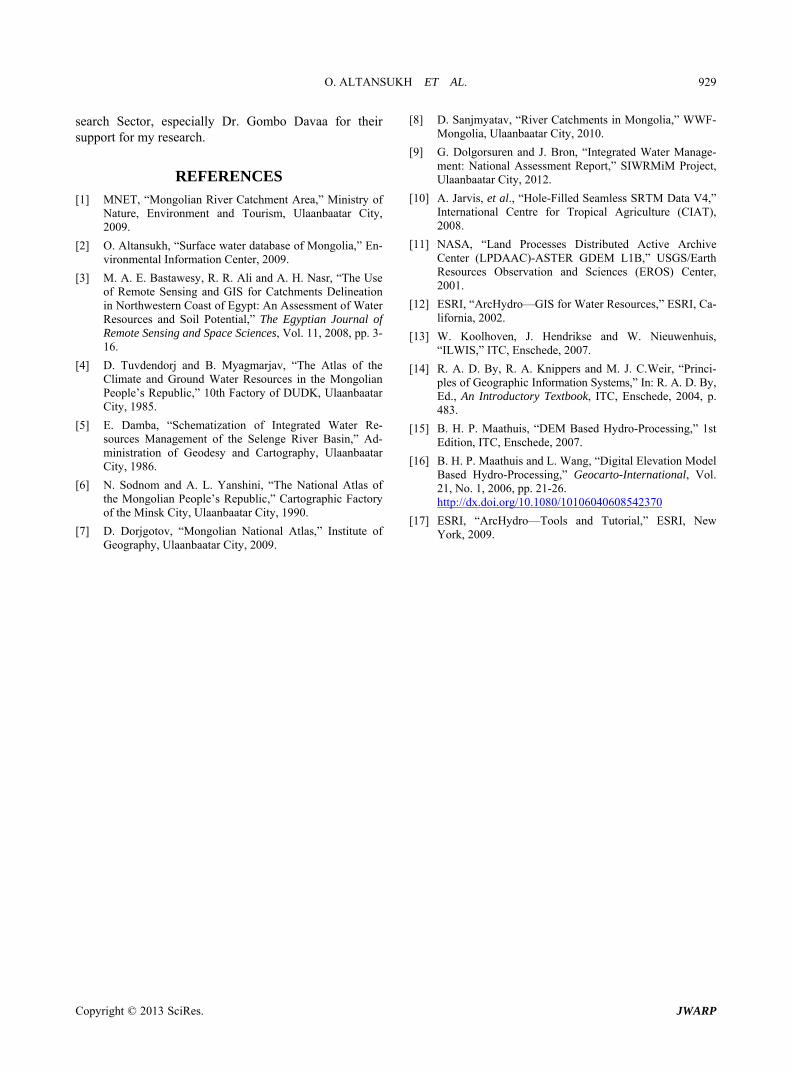
Final results of the model are mapped in Figure14. According to the final result of ILWIS model, which
SRTM-DEM was applied, perimeter of the catchment area is 2821.6 km, area of the catchment is 97868.6 km2, overall length of the drainage is 36267.3 km, drainage density is 0.37 km·km2−1, length of the Zavkhan River drainage is 901.2 km, the geographic coordinate of the drainage head is 47˚28'42.00", 99˚04'51.00", elevation of the drainage head is 3313.0 m, the geographic coordinate of the drainage mouth is 48˚52'31.70", 93˚20'40.28", elevation of the drainage mouth is 1030.0 m, catchment center is 47˚54'0.00", 95˚43'51.00", elevation difference is 2283.0 m, according to Strahler ordering system, the drainage belongs to 7th order, according to Shreve order- ing system, the river’s drainage belongs to 2168th order,
slope drainage is 2.53 m·km2−1 and sinuosity 3.8.
3.3. Comparison between Results and Its Application
Two different datasets are applied in two different mod- els, and the final results were compared with each other and with the results of previous researches. Differences between maximum and minimum values of the obtained results from models were calculated. In Table 1, the sign (-) indicates that parameter cannot be calculated by the model.
The result of this study can be used in baseline and advanced research on the catchment area. Besides of that, the result can define a spatial boundary of study on

O. ALTANSUKH ET AL. 925
Figure 9. Methodology of ArcHydro model.
Zavkhan River and its catchment area. Moreover, it would have support for decision-making on ground and surface water resource, distribution and management.
4. Conclusions and Discussion
The catchment area of the Zavkhan River that is located in the western region of Mongolia has been selected as the study field for this research. The study has been done by two datasets: 1) Shuttle Radar Topography Mission (SRTM) at a horizontal spatial resolution of 90 meters, 2) The Advanced Spaceborne Thermal Emission and Re- flection Radiometer (ASTER) at a horizontal spatial resolution of 30 meters, using two different models of ArcHydro and Integrated Land and Water Information System (ILWIS) softwares. Main methods of models, that were used in this research are the Deterministic-8, the steepest slope, the spread, the seek computations and the trace analysis. Moreover, input data of the modeling were digital elevation model (DEM) and outlet location of the river.
In total, eleven parameters have been defined at the end of the ArcHydro model, and thereof, three parame- ters were belonged to the catchment area, and eight were defined the river drainage spatial characteristics. More- over, sixteen parameters have been defined by ILWIS model, and hereof, five parameters were defined the catchment area, and eleven measurements were defined the river morphology.
There are some differences between the results of the two models. For instance; comparing with two models that were used same data SRTM, the catchment area dif- ference was 1171.4 km2, which equals to 1.2% of the biggest area. Therefore, this difference can be recognized as acceptable. Difference of the catchment perimeter was
Figure 10. Some intermediate results of ArcHydro model.
Copyright © 2013 SciRes. JWARP

O. ALTANSUKH ET AL. 926
Table 1. Research results, and its comparison.
Previous studies ArcHydro model ILWIS modelNo. Parameters
MNET1 WWF2 HydroShed3 SRTM4 ASTER5 SRTM
1 Catchment area, km2 120706.9 108269.0 193130.7 99040.0 98821.8 97868.6
2 Catchment perimeter, km 2279.4 2847.3 4417.1 3201.3 3408.4 2821.6
3 Catchment center 95˚19'29.8" 48˚07'54.2"
95˚21'25.9" 48˚08'08.7"
95˚43'51.00" 47˚54'00.00"
4 Total drainage length, km 36267.3
5 Drainage density, m·km2−1 370.6
6 Length of the main drainage, km 808.0 875,6 841.8 901.2
7 Coordinate of the drainage head 99˚04'36.0" 47˚28'57.0"
98˚59'17.0" 47˚28'31.0"
99˚04'51.00" 47˚28'42.00"
8 Coordinate of the drainage mouth 93˚17'33,0" 48˚52'51.0"
93˚20'30.9" 48˚52'37.5"
93˚20'40.28" 48˚52'31.70"
9 Drainage center 96˚0'13.8" 47˚11'27.0"
96˚03'20.5" 47˚10'34.5"
96˚14'00.00" 46˚55'12.00"
10 Elevation of the drainage head, m 3304 3168 3313
11 Elevation of the drainage mouth, m 1028 1012 1030
12 Elevation difference, m 2276 2156 2283
13 Slope 2.59 2.56 2.53
14 Sinuosity 3.8
15 Strahler order 6* 7
16 Shreve order 2168
Total number of parameters 4 2 2 11 11 16
1The catchment was delineated by the traditional method using 1:1,000,000 scaled map and approved by MNET decision. 2The catchment was defined by WWF in 2010 using SRTM 500 m data. 3The catchment was estimated by HydroShed using SRTM 90 m data. 4The catchment was defined by ArcHydro and ILWIS using SRTM 90 m data. 5The catchment was defined by ArcHydro using ASTER 30 m data.
Figure 11. ArcHydro model—A final result of SRTM-DEM.
Copyright © 2013 SciRes. JWARP
O. ALTANSUKH ET AL.
Copyright © 2013 SciRes. JWARP
927
Figure 12. ArcHydro model—A final result of ASTER-DEM.
Figure 13. Some intermediate results of ILWIS model. 379.7 km that equals to 11.8% of the longest line. This error is recognized as unacceptable. Difference of the main drainage line was 25.6 km, and it equals to 2.8% of the longest line. Also, it recognized acceptable.
At the end of this study, sixteen parameters of the Zavkhan River and its catchment area have been rede- fined. In previous research, total length of the Zavkhan River had been estimated 808.0 km, and this parameter has been redefined as the river drainage length is 901.2 km. Moreover, elevation of the drainage head is defined as 3313.0 m, and altitude of the drainage mouth is 1030.0 m, and difference is 2283.0 m. Therefore, drainage slope is 2.53 m·km2−1; sinuosity is 3.8 and according to Strahler ordering, the drainage of Zavkhan River is per-
tained to 7th order. Related to the research result, the raised issue among
the researchers is the catchment area and perimeter of the Zavkhan River. Because of the difference between pre- vious and recent researches results on the catchment area is 21885.1 km2. As shown in Figure 15, there are several variances between topographic and satellite-based catch- ment delineation and the biggest one is in southern bor- der of the catchment.
Thus, it is necessary to check a difference between previous and this studies on the catchment area delinea- tion, and based on the discussion among scholars, to se- lect most appropriate one. The selected one will be used in further research.
O. ALTANSUKH ET AL. 928
Figure 14. ILWIS model—A final result of SRTM-DEM.
Figure 15. Comparison between topographic and satellite-based Zavkhan River and its catchment area.
5. Recommendation
Methodology, applied in this study, can be used to define all 29 bigger rivers and its catchment areas in Mongolia, and results would have positively influenced on national water resource management. Also, the obtained results would be used as a base data in modeling of ground and surface water. The 332nd decision on “River catchment areas of Mongolia” of the Minister of Nature, Environ-
ment and Tourism in 2009 has to renew, if a result of further study, which will cover entire Mongolia, would be accepted from vocational organization and experts.
6. Acknowledgements
The authors would like to thank all staffs of WWF- Mongolia and ARC for the research funding. We wish to express our honest gratitude to all staffs of Water Re-
Copyright © 2013 SciRes. JWARP
O. ALTANSUKH ET AL. 929
search Sector, especially Dr. Gombo Davaa for their support for my research.
REFERENCES [1] MNET, “Mongolian River Catchment Area,” Ministry of
Nature, Environment and Tourism, Ulaanbaatar City, 2009.
[2] O. Altansukh, “Surface water database of Mongolia,” En- vironmental Information Center, 2009.
[3] M. A. E. Bastawesy, R. R. Ali and A. H. Nasr, “The Use of Remote Sensing and GIS for Catchments Delineation in Northwestern Coast of Egypt: An Assessment of Water Resources and Soil Potential,” The Egyptian Journal of Remote Sensing and Space Sciences, Vol. 11, 2008, pp. 3- 16.
[4] D. Tuvdendorj and B. Myagmarjav, “The Atlas of the Climate and Ground Water Resources in the Mongolian People’s Republic,” 10th Factory of DUDK, Ulaanbaatar City, 1985.
[5] E. Damba, “Schematization of Integrated Water Re- sources Management of the Selenge River Basin,” Ad- ministration of Geodesy and Cartography, Ulaanbaatar City, 1986.
[6] N. Sodnom and A. L. Yanshini, “The National Atlas of the Mongolian People’s Republic,” Cartographic Factory of the Minsk City, Ulaanbaatar City, 1990.
[7] D. Dorjgotov, “Mongolian National Atlas,” Institute of Geography, Ulaanbaatar City, 2009.
[8] D. Sanjmyatav, “River Catchments in Mongolia,” WWF- Mongolia, Ulaanbaatar City, 2010.
[9] G. Dolgorsuren and J. Bron, “Integrated Water Manage- ment: National Assessment Report,” SIWRMiM Project, Ulaanbaatar City, 2012.
[10] A. Jarvis, et al., “Hole-Filled Seamless SRTM Data V4,” International Centre for Tropical Agriculture (CIAT), 2008.
[11] NASA, “Land Processes Distributed Active Archive Center (LPDAAC)-ASTER GDEM L1B,” USGS/Earth Resources Observation and Sciences (EROS) Center, 2001.
[12] ESRI, “ArcHydro—GIS for Water Resources,” ESRI, Ca- lifornia, 2002.
[13] W. Koolhoven, J. Hendrikse and W. Nieuwenhuis, “ILWIS,” ITC, Enschede, 2007.
[14] R. A. D. By, R. A. Knippers and M. J. C.Weir, “Princi- ples of Geographic Information Systems,” In: R. A. D. By, Ed., An Introductory Textbook, ITC, Enschede, 2004, p. 483.
[15] B. H. P. Maathuis, “DEM Based Hydro-Processing,” 1st Edition, ITC, Enschede, 2007.
[16] B. H. P. Maathuis and L. Wang, “Digital Elevation Model Based Hydro-Processing,” Geocarto-International, Vol. 21, No. 1, 2006, pp. 21-26. http://dx.doi.org/10.1080/10106040608542370
[17] ESRI, “ArcHydro—Tools and Tutorial,” ESRI, New York, 2009.
Copyright © 2013 SciRes. JWARP