Embed Size (px)
Citation preview

SMALL WIND TURBINE TECHNOLOGY APPLICATION FOR RESIDENTIAL USES by AHMED TAHER AHMED ZENTANI Thesis submitted in fulfilment of the requirements for the degree Master of Technology: Electrical Engineering in the Faculty of Engineering and the Built Environment at the Cape Peninsula University of Technology Supervisor: Prof MTE Kahn Co-supervisor: Dr AMA Almaktoof Bellville November 2020
CPUT copyright information The dissertation/thesis may not be published either in part (in scholarly, scientific or technical journals), or as a whole (as a monograph), unless permission has been obtained from the University

ii
DECLARATION
I, Ahmed Taher Ahmed Zentani, declare that the contents of this dissertation/thesis represent my own unaided work, and that the dissertation/thesis has not previously been submitted for academic examination towards any qualification. Furthermore, it represents my own opinions and not necessarily those of the Cape Peninsula University of Technology.
Signed Date

iii
ABSTRACT
As a result of environmental concerns, the depletion of fossil fuel, and the increase in
energy demand, renewable sources' penetration is expanding day after day. However,
because of their dependency on weather conditions, renewable sources impose new
challenges on the power system. To accommodate these sources into the conventional
power system, the structure of the power system should be changed. The concept of
the microgrids is regarded as the appropriate solution for the grid integration of
renewable sources. Microgrids refer to small power systems with control capabilities
operating in grid connection and in offgrid modes. Microgrids can be classified as DC,
AC, or hybrid microgrids. DC microgrids have emerged as sustainable solutions
combining both energy storage and distributed generation to provide power to DC loads
such as LED lights, computer chargers, Electric Vehicles, computers, laptops, TVs,
tablets, phones, printers, etc. This study considers a DC microgrid based on a small
wind turbine. The aim is to design a 3 kW standalone wind turbine DC microgrid to
provide power to residential appliances operating at 240 V in case of power shortage
or power cuts from the primary power grid. The system consists of a small wind turbine
using an AC permanent magnet synchronous generator, a three-phase diode rectifier,
a DC-to-DC boost converter, and a maximum power point tracker based on the Perturb
and Observe (P&O) technique. MATLAB/Simulink software package is used for the
modelling and simulation.
Keywords: DC microgrids, power converters, MPPT, P&O method, small wind turbine.

iv
ACKNOWLEDGEMENTS
First and foremost, all praise be to ALLAH for giving me the knowledge, opportunity, and ability
to successfully complete this degree.
I would also like to express my deepest gratitude to my supervisor, Professor MTE Kahn, and
Co. supervisor Dr. Ali Almaktoof, for their support, encouragement, guidance, and commitment
throughout this research.
My genuine thanks also goes to all members of Faculty of Engineering, staffs at the centre for
distributed power electronics system (CDPES) and friends for their immeasurable suggestions
and support.
For all the unconditional love and support and patience, for all the encouragement and
sacrifices, I thank my parents, my wife, my brothers and sisters and my in-laws; may ALLAH
bless them and reward them abundantly in this life and in the hereafter.
Special thanks to Dr. Khalid Ben Hamad for his help and encouragement throughout this
journey.
Also, I thank Libyan Embassy in Pretoria for their support.
To my friends and colleagues, I am also grateful for their moral support and encouragements.
Ahmed Zentani 2020

v
DEDICATION
This thesis is dedicated to those who are dear to me, more particularly my parents, my wife
Dr. Asma Alwakwak, my angels Yummna, Yussif and Yacob.

vi
TABLE OF CONTENTS
DECLARATION ....................................................................................................................... ii
ABSTRACT ............................................................................................................................ iii
ACKNOWLEDGEMENTS ...................................................................................................... iv
DEDICATION .......................................................................................................................... v
TABLE OF CONTENTS ......................................................................................................... vi
LIST OF FIGURES ................................................................................................................. xi
LIST OF TABLES ................................................................................................................. xiv
APPENDICE .......................................................................................................................... xv
CHAPTER ONE ....................................................................................................................... 1
INTRODUCTION .................................................................................................................. 1
1.1 Introduction ............................................................................................................. 2
1.2 Statement of the Research Problem ...................................................................... 3
1.3 Research Aims and Objectives .............................................................................. 3
1.3.1 Research aims ........................................................................................................ 3
1.3.2 Research objectives .............................................................................................. 4
1.4 Research Methodology ................................................................................................ 4
1.5 Research Significance ................................................................................................. 4
1.6 Organization of the Thesis .......................................................................................... 4
CHAPTER TWO ...................................................................................................................... 6
LITERATURE REVIEW ....................................................................................................... 6
2.7.3 Doubly-Fed Induction Generator (DFIG) ................................................................. 6
2.1 Introduction .................................................................................................................. 7
2.2 Islanded Mode operation of DC Microgrids ............................................................... 9
2.3 Small-Scale Wind Turbines (SWTs) .......................................................................... 10
2.4 Market of Small Wind Turbines ................................................................................. 12
2.5 Components of Small Wind Turbines ....................................................................... 14
2.5.1 Rotor ...................................................................................................................... 14
2.5.2 Drag and lift design .............................................................................................. 14

vii
2.5.3 Tip speed ratio ...................................................................................................... 14
2.5.4 Number of blades ................................................................................................. 14
2.5.5 Generator .............................................................................................................. 15
2.5.6 Transmission ........................................................................................................ 15
2.5.7 Towers ................................................................................................................... 15
2.6 Principle and Operation of Wind Energy Conversion ............................................. 16
2.6.1 Wind aerodynamics ............................................................................................. 16
2.6.2 Power of wind turbine .......................................................................................... 17
2.6.3 Fixed and variable HAWTs .................................................................................. 18
2.6.4 Turbine power versus rotational speeds ........................................................... 18
2.6.5 Turbine torque versus rotational speeds .......................................................... 19
2.6.6 Wind turbine power curve ................................................................................... 19
2.7 Wind Generators ........................................................................................................ 20
2.7.1 Permanent magnet synchronous generators (PMSG) ...................................... 20
2.7.2 Direct-coupled generator .................................................................................... 21
2.7.3 Doubly fed induction generator (DFIG) .............................................................. 22
2.8 Power Electronic Converters for DC Wind Turbines .............................................. 23
2.8.1 AC-to-DC converters ............................................................................................ 23
2.8.2 DC-to-DC converters ............................................................................................ 24
2.8.2.1 Buck converter ............................................................................................... 24
2.8.2.2 Boost converter ............................................................................................. 25
2.8.2.3 Buck-Boost converter ................................................................................... 26
2.9 Voltage flow stability and control in DC grids ......................................................... 26
2.10 Wind turbine power control ..................................................................................... 27
2.10.1 Pitch angle control ............................................................................................. 27
2.10.2 Stall control ........................................................................................................ 28
2.10.3 Yaw control ......................................................................................................... 28
2.10.4 Power electronic control ................................................................................... 29
2.11 Maximum Power Point Tracking (MPPT) Algorithms ............................................ 29
2.11.1 Optimal torque control (OT) .............................................................................. 30

viii
2.11.2 Power signal feedback control (PSF) ............................................................... 30
2.11.3 Tip speed ratio (TSR) control ............................................................................ 31
2.11.4 Perturbation and Observation (P&O) control .................................................. 32
2.11.5 Incremental conductance (IC) ........................................................................... 33
2.11.6 Comparison of two MPPT techniques .............................................................. 34
2.12 Summary ................................................................................................................... 34
CHAPTER THREE ................................................................................................................ 35
SMALL WIND TURBINE DESIGN TECHNOLOGY IN A DC MICROGRID ......................... 35
3.1 Introduction ................................................................................................................ 36
3.2 Standalone SWT in DC microgrids ........................................................................... 36
3.3 Site selection for SWTs ............................................................................................. 38
3.4 SWT technologies ...................................................................................................... 39
3.4.1 Horizontal-axis SWTs .......................................................................................... 39
3.4.2 SWTs characteristics ........................................................................................... 40
3.4.3 Variable-speed SWTs ........................................................................................... 41
3.4.4 Permanent magnet synchronous generator (PMSG) ........................................ 42
3.5 Power converters for SWTs ...................................................................................... 44
3.5.1 Three-phase diode rectifier ................................................................................. 44
3.5.2 DC-to-DC boost converter ................................................................................... 45
3.6 Analysis of adopted MPPT Control Technique ........................................................ 46
3.6.1 SWT-based DC microgrid with P&O MPPT control ........................................... 47
3.6.2 Implementation of MPPT for a DC-to-DC boost converter ............................... 48
3.7 Summary ..................................................................................................................... 49
CHAPTER FOUR .................................................................................................................. 51
MODEL DESIGN DEVELOPMENTS .................................................................................... 51
4.1 Introduction ................................................................................................................ 52
4.2 Load Profile ................................................................................................................. 53
4.3 Model development .................................................................................................... 53
4.3.1 Wind turbine aerodynamic modelling ................................................................ 53
4.3.2 PMSG modelling ................................................................................................... 55

ix
4.3.2.1 Dynamic model of the PMSG ........................................................................ 55
4.4 Power electronics modelling ..................................................................................... 57
4.4.1 AC-to-DC converter modelling ............................................................................ 57
4.4.2 DC-to-DC boost converter ................................................................................... 58
4.4.2.1 Design considerations .................................................................................. 59
4.4.2.2 Voltage and current relationships ................................................................ 59
4.4.2.3 Voltage ripples ............................................................................................... 62
4.5 Boost converter control for maximum power extraction ....................................... 63
4.5.1 Perturb and observe method control strategy .................................................. 63
4.6 Summary ..................................................................................................................... 67
CHAPTER FIVE .................................................................................................................... 68
5.2.1 Small wind turbine model .......................................................................................... 68
5.2.2 Electrical system model ............................................................................................. 68
5.2.3 Control simulation model .......................................................................................... 68
5.1 Introduction ................................................................................................................ 69
5.2 An overview system description of block diagram of the wind turbine system .. 70
5.2.1 Small wind turbine model .................................................................................... 70
5.2.2 Electrical system model ...................................................................................... 71
5.2.3 Control simulation model .................................................................................... 71
5.3 Results and discussion ............................................................................................. 71
5.3.1 Wind turbine results ............................................................................................ 72
5.3.2 SWT results .......................................................................................................... 73
5.3.3 DC-to-DC boost converter results analysis ....................................................... 75
5.4 Case Studies ............................................................................................................... 80
5.4.1 Case study one: SWT model without using Perturb & Observe algorithm .... 80
5.4.2 Case study two: SWT model under constant speed condition ........................ 81
5.5 Summary ..................................................................................................................... 82
CHAPTER SIX ....................................................................................................................... 84
CONCLUSION AND RECOMMENDATIONS ....................................................................... 84
6.1 Conclusion .................................................................................................................. 84

x
6.2 Recommendations for future research .................................................................... 85
REFERENCES ...................................................................................................................... 87
APPENDIX ............................................................................................................................ 94
xi
LIST OF FIGURES
Figure 1. 1: Research outline layout ........................................ Error! Bookmark not defined.
Figure 2.1: Nanogrids forming a DC microgrid ................................................................... 7
Figure 2. 2: Small wind turbine forming a DC microgrid ................................................... 8
Figure 2. 3: DC microgrid ...................................................................................................... 9
Figure 2. 4: HAWT and VAWT Characteristics, depicted (Bin Wu, Yongqiang Lang,
Navid Zargari, 2011). ............................................................................................................ 11
Figure 2. 5: (a) HAWT, (b) Darrieus and (c) H-rotor VAWT (El Chaar et al., 2011). ........ 11
Figure 2. 6: SWTs Comparison of (a) installed units and (b) installed capacity. .......... 13
Figure 2. 7: SWT Installed Capacity World Market Forecast 2009-2020. ........................ 13
Figure 2. 8: Components of a SWTs (Mahesa et al., 2020). ............................................. 16
Figure 2. 9: Power in the Wind (EARNEST & RACHEL, 2019) ......................................... 16
Figure 2. 10: Power curve of fixed pitch HAWTs (Haque et al., 2009) ............................ 18
Figure 2. 11: Power Coefficient 𝑪𝒑 under different pitch angles 𝜷 .............................. 18
Figure 2. 12: Power versus rotor rotational speed at various rotational wind speeds . 19
Figure 2. 13: Torque versus rotational speed at various wind speeds .......................... 19
Figure 2. 14: Wind speed characteristic, depicted by (Ahmed et al., 2016) ................... 20
Figure 2. 15: PMSG connected to a three-phase rectifier ................................................ 21
Figure 2. 16: (a) Grid connected induction generator, (b) Self-excited induction
generator .............................................................................................................................. 22
Figure 2. 17: DFIG Indirect Drives Variable Speed Wind Turbine with Gearbox
(Ontiveros et al., 2011) ........................................................................................................ 23
Figure 2. 18: Three-phase bridge rectifier ......................................................................... 24
Figure 2. 19: Schematic of a buck converter .................................................................... 24
Figure 2. 20: Schematic f a boost converter ..................................................................... 25
Figure 2. 21: Schematic of a buck-boost converter ......................................................... 26
Figure 2. 22: Pitch angle control structure (Bratcu & Ceangӽ, 2014). ........................... 27
Figure 2. 23: Power versus rotor speed in stalling control. (Ahmed et al., 2010) .......... 28
Figure 2. 24: Yaw Control Mechanism. (Mohammadi et al., 2018) .................................. 28
Figure 2. 25: Schematic of machine side converter controller. (Thongam et al., 2009) 29
Figure 2. 26: PI with MPPT Control of Boost Converter System (Zammit et al., 2018) . 29
Figure 2. 27: SWT supplying a load via a boost converter controlled from a P&O MPPT
............................................................................................................................................... 30
Figure 2. 28: Optimal torque control diagram (Ali M. Eltamaly, 2012). ........................... 30
Figure 2. 29: PSF MPPT Control Diagram (Ali M. Eltamaly, 2012). .................................. 31

xii
Figure 2. 30: Power Coefficient versus Tip Speed Ratio ................................................. 31
Figure 2. 31: Tip Speed Ratio MPPT Control Diagram (Ali M. Eltamaly, 2012). ............. 31
Figure 2. 32: P&O Control Process .................................................................................... 32
Figure 2. 33: Flowchart of incremental conductance Method ......................................... 33
Figure 3. 1: SWT in a DC Microgrid (Belakehal et al., 2009). ........................................... 37
Figure 3. 2: Minimum relative distances as a function of the obstacles’ heights
(Rosato, 2019). ..................................................................................................................... 38
Figure 3. 3: Model of SWT DC microgrids ......................................................................... 39
Figure 3. 4: Upwind and Downwind HAWTs (J.F. Manwell, 2002). .................................. 39
Figure 3. 5: Power coefficient versus tip speed ratio ....................................................... 41
Figure 3. 6: Wind turbine torque vs. rotor speed.(Haque et al., 2009) ............................ 42
Figure 3. 7: Circuit diagram of PMSG ................................................................................ 44
Figure 3. 8: Power converter interfacing a wind generator ............................................. 44
Figure 3. 9: PMGS connected to three-phase diode rectifier .......................................... 45
Figure 3. 10: DC Link Power vs DC Link Voltage .............................................................. 46
Figure 3. 11: SWT-based DC microgrid with Used P&O control. .................................... 47
Figure 3. 12: Plot of Generated Power in kW Vs. Generator Speed in rad/sec. ............. 47
Figure 3. 13: Boost converter with P&O MPPT controller ............................................... 49
Figure 4. 1:Structure of Small Wind Turbine connected to DC microgrid ..................... 52
Figure 4. 2: Simulink model of wind turbine aerodynamics. ........................................... 54
Figure 4. 3: Turbine Power Characteristic with Maximum Power Point Tracking ......... 55
Figure 4. 4: : abc-dq axis.(Chowdhury, 2014) ................................................................... 56
Figure 4. 5: Three-phase, full-bridge diode rectifier with PMSG. .................................... 58
Figure 4. 6: DC-to-DC Boost Converter.(Subbiah & Neelaveni, 2017)(Belay, 2017) ...... 59
Figure 4. 7: The boost converter. (a) Circuit; (b) Equivalent circuit when the switch is
closed; (c) Equivalent circuit when the switch is open. .................................................. 60
Figure 4. 8: (a) Inductor voltage and (b) current; (c) Diode and (d) Capacitor currents.
............................................................................................................................................... 61
Figure 4. 9: Perturb and observe method to regulate the voltage on the DC microgrid 64
Figure 4. 10: Flowchart of P&O MPPT Algorithm for SWT with boost converter .......... 65
Figure 4. 11: MPPT Process diagram ................................................................................. 66
Figure 5. 1: SWT with PMSG and DC-to-DC converter model ......................................... 70
Figure 5. 2: Simulink Model control MPPT by P&O Method ............................................ 71
Figure 5. 3: Variable wind speed ........................................................................................ 72
Figure 5. 4: Pitch angle ....................................................................................................... 73
Figure 5. 5: SWT voltage ..................................................................................................... 74
Figure 5. 6: SWT rotor rotational speed ........................................................................... 74
Figure 5. 7: SWT line to line voltage .................................................................................. 75

xiii
Figure 5. 8: PMSG Stator Current ....................................................................................... 75
Figure 5. 9: (a) Boost converter inductance current and (b) ripple current ................... 76
Figure 5. 10: Boost converter input voltage ...................................................................... 77
Figure 5. 11: Duty Cycle using the P&O MPPT algorithm ................................................ 77
Figure 5. 12: Boost converter output Current ................................................................... 78
Figure 5. 13 : Boost converter output voltage .................................................................. 79
Figure 5. 14: Boost Converter Output Power Under Varying Conditions Using P&O
MPPT ..................................................................................................................................... 80
Figure 5. 15: (a) Current, (b) Voltage, and (c) Power of boost converter ....................... 81
Figure 5. 16: (a) Current, (b) Voltage, and (c) Power of boost converter using P&O
MPPT ..................................................................................................................................... 82

xiv
LIST OF TABLES Table 2. 1: Advantages and disadvantages of various wind turbines (El Chaar et al.,
2011)...................................................................................................................................... 12
Table 3. 1. DC power application with their preferred voltage level (Kumar et al., 2017).
............................................................................................................................................... 38
Table 4. 1: DC appliances used in one house. .................................................................. 53
Table 4. 2: Scheme of the P&O algorithm. ........................................................................ 67
Table 5. 1: Wind turbine and PMSG system parameters ................................................. 69
Table 5. 2: Boost converter parameter specifications ..................................................... 70

xv
APPENDICE P&O Matlab code
93

xvi
GLOSSARY
𝐀 Area swept by the rotor
AC Alternating current
ANN Artificial Neural Network
DC Direct current
DFIG Doubly fed induction generator
FLC Fuzzy Logic Control
GW Giga watt
HAWT Horizontal axis wind turbine
HCS Hill Climb Search
IGBT Insulated-gate bipolar transistor
INC Incremental Conductance
kW Kilowatt
LED Light emitting diode
MPPT Maximum Power Point Tracking
m/s Metre per second
MOSFET Metal Oxide Silicon Field Effect Transistor
MW Mega watt
ORB Optimum Relation Based
OTC Optimal Torque Control
PMSG Permanent magnet synchronous generator
P&O Perturb & Observe
PSF Power Signal Feedback
SCIG Squirrel cage induction generator
SEIG Self-Excited induction generator
SFIG Singly Fed Induction Generator
SWT small wind turbine
TSR Tip Speed Ratio
V Volt
VAWT Vertical axis wind turbine
rpm Revolution per minute
𝐏𝐰 Kinetic power of the wind

xvii
𝛒 Air density
𝐕𝐰 Wind speed
𝐂𝐩 Power coefficient
𝛌 Tip speed ration
𝛌𝒐𝒑𝒕 Tip speed ration
𝝎 Rotational speed of the turbine
𝑹 Radius of the turbine blade
𝑪𝒑 Power coefficient
β Pitch angle
𝑽𝟎 Output voltage
𝑽𝒊𝒏 Input voltage
𝑫 Duty cycle
𝑻𝒎 Turbine torque
𝑻𝒈 Generator torque
𝑻𝒎_𝒐𝒑𝒕 Optimum torque
𝑓 Frequency
𝒏𝒔 Speed of the rotor
𝑝 Number of poles
𝜙𝑓 Flux per poles.
𝑷𝒅𝒄 DC link power
𝑽𝒅𝒄 DC link voltage

xviii

1
CHAPTER ONE
INTRODUCTION
1.1 Introduction
1.2 Statement of the Research Problem
1.3 Research Aims and Objectives
1.4 Research Methodology
1.5 Research Significance
1.6 Organisation of the Thesis

2
1.1 Introduction
Currently, energy shortage has become one of the most significant issues that many
countries are facing. For instance, some countries adopt electricity usage regulations
that restrict households from controlling the quantity of electric power used daily
(Kesraoui et al., 2018). On the other hand, the cost of energy from power utilities is
increasing. More and more homes and businesses have been installing small
renewable generators to cut energy bills and carbon dioxide emissions and sell extra
electricity back to the national grids. If there is a power cut, these small renewable
generators are introduced as backup sources to maintain continuous electricity supply
(Kesraoui et al., 2011). Among various types of renewable generators, the wind turbine
is one of the cleanest and efficient technologies. Depending on the application, their
size can range from large to small (EARNEST & RACHEL, 2019). Standalone small
wind turbines have become attractive choices for powering residential areas. In the
case of grid failure, load shedding, or in places with no access to the grids, they can
provide power to local loads. Compared to large wind turbines, which are widely used
in wind farms, medium and small-scale wind turbines can be implemented in more
flexible environments. For instance, small-scale wind turbines are commonly
implemented in residential and urban distributed energy systems to provide alternating
current (AC) or direct current (DC). In this research, the targeted residential utilities
include DC appliances such as LED lighting, computers, variable speed drives, etc.
These appliances significantly increase the power demand in residences.
The advantages of DC microgrids include energy efficiency improvement, a decrease
of the overall energy consumption, network operational benefits, and cost-efficient
electricity infrastructure replacement (Muhssin, 2015). DC microgrids are preferred
over AC microgrids due to the following benefits (Shaikh et al., 2017):
a. higher reliability,
b. improved quality of power supply,
c. reduced losses due to absence of reactive power,
d. higher efficiency,
e. simple structure,
f. better performance and efficiency of DC converters.
The quantity of power obtained at the output of a wind generator is dependent on the
accuracy at which the peak power points are being tracked by the maximum power
point tracking (MPPT) controller of the wind turbine control system. MPPT algorithms
are generally considered in systems such as photovoltaic and wind turbines to increase
the extracted power for various operating conditions. Several MPPT algorithms are

3
presented in the literature; the conventional techniques are performed by measuring
mechanical parameters such as wind speed or storing optimal generator speed values
with their corresponding maximum power (torque) at various wind speeds. These
techniques include Tip Speed Ratio (TSR), Optimal Torque Control (OTC), and Power
Signal Feedback (PSF) MPPT techniques. On the other hand, MPPT controllers are
also realised by measuring electrical parameters such as voltage, current, or power.
MPPT techniques part of this group includes Hill Climb Search (HCS), Incremental
Conductance (INC), Optimum Relation Based (ORB), soft computing methods such as
Fuzzy Logic Control (FLC), Artificial Neural Network (ANN), etc. Among these MPPT
techniques, the P&O method, also known as the Hill Climb Search, is one of the
commonly used and easy-to-implement MPPT technique providing high efficiency if the
correct predictive and adaptive hill-climbing process is used (Gite & Pawar, 2017).
Generators for wind turbines include permanent magnet synchronous generators
(PMSG), squirrel cage induction generators (SCIG), and doubly-fed induction
generator (DFIG), etc.; however, for small wind turbines, PMSGs are preferred due to
their high reliability and efficiency. Moreover, PMSGs are dominant in gearless
standalone small wind turbines developed for urban residential use. Generally, besides
the PMSG, such a system includes a three-phase bridge rectifier, a DC-to-DC boost
converter driven from an MPPT controller. The DC microgrid adopted in this research
consists of a 3 kW wind turbine supplying a DC load at 240 VDC. The 240 V is obtained
via a DC-to-DC boost converter driven by an MPPT controller based on the Perturb
and Observe (P&O) algorithm.
1.2 Statement of the Research Problem
Some countries have restrictions on the amount of power usage for households per
day. If the allocated amount of power for the day is depleted, then the concerned
household's power supply automatically cuts off. The problem is to get additional and
sufficient power to supply some appliances and avoid depleting the daily power rations,
therefore preventing power cuts.
1.3 Research Aims and Objectives
1.3.1 Research aims
The research aim to design a 3 kW standalone wind turbine DC microgrid to provide
power to residential appliances in case of power shortage or power cuts from the main
utility grid.

4
1.3.2 Research objectives
The specific research objectives are:
To develop a model for a small wind turbine standalone DC microgrid for
residential use
To develop the MPPT using the Perturb and Observe method.
To simulate the system using MATLAB/Simulink environment.
1.4 Research Methodology
The methodology adopted in this research consists of the following:
A comprehensive literature review will be conducted on DC microgrid, wind
turbines, three-phase rectifiers, DC-to-DC converters and maximum power
point tracking algorithm for wind turbines.
Design of the small wind turbine DC microgrid and the maximum power point
tracking algorithm using Matlab/Simulink
Systematically analysis, and evaluate the results
Present a thesis based the study conducted
1.5 Research Significance
This research will add value to existing available academic literature geared towards
evaluating the different options to ensure energy security and facilitate the use of small-
scale renewable sources.
1.6 Organization of the Thesis
The thesis is organised as follows:
Chapter two provided an overview of islanded mode operation of DC microgrids as well
as small-scale wind turbines, including their components and current market. A section
dedicated to wind energy conversion principle and operation was presented.
Additionally, sections on power electronic converters for wind turbines and voltage flow
stability and control compared with the other methods were also considered. Lastly, a
review on wind turbine power control approaches and maximum power point tracking
algorithms were presented.

5
Chapter three deals with the design considerations of a DC microgrid based on an
SWT. The topics covered in this chapter include a brief investigation on standalone
small wind turbine in DC microgrids, including the site selection, the technologies, the
power electronic converters topologies and their maximum power point techniques.
Chapter four is dedicated to the development of SWT standalone DC microgrid model.
The system is designed to operate as an auxiliary power entity for a residential building
to provide power to appliances such as LED lighting, computers, variable speed drives,
etc. in order to reduce or hinder power outages. Such SWTs are usually HAWTs
attached in short towers of few metres or placed on top of buildings roofs, cellular
communication towers, etc. In SWTs, the aerodynamic section is directly coupled to a
PMSG without a gear system. The blowing wind causes the turbine to rotate and
generate electricity. Such system can be used to improve power supply of applications
including residences, farms, schools, small commercial businesses or even isolated
community installations, etc. as they are practical and economic in places with high
wind potential.
Chapter five deals with the presentation, analysis and discussion of the results obtained
from the simulation. These results were presented in three sections namely wind
turbine results, SWT results and DC-to-DC boost converter results. The wind turbine
results focused on the aerodynamics of the wind turbine including the wind speed and
the pitch angle. The SWT results comprised the simulation results of the voltage and
the current of the 3 kW PMSG model used in this study. Lastly, the DC-to-DC boost
converter results consisted of the results of the voltage, current and power of the
converter using the P&O MPPT controller. Additionally, to case studies were
considered to assess the performance of the system. The first case considered the
operation of the SWT DC microgrid without an MPPT control for the boost converter
and the system was simulated for different wind speeds. And the second case
considered the simulation of the SWT DC microgrid operating under a constant speed
at 12 m/s and the boost converter is controlled using a P&O MPPT controller.
Chapter six gives the conclusion of the thesis and the recommendations for further
research.

6
CHAPTER TWO
LITERATURE REVIEW
2.1 Introduction
2.2. Islanded mode operation of DC Microgrids
2.3 Small-Scale Wind Turbines (SWTs)
2.4 Market of Small Wind Turbines
2.5 Components of Small Wind Turbines
2.4.1 Rotor 2.4.2 Drag and lift design 2.4.3 Tip speed ratio 2.4.4 Number of blades 2.4.5 Generator 2.4.6 Transmission 2.4.7 Towers
2.6 Principle and Operation of Wind Energy Conversion
2.6.1 Wind aerodynamics 2.6.2 Power of wind turbine 2.6.3 Fixed and variable HAWTs 2.6.4 Turbine power versus rotational speeds 2.4.5 Turbine torque versus rotational speeds 2.4.6 Wind turbine power curve 2.4.7 Towers
2.7 Wind Generators
2.7.1 Permanent magnet synchronous generators (PMSG) 2.7.2 Direct-coupled generator 2.7.3 Doubly-Fed Induction Generator (DFIG)
2.8 Power Electronic Converters for Wind Turbine System
2.8.1 AC-to-DC converters 2.8.2 DC-to-DC converters
2.9 Voltage Flow Stability and Control in DC grids
2.10 Wind turbine power control
2.10.1 Pitch angle control 2.10.2 Stall control 2.10.3 Yaw control 2.10.4 Power electronic control
2.11 Maximum Power Point Tracking (MPPT) Algorithms
2.11.1 Optimal torque control method (OT) 2.11.2 Power signal feedback control method (PSF) 2.11.3 Tip speed ratio (TSR) control method 2.11.4 Perturbation Observation (P&O) control method 2.11.5 Incremental conductance method 2.11.6 Comparison of two MPPT techniques
2.12 Summary
7
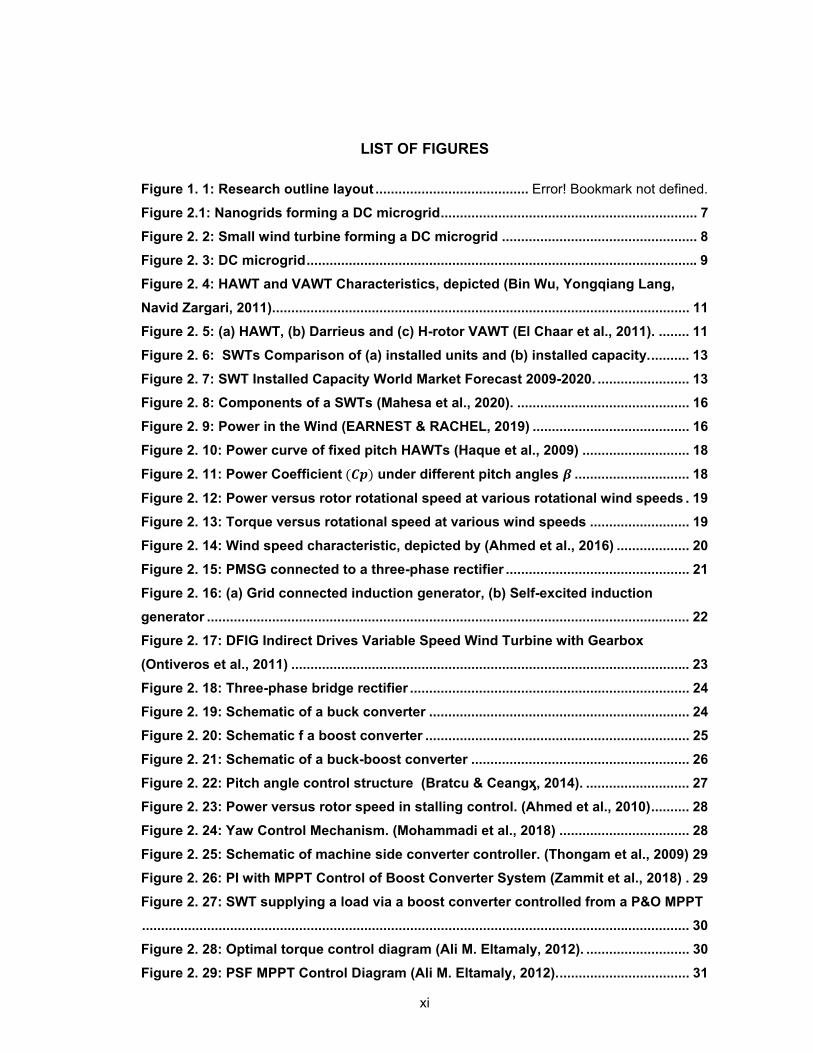
2.1 Introduction
The DC microgrids have emerged as sustainable solutions combining both energy
storage and distributed generation to provide power to DC loads such as LED lights,
computer chargers, Electric Vehicles (EV), computers, laptops, TVs, tablets, phones,
printers, etc. Most past research has focused on AC microgrid, because of the AC
power experience, however, consistent progress in power electronics and
enhancements in the computational power of real-time systems have made DC power
capable of achieving larger roles than just the basic control. Moreover, DC technologies
are becoming attractive solutions for industrial applications such as data centres,
telecom stations, fast Electrical Vehicles (EV) charging, zero net electricity energy
buildings, railways, electric ships, etc. Figure 2.1 depicts a layout of a DC microgrid
comprising several nanogrids.
Figure 2.1: Nanogrids forming a DC microgrid. (Kumar et al., 2019)
In DC systems, concerns such as reactive power management and frequency
synchronisation that characterise AC systems are irrelevant. Moreover, the lack of
frequency makes DC systems liberated from proximity effect, skin effect, and inrush
current issues and harmonics. DC systems are also viewed as safer than AC systems
due to the decrease of the electromagnetic field.
Renewable generators such as photovoltaic and fuel cell can easily be integrated with
DC systems as their output is in DC, while power sources such as wind turbines, wave
power, and gas turbines can be more efficient by utilising only one converter instead of
two back-to-back converters (AC to DC and DC to AC). Hence, the system complexity

8
can be improved, and conversion losses reduced by avoiding unnecessary conversion
stages. Apart from their advantages, DC systems also have some issues such as the
maturity of the technology, the lack of standards or norms, the instability because of
the mismatch of impedance between lightly damped filters on the source side and
tightly regulated power converter, the investigation of proper grounding, etc.
Figure 2.2 shows the layout of the microgrid adopted in this research. The system
includes components such as the wind turbine, power conditioning device which
consists of power electronic converters, and the MPPT controller to regulate energy
from the wind turbine to the load.
Figure 2. 2: Small wind turbine forming a DC microgrid
The kinetic energy from the wind is converted into mechanical energy by the rotor
blades of the wind turbine. The mechanical energy is then transformed into electrical
energy through an electric generator coupled to the rotor. Depending on the structure
and shape of the blades, the wind energy extraction takes place at various rotational
speeds. Generally, the wind turbine can extract maximum power out of the wind when
facing fluctuating wind conditions.
This chapter gives an overview on the islanded mode operation of DC microgrids as
well as small-scale wind turbines including their components and current market. A
section dedicated to wind energy conversion principle and operation is also considered.
Additionally, sections on power electronic converters for wind turbines and voltage flow
stability and control compared with the other methods are also presented. Lastly, a
review of wind turbine power control approaches and maximum power point tracking
algorithms are considered.

9
2.2 Islanded Mode operation of DC Microgrids
Microgrids consist of low voltage distribution systems including distributed generation
units and energy storage devices. Such an entity can operate tied to the grid, or in
islanded mode (offgrid) if disconnected from the grid. In islanded mode, the microgrid
must generate enough power to supply sensitive loads. Insensitive loads may not be
supported as these loads are generally dependent on the main grid. Once the
connection to the utility grid is restored, these loads will be reconnected and the
microgrid will operate again tied to the grid (Katiraei et al., 2005; Pogaku et al., 2007).
The number of distributed generation units in a microgrid is determined by the amount
of energy that needs to be stored and the loads. In case there is an excess of energy
when the microgrid is operating in the islanded mode, some of the distributed
generation units might be stopped so that the remaining operating units can only meet
the load (Kakigano et al., 2010; Kakigano et al., 2013).
Most home appliances operate using DC voltage which is usually provided by either a
battery or a conversion from AC-to-DC using a rectifier. Figure 2.3 shows a DC
microgrid consisting of both AC and DC distributed generation units as well as AC and
DC loads. Such topology is often adopted to avoid power loss from several power
conversion stages. In this case, the wind turbine generates AC power that requires an
AC-to-DC conversion for the connection to the DC current bus, while the energy
storage system and the photovoltaic panels provide DC power and are connected to
the DC bus through DC-to-DC conversions.
Figure 2. 3: DC microgrid. (Wang, 2018)

10
2.3 Small-Scale Wind Turbines (SWTs)
SWTs are the types of wind turbines that generate only a few kilowatts of energy (1 kW
to 100 kW) and are often installed as single units. They are usually connected directly
to the loads, or generally, to a power charging unit such as a battery bank. In the past
years, there has been a significant increase in the use of SWTs; big companies are
finding it economical to generate their own electricity. Additionally, in remote locations,
SWTs are often integrated into local AC or DC microgrids consisting of renewable and
other conventional energy sources to power households, farms, schools, or small
businesses, etc. (Anila & Divya, 2016). These microgrids are seen as reliable and
effective means to increase small scale renewable energy penetration while minimising
the cost. The basic design approach applied for these types of wind turbines is similar
to that of large-scale wind turbines. The most important factor when planning the
installation of a wind turbine is to assess if a location has enough wind to generate
electricity as the output power of a wind turbine is directly proportional to the wind speed
(Abraham & Plourde, 2014).
Two topologies of SWTs can be found in the market namely the horizontal axis wind
turbine (HAWT) and the vertical axis wind turbine (VAWT) (Figure 2.4) (Bin Wu,
Yongqiang Lang, Navid Zargari, 2011). The HAWTs dominate the majority of wind
turbine applications. They consist of a tower, a nacelle and rotor blades. The nacelle
holds the gearbox and the generator. The power electronic interface of a small HAWT
is often placed at the base of the tower. On the other hand, VAWTs usually comprise
a tower, rotary blades,, and a rotor base that includes a generator and a gearbox. They
can be further classified into Darrieus rotor and H-Darrieus rotor (Figure 2.5) (Abraham
& Plourde, 2014). Table 2.1 gives a comparison between the types of wind turbines. In
general, HAWTs have better wind energy conversion efficiency compared to VAWTs,
other benefits include self-starting capability, and quick access to higher wind speed
because of the tower height (Bin Wu, Yongqiang Lang, Navid Zargari, 2011; Bratcu &
Ceangӽ, 2014).
SWTs can be fixed speed or variable speed wind turbines. The major differences
between the two types are the way the aerodynamic efficiency of the rotor would be
limited for different wind speeds. The process of wind energy conversion system is
comparatively simple. However, without appropriate planning, a large portion of wind
energy might be wasted.

11
Figure 2. 4: HAWT and VAWT Characteristics. (Bin Wu, Yongqiang Lang, Navid Zargari, 2011)
Figure 2. 5: (a) HAWT, (b) Darrieus and (c) H-rotor VAWT. (El Chaar et al., 2011)

12
Table 2. 1: Advantages and disadvantages of various wind turbines. (El Chaar et al., 2011)
Type of wind
turbines
Advantages Disadvantages
HAWT Majority use three blades less than those in VAWT.
HAWT blades are self-supporting on the ground, they are simply attached at the base, and the top is lighter thus, decreasing the cost of the structure
Pitch control can be used to control pitch energy supplied by wind speed and stopping the turbine system when required.
Contemporary mass production in this system has lower value of cost rather than the other.
HAWT tower interference makes noise problem
The structure is complex because it has a yaw mechanism and a dynamic stall
More uncovered periodical loads that can reduce lifespan of the system
Reducing maximum power output due to system restrictions
Maintenance required is difficult
VAWT Darrieus and H-rotor
Since the angle of contact with the wind blade is not vital in this system, it may be sited in turbulent and divergent places of wind.
No need to control rotor direction The generator and control unit are
placed at the bottom of the tower, which exposes it to demand a high possibility of operation, installation and maintenance.
VAWT can be installed in the residential areas with few noises
Darrieus is not heavy because of the structure
Easy components manufacturing There is no Yaw system for this
application, which decreases cost VAWT technology such as Darrieus
application needs simple foundations Available with low power but more
suitable used in offshore technology system
Under discontinued challenges such as the starting of the poor torque at high levels of angles from the wind attack
actual torque ripple that affects the life of fatigue from drive as well as quality power output
H rotor blade capacity is large, thus require more materials used
H-rotor blades undergo bending moments decreased wind turbine size since gravitational acceleration decrease with increasing turbine radius of constant speed
In the application of Darrieus which is the control of the pitch angle considered as not possible
Darrieus wind turbine blades specifications are complex to industry
2.4 Market of Small Wind Turbines
Small Wind Turbines market is still in its early stage, however, according to recent
reports from the international trade, the market is growing faster, and statistics show
that as of the end of 2014, more than 830 MW, which indicates an increasing of 10,9%
over 2013 was registered. Most of this growth has occurred in countries like China, the
USA, and the UK (Pitteloud, 2016). Globally, the average installed size in 2010 was
around 0,66 kW while in 2014 it reached 0,87 kW. For example, in China, the average
installed size in 2012 was around 0,5 kW, while the USA and UK were at 1,4 kW and
4,7 kW respectively. The UK started with no existing Small Wind Turbines market
before 2012, however, the country improved rapidly during 2013 and 2014 (Pitteloud,
2016).

13
The Chinese market represents the largest market with around 72 % share of installed
units, followed by the USA with 18 % of installed units, then the UK with 3 % of installed
units and the rest of the world with the remaining 7 % (Figure 2.6 a). However,
comparing the total installed capacities, the situation appears different; China leads
with only 41 %, followed by the USA 30 %, then the UK with 15 %, and lastly the rest
of the world with 14% (Figure 2.6b) (Pitteloud, 2016).
(a) (b) Figure 2. 6: SWTs Comparison of (a) installed units and (b) installed capacity. (Pitteloud, 2016)
The latest development of the small wind turbines market showed a yearly increase of
11 % in new installations capacity. As shown in Figure 2.7, in 2016, the growth rate
increased to 115 MW of installed capacity with regulated standards and policies. The
market is expected to reach around 240 MW of recently installed capacity. Additionally,
the market is expected to see a steady growth rate of 20 % and installed capacity
accumulated around 175 GW by 2020 (Pitteloud, 2016).
Figure 2. 7: SWT Installed Capacity World Market Forecast 2009-2020. (Pitteloud, 2016)

14
2.5 Components of Small Wind Turbines
As shown in Figure 2.8, small wind turbines components include the rotor, the blades,
the tail, and the tower. However, wind turbines consist of blades, rotor hub, turbine
shaft, gearbox, generator shaft, etc. The system is designed to transfer the mechanical
energy generated from blowing wind into electric power.
2.5.1 Rotor
The components of a wind turbine that accumulates energy from the wind are known
as the blades. The rotor coil usually consists of two or three evenly distributed wooden,
fibreglass or steel blades which rotate an axis (horizontal or vertical) at a rate defined
by the wind velocity and the design of the blade. The blades are connected to the
centre, and the centre is attached to the main base.
2.5.2 Drag and lift design
Blade designs run by utilising either drag or lift. With the drag concept, the wind moves
the blades out of the way. Drag based wind generators are viewed as slower rotational
speeds systems with high torque capabilities. They may be used in applications such
as pumping, cutting, or grinding work. On the other hand, lift edge design uses a similar
rule that makes aeroplanes, kites, and birds fly. When air travel flows past the blade, a
type of wind speed and force differential occur between the top and lower blade
segments. The demand at the lower segment is greater and thus proceeds to “lift” the
blade. While blades join the main axis, similar to a wind turbine rotor, the lift is converted
into rotational movements. Lift-based wind generators have higher rotational speeds
and are designed for electricity generation.
2.5.3 Tip speed ratio
The tip speed would be proportional to the rotational movement of the blade towards
the wind speed. With a greater percentage of tip speed ratio, the rotation of a real wind
turbine rotor at the given wind speed will be high. Lift-based wind generators have
maximal tip-swiftness proportions of around 10, while drag-based proportions are
generally approximated. Considering the high rotational speed demands of electrical
generators, it is obvious that this lift-based wind turbine is almost practical.
2.5.4 Number of blades
The blades' volume consists of the total number of blades and the total area covered
to facilitate wind generator performance. For a lift-based wind turbine to operate

15
effectively, the wind must easily flow over these blades. Spacing between blades must
be greater to prevent a particular blade from encountering the potentially disturbing
blade to avoid turbulence. Because of that, most wind turbines have either two or three
blades.
2.5.5 Generator
The wind generator transforms the rotation of the blades directly into electricity. These
generators can produce alternating current (AC) or direct current (DC) depending on
the design and can be found in the market with various standardised electrical power
ratings. The length of the blades can influence the wind generator size. Generators that
produce AC power are often equipped with features to generate the accurate voltage
at a constant frequency, even if they vary. DC generators are generally useful for
battery charging applications in addition to being used for other devices.
2.5.6 Transmission
The rotation of the wind turbine rotor ranges between 45 and 400 rpm (revolution per
minute), depending on the type of rotor and the wind velocity. Generators generally
require revolution per minute of 200 to around 800. Hence, most wind turbines require
gear systems to increase the generator's rotation to adequate speeds to allow efficient
electricity generation. Few DC wind turbines do not require transmission systems.
Instead, they use a direct connection between the rotor and generator, generally
referred to as direct thrust systems. Since the transmission is not performed, wind
turbine complexity and maintenance are decreased. However, to deliver the same
power as AC wind turbines, large turbines are required.
2.5.7 Towers
Towers are not just supporting frames on which wind generators are installed. They
also raise the wind turbine to some height so that the blades can be safely and securely
clear from the ground, in addition to allowing stronger winds. The maximum tower
height selection is optional in many cases, except in areas subjected to restrictions.
The major factor to consider when deciding about the height that the tower should have
is the cost.

16
Figure 2. 8: Components of a SWTs. (Mahesa et al., 2020)
2.6 Principle and Operation of Wind Energy Conversion
2.6.1 Wind aerodynamics
In the 1980s, most wind turbines could not generate efficient and reliable electricity
(Yaramasu et al., 2015). Since then, significant development and technological
advancement have occurred. Still, based on aerodynamics laws, it is not physically
possible to convert all kinetic energy surrounding a wind turbine into usable energy.
The kinetic power of the wind (disc) that flows across the turbine rotor swept area, as
shown in Figure 2.9 can be expressed using the following equation (Echchhibat, 2017):
𝑃 0.5𝜌𝐴𝑉 (2.1)
where 𝑷𝒘 is the kinetic power of the wind, 𝝆 is the air density, 𝑨 is the area swept by
the rotor and 𝑽𝒘 is the wind speed.
Figure 2. 9: Power in the Wind. (EARNEST & RACHEL, 2019)

17
2.6.2 Power of wind turbine
The disc concept provides the wind turbine's aerodynamics and gives the maximum
efficiency that an ideal turbine can never exceed. This efficiency is referred to as the
Betz limit, equal to 59.3% (Bratcu & Ceangӽ, 2014). In practice, wind turbines have
less extraction efficiency than the Betz limit, and the power coefficient 𝑪𝒑 quantifies the
efficiency. The power coefficient represents a fraction of the power in the wind extracted
by the rotor. Moreover, it evaluates wind turbine performance. The two variables of the
power coefficient are defined by the tip speed ratio and the pitch angle.
The tip speed ratio 𝝀 expresses the ratio of the turbine blade tip speed onto the wind
speed, and it is expressed by equation 2.2 as follows (Zammit et al., 2018):
𝝀 𝝎𝑹
𝑽𝒘 (2.2)
Where 𝝎 is the rotational speed of the turbine and 𝑹 is the radius of the turbine blade.
The pitch angle is the angle at which the blades are perpendicular to the axis blades.
The pitch angle can control the quantity of power extracted by aligning blades out
depending on the operating conditions. In large-scale wind turbines, mechanical control
is employed to regulate the pitch angle. However, in SWTs, the pitch angle controllers
are not used because of their technical complexity and cost. In most cases, the pitch
angle is considered to be zero.
The power coefficient is used to measure the power captured by the wind turbine, and
it is given by equation 2.3 as follows (Zammit et al., 2018):
𝑪𝒑 𝝀,𝜷𝑷
𝑷𝒘 (2.3)
Where 𝑷 is the power from wind
The power captured by a wind turbine can be expressed using the power coefficient as
follows (Bratcu & Ceangӽ, 2014):
𝑷 𝟎.𝟓𝝆𝑨𝑪𝒑 𝝀,𝜷 𝑽𝒘𝟑 (2.4)
18
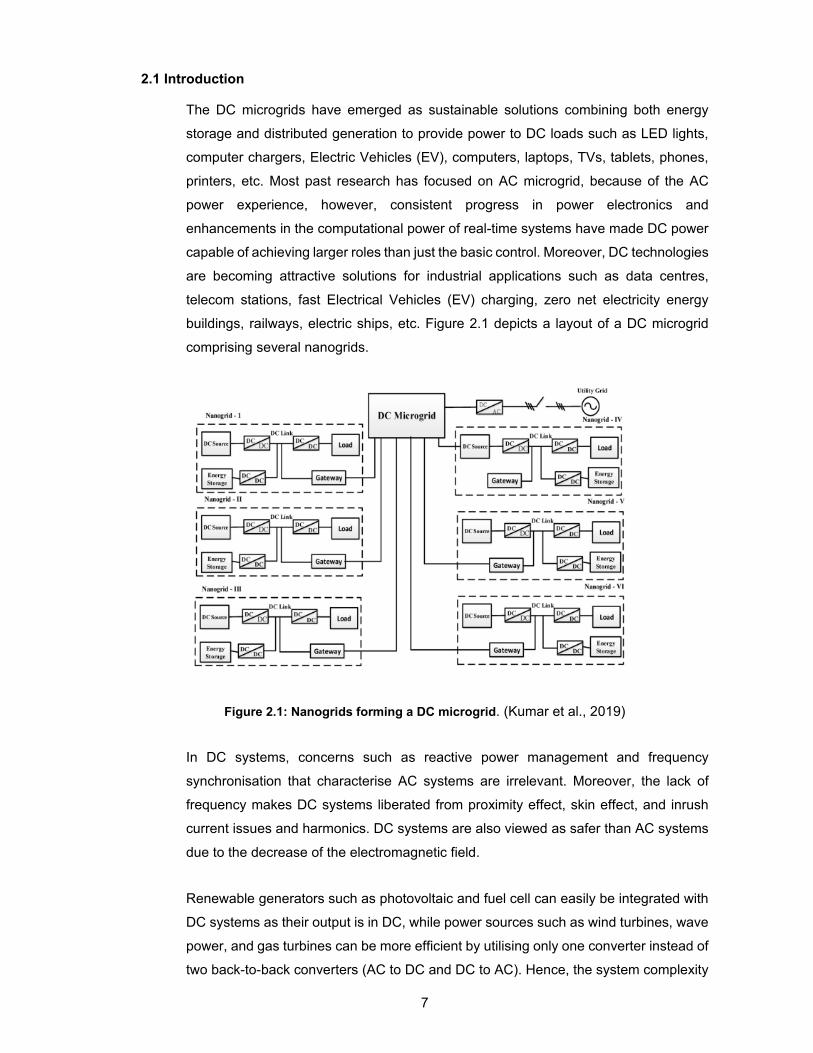
2.6.3 Fixed and variable HAWTs
The HAWTs can have either fixed pitch or variable pitch angles. In fixed pitch angle
wind turbines (β = 0), the maximum power occurs when the tip speed ration is optimal
(𝛌𝒐𝒑𝒕). The efficiency of the extracted power depends on the power coefficient and the
tip speed ratio. The typical power curves of fixed pitch angle wind turbines are shown
in Figure 2.10.
Figure 2. 10: Power curve of fixed pitch HAWTs. (Haque et al., 2009)
In variable pitch wind turbines, the rotor blades can twist to align with its longitudinal
axis. The power coefficient curves of such wind turbine under various pitch angle is
depicted in Figure 2.11.
Figure 2. 11: Power Coefficient 𝑪𝒑 under different pitch angles 𝜷. (Echchhibat, 2017)
2.6.4 Turbine power versus rotational speeds
Figure 2.12 shows the wind turbine power curve as a rotor rotational speed function at
various wind speeds. The curve shows the cubic power dependence of the wind turbine
over the wind speed. Additionally, it shows the wind turbine's ability to achieve
maximum power generation depending on the rotation speed.

19
Figure 2. 12: Power versus rotor rotational speed at various rotational wind speeds. (Dalala et
al., 2013)
2.6.5 Turbine torque versus rotational speeds
The wind turbine torque as a function of the rotor rotational speed at different wind
speeds is depicted in Figure 2.13. As the power, the torque is also dependent on both
the rotational speed and the wind speed. The maximum power occurs at optimum
torque. The torque curve's right side is referred to as the stable operation zone of the
wind turbine.
Figure 2. 13: Torque versus rotational speed at various wind speeds. (Dalala et al., 2013)
2.6.6 Wind turbine power curve
A wind turbine power curve shown in Figure 2.14 refers to a standard characteristic
obtained from the wind turbine manufacturer to predict the output power. The cut-in
speed is the minimum wind speed at which the wind turbine generates functional
power. The rated speed represents the optimum wind speed at which the wind turbine
generates its rated power, and the cut-out speed is the wind speed at which the wind
turbine is shut down for protection reasons.

20
Figure 2. 14: Wind speed characteristic. (Ahmed et al., 2016)
2.7 Wind Generators
The shaft of a turbine is coupled to the generator rotor's shaft to transmit the mechanical
power of the turbine to the generator rotor. According to Faraday's electromagnetic
induction law, if an electric conductor is moved inside a rotating magnetic field, an
electromotive force will be induced in the conductor. An electric current will start flowing
through the conductor. Most generators used in wind turbines generate AC power, and
generators for wind turbines can be synchronous or induction generators. Synchronous
generators can be grouped as constant speed or variable speed synchronous
generators. Furthermore, synchronous generators can be permanent magnet or
electromagnet field generators depending on the magnetic field. On the other hand,
induction generators used in wind turbines are classified into three types, namely Singly
Fed Induction Generator (SFIG), Doubly Fed Induction Generator (DFIG), and Self-
Excited induction generator (SEIG). Wind generators are grouped into permanent
magnet synchronous generators, direct-coupled generators, and doubly-fed induction
generators in this section.
2.7.1 Permanent magnet synchronous generators (PMSG)
PMSGs are more flexible and more efficient compared to other types of generators.
They can achieve full speed control and do not provide slip rings and brushes. PMSGs
can also enable variable speed operation, allowing maximum power tracking between
the cut-in and the rated wind speeds. They also connect the wind turbine without a
gearbox and do not require an excitation current. Additionally, this type of generator's
control systems are modest and easily implemented, thus achieving active and reactive
power control (Subbiah & Neelaveni, 2017). However, PMSGs present some
disadvantages, such as they can run the risk of demagnetisation at a high temperature,
and power electronics devices have a full scale-power rating, which may result in lots

21
of losses (Subbiah & Neelaveni, 2017). Figure 2.15 shows a layout of a PMSG wind
generator feeding a three-phase rectifier.
Figure 2. 15: PMSG connected to a three-phase rectifier. (Zammit et al., 2018)
2.7.2 Direct-coupled generator
Fixed-speed squirrel-cage enlistment generators were broadly utilised in large-scale
wind turbines during the 1980s, during which a large portion of wind turbines was
straightforwardly coupled to the power grid. Because of the wind speed variation, the
generator rotor speed needs to change marginally to adjust the variation of the driving
torque.
The rotational speed of the generator is, in this manner, not constant. To produce a
magnetic field for wound rotor induction generators, it is important to have additional
power to the rotor through a slip ring. However, the rotational speed variation is
commonly under 1% because of the nature of small slip of induction generators (Bin
Wu, Yongqiang Lang, Navid Zargari, 2011), which is defined as the rate of the
differential of the revolution speed of magnetic fields between the synchronous speed
and rotational speed, divided by the simultaneous speed (Lee et al., 2005). Figure 2.16
shows a fixed-speed wind turbine design, which comprises a squirrel-confine induction
generator, bridge soft starter, a bunch of capacitor bank, and a transformer.

22
Figure 2. 16: (a) Grid-tied induction generator, (b) Self-excited induction generator.
(Kinnares & Sawetsakulanond, 2013)
Generally, squirrel-cage induction generators require reactive power compensation,
and the compensation is achieved by connecting the generator to a capacitor bank
(Jahromi et al., 2012). The advantages of squirrel-cage induction generators are as
follows: (Jahromi et al., 2012)
Straightforward structure
Low cost
Easy maintenance
Simple solution for grid connection
High performance-to-price ratio
However, they do not operate under optimal tip speed ratio with the wind speed
variation, and their efficiency and power factor are low (Hau, 2006).
2.7.3 Doubly fed induction generator (DFIG)
DFIGs are gaining interest because of the disadvantages of fixed-speed induction
generators. The difference between both types is that the stator windings of DFIG can
directly be tied to the grid. Power output from the stator of a DFIG can be supplied
directly to the grid, and the generator rotor consumes excitation current from the grid.
As shown in Figure 2.17, the rotor of the DFIG is connected to the grid employing a
power converter. The power converter can transmit power in both ways by delivering
power to the grid and is also absorbing power from the grid, based on the generator's
rotational speed (Kumar Tiwari et al., 2018).

23
Figure 2. 17: DFIG Indirect Drives Variable Speed Wind Turbine with Gearbox. (Ontiveros et al., 2011)
Advantages of the DFIG include the following (Ontiveros et al., 2011):
The ability to decouple the active and reactive power control by controlling the
rotor voltage. Thus, the power factor control can be implemented.
simplicity in construction
On the other hand, the disadvantages of DFIG are
frequent maintenance.
Gearbox adds extra weight,
produce noise,
increases losses.
2.8 Power Electronic Converters for DC Wind Turbines
The most widely utilised power electronic converters for wind turbines are AC-to-DC
converters, DC-to-AC converters, and DC-to-DC converters. The voltage generated is
first rectified to DC to either feed DC loads or converted back to AC to feed the grid or
any AC load. Generally, in DC wind turbines, the continuous variation of wind speed
affects the DC link voltage, which may vary in an uncontrolled way. To obtain a stable
DC voltage, a DC-to-DC boost converter is usually used in the DC link.
2.8.1 AC-to-DC converters
AC-to-DC converters are also known as rectifiers. A three-phase bridge rectifier shown
in Figure 2.18 is usually employed in wind turbines to convert the AC voltage into DC.
The topology is a full-wave rectifier providing six pulse ripples at the output voltage.
Each diode conduct for 120º, and diodes’ pair connected between that pair of supply
phases with the highest instantaneous line voltage will conduct (Rashid, 2014).

24
Figure 2. 18: Three-phase bridge rectifier.
2.8.2 DC-to-DC converters
DC-to-DC converters are devices that take DC inputs voltage and produce desired DC
outputs voltage with the output voltage being different from the input. DC-to-DC
converters are also employed to isolate noise and for power bus control. In general,
there are three types of DC-to-DC converters, namely buck converter, boost converter,
and buck-boost converter. DC-to-DC converters consist of an inductor, a capacitor, a
diode, and an IGBT or a MOSFET.
2.8.2.1 Buck converter
Figure 2.19 depicts the schematic diagram of a buck converter. This type of converter
takes a high input voltage and produces a lower output voltage.
Figure 2. 19: Schematic of a buck converter.
If the switch SW is in on-state mode, the voltage across the inductor is equal to the
voltage difference between the input and output, and the current through the inductor
increases linearly. The diode will be in reverse biased, and no current will flow through
it. On the other hand, if the switch SW is in off-state mode, the diode will be forward
biased and across the inductor will be negative and equal to the output voltage. Hence,
the inductor current, which will decrease.
The following equation gives the output voltage of a buck converter:

25
𝑽𝟎 𝑫𝑽𝒊𝒏 (2.5)
where, 𝑽𝟎 is the output voltage, 𝑽𝒊𝒏 is the input voltage and 𝑫 the duty cycle of the
converter.
2.8.2.2 Boost converter
The boost converter shown in Figure 2.20 takes a DC input voltage and provides an
output voltage bigger than the input. It generally consists of an inductor, a diode, a
switch, and at least one energy storage element. Capacitors are often connected at the
output terminal of the converter to remove output voltage ripples. When the switch
(IGBT) is in on-state mode, the current flowing in the inductor increases, and when the
switch is in off-state mode, the only path for inductor current to flow is through the diode
and the capacitor and the load, thus, enabling the capacitor to transfer ,the energy
stored during the on-state mode. The output voltage 𝑽𝒐 of a boost converter is given
equation 2.6 as follows (Aubrée et al., 2012):
𝑽𝒐 𝟏𝟏 𝑫
𝑽𝑺 (2.6)
where 𝑽𝑺 and 𝑫 are the input voltage and duty ratio respectively.
Figure 2. 20: Schematic of a boost converter.
Some of the advantages of a boost converter include:
Low component count, complexity, and cost
Simple design and implementation,
High efficiency and low input ripple current.
On the other hand, the disadvantages are:

26
Non-Isolated power supply,
Prone to failure due to the absence of DC isolation,
High output currents will stress the switching element, the diode, and therefore
limit the output power capability of this supply.
Hazardous transients can easily reach the load.
The supply has a high output ripple.
2.8.2.3 Buck-Boost converter
The buck-boost depicted in Figure 2.21 provides an output voltage that can be less
than or bigger than the input voltage based on the duty ratio value. This converter
operates such that if the duty ratio is greater than 0.5, the converter is in a boost mode,
while if the duty ratio is less than 0.5, the converter operates in a buck mode.
Figure 2. 21: Schematic of a buck-boost converter.
The output voltage 𝑽𝟎 of a buck-boost converter can be determined using equation 2.7
given as (Khadiri & Qjidaa, 2014):
𝑽𝟎 𝑫
𝟏 𝑫 𝑽𝒊𝒏 (2.7)
where 𝑽𝒊𝒏 and 𝑫 are the input voltage and duty ratio respectively.
2.9 Voltage flow stability and control in DC grids
Voltage and frequency are the parameters that require control in AC systems. The
frequency can be regulated by controlling the apparent power. In contrast, the voltage
can be regulated by keeping the reactive power stable. No reactive power
characterises DC grids since both the voltage and the current are in phase, and their
frequency is equal to zero. Hence, the voltage is the only parameter that requires to be
controlled. In DC grids, the voltage is controlled by supplying the required power to the
loads (Sun et al., 2016). By controlling the voltage of the DC link, the nominal voltage
flow can be realised. In case the grid is overloaded, the voltage drops will occur in the

27
system. Therefore, to stabilise a DC grid’s voltage, it is important to maintain the
balance between the supply and the demand. Stabilising the voltage level also depends
on the number of converters employed to regulate the DC voltage. Various techniques
can be used to stabilise the voltage of a DC microgrid. The common method is the
Master/slave drop control. Typically, the DC link is where the voltage can be regulated
because it is directly linked to the grid, and an adequate voltage level should be
realised (Bounechba et al., 2016). Converters should operate accurately, and
dependency should not be kept only on the DC link. Communication between the
different converters is also gainful to control a DC grid's power flow and to monitor the
voltage drops and faults that may occur in the system. The Master/slave drops control
technique is recommended where a DC link master controller controls many other
converters and devices. Using a battery bank is another way of maintaining DC grid
power during the lower power generation. The bank can be utilised to support the grid
in maintaining an adequate voltage level. However, batteries cannot perform a voltage
regulation for a long period because of their capacity.
2.10 Wind turbine power control
Depending on the wind turbine topology, various techniques can be employed to
control the power. These techniques include the pitch angle control, the stall mode
control, the yaw control, and the power electronics control (Labidi, et al., 2017).
2.10.1 Pitch angle control
Figure 2.22 shows the schematic of pitch angle control. The technique is commonly
used to control the aerodynamic power generated by a turbine. It consists of turning
the blades faster either into or out of the wind to decrease or increase the power output.
The pitch angle is modified by a portion of a degree to change the wind speed, thus,
keeping a fixed power output. This control method's disadvantage is the rotor geometry
change, which makes the system more expensive.
Figure 2. 22: Pitch angle control structure. (Bratcu & Ceangӽ, 2014)

28
2.10.2 Stall control
During high wind speed, the turbine blade turns a couple of degrees the other way to
control the pitch angle. By doing that, constant wind energy are obtained even when
the wind speed is high. Additionally, constant power soft stalling has been proposed to
restrict the power generated and the rotor speed to send the wind turbine into the low-
speed stall zone. The stall control concept is illustrated in Figure 2.23; as the wind
speed rises from the cut-in speed, the rotor speed rises to keep the maximum power.
For wind speeds beyond that range, the power will be maintained constant at its rated
value (Ahmed et al., 2010).
Figure 2. 23: Power versus rotor speed in stalling control. (Ahmed et al., 2010)
2.10.3 Yaw control
A layout of a yaw mechanism is shown in Figure 2.4; generally, the turbine tends to
acquire optimum force by changing the wind turbine direction. For small-scale wind
turbines, the tail vane is used to achieve that, and for large-scale wind turbines, the
yaw system is used. Whenever the turbine is operating in certain zones, the yaw
system turns the nacelle from the wind direction, and the yaw regulator creates a fake
yaw error to restrict power and the rotor speed. Since the yaw system is mechanical, it
is not as quick as an electrical regulator (Mohammadi et al., 2018).
Figure 2. 24: Yaw Control Mechanism. (Mohammadi et al., 2018)

29
2.10.4 Power electronic control
The power electronics-based control of wind turbines does not involve any changes in
the turbine blades' positions or a mechanical control scheme. Instead, the electrical
load changes with power electronic controllers, and the generator rotor speed is
automatically modified to track the maximum power using a maximum power tracking
system. A vector control method is employed where control is done on the rotor flux
reference frame. Figure 2.25 shows the machine side converter control system's
schematic. The MPPT controller produces the reference speed ω*, set as the
command speed for the speed control loop of the machine side converter control
system to track the maximum power (Thongam et al., 2009).
Figure 2. 25: Schematic of machine side converter controller. (Thongam et al., 2009)
2.11 Maximum Power Point Tracking (MPPT) Algorithms
The concept of Maximum Power Point Tracking (MPPT) is employed to augment the
turbine output power and modifies the generator speed. Based on the wind speed, the
MPPT changes the power transferred so that the turbine can operate at the maximum
power (Barote & Marinescu, 2010). Figure. 2.26 shows the block diagram of the control
system with the MPPT system. It includes a PI controller to regulate the inductor
current, whose current reference value is provided by the MPPT system.
Figure 2. 26: PI with MPPT Control of Boost Converter System. (Zammit et al., 2018)
Generally, an MPPT algorithm inputs the DC link current and voltage to deliver the
necessary MPPT current at the output side. This current serves as the reference
current to the current controller. In SWTs, maximum power point tracking controllers
are used for better energy extraction and faster convergence. In DC SWTs, the peak

30
power is often obtained by inserting a DC-to-DC boost converter between the SWT and
the load, as shown in Figure 2.27. Various methods are used for MPPT. The most
commonly employed wind turbines are optimal torque control, power signal feedback
control, tip speed ratio control, perturbation and observation control, and incremental
conductance.
Figure 2. 27: SWT supplying a load via a boost converter controlled from a P&O MPPT.
2.11.1 Optimal torque control (OT)
The optimal torque control is a classic and simple MPPT technique generally
implemented in commercial wind turbines. The technique relies on imposing the torque
based on the rotor speed and requires only a sensor to measure the shaft speed.
Optimal torque control is commonly used as a baseline for comparison with other MPPT
controllers. The schematic of optimal torque control is shown in Figure 2.28.
Figure 2. 28: Optimal torque control diagram. (Ali M. Eltamaly, 2012)
2.11.2 Power signal feedback control (PSF)
The schematic of power signal feedback control is depicted in Figure 2.29. This control
technique requires the reference optimum power curve of the wind turbine from the
experimental results. The maximum power operating points and their corresponding
wind turbine speeds are kept in a lookup table.

31
Figure 2. 29: PSF MPPT Control Diagram. (Ali M. Eltamaly, 2012)
2.11.3 Tip speed ratio (TSR) control
The optimal TSR is always a fixed value, even when the wind speed varies (Figure
2.30). Its schematic is shown in Figure 2.31. Whenever a wind turbine operates at its
optimal TSR, the power extracted from the conversion is the maximum. MPPT
technique forces the system to operate at its optimal TSR by comparing this TSR with
the real value and inputting the error into the MPPT controller. The system reacts by
modifying the generator speed to minimise this error. Although the technique is basic
as wind speed is estimated directly, an exact measurement for wind speed is
impossible, and the system's price increases.
Figure 2. 30: Power Coefficient versus Tip Speed Ratio.
Figure 2. 31: Tip Speed Ratio MPPT Control Diagram. (Ali M. Eltamaly, 2012)

32
2.11.4 Perturbation and Observation (P&O) control
The P&O technique is based on the search-remember-reuse principle for finding the
optimal power point. The technique starts functioning by perturbing a small step-size
control parameter and observing the subsequent modifications in the target function
except if the slope gets to zero. However, this technique can lose its tracking capability
in case of changes in wind conditions. Additionally, the perturbation step size decision
can complicate and deteriorate the operation. In summary, the P&O concept depicted
in Figure 2.32 is based on the following consideration:
Given dp and dv the variation in power and the variation in voltage respectively, for dp
> 0 and dv > 0, the power is located in the left side of the maximum power point. Hence,
the voltage must be increased. Furthermore, for dp < 0 and dv > 0, the power is located
in the right side of the maximum power point, and the voltage must be decreased. The
flowchart of the P&O algorithm is shown in Figure 2.33.
Figure 2. 32: P&O Control Process. (Badreddine et al., 2014)

33
2.11.5 Incremental conductance (IC)
The incremental conductance technique is a common MPPT algorithm which consists
of ascertaining the optimum point by making a correlation between current
conductance 𝑰
𝑽 with the incremental conductance
𝒅𝑰
𝒅𝑽 and continues knowing that the
slope of power versus voltage characteristic is zero at maximum power point and that
the power is given as the product of the current and the voltage. The incremental
conductance method is defined by the following equations (Yu & Liao, 2015):
𝒅𝑷
𝒅𝑽𝒎𝒑𝒑 𝒅 𝑽𝑰
𝒅𝑽 (2.8)
𝑰 𝑽 𝒅𝑰
𝒅𝑽𝒎𝒑𝒑 𝟎 (2.9)
𝒅𝑰
𝒅𝑽𝒎𝒑𝒑 𝑰
𝑽 (2.10)
Equation 10 represents the principal condition to realise the maximum power point,
when the variance of the output conductance is equal to the negative of the output
conductance. The flowchart of the incremental conductance method is depicted in
Figure 2.33.
Figure 2. 33: Flowchart of incremental conductance method. (Masood et al., 2015)

34
2.11.6 Comparison of two MPPT techniques
Among the MPPT techniques considered in this section, P&O and IC are the most used
ones. The P&O algorithm is simple and requires a lot of hardware compared to other
techniques. However, in this technique, the power losses are slightly higher than other
techniques because of the oscillating wind turbine's output around the maximum power
point. Similarly, the IC technique has better control with low fluctuation. However, it
requires more hardware. The technique can achieve a steady-state before the P&O
method. However, the results obtained from both algorithms are similar.
2.12 Summary
This chapter provided an overview of the islanded mode operation of DC microgrids
and small-scale wind turbines including their components and current market. A section
dedicated to wind energy conversion principle and operation was presented.
Additionally, sections on power electronic converters for wind turbines and voltage flow
stability and control compared with the other methods were also considered. Lastly, a
review of wind turbine power control approaches and maximum power point tracking
algorithms were presented.

35
CHAPTER THREE SMALL WIND TURBINE DESIGN TECHNOLOGY IN A DC MICROGRID
3.1 Introduction
3.2 Stand Alone SWT in DC Microgrid
3.3 Site selection for SWTs
3.4 Small Wind Turbine Technology System
3.4.1 Horizontal-Axis SWTs
3.4.2 SWTs characteristics
3.4.3 Variable-speed SWTs
3.4.4 Permanent magnet synchronous generator (PMSG)
3.5 Power converters SWTs
3.5.1 Three-phase diode rectifier
3.5.2 DC-to-DC boost converter
3.6 Concept Analysis of MPPT Control Technique
3.6.1 SWT-based DC Microgrid with P&O MPPT control
3.6.2 Implementation of MPPT for a DC-to-DC Boost Converter
3.7 Summary

36
3.1 Introduction
Generally, SWTs comprise components such as a rotor with a variable number of
blades to convert the power from wind to mechanical power, an electric generator,
control and protection systems, and power electronic interface for feeding electricity
into a battery bank, a utility grid, or into an immediate application such as a water pump
(Hau, 2006) (Chowdhury, 2014). The generator is the major component of a small wind
turbine and converts the mechanical power into electricity. There is extensive interest
in using of the multiple-pole permanent magnet synchronous generators operated from
a wind turbine shaft with no gear system (Yin Win, 2014).
A permanent magnet generator does not necessitate an excitation regulation, and its
output voltage is proportional to the rotor speed. Hence, in the control of a wind turbine,
the rotor speed is obtained by measuring of the output voltage. The continuous
variation of wind speed will lead to a DC link voltage variation in an uncontrolled way.
To obtain variable speed operation and stable DC bus voltage, a DC-to-DC boost
converter could be placed in the DC link (Blaabjerg et al., 2007). Since there is a
unidirectional active power flows from the PMSG to the DC link via a power converter,
only a simple diode rectifier can be used to the generator side converter to acquire a
cost-efficient arrangement (Nayar & Dehbonei, 2008; Pathmanathan et al., 2008).
The concept of microgrids has gained lots of interest because of the progress of
renewable energy technologies. A microgrid can be designed to incorporate different
types of renewable sources and energy storage units controlled by an observing
method to provide quality power to the loads (Barra et al., 2020). This chapter deals
with the design considerations of a DC microgrid based on an SWT. The topics covered
in this chapter include a brief investigation on a standalone small wind turbine in DC
microgrids, including the site selection, the technologies, the power electronic
converters topologies, and their maximum power point techniques.
3.2 Standalone SWT in DC microgrids
As stated previously, DC microgrids have gained interest recently as they do not
present several technical challenges compared to AC microgrids. Furthermore, DC
microgrids facilitate smooth communication between DC sources, and as a result, there
is a decrease in power wastage and losses. The standalone DC microgrid adopted in
this research comprises an SWT with a PMSG, an AC-to-DC converter, a DC-to-DC
converter, a battery bank, and a DC load can represent an LED lighting and other
appliances at a residential. No standard value of voltage is currently available.
However, most DC microgrids usually use 24 V or 48 V due to safety reasons, battery

37
bank requirements, power converter selection, and improved reliability (Dragicevic et
al., 2014). DC microgrids appear to be the solution to obtain high-power quality.
Power converters have significant roles to play in microgrids since they link various
renewable generators and transfer energy between different microgrid components.
Semiconductors including diodes, switches, and passive components such as
inductors, resistors, and capacitors are the major elements of power converters.
Figure 3. 1: SWT in a DC Microgrid. (Belakehal et al., 2009)
Figure 3.1 illustrates a DC microgrid supplying a load. The topology is often adopted in
SWTs powering lighting systems as well as electric vehicle charging stations. The
MPPT controller is used to control the power converter to provide maximum output
power. Depending on the SWT's voltage, the power converter can be either a boost or
a buck converter. Usually, the system also includes an energy storage unit linking the
DC bus to feed the load whenever the SWT output power fluctuates due to the variation
of speed wind.
One of the biggest issues for voltage standardisation in DC microgrids is the use of
various voltage levels in distributed generation with residential, commercial, and
industrial loads. For instance, with no voltage standards, it is difficult to standardise
appliances and devices supplied with power directly from DC microgrids. Table 3.1
provides the preferred voltage levels in the main applications (D. Kumar et al., 2017).

38
Table 3. 1. DC power application with their preferred voltage level. (D. Kumar et al., 2017)
No Application DC Voltage (V)
1 USB and other small electronic equipment’s ≤ 5
2 Cars, desktop computer 12
3 LED, trucks, fans 24
4 Future PV units 48
5 Telecom 48
6 Power over Ethernet 50
7 Batteries 110/220
8 Data centre 380
9 Electric vehicle charging stations 400
10 Future distribution systems for residential and commercial buildings
350-450
11 Industries and transportation 600-900
12 Traction, marine and aircraft systems 1000-1500
3.3 Site selection for SWTs
For instance, the presence of obstacles, such as large trees or tall structures, can
prevent proper airflow, making vortexes that can decrease any wind turbine's
performance. It is imperative to give a lot of consideration while picking the site to erect
the structure for wind turbines, keep the turbine at a minimum point from the
surrounding obstacles, and the goal that the rotor's lowest bottom is put higher than the
most elevated obstacle. In general, the wind turbine needs to be 30 ft (9 metres) above
any object, as shown in Figure 3.2. Besides that, the length of wires connected from
the wind turbine to load must be taken into consideration to avoid power losses
because of the resistance and heat of the wires (Rosato, 2019).
Figure 3. 2: Minimum relative distances as a function of the obstacles’ heights. (Rosato, 2019)

39
3.4 SWT technologies
SWTs consist of a wind turbine converting wind energy into mechanical energy. The
shaft of the turbine is linked to the shaft of a PMSG via a gear system. The gear system
transmits the rated torque to the generator, and the generator develops the rated power
to supply loads. A typical layout of an SWT is shown in Figure 3.3.
Figure 3. 3: Model of SWT DC microgrids.
3.4.1 Horizontal-axis SWTs
The rotors of the horizontal axis of SWTs are mounted perpendicular to the tower axis.
Hence, the rotor axis is parallel to the ground axis, as shown in Figure 3.4, which
includes two SWT configurations, namely upwind and downwind configurations.
Figure 3. 4: Upwind and Downwind HAWTs. (J.F. Manwell, 2002)
In upwind SWTs, the rotor faces the incoming wind directly, hence, avoiding the wind
shade behind the tower. Upwind SWTs have some loss of power from the interference
because of the air bending around the tower before passing through it. In downwind
SWTs, on the other hand, the rotor is on the backside of the turbine. The nacelle seeks

40
the wind. Hence there is no need for a separate yaw system. Their rotor blades are
flexible as there is no danger of a tower strike. (Reddy et al., 2015)
3.4.2 SWTs characteristics
In SWTs, the amount of kinetic energy stored can be expressed mathematically as
(Nayak & Vinod, 2017):
𝑬 𝟏
𝟐 𝝆𝑨𝑪𝒑𝑽𝒘𝟑 (3.1)
where 𝝆 is the density of air, 𝑽𝒘 is the wind speed, 𝑨 is the volume of air at the cross
section of wind turbine.
The cross-section of the air in interaction with the rotor per second, is equal to the
rotor's cross-section. Likewise, the thickness of the air stream is equivalent to that of
the wind velocity. The conversion efficiency is close to 60 %. It can be examined as a
portion of kinetic energy supplied to the rotating part, while the remainder of the energy
is wasted. The overall energy so converted is mathematically correlated to the power
coefficient, which a function of several components, such as blades configuration, rotor,
setting, etc. Therefore, optimised power coefficient is obtained through the precise and
accurate arrangement of these components.
In SWTs, the pitch angle is assumed to be zero. Therefore, the power coefficient
characteristic depends on the thrust force, tip speed ratio, and the rotor torque from the
rotor blades. The ratio of the torque generated, and theoretical torque refers to the
torque coefficient. The power generated by the rotor is dependent on the tip speed
ratio. The dynamic between the wind stream and the rotor affects the rotor efficiency in
the power extraction. The power coefficient versus the tip speed ratio characteristic
gives the rotor performance irrespective of the rotor and site features' size. From Figure
3.5, it can be seen that the power coefficient raises with the increase of the tip speed
ratio. However, when the tip speed ratio raises above its optimised value, the power
coefficient declines at the same slope.

41
Figure 3. 5: Power coefficient versus tip speed ratio. (Swapnil S. Sonekar, 2020)
3.4.3 Variable-speed SWTs
In variable-speed SWTs, the generators are indirectly connected to the utility grid or
individual loads through power electronic units that provide decoupling and control of
the system (Blaabjerg et al., 2007). The generator used in SWTs is the PMSG. This
type of generator is compact, reliable, has high efficiency, and does not require external
excitation (Díaz et al., 2009). Unlike induction generators, PMSGs do not require
external windings to produce rotor flux; the machine’s flux is supplied by its permanent
magnets (Bin Wu, Yongqiang Lang, Navid Zargari, 2011). Since PMSGs do not require
bulky rotor windings (like those used in Wounded Rotor Synchronous Generators) to
produce the necessary magnetic flux, they can be significantly more compact. Also, the
permanent magnet structure of PMSGs enables designers to incorporate a larger
number of magnetic poles into the machine (Bin Wu, Yongqiang Lang, Navid Zargari,
2011). As a direct result of the larger number of poles, these multi-pole PMSGs can
operate at low-speeds (Chen et al., 2009). These low-speed multi-pole PMSGs enable
eliminating the gearbox since the turbine’s low-speed shaft can directly drive them. The
elimination of the gearbox reduces the overall wind turbine system size and cost while
increasing reliability (Chen et al., 2009). With the permanent magnet material cost
steadily decreasing, PMSGs have also become attractive for large MW wind turbines
(Yang et al., 2012). Therefore, to evaluate the proposed MPPT algorithm and the power
management control scheme for a standalone wind turbine system, the PMSG based
wind energy system has been selected for this study.
Another benefit of variable-speed operation is the decrease of stress on the turbine
shafts and gears since the blades absorb the wind torque peaks during the changes of
the SWT speed of rotation (Padmanabhan & Kaliyappan, 2014). The drawback of
variable speed operation is that a power conditioner must be employed to play the wind
turbine's role apparent load. However, the evolution of power electronics helps reduce
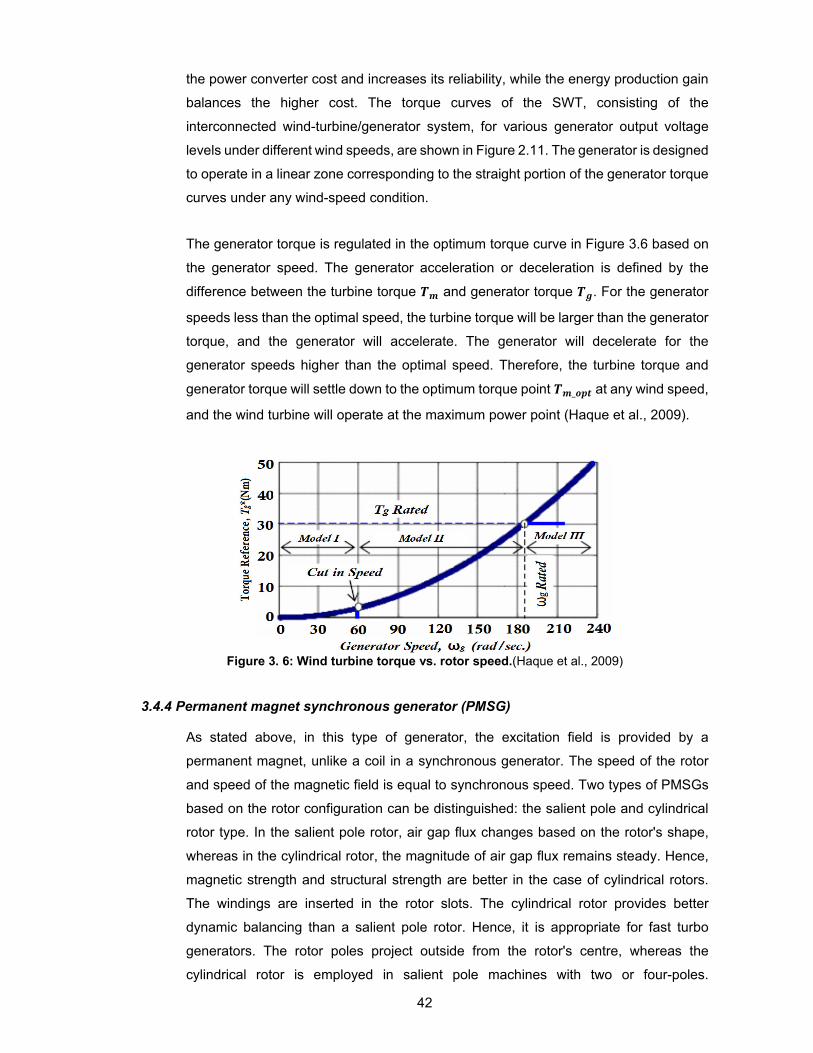
42
the power converter cost and increases its reliability, while the energy production gain
balances the higher cost. The torque curves of the SWT, consisting of the
interconnected wind-turbine/generator system, for various generator output voltage
levels under different wind speeds, are shown in Figure 2.11. The generator is designed
to operate in a linear zone corresponding to the straight portion of the generator torque
curves under any wind-speed condition.
The generator torque is regulated in the optimum torque curve in Figure 3.6 based on
the generator speed. The generator acceleration or deceleration is defined by the
difference between the turbine torque 𝑻𝒎 and generator torque 𝑻𝒈. For the generator
speeds less than the optimal speed, the turbine torque will be larger than the generator
torque, and the generator will accelerate. The generator will decelerate for the
generator speeds higher than the optimal speed. Therefore, the turbine torque and
generator torque will settle down to the optimum torque point 𝑻𝒎_𝒐𝒑𝒕 at any wind speed,
and the wind turbine will operate at the maximum power point (Haque et al., 2009).
Figure 3. 6: Wind turbine torque vs. rotor speed.(Haque et al., 2009)
3.4.4 Permanent magnet synchronous generator (PMSG)
As stated above, in this type of generator, the excitation field is provided by a
permanent magnet, unlike a coil in a synchronous generator. The speed of the rotor
and speed of the magnetic field is equal to synchronous speed. Two types of PMSGs
based on the rotor configuration can be distinguished: the salient pole and cylindrical
rotor type. In the salient pole rotor, air gap flux changes based on the rotor's shape,
whereas in the cylindrical rotor, the magnitude of air gap flux remains steady. Hence,
magnetic strength and structural strength are better in the case of cylindrical rotors.
The windings are inserted in the rotor slots. The cylindrical rotor provides better
dynamic balancing than a salient pole rotor. Hence, it is appropriate for fast turbo
generators. The rotor poles project outside from the rotor's centre, whereas the
cylindrical rotor is employed in salient pole machines with two or four-poles.

43
Consequently, the salient pole rotor is utilised in low-speed hydropower generators.
Due to the constant air gap flux, the magnetomotive force's permeance is not
dependent on the rotor poles and the magnetomotive force axis angle. In the salient
pole rotor type, the permeance varies with the magnetomotive force axis and the rotor
poles angle because of variation in air gap flux. Therefore, due to its several benefits,
the cylindrical rotor is the most employed. Because of constant nature, it is trivial to
model the machine and analyse its operation. The expression linking the frequency of
the generator and rotor speed is given as (Acharya et al., 2016):
𝒇 𝒑𝒏𝒔𝟏𝟐𝟎
(3.2)
where 𝑓 is the frequency, 𝒏𝒔 is the speed of the rotor and 𝑝 the number of poles
When linked to an isolated load, a synchronous generator acts as a voltage source
whose frequency is determined based on its prime mover speed. Generally,
synchronous generators are connected in parallel via transmission lines. The system
is expected to keep synchronism despite mechanical and electrical stress. The benefits
of such an interconnected platform are the security of power supply and low capital
cost. Industrial applications of synchronous motors are in constant speed operations.
Another benefit of employing synchronous motors is the easy control of power factor
by varying the field current. Therefore, most industries use the synchronous motors as
loads leading the power factor to produce a high-power factor.
The magnetisation curve is linear if the permeability of iron is considered infinite. The
relationship between the magnetomotive force and the flux per poles is given as
(Ayodele et al., 2017):
∅𝒇 𝒑𝑭𝒇 (3.3)
Where 𝜙𝑓 is flux per poles.
The torque can be determined as:
𝑻𝒕𝝅
𝟐
𝒑
𝟐𝟐∅𝒇𝑭𝒇 𝐬𝐢𝐧 𝜹 (3.4)
Where is the angle by which 𝑭𝒇 leads 𝑭𝒓
The electromagnetic torque acts on the field poles towards rotation to deliver the
mechanical power, hence, functioning as a motor. On the other hand, if the output

44
voltage is similar to the air gap of the electromotive force and its frequency is kept
constant by an external three-phase supply, the machine operates as a generator or
motor based on the shaft mechanical conditions. The equivalent circuit of the electrical
machine operating as a generator is shown in Figure 3.6.
Figure 3. 7: Circuit diagram of PMSG. (Jain et al., 2018)
3.5 Power converters for SWTs
Various power converter topologies for SWTs have been proposed. However, all of
them have advantages and disadvantages. The most widely used topology in SWTs
for converting AC power to DC is the unidirectional phase-phase diode rectifier. The
three-phase diode rectifier combined with a DC-to-DC converter is often selected over
the active rectifier topology due to lower circuit cost, lower controller complexity, and
higher reliability (Baroudi et al., 2007)(De Freitas et al., 2016). The DC-to-DC converter
is employed to achieve maximum power extraction. A variable speed SWT with power
electronics conversion linked to a DC load is shown in Figure 3.7.
Figure 3. 8: Power converter interfacing a wind generator.
3.5.1 Three-phase diode rectifier
The three-phase diode rectifiers are commonly employed to convert the AC power
produced by the generator into its corresponding DC power. A capacitor serves as a
voltage filter. In general, rectifiers are designed from elements such as diodes, IGBTs,
MOSFET and thyristors. Rectifiers designed from diodes are referred to as uncontrolled
rectifiers.
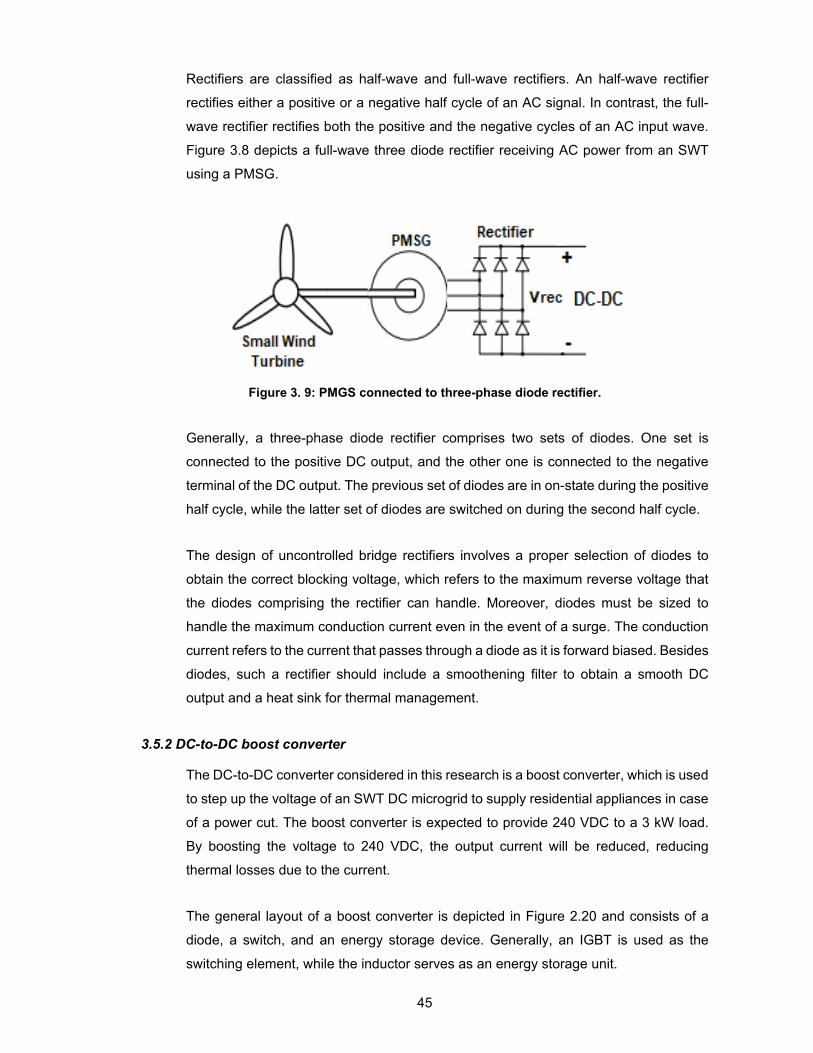
45
Rectifiers are classified as half-wave and full-wave rectifiers. An half-wave rectifier
rectifies either a positive or a negative half cycle of an AC signal. In contrast, the full-
wave rectifier rectifies both the positive and the negative cycles of an AC input wave.
Figure 3.8 depicts a full-wave three diode rectifier receiving AC power from an SWT
using a PMSG.
Figure 3. 9: PMGS connected to three-phase diode rectifier.
Generally, a three-phase diode rectifier comprises two sets of diodes. One set is
connected to the positive DC output, and the other one is connected to the negative
terminal of the DC output. The previous set of diodes are in on-state during the positive
half cycle, while the latter set of diodes are switched on during the second half cycle.
The design of uncontrolled bridge rectifiers involves a proper selection of diodes to
obtain the correct blocking voltage, which refers to the maximum reverse voltage that
the diodes comprising the rectifier can handle. Moreover, diodes must be sized to
handle the maximum conduction current even in the event of a surge. The conduction
current refers to the current that passes through a diode as it is forward biased. Besides
diodes, such a rectifier should include a smoothening filter to obtain a smooth DC
output and a heat sink for thermal management.
3.5.2 DC-to-DC boost converter
The DC-to-DC converter considered in this research is a boost converter, which is used
to step up the voltage of an SWT DC microgrid to supply residential appliances in case
of a power cut. The boost converter is expected to provide 240 VDC to a 3 kW load.
By boosting the voltage to 240 VDC, the output current will be reduced, reducing
thermal losses due to the current.
The general layout of a boost converter is depicted in Figure 2.20 and consists of a
diode, a switch, and an energy storage device. Generally, an IGBT is used as the
switching element, while the inductor serves as an energy storage unit.

46
When a boost converter is controlled from an MPPT controller, it boosts the voltage
and controls it to reach the MPP. The MPPT produces the precise duty ratio used to
drive the boost converter to an appropriate direction to reach the MPP as fast and as
accurately as possible.
3.6 Analysis of adopted MPPT Control Technique
The adopted MPPT is based on directly modifying the duty ratio of the DC-to-DC boost
converter. In a fixed step size-based P&O technique, to decrease oscillation around
the operating point, the duty ratio of the converter can be changed by inserting a step
size ΔD at every sample depending on the operating conditions. The MPPT can be
obtained when the following equation is satisfied:
𝒅𝑷𝒅𝒄𝒅𝑽𝒅𝒄
𝟎 (3.5)
where 𝑷𝒅𝒄 and 𝑽𝒅𝒄 are the DC link power and voltage respectively.
The curve 𝑷𝒅𝒄 versus 𝑽𝒅𝒄 has only a single operating point where the maximum power
can be achieved. Therefore, the maximum power point tracking can be performed
through a step by step search rather than considering parameters such as the wind
speed.
Figure 3. 10: DC Link Power vs DC Link Voltage. (Badreddine et al., 2014)
The duty ratio modification follows by the slope’s direction 𝒅𝑷𝒅𝒄𝒅𝑽𝒅𝒄
; it raises in the high-
speed zone of the generator characteristic (Figure 3.9). Thus, the generator rotor-
speed reduces, and the power raises until the controller reaches the MPP. Similarly,
when the initial point is in the low-speed zone, following the slope direction 𝒅𝑷𝒅𝒄𝒅𝑽𝒅𝒄
, which
results in a decrease of the duty ratio. Thus, the generator rotor speed is increased
slowly, and the controlling variable tends toward the MPP.

47
3.6.1 SWT-based DC microgrid with P&O MPPT control
A schematic of an SWT-based DC microgrid with P&O MPPT control is shown in Figure
3.10
Figure 3. 11: SWT-based DC microgrid with Used P&O control.
The P&O technique is a proficient optimisation method based on searching for a given
function's local optimum point. It is utilised for the searching of the ideal operating point.
Thus, it assists in maximising energy extraction. This method is based on inserting a
small step size change in a control variable and observing the objective function
adjustments until the slope of the function gets to zero. As illustrated in Figure 3.11, the
controller directs the working point by finding the position and the distance between the
working point and the peak point. The working point moves towards the right if it is in
the extreme left zone and vice versa. In this technique, the boost converter's duty ratio
is perturbed, and the DC link power is observed. The method does not require a wind
speed measurement; hence, mechanical sensors are not needed.
Figure 3. 12: Power versus speed. (Muhammad et al., 2011)

48
An adjusted P&O MPPT algorithm has been suggested to realise quick MPP tracking
under a rapid wind speed change. The recommended MPPT technique requires no
information on wind turbine parameters or mechanical sensors. The algorithm is utilized
in two operating modes to manage the previously mentioned limitations of the
conventional P&O technique. Shifts from one operating mode to the next are done
based on the variation of the wind speed. The ordinary P&O technique with a small
step size cannot track the MPP under the slow wind speed variation. At the same time,
a predictive mode is switched if a fast wind speed is observed to shift the operating
point fast around the MPP. DC link voltage change is utilised to identify rapid wind
speed variation.
The P&O algorithm operation is as follows:
In the first step, the power is determined using the voltage and current and then
compared to the power's past value. In case the difference is equal to zero, the same
voltage will be maintained, and the algorithm will try to oscillate around the same MPP.
In case of a change of power, the algorithm will continue and verify the difference
between both voltage levels. If the power difference is positive, the algorithm will lead
the voltage into a similar direction by either increasing or decreasing it as in the
previous case. Thus, if the voltage difference is positive, the algorithm will keep
increasing the voltage and vice versa. However, if the power difference is, the algorithm
will lead the voltage in the opposite direction. Hence, the voltage change will be
negative, and the algorithm will increase the voltage. Lastly, in case the change in
voltage is positive, the algorithm will reduce the voltage. The algorithm can control the
operating voltage freely by changing the duty ratio. Any variation of the duty ratio will
lead to an inverse effect on the DC-to-DC converter's input resistance and modify the
operating voltage to fulfil the four cases.
3.6.2 Implementation of MPPT for a DC-to-DC boost converter
The output voltage of a DC-to-DC boost converter is dependent on the duty ratio. Figure
3.12 shows a layout of a boost converter controlled from an MPPT controller. The
controller's input is connected to the voltage and current measurements from the SWT
after the rectification stage. The power is then evaluated from these two parameters
and compares with the previous value. The sign of the power determines the duty ratio
output of the MPP controller. The duty ratio of the boost converter represents the
control variable. Perturbing the duty ratio will result in the perturbation of the SWT
current, and consequently, the SWT voltage will be perturbed. The range of the duty

49
ratio is limited between zero and ensures that the converter will step up the input
voltage within the limit.
Figure 3. 13: Boost converter with P&O MPPT controller. (Chen et al., 2013)
The duty ratio must be chosen appropriately. Since the P&O technique oscillates
around the MPP, reducing the duty ratio step can minimise the oscillation and the
steady-state losses. However, the controller is less efficient when the atmospheric
conditions change fast. The following equation expresses the duty ratio (Femia et al.,
2004):
𝜶 𝑻𝒐𝒏𝑻𝒐𝒏 𝑻𝒐𝒇𝒇
𝑻𝒐𝒏𝑻
(3.6)
Equation 3.6 provides the control law produced by the MPPT controller to operate the
SWT at its MPP depending on the wind speeds. In case the operating voltage of the
generator voltage is perturbed in a specific direction, and the perturbation shifts the
operating point toward the MPP. The P&O algorithm would then carry on perturbing the
generator voltage in a similar direction. In the event that the change in operating point
shifts away from the MPP and the P&O algorithm reverses the direction of the
perturbation. Therefore, the system operates by increasing or decreasing the operating
voltage and observing its impact on the output power. The operating voltage is
perturbed with every MPPT cycle. Once the MPP is reached, it will oscillate around the
ideal operating voltage. For instance, if the controller senses that the input power
increases and the voltage, it will decrease the voltage reference close to the MPP.
3.7 Summary
A microgrid can be designed to include various types of renewable sources and energy
storage systems to operate either grid-connected or in standalone mode to provide
power to loads. This chapter dealt with the design considerations of a DC microgrid
based on an SWT. The topics covered in this chapter included a brief investigation on

50
a standalone small wind turbine in DC microgrids, including the site selection, the
technologies, the power electronic converters topologies, and their maximum power
point techniques.

51
CHAPTER FOUR MODEL DESIGN DEVELOPMENTS
4.1 Introduction
4.2 Load Profile as a Backup
4.3 Modelling Development
4.3.1 Wind turbine (aerodynamic) modelling
4.3.2 Model of permeant magnet synchronous generator
4.3.2.1 Steady state generator model
4.3.2.2 Dynamic model of the PMSG
4.4 Power Processing Topologies Applied to Wind Energy Conversion System Based
on PMSG
4.4.1 AC-DC rectifier (Uncontrolled Rectifiers)
4.4.2 Step up DC to DC boost converters
4.4.2.1 Design considerations
4.4.2.2 Voltage and current relationships
4.5 DC-DC of Boost Converter Control with Maximum Power Extraction
4.5.1 Perturb and observe method control strategy
4.6 Summary
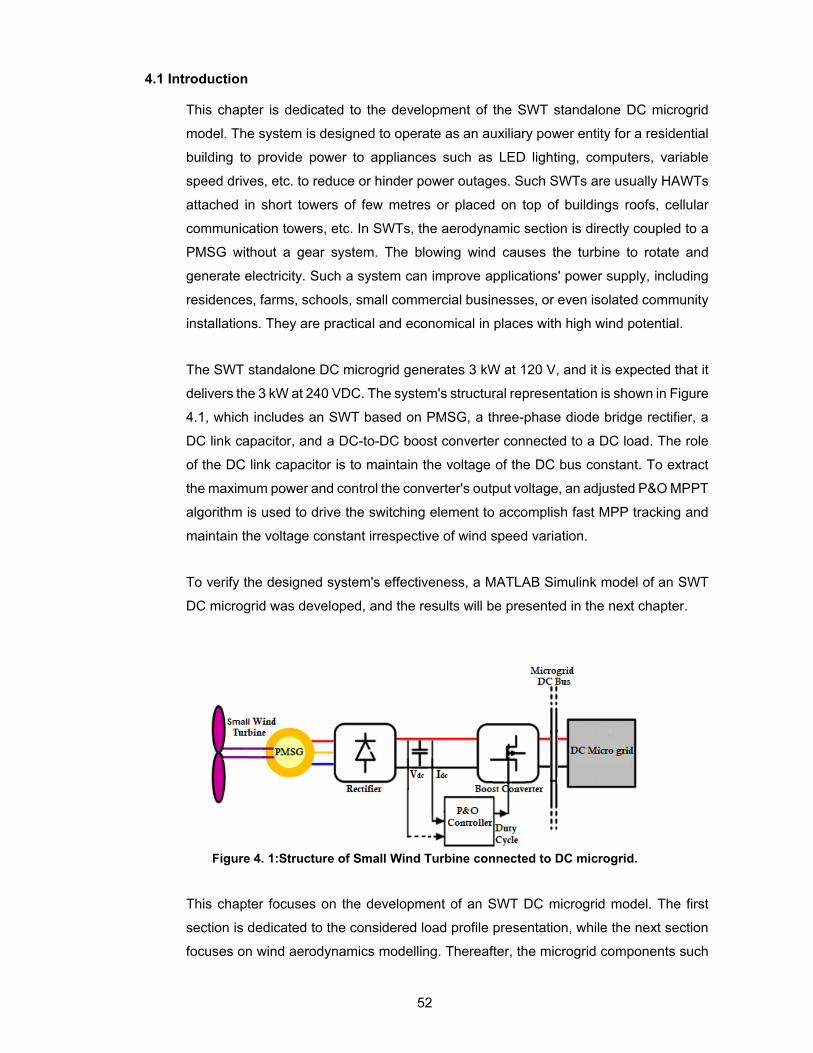
52
4.1 Introduction
This chapter is dedicated to the development of the SWT standalone DC microgrid
model. The system is designed to operate as an auxiliary power entity for a residential
building to provide power to appliances such as LED lighting, computers, variable
speed drives, etc. to reduce or hinder power outages. Such SWTs are usually HAWTs
attached in short towers of few metres or placed on top of buildings roofs, cellular
communication towers, etc. In SWTs, the aerodynamic section is directly coupled to a
PMSG without a gear system. The blowing wind causes the turbine to rotate and
generate electricity. Such a system can improve applications' power supply, including
residences, farms, schools, small commercial businesses, or even isolated community
installations. They are practical and economical in places with high wind potential.
The SWT standalone DC microgrid generates 3 kW at 120 V, and it is expected that it
delivers the 3 kW at 240 VDC. The system's structural representation is shown in Figure
4.1, which includes an SWT based on PMSG, a three-phase diode bridge rectifier, a
DC link capacitor, and a DC-to-DC boost converter connected to a DC load. The role
of the DC link capacitor is to maintain the voltage of the DC bus constant. To extract
the maximum power and control the converter's output voltage, an adjusted P&O MPPT
algorithm is used to drive the switching element to accomplish fast MPP tracking and
maintain the voltage constant irrespective of wind speed variation.
To verify the designed system's effectiveness, a MATLAB Simulink model of an SWT
DC microgrid was developed, and the results will be presented in the next chapter.
Figure 4. 1:Structure of Small Wind Turbine connected to DC microgrid.
This chapter focuses on the development of an SWT DC microgrid model. The first
section is dedicated to the considered load profile presentation, while the next section
focuses on wind aerodynamics modelling. Thereafter, the microgrid components such

53
as the permanent magnet synchronous generator, the full-bridge diode rectifier, and
the DC-to-DC boost converter are modelled. The last section of this chapter covers the
P&O MPPT controller's modelling to track the maximum power while also regulating
the boost converter's output voltage.
4.2 Load Profile
The SWT DC microgrid considered in this study generates 3 kW at 240 VDC. It is
expected to supply electric power to a household, including loads such as LED light,
computer, mobile phone charger, television, printer, coffee maker, fan, radio,
refrigerator, and hairdryer in the event of power cut from the main utility grid. The power
requirement of each appliance, the number of each appliance, and their hours of
operation are given in Table 4.1.
Table 4. 1: DC appliances used in one house.
Type of DC Equipment Power (W) Units Time Per day per unit (hours)
led light 30 6 8 Laptop computer 65 2 5 Mobile phone charger 19 2 6 Television 133 1 6 Printer Laser 15 1 2 Coffee Maker 22 1 1 Fan 72 1 4 Radio 70 1 5 DC refrigerator 2040 1 24 Hair dryer 300 1 1
4.3 Model development
4.3.1 Wind turbine aerodynamic modelling
The relationship between speed and output power of wind turbine is given by the
following equation (Daili et al., 2015):
𝑃 𝜌𝐴𝑉 𝐶 𝜆,𝛽 (4.1)
Where 𝝆 air density at 1 atm equal to 1.225 𝒌𝒈/𝒎𝟑, 𝑨 is the swept area in 𝒎𝟐, 𝑽 is
the wind speed (m/s), 𝑪𝒑 is the power coefficient dependent on 𝝀 given in equation
and 𝜷.
The power coefficient can be modelled as (John & Divya, 2016):
𝑪𝒑 𝝀,𝜷 𝒄𝟏 𝑪𝟐𝝀𝒊
𝒄𝟑𝜷 𝒄𝟒 𝒆𝒄𝟓𝝀𝒊 𝒄𝟔𝝀 (4.1)
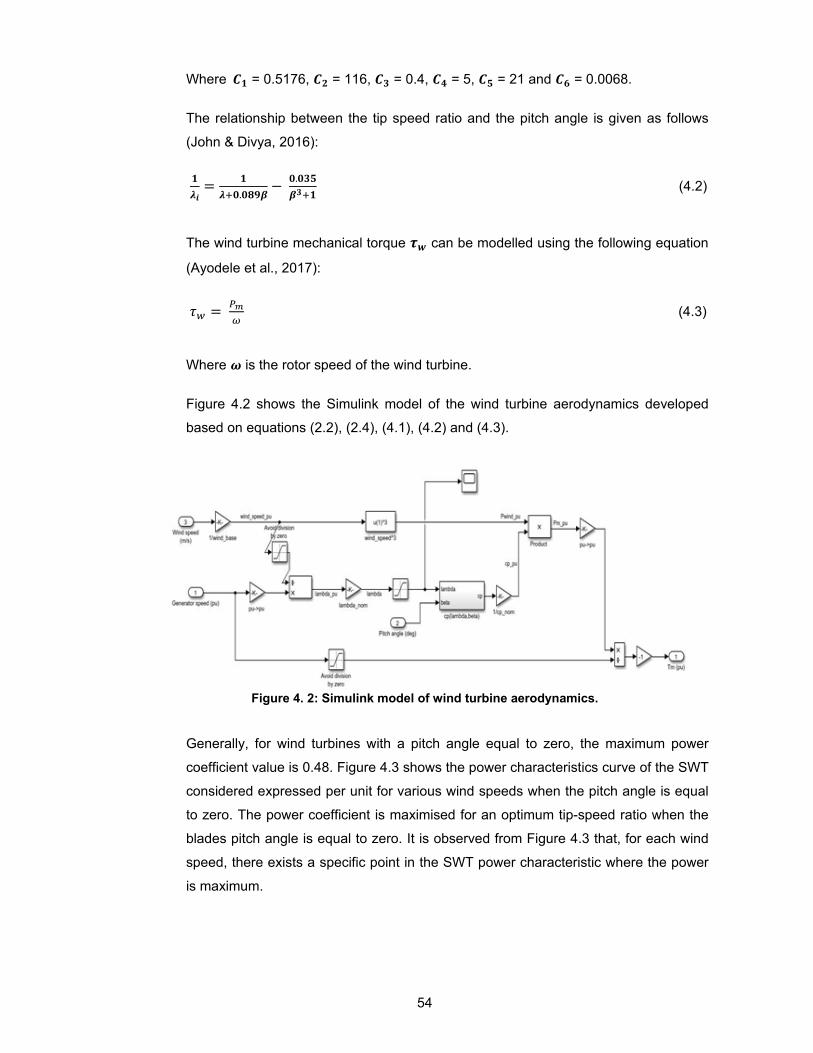
54
Where 𝑪𝟏 = 0.5176, 𝑪𝟐 = 116, 𝑪𝟑 = 0.4, 𝑪𝟒 = 5, 𝑪𝟓 = 21 and 𝑪𝟔 = 0.0068.
The relationship between the tip speed ratio and the pitch angle is given as follows
(John & Divya, 2016):
𝟏
𝝀𝒊
𝟏
𝝀 𝟎.𝟎𝟖𝟗𝜷 𝟎.𝟎𝟑𝟓
𝜷𝟑 𝟏 (4.2)
The wind turbine mechanical torque 𝝉𝒘 can be modelled using the following equation
(Ayodele et al., 2017):
𝜏 (4.3)
Where 𝝎 is the rotor speed of the wind turbine.
Figure 4.2 shows the Simulink model of the wind turbine aerodynamics developed
based on equations (2.2), (2.4), (4.1), (4.2) and (4.3).
Figure 4. 2: Simulink model of wind turbine aerodynamics.
Generally, for wind turbines with a pitch angle equal to zero, the maximum power
coefficient value is 0.48. Figure 4.3 shows the power characteristics curve of the SWT
considered expressed per unit for various wind speeds when the pitch angle is equal
to zero. The power coefficient is maximised for an optimum tip-speed ratio when the
blades pitch angle is equal to zero. It is observed from Figure 4.3 that, for each wind
speed, there exists a specific point in the SWT power characteristic where the power
is maximum.

55
Figure 4. 3: Turbine power characteristic with MPPT.
The value of the tip speed ratio is constant for all maximum power points. The
relationship between the optimum tip speed ratio and the rotational speed of the turbine
𝛀𝒏 is given as (Matayoshi et al., 2018):
𝛀𝒏 𝝀𝒐𝒑𝒕 𝑽𝒏𝑹
(4.5)
Where 𝑽𝒏 is the wind velocity.
4.3.2 PMSG modelling
The dynamic of a PMSG can be represented using mathematical models of voltages,
currents, and rotor speed of the generator. These models are parametric and can be
employed irrespective of generator size. A circuit that describes the generator
behaviour needs to be defined to develop these models, considering variables such as
internal voltage, resistances, and reactance. Thereafter, the models can be
transformed into equivalent circuits in two axis frames. In this section, the PMSG stator
and rotor are modelled in the dq0 axis.
4.3.2.1 Dynamic model of the PMSG
Figure 4.4 shows the phasor diagram of the transformation abc to dq0 in which the d-
axis is aligned with the north pole of the rotor, and the q-axis is 900 ahead of the d-axis
to the direction of rotation.

56
Figure 4. 4: : abc-dq axis.(Chowdhury, 2014)
The PMSG voltage in dq0 reference frame is given by equations In these equations
below (4.6) and (4.7) as (Matayoshi et al., 2018):
𝒗𝒅 𝑹𝒅𝒊𝒅 𝑳𝒅𝒅𝒊𝒅𝒅𝒕
𝑳𝒒𝝎𝒆𝐢𝒒 (4.6)
𝒗𝒒 𝑹𝒒𝒊𝒒 𝑳𝒒𝒅𝒊𝒒𝒅𝒕
𝑳𝒅𝝎𝒆𝒊𝒅 𝛙𝝎𝒆
(4.7)
Whereas the flux is expressed as:
𝛙𝒒 𝑳𝒒𝒊𝒒 (4.8)
𝛙𝒅 𝑳𝒅𝒊𝒅 𝛙𝑷𝑴 (4.9)
where 𝑳𝒅 and 𝑳𝒒 are the inductances of the rotor in d and q axis, 𝑹𝒅 and 𝑹𝒒 are the
resistance of the rotor in d axis and q axis, 𝒊𝒅 and 𝒊𝒒 are the generator currents in d
axis and q axis, 𝛙𝑷𝑴 is the permanent magnet flux and 𝝎𝒆 is the electrical angular
speed of the PMSG which is defined as:
𝝎𝒆 𝒑𝒏𝝎𝒎 (4.10)
Where 𝒑𝒏 is the number of pole pairs of the generator
The electromagnetic torque of the PMSG can be expressed as (Shehata, 2017):
𝑻𝒆 𝟑𝟐
𝒑𝒏 𝑳𝒔𝒅 𝑳𝒔𝒒 𝒊𝒔𝒅𝒊𝒔𝒒 𝛙𝑷𝑴𝒊𝒔𝒒 (4.11)
In case the PMSG surface mounted is considered and the q-axis of the stator current
is assumed to be a round-rotor (𝑳𝒅 = 𝑳𝒒), Equation 4.11 can then be written as:

57
𝑻𝒆 𝟑𝟐
𝒑𝒏𝛙𝑷𝑴𝒊𝒔𝒒 (4.12)
The PMSG equation of motion can be expressed as (Estima, 2012):
𝒅𝝎𝒎
𝒅𝒕 𝟏𝑱
𝑻𝒆 𝑻𝒎 𝑭𝝎𝒎 (4.13)
The active and reactive powers of the PMSG can be expressed as in equations (4.14)
and (4.15) respectively (Urasaki et al., 2004):
𝑷𝒈𝒆𝒏 𝟑𝟐
𝒗𝒔𝒅𝒊𝒔𝒅 𝒗𝒔𝒒𝒊𝒔𝒒
(4.14)
𝑸𝒈𝒆𝒏 𝟑𝟐
𝒗𝒔𝒒𝒊𝒔𝒅 𝒗𝒔𝒅𝒊𝒔𝒒
(4.15)
4.4 Power electronics modelling
In general, electronic power devices' role is to efficiently manage and control the flow
of electric power by providing voltages and currents using semiconductor devices to fit
the load requirements best. A control system for power electronics usually consists of
linear combined circuits and/or digital signal processors. The power conversion output
usually compares the feedback controller unit to the required or reference value, and
the controller reduces the error between the two. The flow of power in a power
electronic unit can involve a reversible state change when sufficient semiconductor
devices are used, thus exchanging roles between inputs and outputs. This section
covers the modelling of the rectifier as well as the modelling of the boost converter.
4.4.1 AC-to-DC converter modelling
Uncontrolled three-phase rectifiers are three-phase converters that use diodes to
supply power to a DC circuit from an AC source. They consist of two diodes in each
arm, with a total number of three arms. Figure 4.7 shows the circuit of a three-phase,
full-wave diode bridge rectifier.

58
Figure 4. 5: Three-phase, full-bridge diode rectifier with PMSG. (Rahimi, 2017)
The average output voltage of the rectifier is given by the following equations (Fan et
al., 2011):
𝑽𝒐 𝟏𝝅𝟑
√𝟔𝝅𝟔
𝝅𝟔
𝑽𝑳𝑳𝒄𝒐𝒔 𝝎𝒕 𝒅 𝝎𝒕
(4.16)
𝑽𝒐 𝟑 √𝟐
𝝅 𝑽𝑳𝑳 (4.17)
where 𝑽𝑳𝑳 is the phase to phase nominal voltage.
4.4.2 DC-to-DC boost converter
The purpose of designing a DC-to-DC boost converter (Figure 4.6) is to provide a
regulated DC output voltage to the constant load of the SWT standalone DC microgrid
from a fluctuating DC input voltage. The DC-to-DC boost converter can increase the
voltage while decreasing the current and keeping the same power at the output side.

59
Figure 4. 6: DC-to-DC Boost Converter. (Subbiah & Neelaveni, 2017)
4.4.2.1 Design considerations
Most boost converters are designed for continuous-current operation. The inductance
to give continuous current is given by equation (4.26), and equations express the output
voltage ripple. (4.28) and (4.31).
High switching frequencies are desirable to reduce the size of both the inductor and
the capacitor as the inductor's minimum size to produce continuous current and the
minimum size of the capacitor to limit output ripple both decreases with the increase of
the switching frequency. However, high switching frequencies can increase power loss
in the switches, decreasing the converter's efficiency. Typical switching frequencies are
greater than 20 kHz to avoid audio noise and go up to MHz ranges. Some designers
consider switching frequencies around 500 kHz to be the best trade-off between small
component size and efficiency. In contrast, others prefer to use switching frequencies
of around 50 kHz to keep switching losses lower, while some still use frequencies
above 1 MHz.
4.4.2.2 Voltage and current relationships
Assumption made in this section include the following:
1. Steady-state conditions exist.
2. The switching period is 𝑻, and the switch is closed for time 𝑫𝑻 and open for
𝟏 𝑫 𝑻.
3. The inductor current is continuous (always positive).
4. The capacitor is very large, and the output voltage is kept constant at voltage
𝑽𝟎.
5. The components are ideal.
The relationship between the boost convert voltage and current in Figure 4.7 is
investigated by examining the inductor voltage and current when the switch is closed
and when it is the switch open.

60
Figure 4. 7: The boost converter. (a) Circuit; (b) Equivalent circuit when the switch is closed; (c)
Equivalent circuit when the switch is open. (W. Hart Danial, 2011)
When the switch is closed (Figure 4.7c), the diode is reverse-biased, and the Kirchhoff’s
voltage law can be written as:
𝑽𝑺 𝑳 𝒅𝒊𝑳𝒅𝒕
(4.18)
The current variation rate is constant; hence, the current will increase linearly, as
depicted in Figure 4.8b. The variation in inductor current is expressed by equations
(4.19) and (4.20) as:
𝜟𝒊𝑳𝜟𝒕
𝜟𝒊𝑳𝑫𝑻
𝑽𝑺𝑳
(4.19)
𝜟𝒊𝑳 𝒄𝒍𝒐𝒔𝒆𝒅𝑽𝑺𝑫𝑻
𝑳 (4.20)

61
Figure 4. 8: (a) Inductor voltage and (b) current; (c) Diode and (d) Capacitor currents. (W. Hart
Danial, 2011)
When the switch is opened, the inductor current cannot vary instantaneously. Hence,
the diode is forward-biased, and the voltage across the inductor and the variation of
the inductor current are given as:
𝒗𝑳 𝑽𝑺 𝑽𝑶 𝑳 𝒅𝒊𝑳𝒅𝒕
(4.21)
𝒅𝒊𝑳𝒅𝒕
𝑽𝑺 𝑽𝑶𝑳
(4.22)
The rate of variation of inductor current is a constant, hence, the current varies linearly
while the switch is open. The variation in inductor current is expressed in equations
(4.23) and (4.24) as follows (W. Hart Danial, 2011):
𝜟𝒊𝑳𝜟𝒕
𝜟𝒊𝑳𝟏 𝑫 𝑻
𝑽𝑺 𝑽𝑶𝑳
(4.23)
𝜟𝒊𝑳 𝒐𝒑𝒆𝒏𝑽𝑺 𝑽𝑶 𝟏 𝑫 𝑻
𝑳 (4.24)
For steady-state operation, the net variation in inductor current is equal to zero, and
the output voltage of the converter is given as:
𝑽𝑶𝑽𝑺𝟏 𝑫
(4.25)

62
As the switch's duty ratio gets to 1, the converter's output voltage tends to infinity.
However, real components always have losses that prevent such an occurrence.
Figure 4.8 shows the inductor voltage and current and the diode and Capacitor currents
voltage and current for the boost converter. The average current in the inductor is
evaluated by recognising that the source's average power is equal to the average
power absorbed by the load. Therefore, the output power can be determined as:
𝑷𝑶𝑽𝑶𝟐
𝑹𝑽𝑶𝑰𝑶 (4.26)
The average inductor current can be expressed as:
𝑰𝑳𝑽𝑺
𝟏 𝑫 𝟐𝑹
𝑽𝑶𝟐
𝑽𝒔𝑹
𝑽𝑶𝑰𝑶𝑽𝒔
(4.27)
The maximum inductor current 𝑰𝒎𝒂𝒙 and the minimum inductor current 𝑰𝒎𝒊𝒏 are
expressed as follows:
𝑰𝒎𝒂𝒙 𝑰𝑳𝜟𝒊𝑳𝟐
𝑽𝑺𝟏 𝑫 𝟐𝑹
𝑽𝑺𝑫𝑻
𝟐𝑳 (4.28)
𝑰𝒎𝒊𝒏 𝑰𝑳𝜟𝒊𝑳𝟐
𝑽𝑺𝟏 𝑫 𝟐𝑹
𝑽𝑺𝑫𝑻
𝟐𝑳 (4.29)
A boost converter designed for continuous-current operation must have an inductor
value greater than 𝑳𝒎𝒊𝒏. The minimum inductance for continuous current in the boost
converter is given as:
𝑳𝒎𝒊𝒏𝑫 𝟏 𝑫 𝟐𝑹
𝟐𝒇 (4.30)
The inductance 𝑳 can be expressed in terms of a desired variation in the inductor
current 𝜟𝒊𝑳 as (W. Hart Danial, 2011):
𝑳 𝑽𝑺𝑫𝑻
𝜟𝒊𝑳
𝑽𝑺𝑫
𝜟𝒊𝑳𝒇 (4.31)
4.4.2.3 Voltage ripples
The preceding equations assumed that the output voltage is constant, which implies
an infinite capacitance. Practically, a finite capacitance will cause fluctuation in output
voltage or ripples. The peak-to-peak voltage ripple can be evaluated from the capacitor
current in Figure 4.8d.

63
The variation in capacitor voltage can be determined as:
∆𝑽𝑶𝑽𝑶
𝑫
𝑹𝑪𝒇 (4.32)
where 𝒇 is the switching frequency.
Therefore, the capacitance can be expressed in terms of voltage ripples as (W. Hart
Danial, 2011):
𝒄 𝑫
𝑹 ∆𝑽𝑶/𝑽𝑶 𝒇 (4.33)
The equivalent series resistance (ESR) of the capacitor can significantly impact the
voltage ripple. The peak-to-peak variation in capacitor current in Figure 4.10d is similar
to the inductor's maximum current.
The voltage ripple because of the ESR is given as (W. Hart Danial, 2011):
∆𝑉 , ∆𝑖 𝑟 𝐼 , 𝑟 (4.34)
4.5 Boost converter control for maximum power extraction
To extract optimum power under fluctuating wind speeds, the generator speed must be
regulated through the converter switch's control. The control of the converter, in this
case, is achieved using the MPPT algorithm based on the P&O method because of its
simplicity and ease of implementation structure. The duty ratio is automatically varied
to generate the voltage required to extract maximum power.
The SWT output power 𝑷𝒘 can be written as as:
𝑷𝒘 𝑽𝒘 𝑰𝒘 (4.35)
Where 𝑽𝒘 and 𝑰𝒘 are the voltage and the current of the SWT respectively.
The relationship between the SWT voltage 𝑽𝒘 and DC link voltage 𝑽𝒅𝒄 is given by the
following equation (K. Kumar et al., 2017):
𝑉 𝑉 (4.36)
4.5.1 Perturb and observe method control strategy
The SWT's voltage and current are measured, as shown in Figure 4.9, and used as
inputs to the MPPT controller. These values are then processed based on the P&O

64
algorithm to track the maximum power. The signal from the P&O MPPT controller is
used as input to the boost converter to keep the operating voltage at the MPP by
modifying the converter's duty ratio. A small perturbation is introduced in the system to
cause a variation of power of the SWT. If the power increases because of the
perturbation, the perturbation will carry on in the same direction. Once the maximum
power is reached, the power at the next instant reduces, and the perturbation reverses.
At the steady-state, the algorithm will oscillate around the MPP. To keep the power
variation small, the perturbation size is kept small.
Figure 4. 9: Perturb and observe method to regulate the voltage on the DC microgrid.
Figure 4.10 shows the flowchart of the developed algorithm; the SWT's operating
voltage is perturbed by a small increase of dV, resulting in a change dP. If dP is positive,
the operating voltage's perturbation is kept in a similar direction as the small increase.
In contrast, if dP is negative, the operating point shifts away from the MPP, and the
operating voltage must shift in the opposite direction of the small increase.
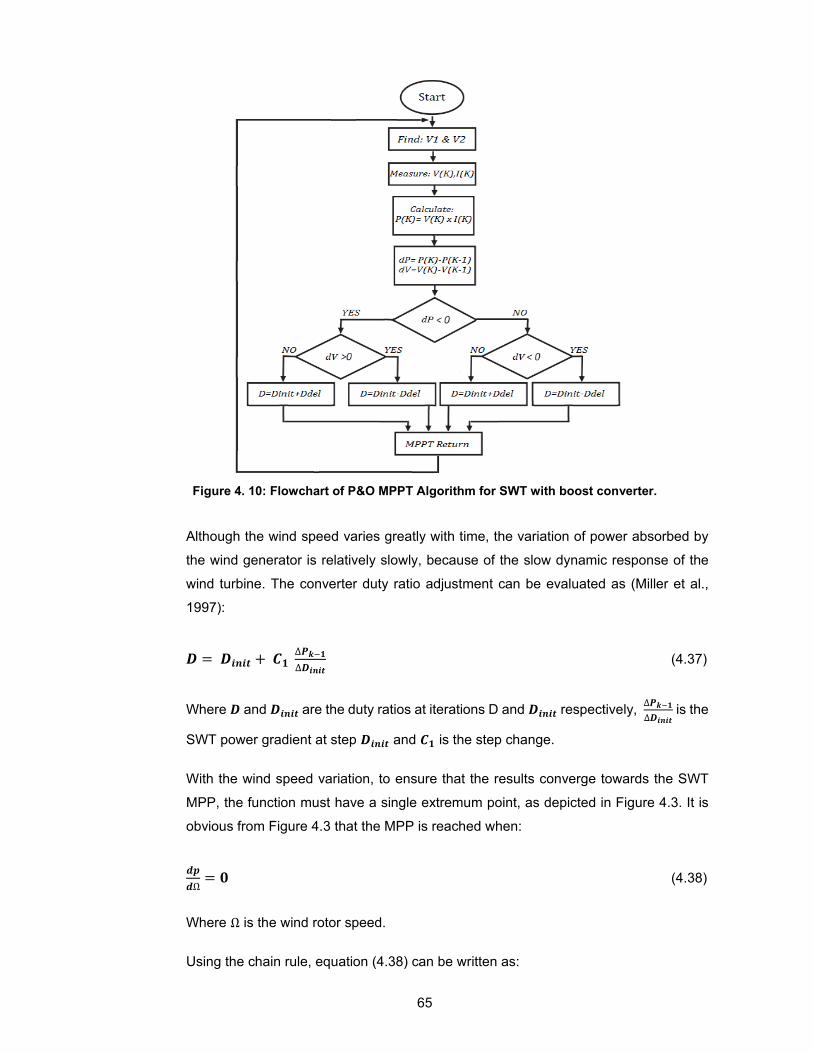
65
Figure 4. 10: Flowchart of P&O MPPT Algorithm for SWT with boost converter.
Although the wind speed varies greatly with time, the variation of power absorbed by
the wind generator is relatively slowly, because of the slow dynamic response of the
wind turbine. The converter duty ratio adjustment can be evaluated as (Miller et al.,
1997):
𝑫 𝑫𝒊𝒏𝒊𝒕 𝑪𝟏 ∆𝑷𝒌 𝟏
∆𝑫𝒊𝒏𝒊𝒕 (4.37)
Where 𝑫 and 𝑫𝒊𝒏𝒊𝒕 are the duty ratios at iterations D and 𝑫𝒊𝒏𝒊𝒕 respectively, ∆𝑷𝒌 𝟏
∆𝑫𝒊𝒏𝒊𝒕 is the
SWT power gradient at step 𝑫𝒊𝒏𝒊𝒕 and 𝑪𝟏 is the step change.
With the wind speed variation, to ensure that the results converge towards the SWT
MPP, the function must have a single extremum point, as depicted in Figure 4.3. It is
obvious from Figure 4.3 that the MPP is reached when:
𝒅𝒑
𝒅Ω𝟎 (4.38)
Where Ω is the wind rotor speed.
Using the chain rule, equation (4.38) can be written as:

66
𝒅𝒑
𝒅Ω
𝒅𝒑
𝒅𝑫. 𝒅𝑫
𝒅𝑽𝑺𝑾𝑻. 𝒅𝑽𝑺𝑾𝑻
𝒅Ω𝒆. 𝒅Ω𝒆𝒅Ω
𝟎 (4.39)
Where 𝑽𝑺𝑾𝑻 is the rectifier output voltage and Ω𝒆 is the generator phase angular speed.
The power maximisation process is shown in Figure 4.13; because the duty ratio
adjustment follows the 𝒅𝑷
𝒅𝑫 direction, its value is increased in the high-speed zone of the
SWT characteristic curve, resulting in a rotor speed decrease and power increase the
MPP is reached. Similarly, in case the starting point is in the low-speed zone, following
the direction of 𝒅𝑷
𝒅𝑫, the duty ratio decreases and subsequently converges towards the
MPP since the SWT rotor speed is gradually increased.
𝑽𝑺𝑾𝑻 𝟏 𝑫 𝑽𝑶,𝒅𝑽𝑺𝑾𝑻
𝒅𝑫𝑽𝑶 𝟎 (4.40)
Figure 4. 11: MPPT Process diagram. (Padmanabhan & Kaliyappan, 2014)
As shown in Figure 4.11, the algorithm considers the voltage measurements V[k] and
the current measurements I[k] at a predetermined time interval, referred to as the MPPT
period. This time span governs how often the algorithm decides to vary the system
operating point. Subsequently, the algorithm assesses the power P[k], the variation in
power ΔP, and voltage ΔV. The ΔP and ΔV values are determined by using the
measurements at the present instant V[k] and I[k] as well as the previous
measurements V[k-1] and I[k-1]. Then, the algorithm uses basic logic to decide what to
do. The ΔP and ΔV values are each compared against zero to determine if they have
risen or dropped. Table 4.2 shows the summary of the P&O algorithm. Thus, in this
way, the SWT curve is checked by small perturbations to find the MPP that raises the
algorithm's response time. Conversely, if the perturbation size is enlarged, it generates
steady-state oscillations about the MPP. Many researchers have proposed

67
modifications in the P&O algorithm to overcome the response time problem and steady-
state oscillations (Kamran et al., 2018). According to the algorithm, the output resulting
perturbation is used to drive either the duty ratio or the reference voltage. To
summarize, if the power goes up after a certain perturbation, the next perturbation
should remain unchanged; however, if the power goes down, the resulting perturbation
should be in the opposite direction (Esram & Chapman, 2007).
Table 4. 2: P&O algorithm.
Perturbation ΔP Resulting
+Ve -Ve +Ve +Ve +Ve -Ve -Ve -Ve +Ve -Ve +Ve -Ve
Any change in the duty ratio will have an inverse effect on the converter's input
resistance and, hence, have an inverse effect on the operating voltage. The algorithm
then observes the effect of that change in the duty cycle on the output power to
determine the next cycle's appropriate command. The output power can increase or
decrease depending on whether the current operating voltage level is before or after
the power graph's knee point, as shown in Figure 4.13. If the operating level is beyond
the knee point or the MPP, then an increase in the voltage will decrease the output
power and vice versa. For instance, a decrease in the duty cycle causes an increase
in input resistance or operating voltage and increases the output power. This means
that the current operating level is before the MPP. By increasing the voltage, the output
power will increase. Thus, in the next duty cycle, the algorithm will increase the voltage,
which can be achieved by reducing the duty cycle.
4.6 Summary
This part focused on with the development of an SWT DC microgrid model. The first
section was dedicated to the considered load profile presentation, while the next
section focused on wind aerodynamics modelling. Thereafter, the microgrid
components such as the permanent magnet synchronous generator, the full-bridge
diode rectifier, and the DC-to-DC boost converter were modelled. The last section of
this chapter covered the P&O MPPT controller's modelling to track the maximum power
while also regulating the boost converter's output voltage.

68
CHAPTER FIVE IMPLEMENTING THE P&O METHOD FOR A SMALL WIND TURBINE
5.1 Introduction
5.2 An overview system description of block diagram of the wind turbine system in
MATLAB/Simulink
5.2.1 Small wind turbine model
5.2.2 Electrical system model
5.2.3 Control simulation model
5.3 Results and discussion
5.3.1 Wind Turbine Model Analysis
5.3.2 Permanent Magnet Synchronous Generator Model Analysis
5.3.3 DC-DC Step up Converter Model with P&O technique Analysis
5.4 Case Studies
5.5 Summary

69
5.1 Introduction
Figure 5.1 shows the layout of the small wind turbine DC microgrid considered in this
thesis. It consists of an SWT based on PMSG, a three-phase diode rectifier, a P&O
MPPT controller, a DC-to-DC boost converter, and a DC load. This research aims to
develop a modified P&O MPPT controller to achieve a constant output voltage and
power at the output of the boost converter. The parameters of the SWT DC microgrid
are given in Tables 5.1 and 5.2. The system is considered to operate under variable
wind speeds. Therefore, the variable voltage and current obtained from the wind turbine
are used as inputs to the diode rectifier to converts the SWT variable output AC voltage
to DC voltage. After rectification, a boost converter increases the voltage to a higher
regulated DC voltage level suitable for the load. The voltage and current from the boost
converter's input terminals are used as inputs to the P&O MPPT controller. The voltage
and current are continuously used to evaluate the duty ratio, which is then fed to the
boost converter. According to the duty ratio, the boost converter controls the voltage
level to keep tracking the maximum power point at all times. Finally, the boost
converter's output is then connected to a resistive load, which acts as a demand-side
load of the DC microgrid.
Table 5. 1: Wind turbine and PMSG system parameters.
Description Rating
Rated Power (P) 3 kW
Output Voltage (Vout) 120 V
Air density (ρ) 1.225 kg/𝑚3 Impedance (R𝑎) 0.9585 Ω
Inductance (L𝑞 and L𝑑) 5.25 mH
Blade length radius 1.76 m Magnetizing flux (Øm) 0.16616 wb Coefficient of friction (B) 0 Pair of Poles (P𝑝) 4
Torque/Current (T/A) 0.99696 Nm/A Cut-in wind speed (V𝑑) 5 m/s
Rated wind speed ( V𝑛 ) 12 m/s
Moment of inertia (J) 0.0006329 kg/m2
viscous damping (F) 0.0003035 (N.m.s) Pitch angle (β) 0 degree

70
Table 5. 2: Boost converter parameter specifications
Description Ratings
Converter power P= 3 kW Input Voltage Vin =120 V Output Voltage Vout = 240 V Boost Inductor L = 1.263x10⁻⁸H DC Link Capacitors C = 260.4 μF Load Resistance R = 19.2 Ω Switching frequency fs = 10 kHz peak-to-peak inductor current 0.4 A Output capacitance ripple 0.01 % Output Voltage ripple 0.04 % Sample time Ts=50x10-6 s Capacitance ripple 0.01%
5.2 An overview system description of block diagram of the wind turbine system
Figure. 5.1 shows the layout of the DC microgrid considered in this research. The
system consists of a small wind turbine generating 3 kW AC power at 120 V. This power
is then rectified using a full-bridge three-phase diode rectifier. At the rectifier's output
terminal, a DC link capacitor is connected to keep a stable voltage. The DC-link
capacitor is connected to the boost converter's input terminals to boost the voltage from
120 V to 240 V. Then, the boost converter supplies power to a DC load connected to
its output terminals.
Figure 5. 1: SWT with PMSG and DC-to-DC converter model.
5.2.1 Small wind turbine model
The wind turbine was modelled using the mathematical equations was presented in
chapter four. The quantity of power that a small wind turbine can extract from the wind
is dependent on the turbine design. Factors such as the rotor diameter and the wind
speed affect the power that a turbine can extract from the wind.
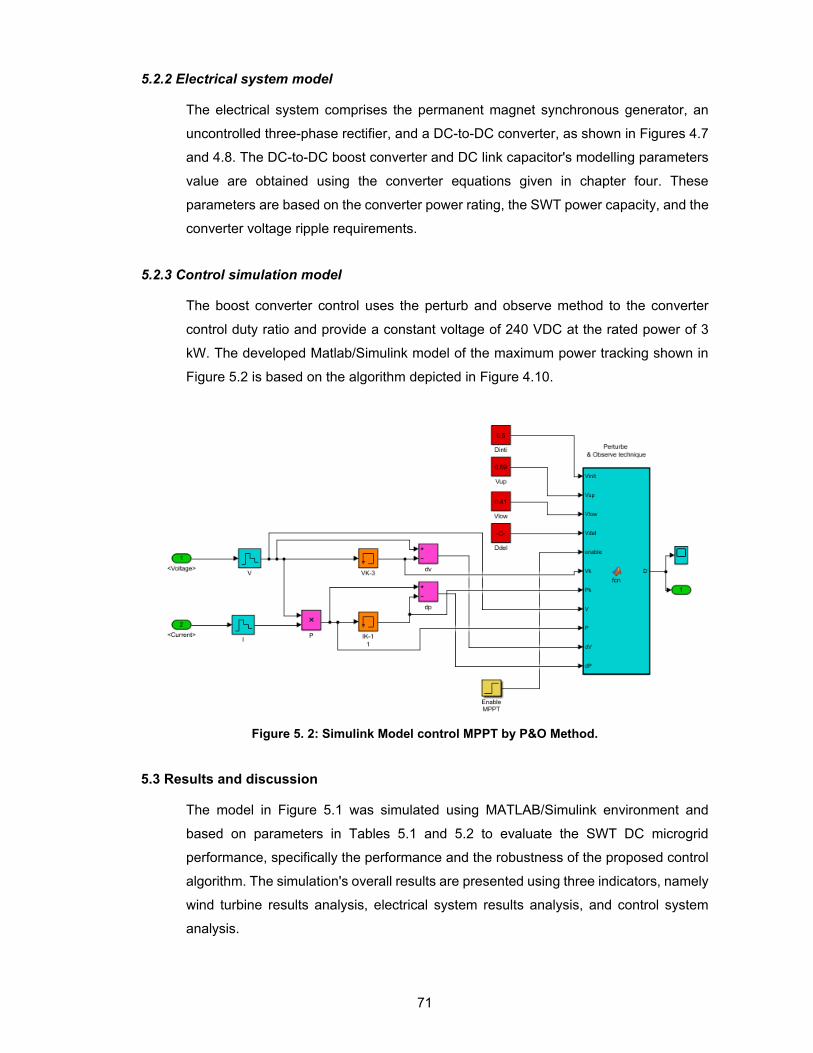
71
5.2.2 Electrical system model
The electrical system comprises the permanent magnet synchronous generator, an
uncontrolled three-phase rectifier, and a DC-to-DC converter, as shown in Figures 4.7
and 4.8. The DC-to-DC boost converter and DC link capacitor's modelling parameters
value are obtained using the converter equations given in chapter four. These
parameters are based on the converter power rating, the SWT power capacity, and the
converter voltage ripple requirements.
5.2.3 Control simulation model
The boost converter control uses the perturb and observe method to the converter
control duty ratio and provide a constant voltage of 240 VDC at the rated power of 3
kW. The developed Matlab/Simulink model of the maximum power tracking shown in
Figure 5.2 is based on the algorithm depicted in Figure 4.10.
Figure 5. 2: Simulink Model control MPPT by P&O Method.
5.3 Results and discussion
The model in Figure 5.1 was simulated using MATLAB/Simulink environment and
based on parameters in Tables 5.1 and 5.2 to evaluate the SWT DC microgrid
performance, specifically the performance and the robustness of the proposed control
algorithm. The simulation's overall results are presented using three indicators, namely
wind turbine results analysis, electrical system results analysis, and control system
analysis.

72
5.3.1 Wind turbine results
The system is simulated for different wind speeds. Simultaneously, the output voltage
at the boost converter terminals is maintained constant and as close as possible to the
maximum voltage based on the wind speed. This is done to evaluate the performance
of the proposed MPPT control algorithm. Figure 5.3 shows the wind speed profile used
as a function of time; four different wind speeds are considered in the simulation. The
initial wind speed is 5 m/s, then after the speed is increased to 7 m/s, then after a short
lapse of time, the speed goes up to 11 m/s and finally to 12 m/s.
For each wind speed, the turbine's rotor speed will drive the generator to yield
maximum power. The system is expected to generate the rated power of 3 kW when
the wind speed is equal to 12 m/s. Hence, for wind speeds lower than the rated value,
the SWT DC microgrid generates power lower than the rated power of 3 kW. The
turbine mechanical power will then follow the optimum power curve with a slight
overshoot when wind speed varies, and the generator can extract maximum power
under variable wind speeds. The simulation is carried out for a duration of 3 s. A step
change of 0.05 s is introduced to vary the speed from 5 m/s to 12 m/s. Thereafter, the
speed is kept constant.
Figure 5. 3: Variable wind speed.
While the wind speed is increasing, it can also be observed an increase of power
generated, resulting in an increase of the power at the boost converter's output terminal
(voltage and current). When the wind speed is 5 m/s, the SWT's AC output power is
around 860 W. This power is then rectified to obtain DC power. The boost converter
interfaced between the rectifier and load increases the DC power voltage to a
corresponding maximum voltage based on the MPPT algorithm. Once the wind speed
reaches 7 m/s, the SWT's output power increases to 1.4 kW. At this power, the AC

73
output voltage of the SWT is around 80 V. After rectification, the boost converter
increases the voltage of the DC power to obtain its corresponding maximum voltage
based on the MPPT algorithm. Once the wind speed rises to 11 m/s, the output power
of the SWT increases to 1.74 kW, and the voltage goes up to 99.5 V. This voltage is
then rectified and boost to allow the connection of the DC load. At the rated wind speed
of 12 m/s, the power reaches 3 kW at an AC voltage of 114 V AC, rectified to DC, then
boosted to about 240 V.
Figure 5.4 shows the SWT pitch angle curve as a function of time. As indicated in Table
5.1, the pitch angle value was selected to be zero degrees as it is the case for most
small wind turbines. In Figure 5.4, it can also be seen that the pitch angle remains
constant and equal to zero degrees for all duration of the simulation.
Figure 5. 4: Pitch angle.
5.3.2 SWT results
The output voltage at the terminals of the SWT is depicted in Figure 5.5; the signal
exhibits an undershoot of 2 %, which represents the distortion of the voltage signal
below its steady-state value and the overshoot which refers to the distortion of the
voltage signal above its steady-state value is 0.456 %. At the same time, the rise time
is 146.362 ms. From the initial state at t = 0 s to t= 0.039 s, the voltage rises to 40.5V,
then, at time t = 0.053 s increases again to 56.55 V, and finally, the steady-state voltage
of 114 V is reached at time t = 0.4 s.

74
Figure 5. 5: SWT voltage.
Figure 5.6 shows the rotor rotational speed expressed in rad/s; the signal displays an
overshoot and an undershoot of 1.581 % and 0.862 %, respectively, while the rise time
is 99.98 m/s. The initial wind speed is 5 m/s, which occurs between t = 0 s and t= 0.05
s. At that wind speed, the rotational speed of the rotor is around 131.8 rad/s, between
t = 0.05 s and t = 0.1 s, the wind speed goes up to 7 m/s, causing the rotor speed to
rise to 185.6 rad/s, between t = 0.1 s and t = 0.15 s, the wind speed increases to 11
m/s and as a result, the rotor rotational speed reaches 293.2 rad/s and lastly, from t =
0.2 s. In contrast, the wind speed is 12 m/s, the rotor speed increases to 320 rad/s.
Figure 5. 6: SWT rotor rotational speed.
The line to line voltage at the output terminals of the SWT is shown in Figure 5.7; at
steady, which occurs at time t = 0.25 s, the line voltage is around 120 Vac. This signal
is used as an input for the rectifier.

75
Figure 5. 7: SWT line to line voltage.
The PMSG stator current distortion occurs before the time t = 0.15 s. Thereafter, the
stator current remains steady at around 25 A, after an overshoot of 0.995 %, as shown
in Figure 5.8. The current varies with the variation of the wind speed. For the wind
speed equal to 5 m/sec, the current is approximately 15 A, and for the wind speed
equal to 11 m/sec, the current around 29.9 A.
Figure 5. 8: PMSG Stator Current.
5.3.3 DC-to-DC boost converter results analysis
The boost converter input terminal receives 3 kW DC power from the full-bridge three-
phase diode rectifier at 120 V. Figure 5.9 shows both the boost converter inductance
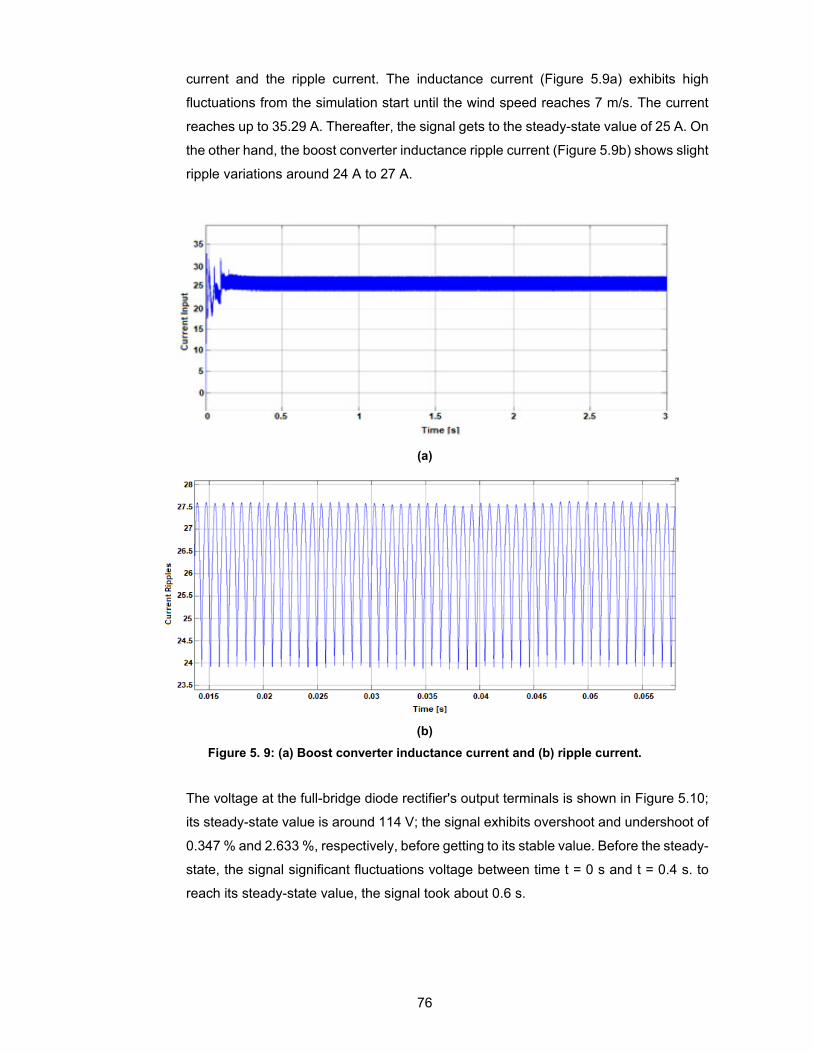
76
current and the ripple current. The inductance current (Figure 5.9a) exhibits high
fluctuations from the simulation start until the wind speed reaches 7 m/s. The current
reaches up to 35.29 A. Thereafter, the signal gets to the steady-state value of 25 A. On
the other hand, the boost converter inductance ripple current (Figure 5.9b) shows slight
ripple variations around 24 A to 27 A.
(a)
(b)
Figure 5. 9: (a) Boost converter inductance current and (b) ripple current.
The voltage at the full-bridge diode rectifier's output terminals is shown in Figure 5.10;
its steady-state value is around 114 V; the signal exhibits overshoot and undershoot of
0.347 % and 2.633 %, respectively, before getting to its stable value. Before the steady-
state, the signal significant fluctuations voltage between time t = 0 s and t = 0.4 s. to
reach its steady-state value, the signal took about 0.6 s.

77
Figure 5. 10: Boost converter input voltage.
The duty ratio provided by the MPPT controller based on Perturb and Observe
algorithm is depicted n figure 5.11; this duty ratio represents the on-state and off-state
periods used to drive the boost converter switch to reach the MPP. It can be seen from
the figure that depending on the operating conditions, and the MPPT controller provides
a varying duty ratio between 0.4998 to 0.5002.
Figure 5. 11: Duty Cycle using the P&O MPPT algorithm.
The boost converter's output current is depicted in Figure 5.12; it is characterised by
an overshoot of 0.774 % and an undershoot of 2.131 %, while the rise time is 126.918
ms. The steady-state value of the current (12.5 A) occurs at 0.4 s and corresponds to
a wind speed of 12 m/s. Initially, this current is equal to 4.26 A when the wind speed is

78
5 m/s between t =0 s and t= 0.05 s, thereafter, with the variation of the wind speed to
7 m/s between t = 0.1 s and t = 0.15 s, the current increases to 8.88 A, afterward, the
wind speed varies again to 11 m/s between time t = 0.15 s and t = 0.2 s, and the current
increases to 11 A until it gets to its steady-state value of 12.5 A.
Figure 5. 12: Boost converter output Current.
The boost converter's output voltage is depicted in Figure 5.13; it is characterised by a
rise time is 138.532 ms. The steady-state value of the voltage (240 V) occurs at 0.4 s
when the duty ratio is 0.5 and corresponds to a wind speed of 12 m/s. Initially, this
voltage is equal to 81.78 V when the wind speed is 5 m/s between t =0 s and t= 0.05
s, thereafter, with the variation of the wind speed to 7 m/s between t = 0.1 s and t =
0.15 s, the voltage increases to 117.5 V, afterward, the wind speed varies again to 11
m/s between time t = 0.15 s and t = 0.2 s, and the voltage increases to 211.5 V until it
gets to its steady-state value of 240 V.
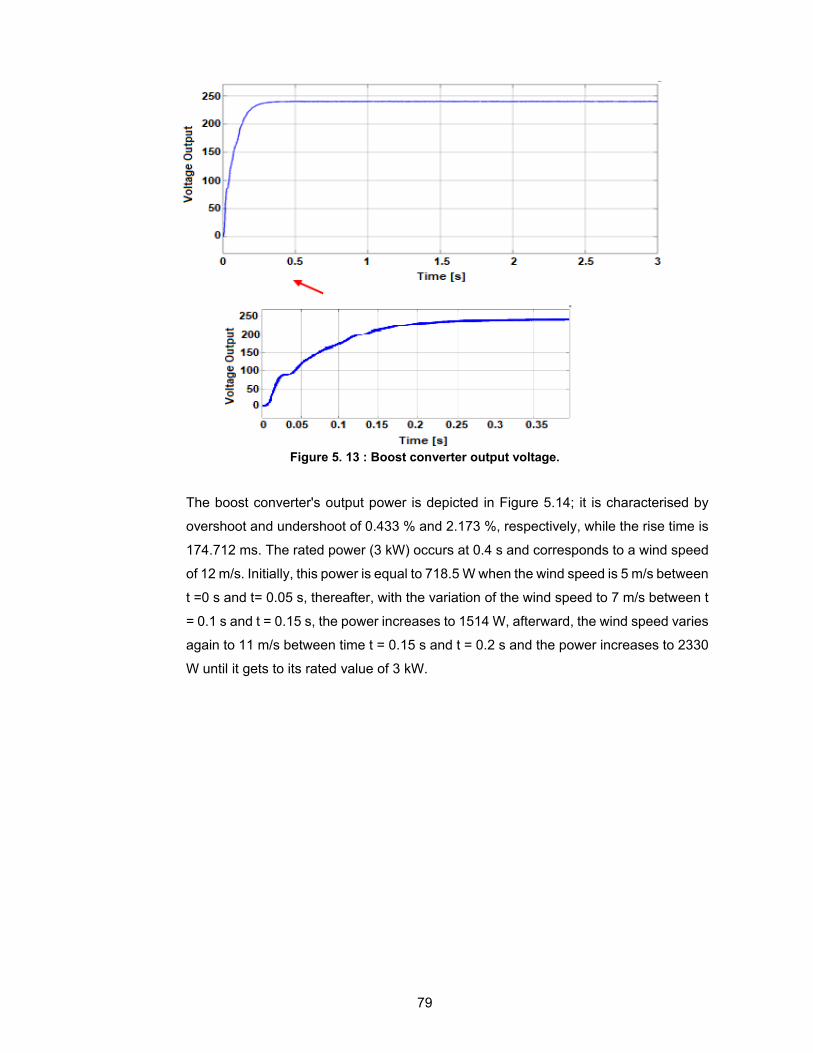
79
Figure 5. 13 : Boost converter output voltage.
The boost converter's output power is depicted in Figure 5.14; it is characterised by
overshoot and undershoot of 0.433 % and 2.173 %, respectively, while the rise time is
174.712 ms. The rated power (3 kW) occurs at 0.4 s and corresponds to a wind speed
of 12 m/s. Initially, this power is equal to 718.5 W when the wind speed is 5 m/s between
t =0 s and t= 0.05 s, thereafter, with the variation of the wind speed to 7 m/s between t
= 0.1 s and t = 0.15 s, the power increases to 1514 W, afterward, the wind speed varies
again to 11 m/s between time t = 0.15 s and t = 0.2 s and the power increases to 2330
W until it gets to its rated value of 3 kW.

80
Figure 5. 14: Boost Converter Output Power Under Varying Conditions Using P&O MPPT.
5.4 Case Studies
Based on the control of the boost converter, two case studies are considered to
evaluate the adopted control algorithm's effectiveness and robustness. In the first case,
the system is simulated without an MPPT controller to drive the boost converter, and
the second case SWT model under constant speed condition considers the control of
the boost converter using an MPPT control based on the P&O algorithm.
5.4.1 Case study one: SWT model without using Perturb & Observe algorithm
This case study considered the SWT DC microgrid operation without an MPPT control
for the boost converter. The system is simulated for different wind speeds; the initial
wind speed is 5 m/s, then after the speed is increased to 7 m/s, then, after a short lapse
of time, the speed goes up again to 11 m/s and finally to 12 m/s. The results obtained
from this scenario are depicted in Figure 5.15. The current signal (Figure 5.15a)
displays an overshoot of 9.894 % and an undershoot of 9.657 % between t = 0 s and t
= 3 s. The current resulting from the simulation was about 13.38 A. However, this
current varied between 13.33 and 14.16 A with a rise time of 5.48 m/s.
On the other hand, as shown in Figure 5.15b, the output voltage magnitude at the load
end is around 256.9 V. The signal exhibits a rise time of 54.79 ms, while the fall time
was 0 ms. Additionally, the overshoot and undershoot were 9.89 % and 9.65 %,
respectively. The rated power of the SWT DC microgrid is 3 kW. However, this case
study's simulation results show that the power received at the output terminals of the
boost converter is about 3.411 kW. In contrast, it shows that the SWT DC microgrid's

81
rated power is around 3.848 kW (Figure 5.15c). The power signal displays a rise time
of 73.522 ms, while the overshoot is 13.03 % and undershoot 9.39 %.
The rated output voltage at the load end is 240 V; however, the simulation results
returned a voltage of 259.9 V, which is higher than the rated value. In the same vein,
the rated current at the output terminal on the boost converter is 12.5 A; however, the
results from the simulation of this case study show a current of 13.38 A. Consequently,
the simulation results when the SWT DC microgrid operates without an MPPT controller
are above the rated value of the voltage and the current, hence the power.
Figure 5. 15: (a) Current, (b) Voltage, and (c) power of boost converter.
5.4.2 Case study two: SWT model under constant speed condition
In this scenario, the SWT DC microgrid operates under a constant speed at 12 m/s,
and the boost converter is controlled using a P&O MPPT controller. The results
obtained from this scenario are depicted in Figure 5.16 and exhibits oscillations
between t = 0 s and t = 0.4 s than when the system is operating under variable wind

82
speed. The current signal (Figure 5.16a) displays an overshoot of 9.894 % and an
undershoot of 9.657 % between t = 0 s and t = 3 s. The current signal displays a rising
time of about 97.7 ms between 0 s to 0.4 s. Whereas the overshoot and undershoot of
the current are 0.803 % and 2.446 %, respectively. Similarly, the voltage at the boost
converter's output terminals presents an overshoot, and an undershoot of 0.803 % and
2.446 %, respectively, between 0 and 0.4 s. The voltage obtained is 240 V (Figure
5.16b). Lastly, the power signal (Figure 5.16c) reaches its steady state of 3 kW at about
0.4 s. it shows a rising time of 142.294 ms, while the overshoot is 0.470% and the
undershoot is 3.286 %.
Figure 5. 16: (a) Current, (b) Voltage, and (c) Power of Boost Converter Load of SWT System
Under Constant Speed Conditions Using P&O MPPT.
5.5 Summary
This chapter dealt with the presentation, analysis, and discussion of the results
obtained from the simulation. These results were presented in three sections: wind
turbine results, SWT results, and DC-to-DC boost converter results. The wind turbine
results focused on the wind turbine's aerodynamics, including the wind speed and the

83
pitch angle. The SWT results comprised the simulation results of the voltage and the
current of the 3 kW PMSG model used in this study. Lastly, the DC-to-DC boost
converter results consisted of the converter's voltage, current, and power using the
P&O MPPT controller. Additionally, case studies were considered to assess the
performance of the system. The first case considered the SWT DC microgrid operation
without an MPPT control for the boost converter, and the system was simulated for
different wind speeds. And the second case considered the simulation of the SWT DC
microgrid operating under a constant speed at 12 m/s, and the boost converter is
controlled using a P&O MPPT controller.

84
CHAPTER SIX CONCLUSION AND RECOMMENDATIONS
6.1 Conclusion
DC microgrids have appeared to be the sustainable solutions incorporating energy
storage and distributed generation to provide power to various types of DC loads,
including LED lights, Electric Vehicles, computers, laptops, TV sets, tablets, phones,
and printers, etc. Furthermore, DC systems are becoming an attractive solution for
industrial applications. Renewable generators such as photovoltaic and fuel cells can
easily be integrated with DC systems as their output power is in DC form. In contrast,
power sources such as wind turbines, wave power, and gas turbines can be more
efficient by utilising only one converter instead of two back-to-back converters. This
research dealt with the design and simulation of a small wind turbine DC microgrid to
provide power to a residential load in the event of a power shortage or power cuts. The
adopted system consisted of a small wind turbine generating 3 kW AC power at 120 V.
This power was rectified using a full-bridge three-phase diode rectifier. At the rectifier's
output terminal, a DC link capacitor was connected to keep a stable voltage. The DC-
link capacitor was connected to the boost converter's input terminals to boost the
voltage from 120 V to 240 V. The boost converter supplied power to a DC load
connected to its output terminals. To extract the maximum power and control the boost
converter's output voltage, an adjusted P&O MPPT algorithm was used to drive the
switching element to accomplish fast MPP tracking and maintain the voltage constant
irrespective of wind speed variation. To verify the designed system's effectiveness, a
MATLAB Simulink model of the small wind turbine DC microgrid was developed. The
overall results showed a good performance of the system. Furthermore, two case
studies were considered to assess the adopted MPPT algorithm's robustness, and the
results showed a better response to the adopted MPPT algorithm.
To achieve the aim of this research, the study was divided into six chapters. Apart from
the introduction and the conclusion, the rest of the thesis can be summarised as
follows:
Chapter two provided an overview of DC microgrids' islanded mode operation and
small-scale wind turbines, including their components and current market. A section
dedicated to wind energy conversion principle and operation was presented.
Additionally, sections on power electronic converters for wind turbines and voltage flow
stability and control compared with the other methods were also considered. Lastly, a

85
review of wind turbine power control approaches and maximum power point tracking
algorithms were presented.
Chapter three dealt with the design considerations of a DC microgrid based on an SWT.
The topics covered in this chapter included a brief investigation on a standalone small
wind turbine in DC microgrids, including the site selection, the technologies, the power
electronic converters topologies, and their maximum power point techniques.
Chapter four deals with the development of a small wind turbine DC microgrid model.
The first section was dedicated to the considered load profile presentation, while the
next section focused on wind aerodynamics modelling. Thereafter, the microgrid
components such as the permanent magnet synchronous generator, the full-bridge
diode rectifier, and the DC-to-DC boost converter were modelled. The last section of
this chapter covered the P&O MPPT controller's modelling to track the maximum power
while also regulating the boost converter's output voltage.
Chapter five dealt with the presentation, analysis, and discussion of the results
obtained from the simulation. These results were presented in three sections: wind
turbine results, SWT results, and DC-to-DC boost converter results. The wind turbine
results focused on the wind turbine's aerodynamics, including the wind speed and the
pitch angle. The SWT results comprised the simulation results of the voltage and the
current of the 3 kW PMSG model used in this study. Lastly, the DC-to-DC boost
converter results consisted of the converter's voltage, current, and power using the
P&O MPPT controller. Additionally, case studies were considered to assess the
performance of the system. The first case considered the SWT DC microgrid operation
without an MPPT control for the boost converter, and the system was simulated for
different wind speeds. And the second case considered the simulation of the SWT DC
microgrid operating under a constant speed at 12 m/s, and the boost converter is driven
using a P&O MPPT controller.
6.2 Recommendations for future research
Further research should focus on the following aspects:
Development of an advanced energy management algorithm for on-grid and
standalone operation of the small wind turbine DC microgrid considered,
Real-time simulation and hardware implementation of the developed maximum
power point tracking controller,

86
Development of more advanced and efficient MPPT algorithms Development of
a maximum power point tracking controller for a hybrid solar-wind power
system.
Development of an highly efficient MPPT technique for wind turbines dependent
on variable step size and variable pitch angle.

87
REFERENCES
Abraham, J. & Plourde, B. 2014. Small scale wind power.
Acharya, P., Papadakis, A. & Shaikh, M.N. 2016. Modelling and Design of a 3 kW Permanent
Magnet Synchronous Generator suitable for Variable Speed Small Wind Turbines.
MATEC Web of Conferences, 55: 6–11.
Ahmed, A., Ran, L. & Bumby, J.R. 2010. Stalling region instability compensation for constant
power soft stalling control. IET Conference Publications, 2010(563 CP).
Ahmed, G.E.-S., Ibrahim, E.-N.A. & Hassan Ali, H. 2016. Constant Power Operation Control
of Variable Speed Wind Turbine DFIG using Genetic Algorithm. International Journal of
Engineering Trends and Technology, 37(7): 384–393.
Ali M. Eltamaly, A.I.A. and H.M.F. 2012. Maximum Power Extraction from Utility-Interfaced
Wind Turbines. Intech, i(tourism): 165–167.
http://dx.doi.org/10.1039/C7RA00172J%0Ahttps://www.intechopen.com/books/advance
d-biometric-technologies/liveness-detection-in-
biometrics%0Ahttp://dx.doi.org/10.1016/j.colsurfa.2011.12.014.
Aubrée, R., Auger, F. & Dai, P. 2012. A new low-cost sensorless MPPT algorithm for small
wind turbines. 2012 1st International Conference on Renewable Energies and Vehicular
Technology, REVET 2012, (March): 305–311.
Ayodele, T.R., Ogunjuyigbe, A.S.O. & Adetokun, B.B. 2017. Optimal capacitance selection
for a wind-driven self-excited reluctance generator under varying wind speed and load
conditions. Applied Energy, 190: 339–353.
Badreddine, L., Zouggar, S., Elhafyani, M.L. & Kadda, F.Z. 2014. Experimental Modeling and
Control of a Small Wind PMSG Turbine. IEEE.
Baroudi, J.A., Dinavahi, V. & Knight, A.M. 2007. A review of power converter topologies for
wind generators. Renewable Energy, 32(14): 2369–2385.
Barra, P.H.A., Coury, D. V. & Fernandes, R.A.S. 2020. A survey on adaptive protection of
microgrids and distribution systems with distributed generators. Renewable and
Sustainable Energy Reviews, 118(October 2019): 109524.
https://doi.org/10.1016/j.rser.2019.109524.
Belakehal, S., Benalla, H. & Bentounsi, A. 2009. Power maximization control of small wind
system using permanent magnet synchronous generator. Revue des Energies
Renouvelables, 12: 2–307. http://www.cder.dz/download/Art12-2_13.pdf.
Blaabjerg, F., Chen, Z., Teodorescu, R. & Iov, F. 2007. Power electronics in wind turbine
systems. Conference Proceedings - IPEMC 2006: CES/IEEE 5th International Power

88
Electronics and Motion Control Conference, 1: 46–56.
Bounechba, H., Bouzid, A., Snani, H. & Lashab, A. 2016. Real time simulation of MPPT
algorithms for PV energy system. International Journal of Electrical Power and Energy
Systems, 83: 67–78. http://dx.doi.org/10.1016/j.ijepes.2016.03.041.
Bratcu, I.M.• A.I. & Ceangӽ, N.-A.C.• E. 2014. Optimal Control of Wind Energy Systems.
Towards a. 2008 Springer-Verlag London Limited.
El Chaar, L., Lamont, L.A. & Elzein, N. 2011. Wind energy technology - Industrial update.
IEEE Power and Energy Society General Meeting, (m): 1–5.
Chen, Y., Xiong, G., Li, W., Qian, J. & Hu, B. 2013. The design of boost circuit in small wind
generation system. Proceedings of 2013 IEEE International Conference on Service
Operations and Logistics, and Informatics, SOLI 2013, (2): 354–359.
Chen, Z., Guerrero, J.M. & Blaabjerg, F. 2009. A review of the state of the art of power
electronics for wind turbines. IEEE Transactions on Power Electronics, 24(8): 1859–
1875.
Chowdhury, M.M. 2014. Modelling and Control of Direct Drive Variable Speed Wind Turbine
with Interior Permanent Magnet Synchronous Generator. , (June).
Daili, Y., Gaubert, J.P. & Rahmani, L. 2015. Implementation of a new maximum power point
tracking control strategy for small wind energy conversion systems without mechanical
sensors. Energy Conversion and Management, 97: 298–306.
http://dx.doi.org/10.1016/j.enconman.2015.03.062.
Dalala, Z.M., Zahid, Z.U., Yu, W., Cho, Y. & Lai, J.S. 2013. Design and analysis of an MPPT
technique for small-scale wind energy conversion systems. IEEE Transactions on
Energy Conversion, 28(3): 756–767.
Díaz, S.A., Silva, C., Juliet, J. & Miranda, H.A. 2009. Indirect sensorless speed control of a
PMSG for wind application. IEEE International Electric Machines and Drives
Conference, IEMDC ’09: 1844–1850.
Dragicevic, T., Vasquez, J., Guerrero, J. & Škrlec, D. 2014. Advanced LVDC Electrical
Power Architectures and Microgrids. IEEE Electrification Magazine, 2(1): 54–65.
EARNEST, J. & RACHEL, S. 2019. Wind Power Technology. Third Edit. Delhi: Asoke K.
Ghosh, PHI Learning Private Limited, Rimjhim House,.
Echchhibat, M.Y.E. 2017. An adapted method for a small wind turbine to extract the optimal
power. , 16.
Esram, T. & Chapman, P.L. 2007. Comparison of photovoltaic array maximum power point
tracking techniques. IEEE Transactions on Energy Conversion, 22(2): 439–449.

89
Estima, J.O. 2012. Development and Analysis of Permanent Magnet Synchronous Motor
Drives with Fully Integrated Inverter Fault-Tolerant Capabilities.
Fan, S., Lim, T., Zhang, H. & Finney, S. 2011. Design and control of wind energy conversion
system based on resonant DC/DC converter. Generation (RPG 2011).
http://ieeexplore.ieee.org/xpls/abs_all.jsp?arnumber=6136079.
Femia, N., Petrone, G., Spagnuolo, G. & Vitelli, M. 2004. Increasing the Efficiency of P&O
MPPT by Converter Dynamic Matching. Ieee, (1): 1017–1021.
De Freitas, T.R.S., Menegáz, P.J.M. & Simonetti, D.S.L. 2016. Rectifier topologies for
permanent magnet synchronous generator on wind energy conversion systems: A
review. Renewable and Sustainable Energy Reviews, 54: 1334–1344.
http://dx.doi.org/10.1016/j.rser.2015.10.112.
Gite, S.S. & Pawar, S.H. 2017. Modeling of wind energy system with MPPT control for DC
microgrid. Proceedings of the 2017 2nd IEEE International Conference on Electrical,
Computer and Communication Technologies, ICECCT 2017: 1–6.
Haque, M.E., Muttaqi, K.M. & Negnevitsky, M. 2009. A control strategy for output
maximisation of a PMSG-based variable-speed wind turbine. Australian Journal of
Electrical and Electronics Engineering, 5(2009): 263–270.
Hau, E. 2006. Wind Turbines: Fundamentals, Technologies, Application, Economics. 2nd
editio. Berlin, German: Springer.
J.F. Manwell, J.G.M. and A.L.R. 2002. Wind Energy Explained-Theory , Design an
Application. Chicheste: John Wiley & Sons.
Jahromi, M.J., Maswood, A.I., Tseng, K.J., Bhangu, B. & Tehrani, N.H. 2012. Maximum
power extraction of tidal streams. 2012 IEEE PES Innovative Smart Grid Technologies,
ISGT 2012: 1–6.
Jain, A., Shankar, S. & Vanitha, V. 2018. Power generation using Permanent Magnet
Synchronous Generator (PMSG) based variable speed wind energy conversion system
(WECS): An overview. Journal of Green Engineering, 7(4): 477–504.
John, A.R. & Divya, N.A. 2016. Performance Comparison of Grid Integrated Micro Wind
System with Diode Rectifier and Active Rectifier. : 2370–2375.
Kakigano, H., Miura, Y. & Ise, T. 2013. Distribution voltage control for DC microgrids using
fuzzy control and gain-scheduling technique. IEEE Transactions on Power Electronics,
28(5): 2246–2258.
Kakigano, H., Miura, Y. & Ise, T. 2010. Low-Voltage Bipolar-Type DC Microgrid for Super
High Quality Distribution. , 25(12): 3066–3075.
90
Kamran, M., Mudassar, M., Fazal, M.R., Asghar, M.U., Bilal, M. & Asghar, R. 2018.
Implementation of improved Perturb & Observe MPPT technique with confined search
space for standalone photovoltaic system. Journal of King Saud University -
Engineering Sciences. https://doi.org/10.1016/j.jksues.2018.04.006.
Katiraei, F., Iravani, M.R. & Lehn, P. 2005. Micro-grid autonomous operation during and
subsequent to islanding process. IEEE Transaction on Power Delivery, 20(1): 248–257.
Kesraoui, M., Korichi, N. & Belkadi, A. 2011. Maximum power point tracker of wind energy
conversion system. Renewable Energy, 36(10): 2655–2662.
http://dx.doi.org/10.1016/j.renene.2010.04.028.
Kesraoui, M., Korichi, N. & Belkadi, A. 2018. Power Management of a Hybrid Wind Gas
Electrolyze Micro grid. International Renewable Energy Congress, (Irec).
Khadiri, K. El & Qjidaa, H. 2014. Inverting Buck-Boost Dcdc Converter Design Challenges.
International Journal of Embedded Systems and Applications (IJESA), 4(1): 1–12.
Kinnares, V. & Sawetsakulanond, B. 2013. Characteristic requirements of a small scale
squirrel cage induction generator for effective electricity generation from wind energy.
Energy Procedia, 34: 26–49.
Kumar, D., Zare, F. & Ghosh, A. 2017. DC Microgrid Technology: System Architectures, AC
Grid Interfaces, Grounding Schemes, Power Quality, Communication Networks,
Applications, and Standardizations Aspects. IEEE Access, 5: 12230–12256.
Kumar, J., Agarwal, A. & Agarwal, V. 2019. A review on overall control of DC microgrids.
Journal of Energy Storage, 21: 113–138.
Kumar, K., Ramesh Babu, N. & Prabhu, K.R. 2017. Design and analysis of modified single
P&O MPPT control algorithm for a standalone hybrid solar and wind energy conversion
system. Gazi University Journal of Science, 30(4): 296–312.
Kumar Tiwari, S., Singh, B. & Goel, P.K. 2018. Design and Control of Microgrid Fed by
Renewable Energy Generating Sources. IEEE Transactions on Industry Applications,
54(3): 2041–2050.
Lee, K.D., Leeb, S.B., Norford, L.K., Armstrong, P.R., Holloway, J. & Shaw, S.R. 2005.
Estimation of variable-speed-drive power consumption from harmonic content. IEEE
Transactions on Energy Conversion, 20(3): 566–574.
Mahesa, D., Rio, A. & Bahatmaka, A. 2020. Analytical Review of Material Criteria as
Supporting Factors in Horizontal Axis Wind Turbines : Effect to Structural Responses.
Procedia Structural Integrity, 27(2019): 155–162.
https://doi.org/10.1016/j.prostr.2020.07.021.

91
Masood, B., Siddique, M.S., Asif, R.M. & Zia-Ul-Haq, M. 2015. Maximum power point
tracking using hybrid perturb & observe and incremental conductance techniques.
International Conference on Engineering Technology and Technopreneuship, ICE2T
2014, 2014-Augus(August): 354–359.
Matayoshi, H., Howlader, A.M., Datta, M. & Senjyu, T. 2018. Control strategy of PMSG
based wind energy conversion system under strong wind conditions. Energy for
Sustainable Development, 45: 211–218. https://doi.org/10.1016/j.esd.2018.07.001.
Miller, A., Muljadi, E. & Zinger, D.S. 1997. A variable speed wind turbine power control. IEEE
Transactions on Energy Conversion, 12(2): 181–186.
Mohammadi, E., Fadaeinedjad, R. & Naji, H.R. 2018. Flicker emission, voltage fluctuations,
and mechanical loads for small-scale stall- and yaw-controlled wind turbines. Energy
Conversion and Management, 165: 567–577.
Muhammad, S., Kazmi, R., Goto, H. & Guo, H. 2011. A Novel Algorithm for Fast and Efficient
Speed-Sensorless Maximum Power Point Tracking in Wind Energy Conversion
Systems. IEEE Transactions on Industrial Electronics, 58(1): 29–36.
Muhssin, M.T. 2015. Small Microgrid Stability and Performance Analysis in Isolated Island.
IEEE.
Nayak, S.K. & Vinod, H. 2017. Performance study of common DC link connected wind and
PV hybrid system. 2016 IEEE 7th Power India International Conference, PIICON 2016:
1–5.
Nayar, C. & Dehbonei, H. 2008. A Low Cost Power Electronic Interface for Small Scale Wind
Generators in Single Phase Distributed Power Generation System. AUPEC: 1–7.
Ontiveros, L.J., Mercado, P.E. & Suvire, G.O. 2011. A new model of the double-feed
induction generator wind turbine. 2010 IEEE/PES Transmission and Distribution
Conference and Exposition: Latin America, T and D-LA 2010, (June): 263–269.
Padmanabhan, S. & Kaliyappan, K. 2014. High performance MPPT based on variable speed
generator driven by wind power generation in battery applications. Journal of Electrical
Engineering and Technology, 9(1): 205–213.
Pathmanathan, M., Tang, C., Soong, W.L. & Ertugrul, N. 2008. Comparison of Power
Converters for Small-Scale Wind Turbine Operation. Australasian Universities Power
Engineering Conference, (January): 1–6.
Pitteloud, S.G. and J. 2016. SMALL WIND WORLD REPORT. Bonn.
https://distributedwind.org/wp-content/uploads/2016/03/2016-Small-Wind-World-
Report.pdf.

92
Pogaku, N., Prodanović, M. & Green, T.C. 2007. Modeling, analysis and testing of
autonomous operation of an inverter-based microgrid. IEEE Transactions on Power
Electronics, 22(2): 613–625.
Rahimi, M. 2017. Modeling, control and stability analysis of grid connected PMSG based
wind turbine assisted with diode rectifier and boost converter. International Journal of
Electrical Power and Energy Systems, 93: 84–96.
http://dx.doi.org/10.1016/j.ijepes.2017.05.019.
Rashid, M.H. 2014. Power Electronics Devices, Circuits & Applications. Fourth Edi.
Pensacola.
Reddy, K., N, S.A., Naga, N., Lakshmi, M., Reddy, A.V.K., Rajesh, B., Kumar, K. & Ali, S.
2015. A Brief Research , Study , Design and Analysis on Wind turbine. Journal Of
Modern Engineering Research (IJMER), 5(October 2015): 26.
Rosato, M.A. 2019. Small Wind Turbines for Electricity and Irrigation, Design and
Construction. Latisana: Taylor & Francis Group, LLC.
Shaikh, P.H., Jan, T. & Baloch, A.A. 2017. Performance Analysis of Wind – Photovoltaic –
Battery based DC Microgrid Setup for off – grid Applications. IEEE: 1–6.
Shehata, E.G. 2017. A comparative study of current control schemes for a direct-driven
PMSG wind energy generation system. Electric Power Systems Research, 143: 197–
205.
Subbiah, A.S. V & Neelaveni, R. 2017. Closed Loop Control of Permanent Magnet
Synchronous Generator Wind Turbine for Standalone System along with MPPT Control.
, 10(02): 275–284.
Sun, C., Zhang, J., Cai, X. & Shi, G. 2016. Voltage balancing control of isolated modular
multilevel dc-dc converter for use in dc grids with zero voltage switching. IET Power
Electronics, 9(2): 270–280.
Swapnil S. Sonekar. 2020. Modeling and Simulation of the Wind Energy Electric Conversion
System using MATLAB/Simulink. International Journal of Engineering Research and,
V8(12): 740–747.
Thongam, J.S., Bouchard, P., Ezzaidi, H. & Ouhrouche, M. 2009. Wind speed sensorless
maximum power point tracking control of variable speed wind energy conversion
systems. 2009 IEEE International Electric Machines and Drives Conference, IEMDC
’09: 1832–1837.
Urasaki, N., Senjyu, T. & Uezato, K. 2004. Relationship of parallel model and series model
for permanent magnet synchronous motors taking iron loss into account. IEEE
Transactions on Energy Conversion, 19(2): 265–270.

93
W. Hart Danial. 2011. Power Electronics. Indiana: McGraw-Hill.
Wang, C.P.B.S.R.L. 2018. Planning and optimization of autonomous DC microgrids for rural
and urban applications in India. Renewable and Sustainable Energy Reviews, 82: 194–
204.
Bin Wu, Yongqiang Lang, Navid Zargari, S.K. 2011. Power conversion and control of wind
energy systems. I. Press, Ed., Toronto: John Wiley & Sons.
Yang, X., Patterson, D. & Hudgins, J. 2012. Permanent magnet generator design and control
for large wind turbines. PEMWA 2012 - 2012 IEEE Power Electronics and Machines in
Wind Applications.
Yaramasu, V., Wu, B., Sen, P.C., Kouro, S. & Narimani, M. 2015. High-power wind energy
conversion systems: State-of-the-art and emerging technologies. Proceedings of the
IEEE, 103(5): 740–788.
Yin Win, L. 2014. Simulation of Small-Scale Wind Power System. , 03(10): 1896–1899.
Yu, K.N. & Liao, C.K. 2015. Applying novel fractional order incremental conductance
algorithm to design and study the maximum power tracking of small wind power
systems. Journal of Applied Research and Technology, 13(2): 238–244.
Zammit, D., Spiteri Staines, C., Micallef, A. & Apap, M. 2018. MPPT with Current Control for
a PMSG Small Wind Turbine in a Grid-Connected DC Microgrid. 2018 5th International
Conference on Control, Decision and Information Technologies (CoDIT): 205–219.
http://link.springer.com/10.1007/978-3-319-74944-0_14.

94
APPENDIX
P&O Matlab code
Matlab program software the gradually process to extract maximum power by using the
proposed of P&O MPPT control algorithm from the small wind source is presented.
Step-1: Start the procedure
Step-2: Calculates change in power ΔP and change in voltage ΔV
For i=k (Maximum number of repetitions)
If change in power, ΔP is positive;
If change in voltage, ΔV is positive;
Decreases the 𝑉 , D =𝐷 , – 𝐷 ,
Else
if change in voltage, ΔV is negative;
Increase the 𝑉 , D =𝐷 , + 𝐷
End
Else
If change in voltage, ΔV < 0;
Increase the 𝑉 , D =𝐷 , + 𝐷
Else
If change in voltage, ΔV is negative;
Decreases the 𝑉 , D =𝐷 , – 𝐷
End
End
Step-3: else D= 𝐷
End
If D > 𝑉 I D < = 𝑉
D = 𝐷
End
Step-4: Stop the process

95