Embed Size (px)
Citation preview
ZERO DISCHARGE WASTE BRINE MANAGEMENT FOR DESALINATION PLANTS
FINAL REPORT
University of Texas at El Paso El Paso, Texas
Agreement Number: 99-FC-81-0181 Desalination Research and Development Program Report No. 89
December 2002
U.S. DEPARTMENT OF THE INTERIOR Bureau of Reclamation
Technical Service Center Water Treatment Engineering and Research Group
Denver, CO
REPORT DOCUMENTATION PAGE Form Approved OMB No. 0704-0188
Public reporting burden for this collection of information is estimated to average 1 hour per response, including the time for reviewing instructions, searching existing data sources, gathering and maintaining the data needed, and completing and reviewing the collection of information. Send comments regarding this burden estimate or any other aspect of this collection of information, including suggestions for reducing this burden to Washington Headquarters Services, Directorate for Information Operations and Reports, 1215 Jefferson Davis Highway, Suit 1204, Arlington VA 22202-4302, and to the Office of Management and Budget, Paperwork Reduction Report (0704-0188), Washington DC 20503. 1. AGENCY USE ONLY (Leave Blank)
2. REPORT DATE December 2002
3. REPORT TYPE AND DATES COVERED Final
4. TITLE AND SUBTITLE Zero Discharge Waste Brine Management for Desalination Plants 6. AUTHOR (S) Andrew H.P. Swift, Huanmin Lu, and Humberto Becerra
5. FUNDING NUMBERS
7. PERFORMING ORGANIZATION NAME(S) AND ADDRESS(ES) University of Texas at El Paso El Paso, TX
8. PERFORMING ORGANIZATION REPORT NUMBER DRDP Report No. 89
9. SPONSORING/MONITORING AGENCY NAME(S) AND ADDRESS(ES) Bureau of Reclamation Denver Federal Center PO Box 25007 Denver CO 80225-0007
10. SPONSORING/MONITORING AGENCY REPORT NUMBER
11. SUPPLEMENTARY NOTES 12a. DISTRIBUTION/AVAILABILITY STATEMENT Available from the National Technical Information Service, Operations Division, 5285 Port Royal Road, Springfield, VA 22161
12b. DISTRIBUTION CODE
13. ABSTRACT (Maximum 200 words)
Desalination of brackish water at inland locations must consider environmentally appropriate and cost effective brine concentrate management and/or disposal. The Zero Discharge Waste Brine Management for Desalination Plants project examines a systems approach for desalination/brine management via a Salinity Gradient Solar Pond (SGSP) coupled with a Brine Concentrator and Recovery System (BCRS). The BCRS was tested over a broad range of operational conditions with the thermal energy derived from a SGSP. The relationship between system performance and operating conditions was analyzed to determine the economic and technical viability of the BCRS technology. Mathematical and computer models have been developed to describe the physical behavior of the BCRS and to predict its performance.
15. NUMBER OF PAGES 41
14. SUBJECT TERMS— brackish water, desalination, concentrate management and disposal, brine management, thermal energy, Brine Concentrator and Recovery System, zero discharge waste brine, solar pond
16. PRICE CODE
17. SECURITY CLASSIFICATION of REPORT UL
18. SECURITY CLASSIFICATION OF THIS PAGE UL
19. SECURITY CLASSIFICATION OF ABSTRACT UL
20. LIMITATION OF ABSTRACT UL
NSN 7540-01-280-5500 Standard Form 298 (Rev. 2-89)
Prescribed by ANSI Std. 239-18298-1
ZERO DISCHARGE WASTE BRINE MANAGEMENT FOR DESALINATION PLANTS
FINAL REPORT
Andrew H.P. Swift, Huanmin Lu, and Humberto Becerra University of Texas at El Paso
El Paso, Texas
Agreement Number: 99-FC-81-0181 Desalination Research and Development Program Report No. 89
December 2002
U.S. DEPARTMENT OF THE INTERIOR Bureau of Reclamation
Technical Service Center Water Treatment Engineering and Research Group
Denver, CO


U.S. Department of the Interior Mission Statement
The mission of the Department of the Interior is to protect and provide access to our Nation’s natural and cultural heritage and honor our trust responsibilities to tribes.
Bureau of Reclamation Mission Statement
The mission of the Bureau of Reclamation is to manage, develop, and protect water and related resources in an environmentally and economically sound manner in the interest of the American public.
Disclaimer Information contained in this report regarding commercial products or firms was supplied by those firms. It may not be used for advertising or promotional purposes and is not to be construed as an endorsement of any product or firm by the Bureau of Reclamation. The information contained in this report was developed for the Bureau of Reclamation; no warranty as to the accuracy, usefulness, or completeness is expressed or implied.

ABSTRACT Desalination of brackish water at inland locations must consider environmentally appropriate and cost-effective brine concentrate management and/or disposal. The Zero Discharge Waste Brine Management for Desalination Plants project examines a systems approach for desalination/brine management via a Salinity Gradient Solar Pond (SGSO) coupled with a Brine Concentrator and Recovery System (BCRS). The BCRS was tested over a broad range of operational conditions with the thermal energy derived from a SGSP. The relationship between system performance and operating conditions was analyzed to determine the economic and technical viability of the BCRS technology. Mathematical and computer models have been developed to describe the physical behavior of the BCRS and to predict its performance.

TABLE OF CONTENTS Page 1. Executive Summary .............................................................................................. 1 2. Background and Introduction to the Project .................................................................. 1 3. Conclusions and Recommendations ............................................................................ 3 3.1 Conclusions.................................................................................................. 3 3.2 Recommendations .......................................................................................... 3 4. Description of Test Facilities.................................................................................... 4 4.1 Salinity Gradient Solar Pond.............................................................................. 4 4.2 BCRS Unit................................................................................................... 7 4.2.1 Equipment Description ............................................................................ 7 4.2.2 Process Description .............................................................................. 12 5. Work Performed ................................................................................................ 13 5.1 Modification of the BCRS Unit ........................................................................ 13 5.2 Performance Testing ..................................................................................... 14 5.3 Data Collection ........................................................................................... 14 6. Results and Analysis............................................................................................ 17 6.1 Evaporation Rate ......................................................................................... 17 6.2 Freshwater Production Rate ............................................................................ 20 6.3 Energy Consumption Rate .............................................................................. 20 7. Mathematical Models........................................................................................... 22 7.1 Evaporation Chambers................................................................................... 22 7.2 Condensation Tower ..................................................................................... 25 7.3 Comparison with Test Data ............................................................................. 27 8. Economic Analysis ............................................................................................. 29 8.1 Method and Procedure of Cost Analysis .............................................................. 30 8.2 Results of Cost Analysis................................................................................. 31 8.2.1 Concentration Cost for Hot Evaporation...................................................... 31 8.2.2 Concentration Cost for Cold Evaporation .................................................... 32 8.2.3 Concentration Cost and Freshwater Production Cost for Hot and Cold Evaporation ............................................................................................ 32 8.2.4 Costs of a Zero Discharge System with BCRS .............................................. 33 8.3 Comparison With Alternative Disposal Methods .................................................... 36 9. References ...................................................................................................... 39 10. List of Symbols ................................................................................................. 40 Appendix—Summary of Test Data
Tables Page 1 Operating conditions of the BCRS unit ...................................................................... 14 2 List of process variables for measurement at the BCRS .................................................. 15 3 Evaporation rates ............................................................................................... 18 4 Evaporation rates in hot evaporation chamber.............................................................. 18 5 Evaporation rates in cold evaporation chamber ............................................................ 18 6 Condensation rate ............................................................................................... 21 7 Energy consumption rate ...................................................................................... 21 8 Differential equations for evaporation ....................................................................... 24 9 Calculated coefficient of performance for evaporation.................................................... 25 10 Differential equations for condensation...................................................................... 26 11 Calculated coefficients of performance for condensation ................................................. 27 12 Assumed operating conditions for hot evaporation ........................................................ 31 13 Estimated concentration costs for hot evaporation ......................................................... 31 14. Assumed operating conditions for cold evaporation ....................................................... 32 15. Estimated concentration costs for cold evaporation........................................................ 32 16. Assumed operating conditions for condensation............................................................ 33 17. Estimated costs for hot and cold evaporation as a stand-alone unit...................................... 33 18. Costs of produced water with zero discharge system...................................................... 34 19. Costs of produced water with deep well injection.......................................................... 37 20. Costs of produced water with evaporation ponds .......................................................... 37 21. Costs of produced water with crystallizer ................................................................... 38 22. Comparison of produced water costs ........................................................................ 38
Figures
Page 1. Schematic of zero discharge desalination system.............................................................. 2. El Paso Solar Pond ............................................................................................... 5 3 Specific gravity profile of El Paso Solar Pond ............................................................... 5 4 Temperature profile of El Paso Solar Pond ................................................................... 6 5 Temperature development of El Paso Solar Pond............................................................ 6 6 BCRS unit.......................................................................................................... 7 7 Schematic of the BCRS unit and piping system .............................................................. 8 8 Basin of the cold evaporation chamber ........................................................................ 9 9 End section of the hot evaporation chamber .................................................................. 9 10 The spray net at the hot evaporation chamber .............................................................. 10 11 Spray nozzles at the top of the packed condensation duct ................................................ 10 12 Mist eliminators in the cooling jackets ........................................................................ 1 13 Intermediate heat exchanger................................................................................... 12 14 Heat exchange for cooling water conveyed to condensation tower ...................................... 13 15 Process flow diagram of the BCRS testing system......................................................... 16 16 Daily averaged evaporation rate .............................................................................. 17 17 Evaporation rate versus salinity............................................................................... 19 18 Evaporation rate versus humidity............................................................................. 19 19 Evaporation rate versus brine temperature .................................................................. 20
Figures (continued)
Page 20 Daily averaged condensation rate............................................................................. 21 21 Sketch of flowchart of the evaporation chamber ........................................................... 23 22 Mass interactions in the evaporation chambers............................................................. 23 23 Energy and mass interactions in the condensation tower.................................................. 25 24 Comparison between calculated data and experimental data for evaporation .......................... 28 25 Comparison between calculated data and experimental data for condensation......................... 29 26 Flowchart of zero discharge system.......................................................................... 34 27 Marginal concentration costs .................................................................................. 35 28 Comparison of produced water costs ........................................................................ 38

1
1. EXECUTIVE SUMMARY
Limited fresh water supplies represent a serious constraint to the development and continued viability of inland communities in states of the arid Southwestern United States. In many of these communities, there are abundant supplies of brackish groundwater that can be utilized if appropriate methods of desalination and brine concentrate management or disposal can be developed. This project addresses these issues by examining a systems approach for desalination/brine management, using a Salinity Gradient Solar Pond (SGSP), coupled with a Brine Concentrator and Recovery System (BCRS). This project involved comprehensive testing and analysis of a BCRS that was reconstructed and modified from a brine concentrator. The BCRS was tested over a broad range of operational conditions, with the thermal energy derived from a SGSP. The relationship between system performance and operating conditions was analyzed to determine the economic and technical viability of the BCRS technology. Mathematical and computer models have been developed to describe the physical behavior of the BCRS and to predict its performance. This research provides useful data and information for developing zero discharge waste brine management for desalting plants. These data and information are also useful for improving the design of a BCRS, which is driven by low- or medium-temperature heat sources.
2. BACKGROUND AND INTRODUCTION TO THE PROJECT Desalination of brackish water at inland locations must consider not only the equipment and energy required to drive the process, but also environmentally appropriate and cost-effective brine concentrate management and/or disposal. This project addresses both of these major issues for inland locations by examining a SGSP coupled with a BCRS. Combining the BCRS with the SGSP technology and other desalination technologies can lead to a "zero discharge" desalination process [1]. From a system viewpoint, the BCRS is the final stage in a multi-process desalination and concentrate management system. Initially, more efficient desalination technologies (such as membrane treatment) or multi-stage flash systems (such as multi-effect, multi-stage [MEMS] desalination units) would be applied to desalinate brackish waters as shown in the systems diagram (figure 1). The SGSP-BCRS would represent the final stage in the process, with the reject concentrate from the primary desalination process providing makeup water to the SGSP, which, in turn, provides feed brine for the BCRS. The BCRS is driven by thermal energy from the SGSP, producing additional fresh water and a near-slurry salt discharge. The salt discharge is then used to recharge the solar pond, adding to SGSP capacity, or is processed as chemicals for use or sale. This systems approach addresses two critical environmental issues for inland desalting plants: (1) reusing the brine concentrate, thereby negating the need for disposal (zero discharge); and (2) providing additional pollution-free renewable energy for the desalting process. The major objective of this project is to examine the systems approach for desalination/brine management, using a SGSP coupled with a BCRS, and to determine its technical and economic feasibility. The scope of work of this project is as follows:

2
Figure 1.—Schematic of zero discharge desalination system.
• Testing the BCRS over a broad range of operating conditions, including heat input variation from
the SGSP, brine temperature variation (typically 40-70 °C), and various ambient air conditions.
• Analyzing test data and establishing experimental correlations between system performance and operating conditions.
• Establishing the physical theory related to the thermodynamics and heat and mass transfer of
the processes involved, using appropriate mathematical expressions. • Developing a numerical model and a computational program to characterize and predict the
equipment performance.
This project has a positive impact on the environment for both the short term and long term. Brine concentrates are managed and reused for energy and/or chemical production from excess recovered salts, rather than being classified as waste and disposed of. The information derived from the testing will also be useful for improving the design of the brine concentration and recovery systems.
Brackish Supply
2,000 ppm 30,000 ppm 40,000 ppm
Thermal Energy
SGSP Maintenance and Expansion
Concentrate Slurry
Salt / Chemical Production
Product Water AdditionalProduct Water
Primary Energy
Reject brine
SurfaceEvaporation
Primary Desalination
Reverse Osmosis/Electrodialysis/Thermal SGSP BCRS
Solar PondSurface Makeup
250,000 ppm
MEMS
Product Water

3
3. CONCLUSIONS AND RECOMMENDATIONS
3.1 CONCLUSIONS
• BCRS unit was modified and tested over a broad range of operating and ambient conditions with heat supply from a salinity gradient solar pond.
• The BCRS produces concentrated salt slurry, which can be used to recharge the solar pond.
The BCRS is essential for accomplishing the concept of zero discharge desalination.
• The evaporation rates of the BCRS unit ranged from 330 to 605 liters per hour (LPH) (90 to 160 gallons per hour, GPH). These evaporation rates are equivalent to the ones of evaporation ponds of 1,600 to 2,900 m2 (0.4 to 0.7 acre) at the climate conditions of El Paso, Texas.
• The hot evaporation chamber contributes 60 to 88 percent of the total evaporation of the unit.
• The evaporation rate of the BCRS unit is affected by ambient conditions and brine
concentration. It increases with lower relative humidity, higher dry-bulb ambient temperature, and lower brine concentration. The evaporation rate in the hot chamber also increases with higher brine temperature.
• A portion of the feed water to the BCRS can be recovered. The freshwater production rate of
the BCRS unit ranged from 25 to more than 115 liters per hour (LPH) (30 gallons per hour [GPH). The freshwater recovery ratio (defined as the ratio of volumetric flow rate of fresh water produced to the volumetric flow rate of feed brine into the system) ranged from 10 to 26 percent.
• Computer-based models have been developed to describe the concentration process in both hot
and cold evaporation chambers and the condensation process in the condensation tower. With these models and experimental data, relationships between operating conditions and performance of the BCRS unit have been developed. These relationships can be used to predict the performance and to modify the design of the BCRS.
• No scaling and fouling problems were found during the test period.
3.2 RECOMMENDATION
• Further study is needed to improve the nozzle system, so as to optimize the evaporation rate, while reducing required flow rate of brine, and, hence, to reduce the electricity consumption rate.
• The heat transfer efficiency of the condensing tower must be improved to increase the
freshwater recovery ratio.
4
• The structure of the BCRS must be redesigned for easier salt removal.
• As thermal energy cost represents about 60 percent of the operation cost for hot evaporation, further review of the design and operation of the heat exchangers is recommended. Also, because the BCRS is an intensive consumer of electrical energy but an effective brine concentrator, it is advisable to explore the use of alternative hybrid systems to supply the power as noted by Farid [3].
4. DESCRIPTION OF TEST FACILITIES
4.1 SALINITY GRADIENT SOLAR POND
A salinity gradient solar pond is a body of water that collects and stores solar energy. Generally, it has three regions (from top to bottom): (1) the upper convective zone (UCZ) (also called surface zone); (2) the main gradient zone (MGZ); and (3) the lower convective zone (LCZ). The UCZ is a homogeneous layer of low-salinity brine or fresh water, and the LCZ is a homogeneous, concentrated salt solution that can be either convecting or temperature stratified. In between is the nonconvective MGZ, which constitutes a thermally insulating layer in which the salinity increases with depth [4]. Insulation is then absorbed and stored in the lower levels of the pond with operating temperatures in the range of 60 to 90 ºC. SGSPs have the potential to produce low-cost thermal energy from a renewable source at large scale for industrial applications, including desalination. The El Paso Solar Pond (shown in figure 2) is a research, development, and demonstration project operated by the University of Texas at El Paso and funded by the Bureau of Reclamation and the State of Texas. The project, which is located on the property of Bruce Foods, Inc., a food canning company, was initiated in 1983. The El Paso Solar Pond has been operated since 1985. It was the first solar pond in the world to deliver industrial process heat to a commercial manufacturer in 1985, the first solar pond electric power generating facility in the United States in 1986, and the Nation's first experimental solar pond powered water desalting facility in 1987. The pond has a surface area of 3,000 square miles (m2) (0.75 acre) and a depth of about 3.25 meters (m) (10.7 feet [ft]). The thicknesses of its UCZ, MGZ, and LCZ are approximately 0.7 m (2.3 ft), 1.2 m (3.9 ft), and 1.35 m (4.4 ft), respectively. Figures 3 and 4 show the typical density and temperature profiles of the pond, respectively. An annual temperature plot for both LCZ and UCZ is shown in figure 5, based on the years 1991 to 1993. For comparison, the average ambient temperature is also shown in figure 5. The operation temperature of the pond ranged from 70 °C in winter to 90 °C in early fall. The highest temperature observed at the El Paso Solar Pond during these years was 93 °C, and the maximum temperature difference between the LCZ and UCZ was well above 70 °C. The observed temperatures in the storage zone at the bottom of the pond were influenced by ambient conditions and heat removal to operate testing equipment and generate electricity.
5
Figure 2.—El Paso Solar Pond.
Figure 3.—Specific gravity profile of El Paso Solar Pond.
09/01/99
50
100
150
200
250
300
350
1.00 1.05 1.10 1.15 1.20
Specific Gravity
Hei
ght (
cm)

6
Figure 4.—Temperature profile of El Paso Solar Pond.
Figure 5.—Temperature development of El Paso Solar Pond.
09/01/99
50
100
150
200
250
300
350
10 20 30 40 50 60 70 80 90
Temperature (C)
Hei
ght (
cm)
0102030405060
708090
100
1 2 3 4 5 6 7 8 9 10 11 12
Month of the Year
Tem
pera
ture
(C)
UCZLCZAmbient

7
4.2 BCRS UNIT
4.2.1 Equipment Description The BCRS tested in this project (shown in figure 6) is a unit that was reconstructed from a brine concentrator designed by Frontier AquaDynamic and Environmental Ingenuity Group [5]. The brine concentrator was originally designed to use moderate temperature thermal energy to drive evaporative concentration of saline waste streams. In addition, the BCRS incorporates a condensation tower to recover some fresh water. Figure 7 shows a schematic of the BCRS. The BCRS consists of an approximately 40-foot-long evaporation chamber box supporting a 30-foot-high condenser tower for condensate water recovery. The major components of the BCRS are described as follows.
Evaporation Chamber Box.—The evaporation chamber box consists of a hot evaporation chamber and a cold evaporation chamber. Both hot and cold evaporation chambers are constructed in a similar way and formed by a basin, walls, ceiling, and spray nozzles. As shown in figure 7, the outer ends of both
Figure 6.—BCRS unit.
8
Figure 7.—Schematic of the BCRS unit and piping system.
hot and cold evaporation chambers (i.e., the two ends of the evaporation chamber box) are open inlets for air streams. The air outlets for both hot and cold evaporation chambers are at the inner ends of the two chambers. The hot air outlet duct is at the center of the evaporation chamber, and the cold air exits from two sides of the hot air outlet, so that the two air streams are separated from each other without mixing. The major difference between the two evaporation chambers is that there is an inside heat exchanger in the hot evaporation chamber, but not in the cold evaporation chamber. The inside heat exchanger is installed at the inner end of the hot evaporation chamber basin and is used to heat the brine in the hot chamber. The inside heat exchanger is constructed of 26 copper tubes arranged in 8 passes. Hot water flows inside the copper tubes of the heat exchanger and heats the brine in the hot evaporation chamber basin, which flows across the outside of the copper tubes. The brine in the cold evaporation chamber is not heated, and the cold chamber acts like an evaporative cooler. A polyvinyl chloride (PVC) pipe connects the basins of both evaporation chambers, allowing brine to flow from the hot evaporation chamber into the cold evaporation chamber by gravity. Figure 8 shows the basin of the cold evaporation chamber. Figure 9 shows a view of the inner end of the hot evaporation chamber, including the inside heat exchanger and the air exit to the condensation tower. A picture of the spray nozzles is shown in figure 10. Condensation Tower.—The condensation tower consists of a packed condensation duct for direct-contact heat and mass transfer between cold water (product water) and the entering hot air stream. The packing material filled in the condensation duct is film-type and made of formed cellulose sheets. A set of nozzles, as shown in figure 11, was installed above the packing material. Through the nozzles,
SOLAR POND
HOT AIR STREAM COLD AIR STREAM
COLD EVAPORATION CHAMBER
HOT EVAPORATION CHAMBER
CONDENSATION TOWER
AIR AIR
FRESH WATER
BRINE
9
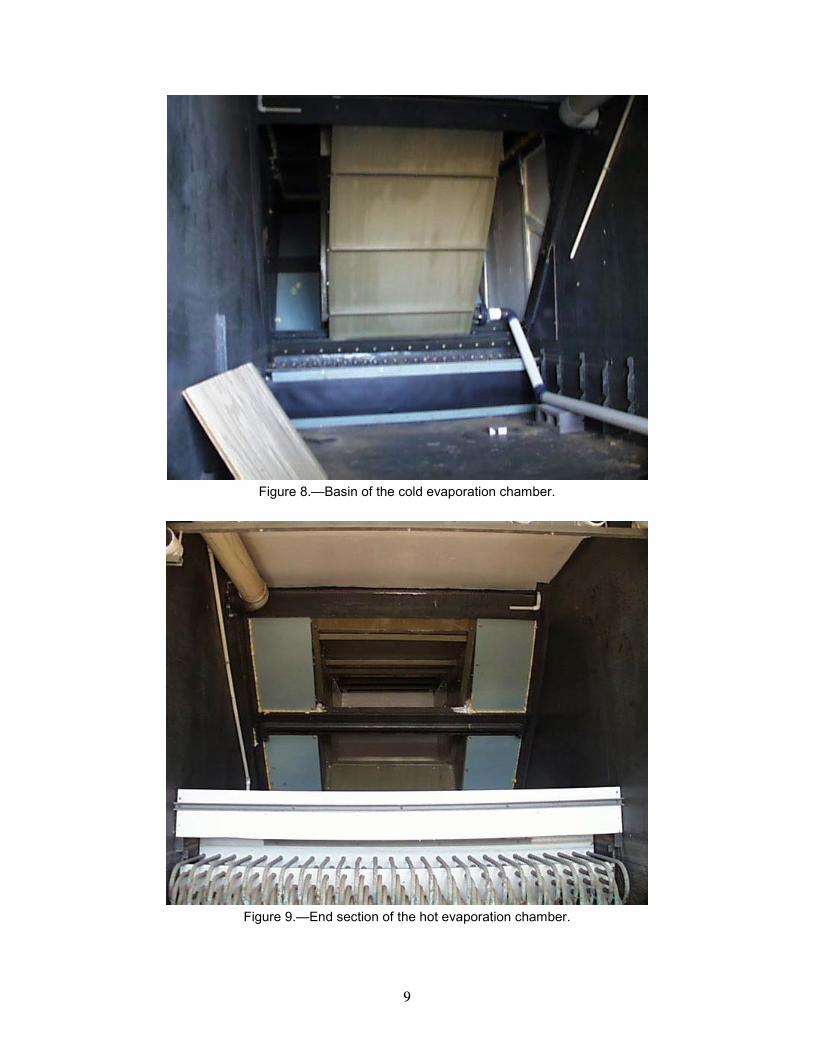
Figure 8.—Basin of the cold evaporation chamber.
Figure 9.—End section of the hot evaporation chamber.

10
Figure 10.—The spray net at the hot evaporation chamber.
Figure 11.—Spray nozzles at the top of the packed condensation duct.

11
cooled product water is sprayed downward and circulates through the packed section by gravity towards the freshwater basin. The condensation duct is jacketed to allow an auxiliary cooling process using the cold air stream. This jacket covers three walls of the condensation duct. An inside view of the cooling jacket at the condensation tower is presented in figure 12, where mist eliminators are installed to prevent salt contamination from brine droplets in the cold air stream.
Figure 12.—Mist eliminators in the cooling jackets.
Fan System.—The fan system is installed at the top of the condensation tower. It consists of a big fan and a small fan. The big fan is used for both hot and cold air streams, and the small fan is used for the hot air stream only. A filtering mesh is installed at the inlet of the hot air stream, and mist eliminators are installed for each stream. In addition, drift eliminators are installed at the exit of the condensation tower. Pumping Systems.—There are three major pumping systems: (1) the brine pumping system; (2) the condensate pumping system; and (3) the heat supply pumping system. The brine pumping system consists of two identical brine circulation pumps: one for each evaporation chamber. The brine pumping system is used to circulate the brine in the evaporation chamber basins and spray the brine into the air streams through the nozzles installed on the ceiling of the evaporation chambers. The condensate pumping system is used to circulate the condensate passing through a cooling heat exchanger, and to spray the cooled condensate into the hot air stream through the nozzles installed at the top of the condensation tower, in order to recover more condensate. This pumping system consists of two pumps, which are connected in parallel, a flowmeter, and associated piping systems. The heat supply pumping system is used to supply heat from the solar pond to the feed brine in the hot evaporation chamber. This pumping system is a closed loop, which consists of two pumps, the inside heat exchanger in the hot evaporation chamber, a shell-and-tube heat exchanger (also called an intermediate heat exchanger), an expansion tank, and associated piping systems. Working fluid (water)
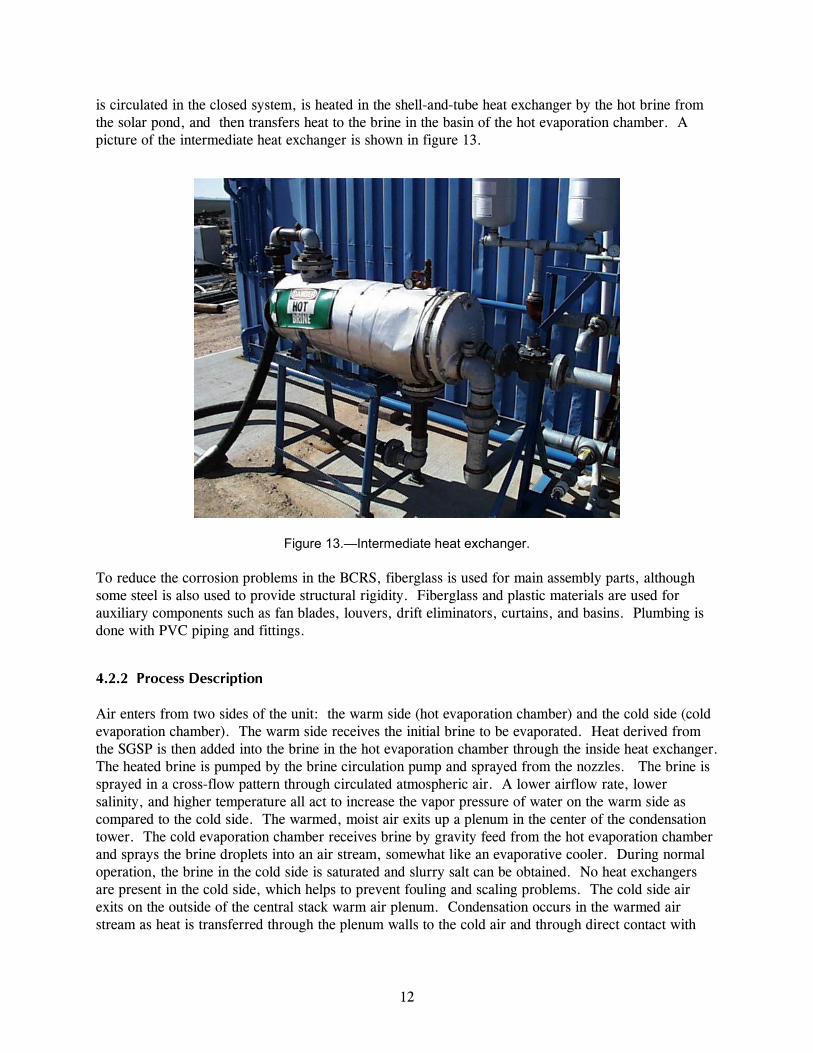
12
is circulated in the closed system, is heated in the shell-and-tube heat exchanger by the hot brine from the solar pond, and then transfers heat to the brine in the basin of the hot evaporation chamber. A picture of the intermediate heat exchanger is shown in figure 13.
Figure 13.—Intermediate heat exchanger.
To reduce the corrosion problems in the BCRS, fiberglass is used for main assembly parts, although some steel is also used to provide structural rigidity. Fiberglass and plastic materials are used for auxiliary components such as fan blades, louvers, drift eliminators, curtains, and basins. Plumbing is done with PVC piping and fittings.
4.2.2 Process Description Air enters from two sides of the unit: the warm side (hot evaporation chamber) and the cold side (cold evaporation chamber). The warm side receives the initial brine to be evaporated. Heat derived from the SGSP is then added into the brine in the hot evaporation chamber through the inside heat exchanger. The heated brine is pumped by the brine circulation pump and sprayed from the nozzles. The brine is sprayed in a cross-flow pattern through circulated atmospheric air. A lower airflow rate, lower salinity, and higher temperature all act to increase the vapor pressure of water on the warm side as compared to the cold side. The warmed, moist air exits up a plenum in the center of the condensation tower. The cold evaporation chamber receives brine by gravity feed from the hot evaporation chamber and sprays the brine droplets into an air stream, somewhat like an evaporative cooler. During normal operation, the brine in the cold side is saturated and slurry salt can be obtained. No heat exchangers are present in the cold side, which helps to prevent fouling and scaling problems. The cold side air exits on the outside of the central stack warm air plenum. Condensation occurs in the warmed air stream as heat is transferred through the plenum walls to the cold air and through direct contact with

13
recycled cold product water when it passes though the packed condensation duct. Condensate is collected in the freshwater basin and cooled to the air temperature of the cold side through a heat exchanger. Because the BCRS operates at low temperature levels, it can utilize low grade heat, such as solar, geothermal, and waste heat, thereby eliminating high energy costs. Scaling and fouling are common problems for conventional brine concentrators. However, the BCRS is designed to avoid these problems by operating at low temperature levels and causing evaporation to occur in mid-air. The advantage of the system is that it can process very high concentration brines using no chemicals, other than pH control.
5. WORK PERFORMED
5.1 MODIFICATION OF THE BCRS UNIT
The BCRS unit was constructed in 1998, and preliminary testing began in 1999. Based on the results and experience of the preliminary test, the unit has been modified prior to or during conducting the performance test of this project in order to improve its performance. Also, its instrumentation system has been improved. Major modifications and improvements are as follows:
• Improved the mist elimination device in the warm side to protect product water from saline contamination.
• Installed mist elimination curtains in the cold side
• Designed, constructed, and installed a heat exchanger in the cold side of the BCRS unit for
cooling the condensate (see figure 14) and to improve thermal efficiency and water recovery.
Figure 14.—Heat exchange for cooling water conveyed to condensation tower.
14
• Improved the baffle plate system to prevent brine from spraying out of the unit • Installed a product water tank
• Installed temperature and relative humidity sensors in the unit
• Installed several flowmeters for monitoring the flow rates of hot brine from the solar pond, feed
saline water into the BCRS, and produce fresh water.
• Installed a data acquisition system for automated data recording
5.2 PERFORMANCE TESTING
Performance tests were conducted from May through November 2000. The BCRS unit was tested under a broad range of operating conditions with feed brine at different salt concentrations. Table 1 summarizes the ranges of operating conditions. The controlled operating parameters include: (1) heat supply to the hot evaporation chamber (and, hence, brine temperature in the hot evaporation chamber); (2) flow rate of fresh water into the condensation tower; and (3) salt concentration of feed water. The feed waters were local brackish water and saline waters from the solar pond surface zone and the evaporation pond adjacent to the BCRS unit. The salinity of the feed brine ranged from 3 percent to near saturation (3,000 to 300,000 milligrams per liter [mg/L] in total dissolved solids [TDS]). In order to get a relatively steady-state condition for each individual test, these parameters were maintained relatively stable during each test. Spray flow rates of brine and airflow rates in both evaporation chambers were not adjustable, and they were determined by the exiting piping systems and the capacities of brine pumps or fan system.
Table 1.—Operating conditions of the BCRS unit
Parameter Range Ambient condition Dry bulb temperature (°C) Relative humidity (%)
11 ~ 35 7 ~ 52
Brine temperature in the hot side (°C) 30 ~ 44 Brine temperature in the cold side (°C) 12 ~ 24 TDS of feedstock (mg/L) 3,000 ~ 300,000
5.3 DATA COLLECTION
Table 2 lists the major parameters for this testing. The reference numbers under the “STATE” correspond to the numbers indicated in the process-flow diagram (figure 15). Data was collected using the data acquisition system LABTECH©. A sample of the raw-data sheets is included in appendix A. It should be mentioned that not all of the parameters listed in table 2 were directly measured in the testing, because of the limitation of BCRS reconstruction and availability of instruments. Instead of being directly measured, some of the parameters were derived from other measured parameters. These derived parameters include flow rate and brine temperature at the spray nozzles, and the airflow rate through the evaporation chambers and condensation tower. The airflow rate was derived from the average air velocity at the entrance of each evaporation chamber and cross sectional areas of the entrances. A hot wire anemometer was used to measure the air velocity at different entry points.

15
Table 2.—List of process variables for measurement at the BCRS Fluid Process variables for measurement
Name State Name Required Measured Derived 0 Dry bulb temperature ■ ■ 0 Wet bulb temperature ■ ■ Ambient air 0 Relative humidity ■ ■ 1 Dry bulb temperature ■ ■ 1 Mass flow rate, moist ■ ■ 2 Dry bulb temperature ■ ■ 2 Relative humidity ■ ■ 3 Dry bulb temperature ■ ■
Hot air
3 Relative humidity ■ 6 Dry bulb temperature ■ ■ 6 Mass flow rate, moist ■ 7 Dry bulb temperature ■ ■ 7 Relative humidity ■ ■ 8 Dry bulb temperature ■
Cold air
8 Relative humidity ■ 13 Temperature ■ ■ 13 Volume flow rate ■ ■ 13 Mass flow rate ■ ■ 14 Temperature ■ ■ 10 Temperature ■ ■ 16 Specific gravity ■ ■ 16 Volume flow rate ■ ■ 16 Volume accumulated ■ ■
Fresh water
16 Mass flow rate ■ ■ 18 Temperature ■ ■ 18 Specific gravity ■ ■ 20 Temperature ■ 20 Volume flow rate ■
Hot chamber spraying brine
20 Mass flow rate ■ 22 Temperature ■ ■ 22 Specific gravity ■ ■ 24 Temperature ■ 24 Volume flow rate ■
Cold chamber spraying brine
24 Mass flow rate ■ 17 Specific gravity ■ ■
17A-H Volume accumulated ■ ■ 17B-C Volume accumulated ■ ■
17 Volume accumulated ■ ■ Feed brine
17 Mass flow rate (average) ■ ■ 26 Temperature ■ ■ 26 Volume flow rate ■ ■ 26 Mass flow rate ■ ■
Heat source brine
27 Temperature ■ ■ 28 Temperature ■ ■ 28 Volume flow rate ■ ■ 28 Mass flow rate ■ ■ Heating water
29 Temperature ■ ■

Figu
re 1
5.—
Proc
ess
flow
dia
gram
of t
he B
CR
S te
stin
g sy
stem
.
16
DE
HU
MID
IFIE
D A
IR O
UT
LE
T
CO
OL
ING
AIR
OU
TL
ET
ATM
OSP
HER
IC A
IR
INLE
TA
TM
OSP
HE
RIC
A
IR I
NL
ET
FE
ED
BR
INE
OR
B
RA
CK
ISH
WA
TE
R
RE
CO
VE
RE
D S
AL
T
HO
T EV
APO
RAT
ION
CH
AMBE
R
EVAP
ORAT
IVE
COO
LIN
G
CHAM
BER
CO
ND
ENSA
TIO
N
TOW
ER
PA
CK
ED
C
ON
DE
NSA
TIO
N
CO
OL
ING
JA
CK
ET
SOLA
R P
ON
D
HO
T
BR
INE
FR
ESH
WA
TE
R
1
17
21
16
15
14
13
12
11
10
9
8
7 6
5
4 3
2
27
2625
24
23
22
20
19
18
30
29
28
Not
e:
Num
bers
in b
oxes
re
fer
to f
luid
sta
tes.
17
6. RESULTS AND ANALYSIS
Based on the data collected, the following parameters were analyzed:
• Evaporation rate of the BCRS unit • Freshwater production (condensation) rate and recovery ratio • Heat input from the solar pond • Energy consumption rate
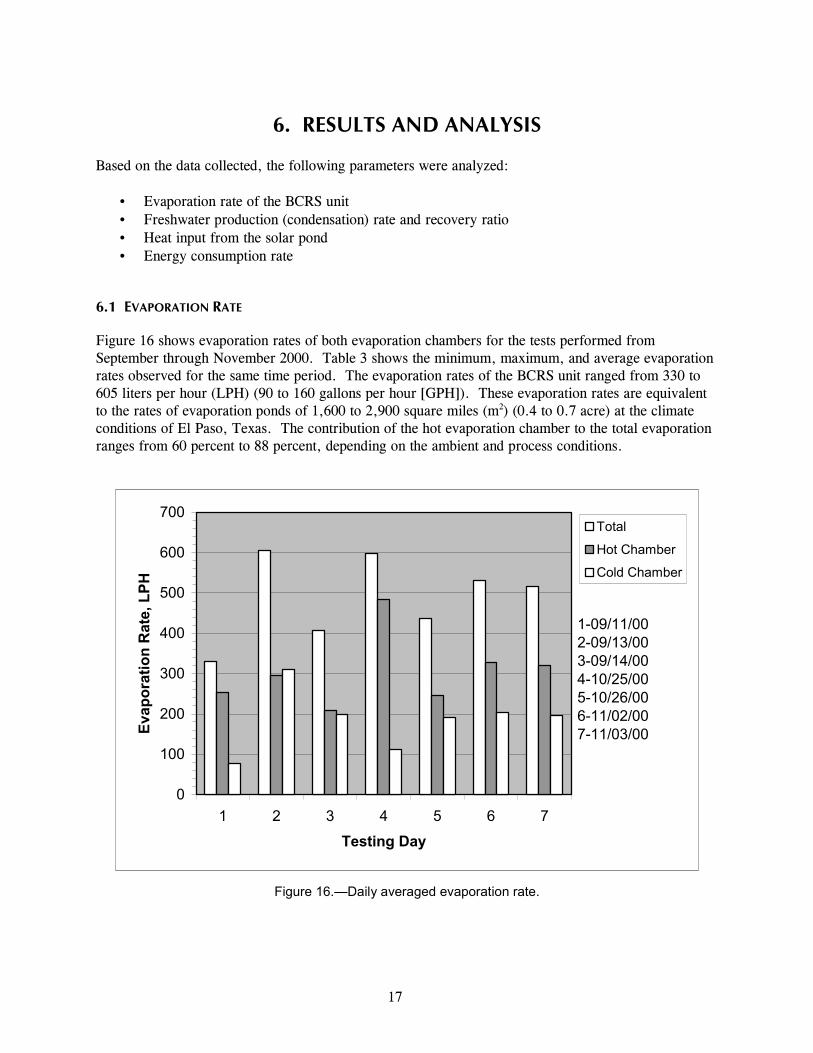
6.1 EVAPORATION RATE
Figure 16 shows evaporation rates of both evaporation chambers for the tests performed from September through November 2000. Table 3 shows the minimum, maximum, and average evaporation rates observed for the same time period. The evaporation rates of the BCRS unit ranged from 330 to 605 liters per hour (LPH) (90 to 160 gallons per hour [GPH]). These evaporation rates are equivalent to the rates of evaporation ponds of 1,600 to 2,900 square miles (m2) (0.4 to 0.7 acre) at the climate conditions of El Paso, Texas. The contribution of the hot evaporation chamber to the total evaporation ranges from 60 percent to 88 percent, depending on the ambient and process conditions.
0
100
200
300
400
500
600
700
1 2 3 4 5 6 7Testing Day
Evap
orat
ion
Rat
e, L
PH
Total
Hot Chamber
Cold Chamber
1-09/11/002-09/13/003-09/14/004-10/25/005-10/26/006-11/02/007-11/03/00
Figure 16.—Daily averaged evaporation rate.
18
Table 3.—Evaporation rates
Minimum Maximum Average LPH GPH LPH GPH LPH GPH
Hot chamber 209 55 485 128 291 77 Cold chamber 76 20 310 82 177 47 Total 329 87 605 160 489 129
Tables 4 and 5 show evaporation rates and corresponding operating conditions for the hot evaporation chamber and cold evaporation chamber, respectively (where Tad and Taw are dry bulb and wet bulb ambient temperatures, respectively). Note that the evaporation rates of both evaporation chambers of the BCRS unit are affected by ambient conditions and brine concentration. As shown in figures 17 and 18, respectively, the evaporation rates decrease with higher salinity and higher relative humidity. In the hot evaporation chamber, the evaporation rates increase with higher brine temperature (see figure 19).
Table 4.—Evaporation rates in hot evaporation chamber
Table 5.—Evaporation rates in cold evaporation chamber
Date Tad Taw RH Brine T Salinity Evap. rate(C) (C) (%) (C) (%) LPH
9/11/00 31.8 16.8 23.0 40.0 15.60 2749/13/00 33.0 16.0 17.0 42.0 26.00 3109/14/00 31.6 16.8 23.5 40.0 24.00 255
10/25/00 21.0 12.4 40.0 37.0 3.50 44510/26/00 21.3 13.1 42.0 34.0 4.00 29711/2/00 17.5 10.5 45.0 32.0 4.60 33011/3/00 16.0 10.8 48.0 34.0 5.00 346
Date Tad Taw RH Brine T Salinity Evap. rate(C) (C) (%) (C) (%) LPH
9/11/00 31.8 16.8 23.0 20.0 26.5 1029/13/00 33.0 16.0 17.0 23.0 26.5 3019/14/00 31.6 16.8 23.5 22.0 26.4 22610/25/00 21.0 12.4 40.0 18.0 26.4 10610/26/00 21.3 13.1 42.0 18.0 26.4 14311/2/00 17.5 10.5 45.0 14.5 26.4 15611/3/00 16.0 10.8 48.0 15.0 26.4 122

19
Figure 17.—Evaporation rate versus salinity.
Figure 18.—Evaporation rate versus relative humidity.
200
250
300
350
400
450
500
0 5 10 15 20 25 30Salinity (%)
Evap
. Rat
e (L
PH)
50
100
150
200
250
300
350
0 10 20 30 40 50 60Relative Humidity (%)
Evap
. Rat
e (L
PH)
20
Figure 19.—Evaporation rate versus brine temperature.
6.2 FRESHWATER PRODUCTION RATE
Figure 20 shows the freshwater production rates (condensation rate) of the BCRS unit for the test period of May through November 2000. In September 2000, a copper tubing heat exchanger was installed in the cold evaporation chamber. This heat exchanger used the brine of the cold chamber to cool the product water before it was sprayed at the top of the condensate tower. It can be seen that the addition of the heat exchanger improved the condensation rate. With the heat exchanger, the condensation rate ranged from 52 to 115 LPH (14 to 30 GPH). The freshwater recovery ratio (defined as the ratio of volumetric flow rate of fresh water produced to the volumetric flow rate of feed brine into the system) ranged from 10 to 26 percent. Table 6 shows the minimum, maximum, and average condensation rates for the test period of September through November 2000. It was found that the condensation rate is significantly affected by ambient and process conditions.
6.3 ENERGY CONSUMPTION RATE
The BCRS requires both thermal energy and electricity. Thermal energy is required to heat the brine in the hot evaporation chamber, and electrical energy is needed to operate pumps, fans, and auxiliary equipment. Energy consumption rates (both thermal and electrical) of the BCRS were analyzed, based on average evaporation or condensation rates, and typical operating conditions. In this analysis, thermal energy consumption was calculated with measured data, but the electrical energy consumption was estimated by nominal powers of each piece of electric equipment. The estimated energy consumption rates are shown in table 7. The energy consumption rates are given in kilowatthours per unit mass of water evaporated (for evaporation) or produced (for condensation).
200
250
300
350
400
450
500
30 32 34 36 38 40 42 44
Brine Temperature (C)
Evap
orat
ion
Rat
e (L
PH)
Salinity:16~26%
Salinity:3.5~5%
21
0
20
40
60
80
100
120
140
1 2 3 4 5 6 7 8 9 10
Testing Day
Con
dens
atio
n R
ate
(LPH
) 1 - 05/01/00 2 - 05/02/00 3 - 09/11/00 4 - 09/12/00 5 - 09/13/00 6 - 09/14/00 7 - 10/25/00 8 - 10/26/00 9 - 11/02/0010 -11/03/00
Figure 20.—Daily averaged condensation rate.
Table 6.—Condensation rate
Minimum Maximum Average LPH GPH LPH GPH LPH GPH 25 7 115 30 71 19
Table 7.—Energy consumption rate
Power kW
Specific kWh/kg
Hot chamber Average evaporation: 291 LPH (0.0808 kg/s) Thermal consumption: at 757 LPM (200 GPM), ρ = 1,159 kg/m3, cB = 4,167 J/kg-ºC, and ∆T = 10 ºC 609 2.093
Electrical consumption 35 0.122 Thermal plus electrical energy consumption for hot evaporation chamber: 644 2.215
Cold chamber Average evaporation: 177 LPH (0.0492 kg/s) Electrical consumption: 21 0.072 Total energy consumption for both evaporation chambers: 665 2.287
Condensation tower Average condensation: 71 LPH (0.0197 kg/s) Electrical consumption 13 0.183 Total energy consumption for condensation (including evaporation chambers): 678 9.560
Note: kW = kilowatt, kWh/kg = kilowatthours per kilogram; kg/s = kilograms per second; kg/m3 = kilograms per cubic meter.
22
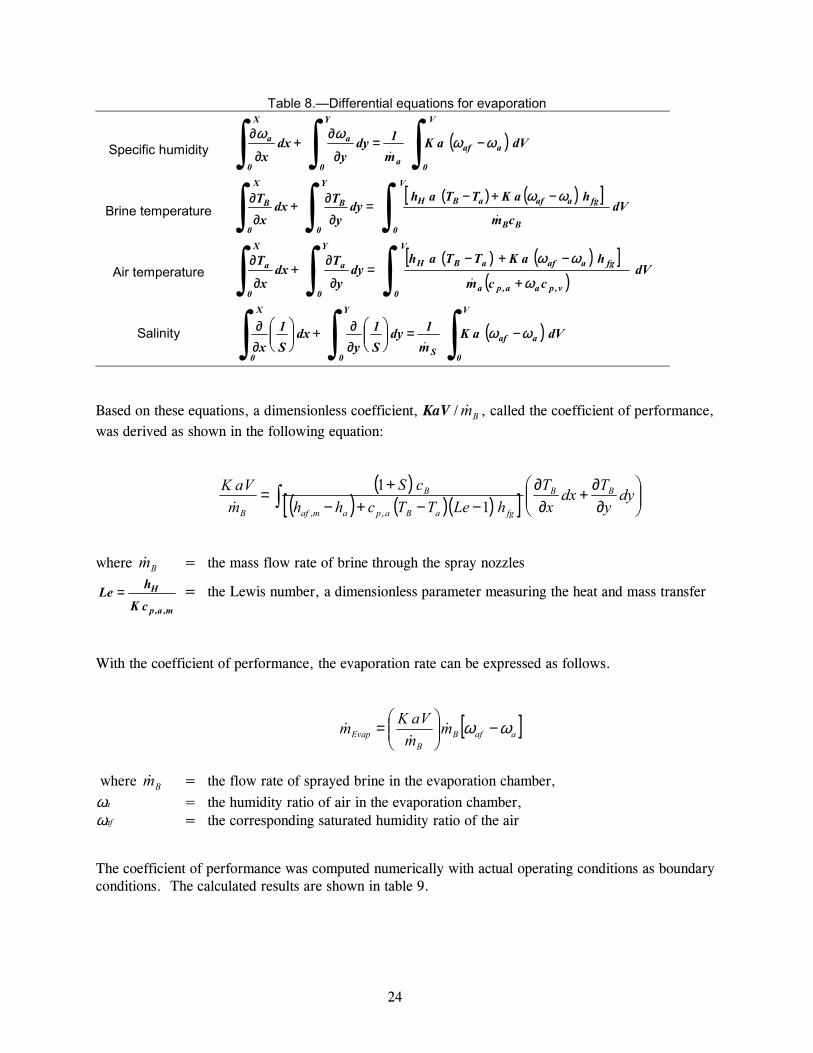
7. MATHEMATICAL MODELS Computer based mathematical models have been developed to describe the evaporation process in both evaporation chambers and the condensation process in the condensation tower. These models are based on the thermodynamic analysis of heat and mass transfer for evaporation or condensation processes. The evaporation process analysis utilized the generally accepted concepts for cooling towers, and the condensation analysis utilized the concepts for direct-contact condensers. Variables involved in the models include the properties and flow rates of different fluids such as air, brine, and fresh water, and the geometries of evaporation chambers and condensation tower. The computer models were built in the form of a spreadsheet (MS Excel), and can be easily used to simulate the evaporation process and condensation process of the BCRS. With these models and experimental data, relationships between operating conditions and performance of the BCRS unit have been developed. These relationships can be used to predict the performance and to modify the design of the BCRS. This report provides only a brief description of these models. For more details about the models, see Becerra [6].
7.1 EVAPORATION CHAMBERS
A two-dimensional model was used for the thermodynamic analysis of the evaporation chambers. Figure 21 shows a sketch of the flow diagram in the evaporation chamber, and figure 22 shows the mass transfer diagram in the evaporation chamber. Where m� denotes corresponding mass flow rate, subscripts a, v, B, and S denote dry air, vapor, brine, and salt, respectively, and subscripts i and e denote inlet or outlet, respectively. At the top of the evaporation chamber, brine is sprayed into a low-humidity air space, creating many near-spherical brine droplets, and a relatively stagnant air film forms on the brine droplet surface. For simplification, it is assumed that the size of a brine droplet is small enough so that its temperature can be considered to be uniform. The temperature of the air film is approximated to the temperature of the droplet. It is also assumed that the air film is saturated at a vapor concentration corresponding to the temperature and salinity of the brine droplet. Steady state operation conditions are also assumed in the modeling. Thus the mass flow rates of air, sprayed brine, feed brine, and salt, as well as the composition of the brine remain constant during the process. The dry air and water vapor are considered as ideal gases. The brine is treated as a pure aqueous solution of sodium chloride. The changes in kinetic and potential energy of the fluids are assumed to be negligible. Direct-contact heat and mass transfer process was used to analyze the evaporation process, and four differential equations, as shown in table 8, were derived; where K is the mass transfer coefficient, and a is the heat transfer surface area per unit volume of brine droplets. These equations were used to determine the two-dimensional distribution of the specific humidity, hot air temperature, cold air temperature, and salinity in the evaporation chambers. For details of the derivation of these equations, see Becerra [6].

23
Figure 21.—Sketch of flowchart of the evaporation chamber.
Figure 22.—Mass interactions in the evaporation chambers.
x
y
dx
dy
edprecipitat,Sm�
i,Bm�
feed,i,Bm�
i,am�
i,vm�
e,am�
e,vm�
e,Bm�
PRECIPITATED SALT
HEATER
BRACKISH WATER
REMOTION OF THE PRECIPITATED SALT
MAKEUP BRACKISH WATER
INDUCTED A TMOSPHERIC AIR
HUMIDIFIED AIR
INLET OF HOT THERMAL FLUID OUTLET OF HOT THERMAL FLUID
HEATED BRACKISH WATER
CONTROL VOLUME
1 2
3
4
5
6
24
Table 8.—Differential equations for evaporation
Specific humidity
Brine temperature
Air temperature
Salinity
( ) dVaKm1dy
ydx
x
V
0
aafa
Y
0
a
X
0
a ��� −=∂
∂+
∂
∂ωω
ωω�
( ) ( )[ ]dV
cm
haKTTahdy
y
Tdxx
TV
0 BB
fgaafaBH
Y
0
B
X
0
B ���−+−
=∂
∂+∂
∂�
ωω
( ) ( )[ ]( )
dVccm
haKTTahdy
y
Tdx
x
TV
0 v,paa,pa
fgaafaBH
Y
0
a
X
0
a ��� +
−+−=
∂
∂+
∂
∂
ω
ωω
�
( ) dVaKm1dy
S1
ydx
S1
x
V
0
aafS
Y
0
X
0 ��� −=���
����
�
∂∂+��
�
����
�
∂∂ ωω
�
Based on these equations, a dimensionless coefficient, KaV / Bm� , called the coefficient of performance, was derived as shown in the following equation:
( )
( ) ( )( )[ ]� ���
����
�
∂∂+
∂∂
−−+−+= dy
yTdx
xT
hLeTTchhcS
mVaK BB
fgaBapamaf
B
B 11
,,�
where Bm� = the mass flow rate of brine through the spray nozzles
m,a,p
H
cK
hLe = = the Lewis number, a dimensionless parameter measuring the heat and mass transfer
With the coefficient of performance, the evaporation rate can be expressed as follows.
[ ]aafBB
Evap mmVaKm ωω −���
����
�= �
��
where Bm� = the flow rate of sprayed brine in the evaporation chamber,
ωa = the humidity ratio of air in the evaporation chamber, ωaf = the corresponding saturated humidity ratio of the air
The coefficient of performance was computed numerically with actual operating conditions as boundary conditions. The calculated results are shown in table 9.

25
Table 9.—Calculated coefficient of performance for evaporation
Test Ta,db,i Ta,wb,i Ta,db,o mam ,� TB,i* Bm� Salinity BmVaK
�
(oC) (oC) (oC) (kg/s) (oC) (kg/s)
(%, mass) (kga/kgw)
1 31.8 16.8 36.8 10.7 40.0 37.17 15.6 0.15 2 33.0 16.0 38.5 10.7 42.0 37.17 26.0 0.20 3 31.6 16.8 36.8 10.7 40.0 37.20 24.3 0.18 4 21.0 12.4 33.9 11.1 37.0 38.00 3.5 0.25 5 21.3 13.1 32.0 11.1 34.0 38.60 4.0 0.20 6 19.0 10.5 30.3 11.2 32.0 38.95 4.6 0.25 7 17.0 10.8 30.8 11.3 34.0 39.18 5.0 0.23
7.2 CONDENSATION TOWER
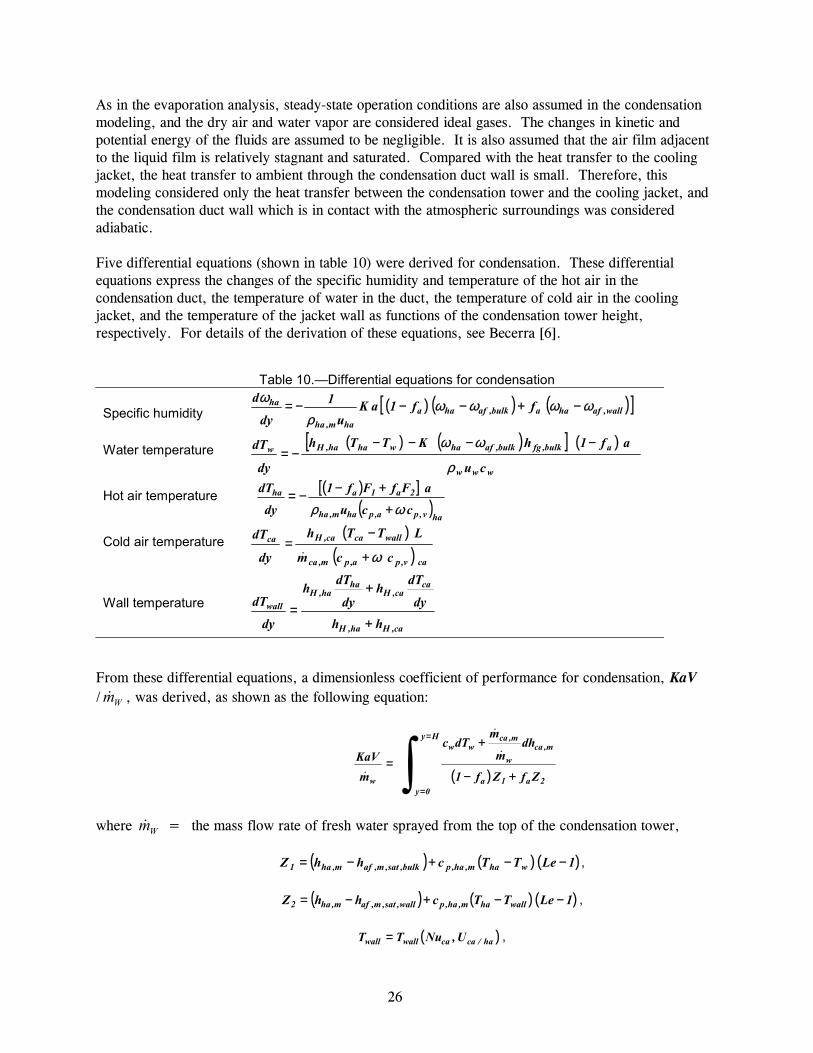
Similar to the evaporation analysis, a two-dimensional model was used for the thermodynamic analysis of the condensation tower. Figure 23 shows the heat and mass transfer diagram in the condensation tower. The packed condensation duct of the condensation tower (shown in figure 15) is enclosed by four walls. Three walls are surrounded by the cooling jacket, through which the cold air stream from the cold evaporation chamber flows. The fourth wall is in contact with ambient air. The thermal performance of the condensation tower is affected by two simultaneous heat exchange processes: (1) direct-contact heat transfer inside the packed condensation duct between the warm humid air stream from the hot evaporation chamber and the cold fresh water sprayed from the top of the condensation tower; and (2) indirect contact heat exchange through the walls between the warm air stream inside the condensation duct and the cold air stream in the cooling jacket. In the condensation duct, the humid air stream flowing upward is cooled through both the heat exchange processes. As a result, condensation occurs, and liquid films form on the surface of the packing material and inner surface of the duct wall and flow downward by gravity.
Figure 23.—Energy and mass interactions in the condensation tower.
y
dy
i,aahm�
i,vi,v hm�
Cooling Jacket
jacketQ�
i,wi,w hm� e,aahm�e,ve,v hm�
Condensation Duct
e,we,w hm�
H
L
26
As in the evaporation analysis, steady-state operation conditions are also assumed in the condensation modeling, and the dry air and water vapor are considered ideal gases. The changes in kinetic and potential energy of the fluids are assumed to be negligible. It is also assumed that the air film adjacent to the liquid film is relatively stagnant and saturated. Compared with the heat transfer to the cooling jacket, the heat transfer to ambient through the condensation duct wall is small. Therefore, this modeling considered only the heat transfer between the condensation tower and the cooling jacket, and the condensation duct wall which is in contact with the atmospheric surroundings was considered adiabatic. Five differential equations (shown in table 10) were derived for condensation. These differential equations express the changes of the specific humidity and temperature of the hot air in the condensation duct, the temperature of water in the duct, the temperature of cold air in the cooling jacket, and the temperature of the jacket wall as functions of the condensation tower height, respectively. For details of the derivation of these equations, see Becerra [6].
Table 10.—Differential equations for condensation Specific humidity Water temperature Hot air temperature Cold air temperature Wall temperature
( ) ( ) ( )[ ]wall,afhaabulk,afhaaham,ha
ha ff1aKu1
dy
d ωωωωρ
ω −+−−−=
( ) ( )[ ] ( )
www
abulk,fgbulk,afhawhaha,Hw
cu
af1hKTTh
dy
dT
ρ
ωω −−−−−=
( )[ ]( )
hav,pa,pham,ha
2a1aha
ccu
aFfFf1
dy
dT
ωρ +
+−−=
( )( ) cav,pa,pm,ca
wallcaca,Hca
ccm
LTTh
dy
dT
ω+
−=
�
ca,Hha,H
caca,H
haha,H
wall
hhdy
dThdy
dTh
dy
dT
+
+
=
From these differential equations, a dimensionless coefficient of performance for condensation, KaV / Wm� , was derived, as shown as the following equation:
( )�=
=+−
+
=
Hy
0y2a1a
m,caw
m,caww
w ZfZf1
dhm
mdTc
mKaV �
�
�
where Wm� = the mass flow rate of fresh water sprayed from the top of the condensation tower,
( ) ( ) ( )1LeTTchhZ wham,ha,pbulk,sat,m,afm,ha1 −−+−= ,
( ) ( ) ( )1LeTTchhZ wallham,ha,pwall,sat,m,afm,ha2 −−+−= ,
( )ha/cacawallwall U,NuTT = ,

27
and m,a,p
H
cK
hLe = = the Lewis number.
With the coefficient of performance, the condensation rate can be expressed as follows:
[ ]afhaWW
Cond mmVaKm ωω −���
����
�= �
��
where Wm� = the flow rate of sprayed water at the top of the condensation tower
ωha = is the humidity ratio of the hot air in the condensation duct ωaf = is the saturated humidity ratio of the air at cooled temperature The coefficient of performance for condensation was computed numerically with actual operating conditions as boundary conditions. The calculated results are shown in table 11.
Table 11.—Calculated coefficient of performance for condensation
Test Tha,i Thao Tca,i Tca,o Tw,i Tw,o
haw mm ��
cam� af
wm
VaK�
(oC) (oC) (oC) (oC) (oC) (oC) (kg/s) (kg/s) (%) (kga/kgw) 1 36.2 34.8 19.9 20.0 29.6 33.1 0.61 5.61 3.0 0.80 2 36.5 34.8 18.6 18.7 28.4 33.0 0.59 5.49 0.4 0.90 3 38.7 37.3 21.5 21.6 30.0 34.0 0.59 5.48 3.0 0.40 4 39.0 38.0 24.7 24.7 32.1 35.3 0.57 5.31 0.4 0.50 5 35.3 33.7 18.1 18.2 30.4 32.7 1.03 9.59 0.6 0.70 6 31.9 30.4 15.8 15.9 25.0 29.7 0.77 7.11 0.6 0.60 7 31.1 28.6 14.5 14.6 23.8 28.3 0.67 6.25 3.0 1.30 8 30.9 29.3 15.4 15.5 22.9 30.2 0.26 2.45 0.4 3.00
7.3 COMPARISON WITH TEST DATA
From experimental data, the following correlations for both evaporation chambers and condensation tower were developed by regression analysis. The coefficient of performance for evaporation can be expressed as:
0021.0
1419.1
,
,,,0114.0 −
−
��
�
�
��
�
� −= S
TTT
mVaK
iB
iwbaiB
B�

28
The coefficient of performance for condensation can be expressed as:
5402.1
,
,,5544.1
0011.0−−
��
�
�
��
�
� −���
����
�=
iha
iwiha
ha
w
w TTT
mm
mVaK
�
�
�
The evaporation rate can be expressed as:
0866.04457.0
,0061.0 −���
����
� −= S
TTT
mm
B
wbaB
B
evap
�
�
The condensation rate can be expressed as:
1646.07183.0
0075.0 ���
����
� −���
����
�=
−
ha
wha
ha
w
w
cond
TTT
mm
mm
�
�
�
�
Figures 24 and 25 show the comparisons between the calculated data with the models and the experimental data for evaporation rate and condensation rate, respectively.
Figure 24.—Comparison between calculated data and experimental data for evaporation.
0
100
200
300
400
500
600
0 100 200 300 400 500 600
Calculated evaporation rate (LPH) Mea
sure
d ev
apor
atio
n ra
te (L
PH)
Hot Chamber
Cold Chamber
Parity Line
29
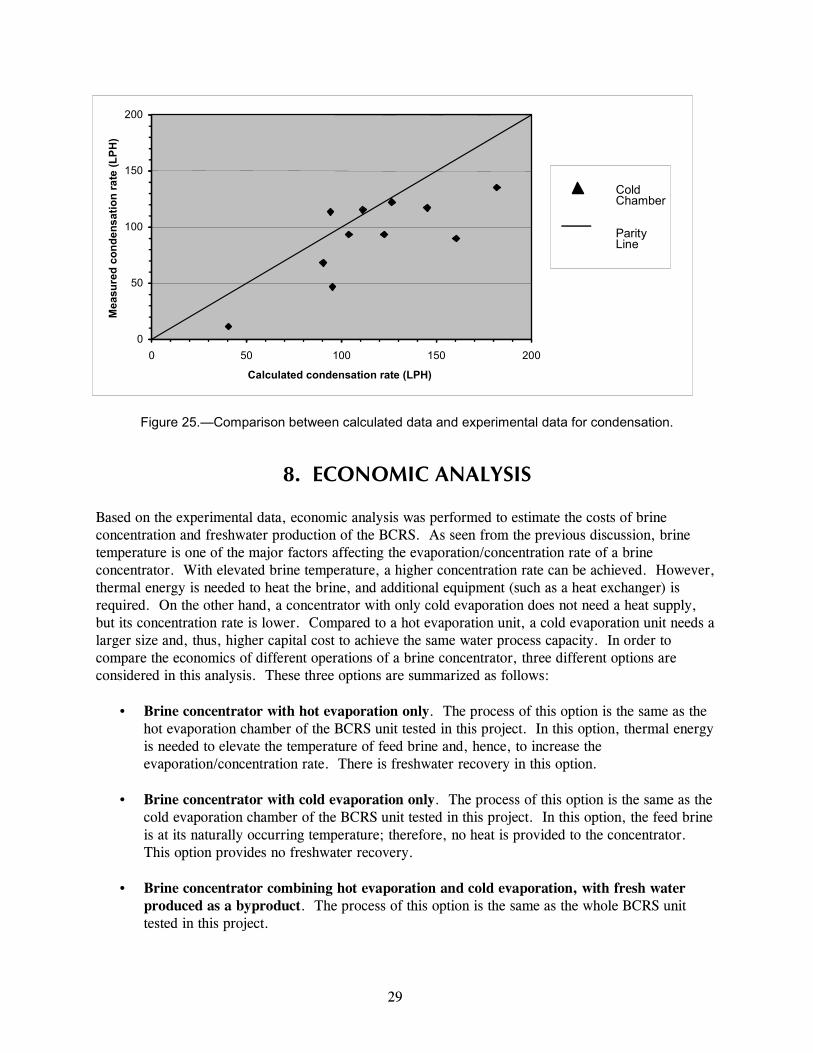
Figure 25.—Comparison between calculated data and experimental data for condensation.
8. ECONOMIC ANALYSIS Based on the experimental data, economic analysis was performed to estimate the costs of brine concentration and freshwater production of the BCRS. As seen from the previous discussion, brine temperature is one of the major factors affecting the evaporation/concentration rate of a brine concentrator. With elevated brine temperature, a higher concentration rate can be achieved. However, thermal energy is needed to heat the brine, and additional equipment (such as a heat exchanger) is required. On the other hand, a concentrator with only cold evaporation does not need a heat supply, but its concentration rate is lower. Compared to a hot evaporation unit, a cold evaporation unit needs a larger size and, thus, higher capital cost to achieve the same water process capacity. In order to compare the economics of different operations of a brine concentrator, three different options are considered in this analysis. These three options are summarized as follows:
• Brine concentrator with hot evaporation only. The process of this option is the same as the hot evaporation chamber of the BCRS unit tested in this project. In this option, thermal energy is needed to elevate the temperature of feed brine and, hence, to increase the evaporation/concentration rate. There is freshwater recovery in this option.
• Brine concentrator with cold evaporation only. The process of this option is the same as the
cold evaporation chamber of the BCRS unit tested in this project. In this option, the feed brine is at its naturally occurring temperature; therefore, no heat is provided to the concentrator. This option provides no freshwater recovery.
• Brine concentrator combining hot evaporation and cold evaporation, with fresh water
produced as a byproduct. The process of this option is the same as the whole BCRS unit tested in this project.
0
50
100
150
200
0 50 100 150 200
Calculated condensation rate (LPH)
Mea
sure
d co
nden
satio
n ra
te (L
PH)
Cold Chamber
Parity Line
30
The economic analysis is summarized in the following sections. For details, see Becerra [6]. The cost of concentration with brine concentrator is also compared with the costs of other concentrate disposal options, especially deep well injection and evaporation pond disposal.
8.1 METHOD AND PROCEDURE OF COST ANALYSIS
The factored estimate method [7] was used to evaluate the costs of concentration and freshwater production of the BCRS. The costs, denoted by p and expressed in dollars per 1,000 gallons of processed water, were estimated by using the following equation:
where: G = the water process rate IF = the total capital cost of the BCRS C = operation and maintenance (O&M) cost t = tax rate d = depreciation rate e = capital recovery factor im = minimum acceptable rate of return The O&M cost includes energy cost and maintenance and repair cost. In this analysis, the maintenance and repair cost is assumed as 2 percent of the capital cost IF, and other factors are assumed as follows: Tax rate t = 0.06 $/$ Depreciation rate d = 0.10 $/$-year Capital recovery factor e = 0.10 $/$-year Minimum acceptable rate of return im = 0.20 $/$-year
The cost analysis was performed in two steps. The first step was to estimate the costs of using a BCRS unit of the same size as the one tested in this project. The second step was to estimate the costs of using larger units by scaling up. The small unit tested in this project has concentration rates ranging from 2,000 to 4,000 GPD, and its costs tend to be very high. The costs of this unit were used as base values for calculating the costs of larger units. For most practical applications, the necessary amount of concentrate to be treated is in the order of millions of GPD; therefore, much larger BCRS units will be required. Costs would decrease significantly as the plant capacities increase from several thousand GPD to several million GPD. In the scaling-up calculation, it was assumed that all unit costs, except the unit energy cost, decrease at the same proportion and are estimated by the following equation [6]:
71
0
0GGpp
−
��
�
�
��
�
�= .
( )
GtIdtieC
pFm
−−+
+= 1

31
where p = is the scaled up cost p0 = is the base cost G = the desired production rate (concentration rate or freshwater production rate) G0 = the base production rate, which equals the rate of the BCRS unit tested in this project
8.2 RESULTS OF COST ANALYSIS
8.2.1 Concentration Cost for Hot Evaporation
In this cost analysis, the assumed operating conditions are shown in table 12. The thermal energy consumption rate was estimated as 895 kilowatthours per cubic meter (kWh/m3) or 3,400 kilowatthours per 1,000 gallons (kWh/1,000 gal) of brine evaporated. Here it was assumed that there was a heat loss of 20 percent through the unit and piping system. The electricity consumption rate was about 80 kWh/m3 or 300 kWh/1,000 gal of brine evaporated. The cost of thermal energy is assumed as $0.01/kWh (thermal), based on estimated cost of heat from a moderate-sized solar pond [8], and the cost of electricity was assumed as $0.10/kWh. The estimated costs are shown in table 13. As an example, for a 1-million-gallon-per-day (MGD) unit of hot evaporation, the total capital cost is about $10 million, and the concentration cost is about $24/m3 or $91/1,000 gal. For this unit, the energy cost represents about 80 percent of the total concentration cost for the BCRS with hot evaporation. Thermal energy constitutes about 55 percent, and electricity counts about 25 percent, of the total concentration cost.
Table 12.—Assumed operating conditions for hot evaporation Inlet air conditions: Wet bulb temperature 15 ºC (288 K) Mass flow rate 11 kg/s Sprayed brine conditions: Salinity 25% Temperature 46 ºC (319 K) Density 1,170 kg/m3 Enthalpy 192,629 J/kg Mass flow rate 37 kg/s (500 GPM) Brine conditions at basin: Salinity 25% Temperature 43 ºC (311 K) Density 1,175 kg/m3 Enthalpy 180,098 J/kg
Table 13.—Estimated concentration costs for hot evaporation Processed brine Cost as a stand-alone unit
(m3/day) (MGD) ($/m3) ($/1,000 gal) 400 0.1 27 104
4,000 1.0 24 91 20,000 5.0 22 84
100,000 25.0 21 79

32
8.2.2 Concentration Cost for Cold Evaporation The assumed operating conditions for cold evaporation are shown in table 14. The electricity consumption rate was about 174 kWh/m3 or 660 kWh/1,000 gal of brine evaporated. The cost of electricity was assumed as $0.10/kWh. The estimated concentration costs are shown in table 15. As an example, for a 1-MGD unit, the total capital cost is about $13.5 million, and the concentration cost is about $15/m3 or $56/1,000 gal. It was found that for this 1-MGD unit, electricity constitutes about 80 percent of the total concentration cost.
Table 14.—Assumed operating conditions for cold evaporation Inlet air conditions: Wet bulb temperature 17 ºC (290 K) Mass flow rate 11 kg/s Sprayed brine conditions: Salinity 25% Temperature 22 ºC (295 K) Density 1,185 kg/m3 Enthalpy 79,764 J/kg Mass flow rate 37 kg/s (500 GPM) Brine conditions at basin: Salinity 25% Temperature 20 ºC (293 K) Density 1,185 kg/m3 Enthalpy 83,951 J/kg
Table 15.—Estimated concentration costs for cold evaporation Processed brine Cost as a stand-alone unit
(m3/day) (MGD) ($/m3) ($/1,000 gal) 400 0.1 17 64
4,000 1.0 15 56 20,000 5.0 14 53
100,000 25.0 13 49 8.2.3 Concentration Cost and Freshwater Production Cost for Hot and Cold Evaporation
In this case, the BCRS unit contains a hot evaporation chamber, a cold evaporation chamber, and a condensation tower. In addition to concentrating the brine through evaporation, this unit also recovers some fresh water as a byproduct. The assumed operating conditions for condensation are shown in table 16. The estimated costs are shown in table 17. As an example, for a 1-MGD unit, the capital cost of evaporation chambers is about $11 million, and the capital cost of condensation tower is about $15,000. The concentration cost is about $20/m3 or $77/1,000 gal, and the cost for freshwater production is about $13/m3 or $50/1,000 gal.
33
Table 16.—Assumed operating conditions for condensation Hot air conditions at the inlet of the tower: Dry bulb temperature 38 ºC (311 K) Relative humidity 100% Mass low rate 11 kg/s Sprayed water conditions: Temperature 30 ºC (303 K) Mass flow rate 10 kg/s (160 GPM) Water conditions at basin: Temperature 33 ºC (306 K)
Table 17.—Estimated costs for hot and cold evaporation as a stand-alone unit Processed brine Concentration cost Freshwater cost
(m3/day) (MGD) ($/m3) ($/1,000 gal) ($/m3) ($/1,000 gal) 400 0.1 28 107 15 59
4,000 1.0 20 77 13 50 20,000 5.0 16 61 12 46
100,000 25.0 13 49 11 42
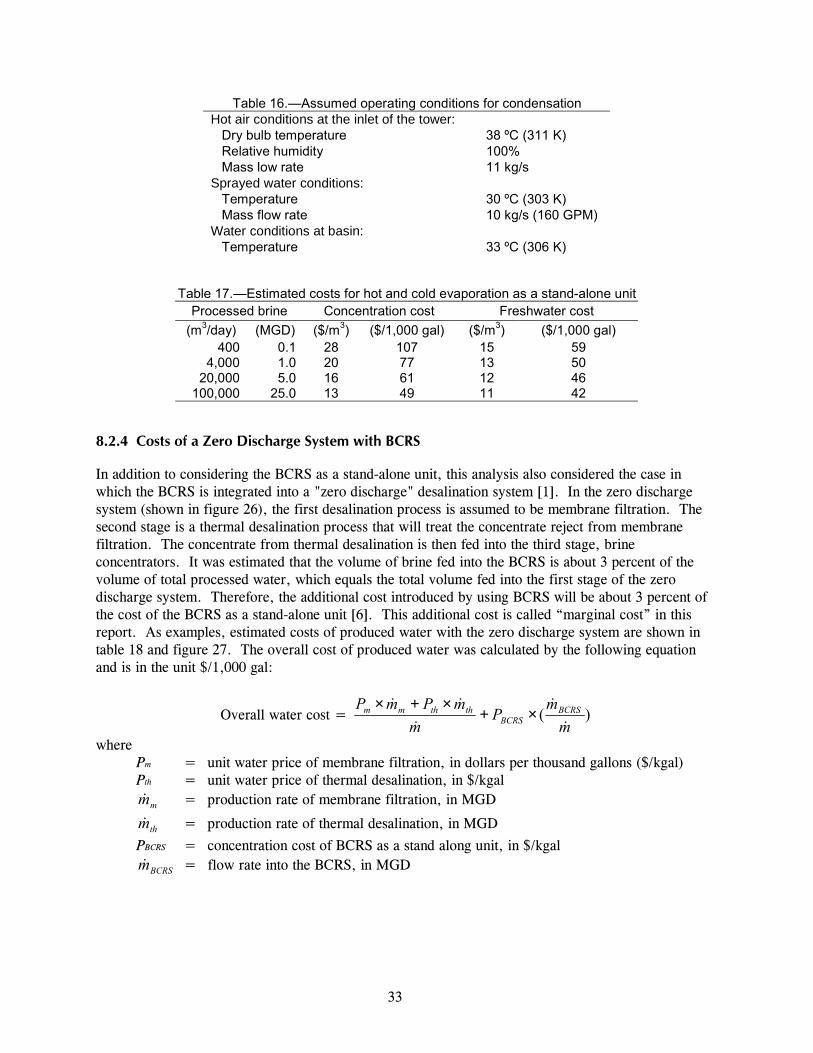
8.2.4 Costs of a Zero Discharge System with BCRS
In addition to considering the BCRS as a stand-alone unit, this analysis also considered the case in which the BCRS is integrated into a "zero discharge" desalination system [1]. In the zero discharge system (shown in figure 26), the first desalination process is assumed to be membrane filtration. The second stage is a thermal desalination process that will treat the concentrate reject from membrane filtration. The concentrate from thermal desalination is then fed into the third stage, brine concentrators. It was estimated that the volume of brine fed into the BCRS is about 3 percent of the volume of total processed water, which equals the total volume fed into the first stage of the zero discharge system. Therefore, the additional cost introduced by using BCRS will be about 3 percent of the cost of the BCRS as a stand-alone unit [6]. This additional cost is called “marginal cost” in this report. As examples, estimated costs of produced water with the zero discharge system are shown in table 18 and figure 27. The overall cost of produced water was calculated by the following equation and is in the unit $/1,000 gal:
Overall water cost = )(m
mP
mmPmP BCRS
BCRSththmm
�
�
�
��×+
×+×
where Pm = unit water price of membrane filtration, in dollars per thousand gallons ($/kgal) Pth = unit water price of thermal desalination, in $/kgal mm� = production rate of membrane filtration, in MGD
thm� = production rate of thermal desalination, in MGD
PBCRS = concentration cost of BCRS as a stand along unit, in $/kgal BCRSm� = flow rate into the BCRS, in MGD

34
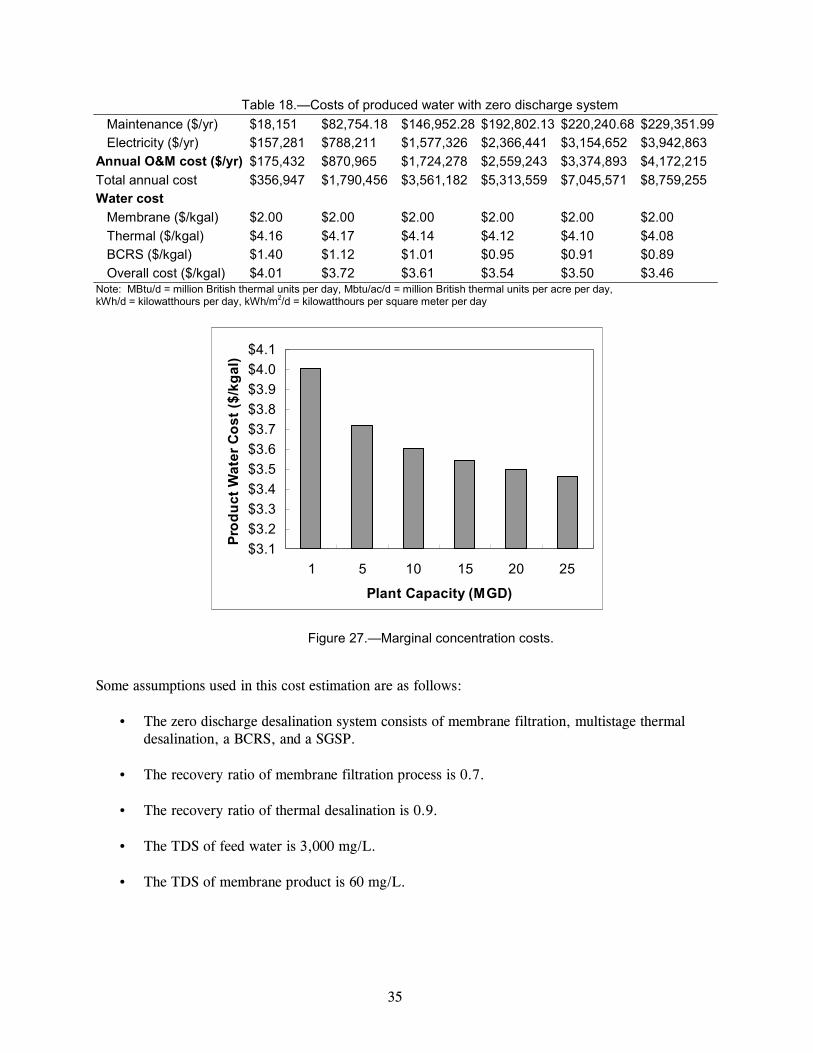
Figure 26.—Flowchart of zero discharge system.
Table 18.—Costs of produced water with zero discharge system Plant capacity (MGD) 1 5 10 15 20 25 Membrane feed (MGD) 0.87 4.36 8.73 13.09 17.45 21.81 Bypass rate (MGD) 0.15 0.77 1.54 2.31 3.07 3.84 Membrane filtration Production rate (MGD) 0.6 3.1 6.1 9.2 12.2 15.3 Reject TDS (mg/L) 9,860 9,860 9,860 9,860 9,860 9,860 Reject rate (MGD) 0.26 1.31 2.62 3.93 5.24 6.54 Thermal distillation Production rate (MGD) 0.23 1.18 2.36 3.53 4.71 5.89 Reject TDS (mg/L) 98,510 98,510 98,510 98,510 98,510 98,510 Reject rate (MGD) 0.026 0.131 0.262 0.393 0.524 0.654 Economy ratio 4.0 4.0 4.0 4.0 4.0 4.0 Thermal (MBtu/d) 490 2,456 4,915 7,374 9,830 12,286 Electricity (kWh/d) 4,309 21,595 43,214 64,834 86,429 108,024 Solar radiation (kWh/m2/d) 5.7 5.7 5.7 5.7 5.7 5.7 (MBtu/ac/d) 77.8 77.8 77.8 77.8 77.8 77.8 Solar pond costs Pond size (acre) 45 226 451 677 903 1,128 Total capital cost $1,773,932 $8,890,049 $17,790,294 $26,690,538 $35,580,587 $44,470,636 Instrumentation $62,499 $152,755 $265,639 $378,523 $491,278 $604,033 Thermal equipment $483,938 $2,711,375 $5,425,859 $8,140,344 $10,851,719 $13,563,094Total capital cost $2,320,369 $11,754,179 $23,481,792 $35,209,405 $46,923,584 $58,637,763 Interest rate 6% 6% 6% 6% 6% 6% Depreciation (yr) 25 25 25 25 25 25 Annualized cost $181,515 $919,491 $1,836,904 $2,754,316 $3,670,678 $4,587,040 O&M cost
Membrane Filtration
Thermal Desalination
Reject
Reject
Bypass
Feed water Product water
Product
Product
BCRS
SGSP
Thermal energy
Salt slurry
35
Table 18.—Costs of produced water with zero discharge system Maintenance ($/yr) $18,151 $82,754.18 $146,952.28 $192,802.13 $220,240.68 $229,351.99 Electricity ($/yr) $157,281 $788,211 $1,577,326 $2,366,441 $3,154,652 $3,942,863 Annual O&M cost ($/yr) $175,432 $870,965 $1,724,278 $2,559,243 $3,374,893 $4,172,215 Total annual cost $356,947 $1,790,456 $3,561,182 $5,313,559 $7,045,571 $8,759,255 Water cost Membrane ($/kgal) $2.00 $2.00 $2.00 $2.00 $2.00 $2.00 Thermal ($/kgal) $4.16 $4.17 $4.14 $4.12 $4.10 $4.08 BCRS ($/kgal) $1.40 $1.12 $1.01 $0.95 $0.91 $0.89 Overall cost ($/kgal) $4.01 $3.72 $3.61 $3.54 $3.50 $3.46 Note: MBtu/d = million British thermal units per day, Mbtu/ac/d = million British thermal units per acre per day, kWh/d = kilowatthours per day, kWh/m2/d = kilowatthours per square meter per day
Figure 27.—Marginal concentration costs.
Some assumptions used in this cost estimation are as follows:
• The zero discharge desalination system consists of membrane filtration, multistage thermal desalination, a BCRS, and a SGSP.
• The recovery ratio of membrane filtration process is 0.7.
• The recovery ratio of thermal desalination is 0.9.
• The TDS of feed water is 3,000 mg/L. • The TDS of membrane product is 60 mg/L.
$3.1$3.2$3.3$3.4$3.5$3.6$3.7$3.8$3.9$4.0$4.1
1 5 10 15 20 25
Plant Capacity (MGD)
Prod
uct W
ater
Cos
t ($/
kgal
)

36
• The TDS of thermal desalination product is 10 mg/L.
• The required product water TDS is 500 mg/L.
• Some feed water bypasses the processing system and mixed with the two product streams from membrane and thermal desalination to meet product TDS requirements.
• Membrane product cost is $2.0/1,000 gal.
• The BCRS uses cold evaporation process and concentrates the brine to salt slurry. The salt
slurry is charged into the SGSP.
• Electricity was purchased at $0.10/kWh. • SGSP provides thermal energy to the thermal desalination process.
• The thermal efficiency of SGSP is 14 percent.
8.3 COMPARISON WITH ALTERNATIVE DISPOSAL METHODS
Three alternative brine disposal methods were compared with the BCRS: (1) deep-well injection; (2) evaporation ponds; and (3) conventional crystallizer. The costs for brine disposal using these methods were estimated based on the study by Mickley [9]. Tables 19, 20, and 21 show the produced water costs with deep well injection, evaporation ponds, and crystallizer, respectively. For estimating the cost of using the crystallizer, Mickley's model is valid for flows ranging from a 0.4-MGD to 2.0 MGD. Therefore, the costs for flows over 2.0 MGD were estimated by assuming their capital costs are directly proportional to the capital cost of 2.0 MGD plant. Costs for solid salt disposal were added into the costs of both evaporation ponds and crystallizer methods. It was assumed that the solid salt disposal cost is $30/ton. Table 22 and figure 28 show the comparison of produced water costs with different disposal methods. Among these four disposal methods, deep well injection is the cheapest method, and crystallizer is the most expensive method. The cost of brine concentration using a BCRS-SGSP combination is similar to the cost using evaporation ponds but uses much less land than evaporation ponds. It should be noted that the BCRS tested in this project is not optimized, and its electricity consumption rate (about 520 kWh/1,000 gal of feed water flow) is very high. If the electricity consumption rate can be reduced to about 100 kWh/1,000 gal, which is approximately the electricity consumption rate of commercial brine concentrators [9], the cost of the zero discharge system would be reduced.
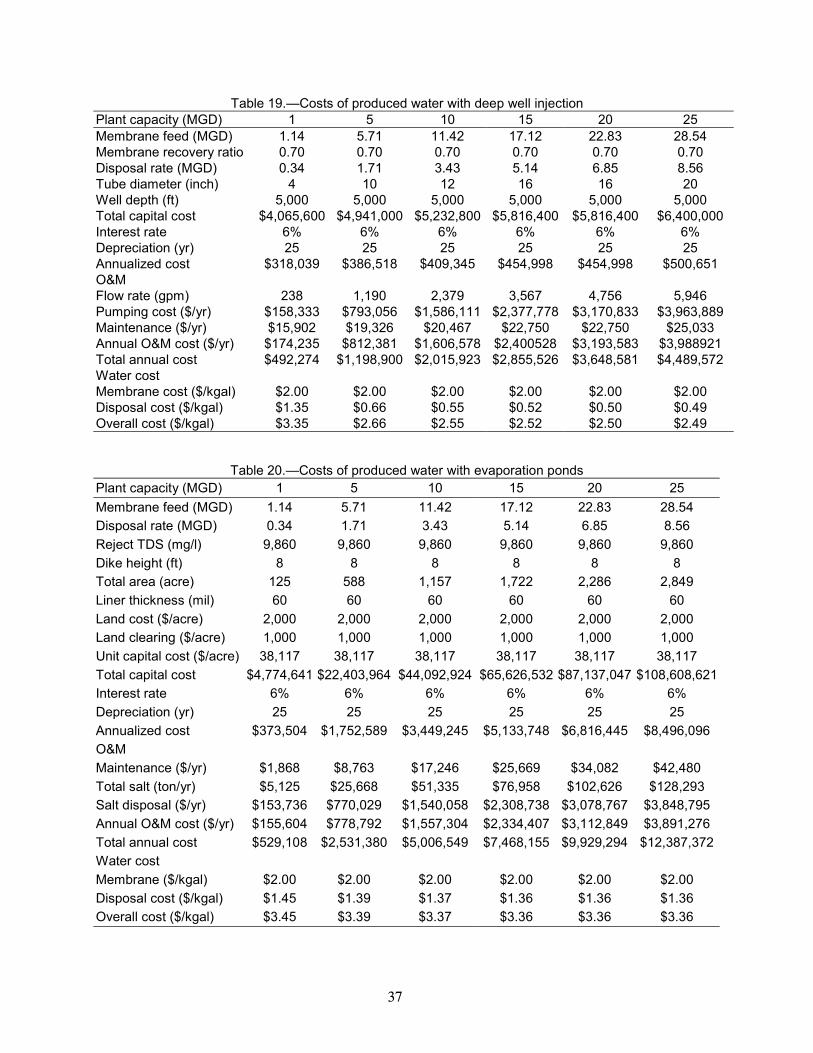
37
Table 19.—Costs of produced water with deep well injection Plant capacity (MGD) 1 5 10 15 20 25 Membrane feed (MGD) 1.14 5.71 11.42 17.12 22.83 28.54 Membrane recovery ratio 0.70 0.70 0.70 0.70 0.70 0.70 Disposal rate (MGD) 0.34 1.71 3.43 5.14 6.85 8.56 Tube diameter (inch) 4 10 12 16 16 20 Well depth (ft) 5,000 5,000 5,000 5,000 5,000 5,000 Total capital cost $4,065,600 $4,941,000 $5,232,800 $5,816,400 $5,816,400 $6,400,000 Interest rate 6% 6% 6% 6% 6% 6% Depreciation (yr) 25 25 25 25 25 25 Annualized cost $318,039 $386,518 $409,345 $454,998 $454,998 $500,651 O&M Flow rate (gpm) 238 1,190 2,379 3,567 4,756 5,946 Pumping cost ($/yr) $158,333 $793,056 $1,586,111 $2,377,778 $3,170,833 $3,963,889 Maintenance ($/yr) $15,902 $19,326 $20,467 $22,750 $22,750 $25,033 Annual O&M cost ($/yr) $174,235 $812,381 $1,606,578 $2,400528 $3,193,583 $3,988921 Total annual cost $492,274 $1,198,900 $2,015,923 $2,855,526 $3,648,581 $4,489,572 Water cost Membrane cost ($/kgal) $2.00 $2.00 $2.00 $2.00 $2.00 $2.00 Disposal cost ($/kgal) $1.35 $0.66 $0.55 $0.52 $0.50 $0.49 Overall cost ($/kgal) $3.35 $2.66 $2.55 $2.52 $2.50 $2.49
Table 20.—Costs of produced water with evaporation ponds Plant capacity (MGD) 1 5 10 15 20 25 Membrane feed (MGD) 1.14 5.71 11.42 17.12 22.83 28.54 Disposal rate (MGD) 0.34 1.71 3.43 5.14 6.85 8.56 Reject TDS (mg/l) 9,860 9,860 9,860 9,860 9,860 9,860 Dike height (ft) 8 8 8 8 8 8 Total area (acre) 125 588 1,157 1,722 2,286 2,849 Liner thickness (mil) 60 60 60 60 60 60 Land cost ($/acre) 2,000 2,000 2,000 2,000 2,000 2,000 Land clearing ($/acre) 1,000 1,000 1,000 1,000 1,000 1,000 Unit capital cost ($/acre) 38,117 38,117 38,117 38,117 38,117 38,117 Total capital cost $4,774,641 $22,403,964 $44,092,924 $65,626,532 $87,137,047 $108,608,621Interest rate 6% 6% 6% 6% 6% 6% Depreciation (yr) 25 25 25 25 25 25 Annualized cost $373,504 $1,752,589 $3,449,245 $5,133,748 $6,816,445 $8,496,096 O&M Maintenance ($/yr) $1,868 $8,763 $17,246 $25,669 $34,082 $42,480 Total salt (ton/yr) $5,125 $25,668 $51,335 $76,958 $102,626 $128,293 Salt disposal ($/yr) $153,736 $770,029 $1,540,058 $2,308,738 $3,078,767 $3,848,795 Annual O&M cost ($/yr) $155,604 $778,792 $1,557,304 $2,334,407 $3,112,849 $3,891,276 Total annual cost $529,108 $2,531,380 $5,006,549 $7,468,155 $9,929,294 $12,387,372Water cost Membrane ($/kgal) $2.00 $2.00 $2.00 $2.00 $2.00 $2.00 Disposal cost ($/kgal) $1.45 $1.39 $1.37 $1.36 $1.36 $1.36 Overall cost ($/kgal) $3.45 $3.39 $3.37 $3.36 $3.36 $3.36
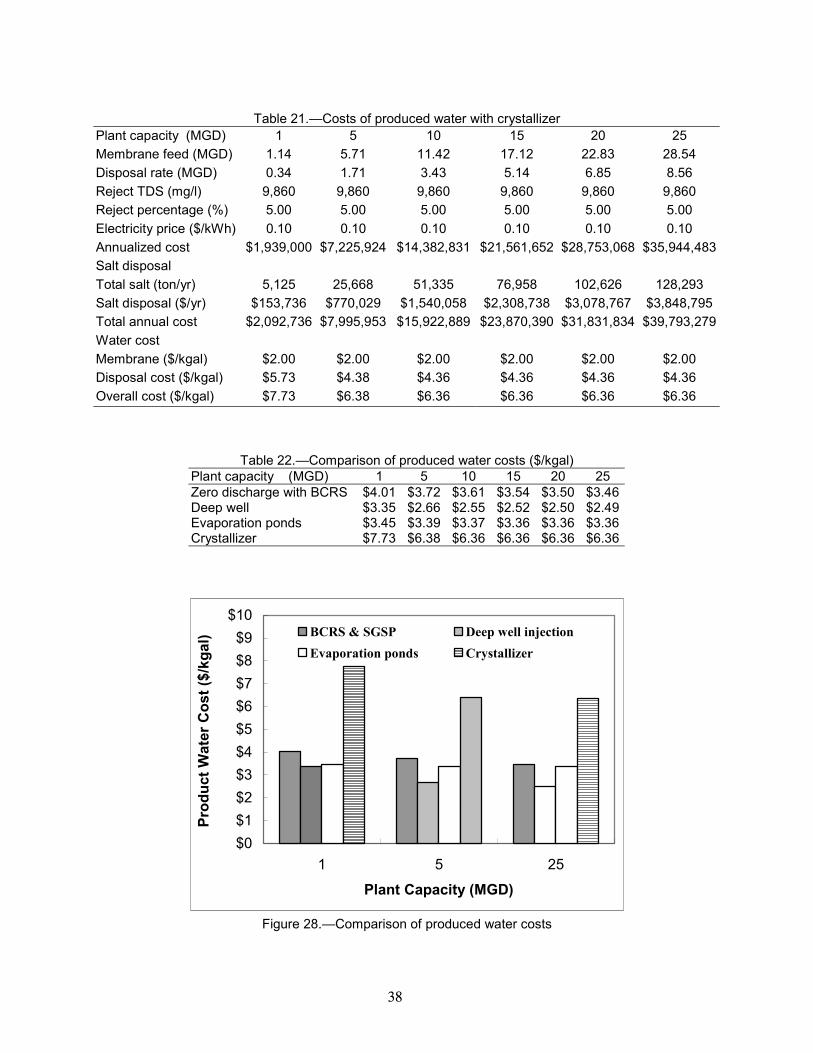
38
Table 21.—Costs of produced water with crystallizer
Plant capacity (MGD) 1 5 10 15 20 25 Membrane feed (MGD) 1.14 5.71 11.42 17.12 22.83 28.54 Disposal rate (MGD) 0.34 1.71 3.43 5.14 6.85 8.56 Reject TDS (mg/l) 9,860 9,860 9,860 9,860 9,860 9,860 Reject percentage (%) 5.00 5.00 5.00 5.00 5.00 5.00 Electricity price ($/kWh) 0.10 0.10 0.10 0.10 0.10 0.10 Annualized cost $1,939,000 $7,225,924 $14,382,831 $21,561,652 $28,753,068 $35,944,483Salt disposal Total salt (ton/yr) 5,125 25,668 51,335 76,958 102,626 128,293 Salt disposal ($/yr) $153,736 $770,029 $1,540,058 $2,308,738 $3,078,767 $3,848,795Total annual cost $2,092,736 $7,995,953 $15,922,889 $23,870,390 $31,831,834 $39,793,279Water cost Membrane ($/kgal) $2.00 $2.00 $2.00 $2.00 $2.00 $2.00 Disposal cost ($/kgal) $5.73 $4.38 $4.36 $4.36 $4.36 $4.36 Overall cost ($/kgal) $7.73 $6.38 $6.36 $6.36 $6.36 $6.36
Table 22.—Comparison of produced water costs ($/kgal) Plant capacity (MGD) 1 5 10 15 20 25 Zero discharge with BCRS $4.01 $3.72 $3.61 $3.54 $3.50 $3.46 Deep well $3.35 $2.66 $2.55 $2.52 $2.50 $2.49 Evaporation ponds $3.45 $3.39 $3.37 $3.36 $3.36 $3.36 Crystallizer $7.73 $6.38 $6.36 $6.36 $6.36 $6.36
Figure 28.—Comparison of produced water costs
$0$1$2$3$4$5$6$7$8$9
$10
1 5 25
Plant Capacity (MGD)
Prod
uct W
ater
Cos
t ($/
kgal
) BCRS & SGSP Deep well injectionEvaporation ponds Crystallizer
39
9. REFERENCES 1. Lu, H, J. C. Walton and A. H. P. Swift, "Zero discharge desalination," Desalination & Water Reuse, November/December 2000, Vol. 10/No. 3. 2. "Squeezing water from the sea," Economist, April 4th, 1998, p. 85-86. 3. Farid, M. and A. W. Al-Hajaj, "Solar desalination with a humidification-dehumidification cycle," Desalination 106 (1996) 427-429. 4. Hull, J. R., C. E. Nielsen and P. Golding, Salinity-Gradient Solar Ponds, CRC Press, Inc., Boca Raton, Florida, 1989. 5. Frontier AquaDynamic, Technical Bulletin - Advanced Evaporation Technology for Wastewater Reduction and Aquifer Remediation. 6. Becerra Lopez, H. R., Performance Analysis of a Brine Concentrator and Water Recovery System, Master's Thesis, University of Texas at El Paso, 2001. 7. Rudd, Dale F., and Watson, C.C., Strategy of Process Engineering, John Wiley & Sons, 1968, p. 114-141. 8. Esquivel, Patricia M., Economic Feasibility of Utilizing Solar Pond Technology to Produce Industrial Process Heat, Base Load Electricity, and Desalted Brackish Water, Master Thesis, University of Texas at El Paso, 1992. 9. Mickley, Michael C., Membrane Concentrate Disposal: Practices and Regulation – Final Report, Desalination and Water Purification Research and Development Program, US Department of Interior, Bureau of Reclamation, 2001.

40
10. LIST OF SYMBOLS hH Convective heat transfer coefficient [W/m2-ºC] K Mass transfer coefficient [(kg/s-m2)/(kg/kg)] k Thermal conductivity [W/m-K] Le Lewis number m Mass [kg] m� Mass flow rate [kg/s] M Molecular mass [kg/mol] Nu Nusselt number P Pressure [Pa] Pr Prandtl number q Heat flux [W/m2], or heat transfer per unit mass [J/kg] Q Total heat transfer [J] Q� Rate of heat flow [W] r Ratio heat/work, dimensionless Ru Universal gas constant [J/mol-K] Re Reynolds number S Salinity, percentage by mass or concentration [kgNaCl/kgw] S Total entropy [J/K] T Temperature [K, or ºC] U Internal energy [J/kg] v, V Velocity [m/s] v Specific volume in molar base [m3/mol] V Volume [m3] w Work per unit mass [J/kg] W Total work [J] W� Power [W]
Greek Symbols
α Thermal diffusivity [m2/s] µ Viscosity [kg/m-s] ∆ Finite change in quantity ρ Density [kg/ m3] ε Thermal effectiveness ω Specific humidity [kg/kga] εc Thermal effectiveness for condensation εe Thermal effectiveness for evaporation εh Thermal effectiveness for heat exchange η Efficiency
41
Subscripts
a Air or dry air i Inlet ATM Atmospheric L Latent B Brine m Mixture c, cond Condensate mt Mass transfer ca Cold air max Maximum db Dry bulb min Minimum dp Dew point o Outlet e, ev Evaporation s Salt e Exit v Vapor f Saturated liquid w Water fw Freshwater wb Wet bulb g Saturated gas 1 Initial or inlet state ha Hot air 1, 2,.. State HUM Humid 2 Final or exit state
Superscripts a Dry air v Vapor s Salt w Water
(bar) Average
(bar) Quantity per unit mole
° (circle) Degree or standard reference state .
(dot) Quantity per unit time


APPENDIX
SUMMARY OF TEST DATA


05/01/00 STARTING TIME 9:00 Hrs.
VARIABLE 05/01/00 05/01/00 05/01/00 05/01/00 05/01/00 05/01/00 FLUID STATE NAME UNITS 9:15 9:50 10:35 12:00 13:30 AVG
0 Dry bulb temperature oC 16.00 18.00 17.00 20.00 21.00 18.400 AMBIENT AIR
0 Wet bulb temperature oC 8.00 9.00 10.00 10.00 11.00 9.600 1 Dry bulb temperature oC 16.50 18.90 22.20 26.50 30.60 22.940 1 Mass flow rate, moist kg/s 9.26 9.26 9.26 9.26 9.26 9.260 2 Dry bulb temperature oC 35.20 35.90 36.60 39.10 38.30 37.020 2 Relative humidity % 3 Dry bulb temperature oC 0.000
HOT AIR
3 Relative humidity % 0.000 6 Dry bulb temperature oC 14.40 17.60 18.00 19.80 21.10 18.180 6 Mass flow rate, moist kg/s 9.35 9.35 9.35 9.35 9.35 9.350 7 Dry bulb temperature oC 15.40 16.70 16.80 17.60 15.60 16.420 7 Relative humidity % 8 Dry bulb temperature oC 0.000
COLD AIR
8 Relative humidity % 0.000 13 Temperature oC 19.80 23.70 24.00 25.20 21.80 22.900 13 Volume flow rate GPM 100.00 100.00 100.00 100.00 100.00 100.000 13 Mass flow rate kg/s 6.31 6.31 6.31 6.31 6.31 6.308 14 Temperature oC 0.000 10 Temperature oC 29.70 31.40 31.70 33.50 31.80 31.620 16 Specific gravity 0.997 0.995 0.915 1.003 1.003 0.983 16 Volume flow rate Gal 0.00 13.00 9.00 15.00 0.00 7.400 16 Volume Gal 37 37.000
FRESH WATER
16 Mass flow rate kg/s 0.000 0.023 0.013 0.011 0.000 0.008

18 Temperature oC 33.60 37.00 37.20 38.90 38.70 37.080 18 Specific gravity 1.168 1.170 1.195 1.188 1.188 1.182
HOT CHAMBER 20 Temperature oC 0.000 SPRAYING BRINE 20 Volume flow rate GPM 90.00 90.00 90.00 90.00 90.00 90.000
20 Mass flow rate kg/s 6.63 6.64 6.78 6.74 6.74 6.710 22 Temperature oC 14.80 17.40 17.40 18.30 15.80 16.740 22 Specific gravity 1.181 1.180 1.181 1.185 1.191 1.184
COLD CHAMBER 24 Temperature oC 0.000 SPRAYING BRINE 24 Volume flow rate GPM 90.00 90.00 90.00 90.00 90.00 90.000
24 Mass flow rate kg/s 6.71 6.70 6.71 6.73 6.76 6.720 17 Specific gravity 0.000
17A-H Volume Gal 0.000 17B-C Volume Gal 0.000
17 Volume Gal 0 0.000
FEED BRINE
17 Mass flow rate (avg.) kg/s 0.00 0.000
26 Temperature oC 78.00 78.00 77.00 77.00 78.00 77.600 26 Volume flow rate GPM 200.00 200.00 200.00 200.00 200.00 200.000 26 Mass flow rate kg/s 15.14 15.14 15.14 15.14 15.14 15.140
HEAT SOURCE BRINE
27 Temperature oC 68.00 68.00 69.00 69.00 69.00 68.600 28 Temperature oC 59.00 59.00 58.00 58.00 59.00 58.600 28 Volume flow rate GPM 138.00 148.00 140.00 140.00 140.00 141.200 28 Mass flow rate kg/s 8.71 9.34 8.83 8.83 8.83 8.907
HEATING WATER
29 Temperature oC 46.00 47.00 48.00 48.00 49.00 47.600
CONDENSATION RATIO %
* Shaded cells mean calculated data.
05/02/00 STARTING TIME 9:00 Hrs.
VARIABLE 05/02/00 05/02/00 05/02/00 05/02/00 05/02/00 05/02/00 05/02/00 05/02/00 FLUID STATE NAME UNITS 9:19 10:00 11:30 12:30 13:00 14:00 15:20 AVG
0 Dry bulb temperature oC 21.00 22.00 24.00 25.00 25.00 28.00 29.00 24.857 AMBIENT AIR
0 Wet bulb temperature oC 10.00 11.00 12.00 12.00 12.00 14.00 13.00 12.000 1 Dry bulb temperature oC 20.00 24.70 30.10 30.80 30.60 33.30 36.80 29.471 1 Mass flow rate, moist kg/s 9.26 9.26 9.26 9.26 9.26 9.26 9.26 9.260 2 Dry bulb temperature oC 33.10 33.40 42.60 38.40 32.40 39.20 40.30 37.057 2 Relative humidity % 3 Dry bulb temperature oC 0.000
HOT AIR
3 Relative humidity % 0.000 6 Dry bulb temperature oC 19.40 16.70 24.70 26.90 26.90 26.90 27.80 24.186 6 Mass flow rate, moist kg/s 9.35 9.35 9.35 9.35 9.35 9.35 9.35 9.350 7 Dry bulb temperature oC 15.30 21.80 16.20 19.00 19.50 19.40 20.20 18.771 7 Relative humidity % 8 Dry bulb temperature oC 0.000
COLD AIR
8 Relative humidity % 0.000 13 Temperature oC 19.90 24.70 28.20 28.90 28.90 32.20 35.80 28.371 13 Volume flow rate GPM 100.00 100.00 100.00 100.00 100.00 100.00 100.00 100.000 13 Mass flow rate kg/s 6.31 6.31 6.31 6.31 6.31 6.31 6.31 6.308 14 Temperature oC 0.000 10 Temperature oC 29.70 31.40 31.70 33.50 31.80 31.80 31.80 31.671 16 Specific gravity 0.997 0.996 0.996 0.996 0.996 0.996 0.996 0.996 16 Volume flow rate Gal 0.00 14.00 3.00 11.00 3.00 13.00 4.00 6.857 16 Volume Gal 48 48.000
FRESH WATER
16 Mass flow rate kg/s 0.000 0.022 0.002 0.012 0.006 0.014 0.003 0.010

18 Temperature oC 32.70 37.70 42.50 40.50 41.10 40.30 39.10 39.129 18 Specific gravity 1.197 1.198 1.199 1.199 1.197 1.197 1.197 1.198
HOT CHAMBER 20 Temperature oC 0.000 SPRAYING BRINE 20 Volume flow rate GPM 90.00 90.00 90.00 90.00 90.00 90.00 90.00 90.000
20 Mass flow rate kg/s 6.80 6.80 6.81 6.81 6.80 6.80 6.80 6.800 22 Temperature oC 15.50 17.60 17.00 19.60 20.30 19.90 20.60 18.643 22 Specific gravity 1.201 1.201 1.201 1.204 1.205 1.204 1.205 1.203
COLD CHAMBER 24 Temperature oC 0.000 SPRAYING BRINE 24 Volume flow rate GPM 90.00 90.00 90.00 90.00 90.00 90.00 90.00 90.000
24 Mass flow rate kg/s 6.82 6.82 6.82 6.84 6.84 6.84 6.84 6.830 17 Specific gravity 1.136 1.136 1.136 1.136 1.136 1.136 1.136 1.136
17A-H Volume Gal 445 445.000 17B-C Volume Gal 0.000
17 Volume Gal 445 445.000 FEED BRINE
17 Mass flow rate (avg.) kg/s 0.08 0.084 26 Temperature oC 77.00 77.00 77.00 77.00 78.00 78.00 78.00 77.429 26 Volume flow rate GPM 200.00 200.00 200.00 200.00 200.00 200.00 200.00 200.000 26 Mass flow rate kg/s 15.14 15.14 15.14 15.14 15.14 15.14 15.14 15.140
HEAT SOURCE BRINE
27 Temperature oC 68.00 69.00 69.00 70.00 69.00 69.00 69.00 69.000 28 Temperature oC 56.00 59.00 61.00 60.00 61.00 60.00 60.00 59.571 28 Volume flow rate GPM 136.00 135.00 136.00 135.00 135.00 135.00 135.00 135.286 28 Mass flow rate kg/s 8.58 8.52 8.58 8.52 8.52 8.52 8.52 8.534
HEATING WATER
29 Temperature oC 44.00 48.00 53.00 51.00 52.00 49.00 49.00 49.429 CONDENSATION RATIO 11.59%
* Shaded cells mean calculated data.
09/11/00 STARTING TIME 9:00 Hrs.
VARIABLE 09/11/00 09/11/00 09/11/00 09/11/00 09/11/00 09/11/00 09/11/00 FLUID STATE NAME UNITS 10:14 11:02 12:21 13:21 14:15 15:00 AVG
0 Dry bulb temperature oC 28.00 29.00 31.00 35.00 35.00 33.00 31.833 AMBIENT AIR
0 Wet bulb temperature oC 19.00 16.00 16.00 17.00 17.00 16.00 16.833 1 Dry bulb temperature oC 39.70 39.70 46.33 44.60 44.40 39.40 42.355 1 Mass flow rate, moist kg/s 9.26 9.26 9.26 9.26 9.26 9.26 9.260 2 Dry bulb temperature oC 36.20 36.30 36.40 37.50 37.90 36.40 36.783 2 Relative humidity % 3 Dry bulb temperature oC 0.000
HOT AIR
3 Relative humidity % 0.000 6 Dry bulb temperature oC 26.40 26.80 29.00 30.10 21.10 31.00 27.400 6 Mass flow rate, moist kg/s 9.35 9.35 9.35 9.35 9.35 9.35 9.350 7 Dry bulb temperature oC 19.90 19.70 20.10 21.00 20.90 21.00 20.433 7 Relative humidity % 8 Dry bulb temperature oC 0.000
COLD AIR
8 Relative humidity % 0.000 13 Temperature oC 29.60 30.10 29.10 30.60 30.10 30.10 29.933 13 Volume flow rate kg/s 89.00 89.00 89.00 89.00 89.00 89.00 89.000 13 Mass flow rate kg/s 5.61 5.61 5.61 5.61 5.61 5.61 5.614 14 Temperature oC 33.10 32.80 32.10 32.40 34.10 33.10 32.933 10 Temperature oC 32.10 33.50 32.10 32.40 33.10 33.60 32.800 16 Specific gravity 1.003 1.003 1.003 1.003 1.003 1.003 1.003 16 Volume flow rate Gal 30.00 8.00 22.00 12.00 11.00 18.00 16.833 16 Volume Gal 101 101.000
FRESH WATER
16 Mass flow rate kg/s 0.026 0.011 0.018 0.013 0.013 0.025 0.017

18 Temperature oC 36.80 37.20 37.70 39.70 38.90 38.70 38.167 18 Specific gravity 1.129 1.129 1.139 1.140 1.140 1.140 1.136
HOT CHAMBER 20 Temperature oC 0.000 SPRAYING BRINE 20 Volume flow rate GPM 90.00 90.00 90.00 90.00 90.00 90.00 90.000
20 Mass flow rate kg/s 6.41 6.41 6.47 6.47 6.47 6.47 6.451 22 Temperature oC 20.10 21.70 21.50 22.10 23.10 23.20 21.950 22 Specific gravity 1.209 1.209 1.209 1.208 1.209 1.209 1.209
COLD CHAMBER 24 Temperature oC 0.000 SPRAYING BRINE 24 Volume flow rate GPM 90.00 90.00 90.00 90.00 90.00 90.00 90.000
24 Mass flow rate kg/s 6.86 6.86 6.86 6.86 6.86 6.86 6.863 17 Specific gravity 1.103 1.103 1.103 1.103 1.103 1.103 1.103
17A-H Volume Gal 401 401.000 17B-C Volume Gal 121 121.000
17 Volume Gal 522 522.000 FEED BRINE
17 Mass flow rate (avg.) kg/s 0.10 0.101 26 Temperature oC 83.00 83.00 83.00 83.00 83.00 83.00 83.000 26 Volume flow rate GPM 200.00 200.00 200.00 200.00 200.00 200.00 200.000 26 Mass flow rate kg/s 15.14 15.14 15.14 15.14 15.14 15.14 15.140
HEAT SOURCE BRINE
27 Temperature oC 75.00 75.00 75.00 75.00 75.00 75.00 75.000 28 Temperature oC 60.20 60.20 60.20 61.80 61.40 61.70 60.917 28 Volume flow rate GPM 140.00 140.00 140.00 140.00 140.00 140.00 140.000 28 Mass flow rate kg/s 8.83 8.83 8.83 8.83 8.83 8.83 8.832
HEATING WATER
29 Temperature oC 44.30 44.40 44.40 46.40 45.80 45.30 45.100 CONDENSATION RATIO 17.24%
* Shaded cells mean calculated data.
09/12/00 STARTING TIME 8:00 Hrs.
VARIABLE 09/12/00 09/12/00 09/12/00 09/12/00 09/12/00 09/12/00 09/12/00 09/12/00 09/12/00 FLUID STATE NAME UNITS 8:20 9:42 10:35 11:20 12:25 13:37 14:35 15:25 AVG
0 Dry bulb temperature oC 24.00 27.00 30.00 34.00 34.00 34.00 36.00 36.00 31.875 AMBIENT AIR
0 Wet bulb temperature oC 13.00 14.00 15.00 17.00 17.00 16.00 16.00 16.00 15.500 1 Dry bulb temperature oC 25.30 37.50 39.00 41.60 45.70 48.10 47.60 47.10 41.488 1 Mass flow rate, moist kg/s 9.26 9.26 9.26 9.26 9.26 9.26 9.26 9.26 9.260 2 Dry bulb temperature oC 31.90 36.50 37.70 37.70 38.60 38.70 38.40 37.80 37.163 2 Relative humidity % 3 Dry bulb temperature oC 0.000
HOT AIR
3 Relative humidity % 0.000 6 Dry bulb temperature oC 21.70 24.40 27.80 28.00 31.00 32.00 32.60 33.10 28.825 6 Mass flow rate, moist kg/s 9.35 9.35 9.35 9.35 9.35 9.35 9.35 9.35 9.350 7 Dry bulb temperature oC 16.00 18.60 19.20 21.00 20.20 21.50 20.50 21.00 19.750 7 Relative humidity % 8 Dry bulb temperature oC 0.000
COLD AIR
8 Relative humidity % 0.000 13 Temperature oC 23.40 28.40 29.80 29.90 29.80 30.00 29.90 30.50 28.963 13 Volume flow rate GPM 85.60 87.10 86.60 86.70 87.20 87.10 86.90 86.70 86.738 13 Mass flow rate kg/s 5.40 5.49 5.46 5.47 5.50 5.49 5.48 5.47 5.472 14 Temperature oC 27.50 33.00 33.70 33.10 34.60 34.00 34.00 33.50 32.925 10 Temperature oC 26.60 32.40 33.20 34.00 34.00 34.00 33.60 33.50 32.663 16 Specific gravity 1.004 1.003 1.003 1.003 1.004 1.004 1.004 1.004 1.004 16 Volume flow rate Gal 0.00 33.00 19.00 18.00 23.00 22.00 19.00 13.00 18.375 16 Volume Gal 147 147.000
FRESH WATER
16 Mass flow rate kg/s 0.000 0.025 0.023 0.025 0.022 0.019 0.021 0.016 0.019
18 Temperature oC 32.70 37.70 42.50 40.50 41.10 40.30 39.10 39.10 44.714
18 Specific gravity 1.197 1.198 1.199 1.199 1.197 1.197 1.197 1.197 1.369 HOT CHAMBER 20 Temperature oC 0.000
SPRAYING BRINE 20 Volume flow rate GPM 90.00 90.00 90.00 90.00 90.00 90.00 90.00 90.00 102.857 20 Mass flow rate kg/s 6.80 6.80 6.81 6.81 6.80 6.80 6.80 6.80 7.771
22 Temperature oC 15.50 17.60 17.00 19.60 20.30 19.90 20.60 20.60 21.586 22 Specific gravity 1.201 1.201 1.201 1.204 1.205 1.204 1.205 1.205 1.375
COLD CHAMBER 24 Temperature oC 0.000 SPRAYING BRINE 24 Volume flow rate GPM 90.00 90.00 90.00 90.00 90.00 90.00 90.00 90.00 102.857
24 Mass flow rate kg/s 6.82 6.82 6.82 6.84 6.84 6.84 6.84 6.84 7.807 17 Specific gravity 1.136 1.136 1.136 1.136 1.136 1.136 1.136 1.136 1.298
17A-H Volume Gal 445 445.000 17B-C Volume Gal 0.000
17 Volume Gal 445 445.000 FEED BRINE
17 Mass flow rate (avg.) kg/s 0.07 0.072 26 Temperature oC 77.00 77.00 77.00 77.00 78.00 78.00 78.00 78.00 88.571 26 Volume flow rate GPM 200.00 200.00 200.00 200.00 200.00 200.00 200.00 200.00 228.571 26 Mass flow rate kg/s 15.14 15.14 15.14 15.14 15.14 15.14 15.14 15.14 17.303
HEAT SOURCE BRINE
27 Temperature oC 68.00 69.00 69.00 70.00 69.00 69.00 69.00 69.00 78.857 28 Temperature oC 56.00 59.00 61.00 60.00 61.00 60.00 60.00 60.00 68.143 28 Volume flow rate GPM 136.00 135.00 136.00 135.00 135.00 135.00 135.00 135.00 154.571 28 Mass flow rate kg/s 8.58 8.52 8.58 8.52 8.52 8.52 8.52 8.52 9.751
HEATING WATER
29 Temperature oC 44.00 48.00 53.00 51.00 52.00 49.00 49.00 49.00 56.429 CONDENSATION RATIO 26.50%
* Shaded cells mean calculated data.

09/13/00 STARTING TIME 8:43 Hrs.
VARIABLE 09/13/00 09/13/00 09/13/00 09/13/00 FLUID STATE NAME UNITS 10:43 12:43 15:00 AVG
0 Dry bulb temperature oC 22.00 30.00 34.00 28.667 AMBIENT AIR
0 Wet bulb temperature oC 15.00 17.00 16.00 16.000 1 Dry bulb temperature oC 32.30 32.30 32.30 32.300 1 Mass flow rate, moist kg/s 9.26 9.26 9.26 9.260 2 Dry bulb temperature oC 38.40 38.80 38.40 38.533 2 Relative humidity % 3 Dry bulb temperature oC 0.000
HOT AIR
3 Relative humidity % 0.000 6 Dry bulb temperature oC 27.80 29.40 29.50 28.900 6 Mass flow rate, moist kg/s 9.35 9.35 9.35 9.350 7 Dry bulb temperature oC 21.90 21.40 21.40 21.567 7 Relative humidity % 8 Dry bulb temperature oC 0.000
COLD AIR
8 Relative humidity % 0.000 13 Temperature oC 30.90 31.10 31.20 31.067 13 Volume flow rate GPM 82.80 82.00 83.40 82.733 13 Mass flow rate kg/s 5.22 5.17 5.26 5.219 14 Temperature oC 34.10 34.20 34.30 34.200 10 Temperature oC 34.40 34.30 34.30 34.333 16 Specific gravity 1.004 1.004 1.004 1.004 16 Volume flow rate Gal 50.00 25.00 40.00 38.333 16 Volume Gal 115 115.000
FRESH WATER
16 Mass flow rate kg/s 0.026 0.013 0.018 0.019
18 Temperature oC 39.30 39.50 39.50 39.433 18 Specific gravity 1.164 1.198 1.199 1.187
HOT CHAMBER 20 Temperature oC 1.17 1.18 1.18 1.175 SPRAYING BRINE 20 Volume flow rate GPM 90.00 90.00 90.00 90.000
20 Mass flow rate kg/s 6.61 6.80 6.81 6.739 22 Temperature oC 23.60 24.40 24.50 24.167 22 Specific gravity 1.208 1.209 1.209 1.209
COLD CHAMBER 24 Temperature oC 0.000 SPRAYING BRINE 24 Volume flow rate GPM 90.00 90.00 90.00 90.000
24 Mass flow rate kg/s 6.86 6.86 6.86 6.862 17 Specific gravity 1.105 1.105 1.105 1.105
17A-H Volume Gal 468 468.000 17B-C Volume Gal 493 493.000
17 Volume Gal 961 961.000 FEED BRINE
17 Mass flow rate (avg.) kg/s 0.178 0.178 26 Temperature oC 81.00 81.00 81.00 81.000 26 Volume flow rate GPM 150.00 150.00 150.00 150.000 26 Mass flow rate kg/s 11.36 11.36 11.36 11.355
HEAT SOURCE BRINE
27 Temperature oC 70.00 69.00 69.00 69.333 28 Temperature oC 57.10 57.20 57.30 57.200 28 Volume flow rate GPM 140.00 140.00 140.00 140.000 28 Mass flow rate kg/s 8.83 8.83 8.83 8.832
HEATING WATER
29 Temperature oC 46.40 47.10 47.20 46.900 CONDENSATION RATIO 10.85%
* Shaded cells mean calculated data.
09/14/00 STARTING TIME 8:46 Hrs.
VARIABLE 09/14/00 09/14/00 09/14/00 09/14/00 09/14/00 09/14/00 FLUID STATE NAME UNITS 9:46 11:46 13:46 14:46 15:10 AVG
0 Dry bulb temperature oC 26.00 32.00 34.00 33.00 33.00 31.600 AMBIENT AIR
0 Wet bulb temperature oC 16.00 18.00 16.00 15.00 19.00 16.800 1 Dry bulb temperature oC 26.30 31.30 37.30 34.20 34.20 32.660 1 Mass flow rate, moist kg/s 9.26 9.26 9.26 9.26 9.26 9.260 2 Dry bulb temperature oC 36.00 36.80 39.00 36.40 35.70 36.780 2 Relative humidity % 3 Dry bulb temperature oC 0.000
HOT AIR
3 Relative humidity % 0.000 6 Dry bulb temperature oC 24.10 27.40 32.80 32.00 31.40 29.540 6 Mass flow rate, moist kg/s 9.35 9.35 9.35 9.35 9.35 9.350 7 Dry bulb temperature oC 19.80 20.70 24.70 21.40 20.50 21.420 7 Relative humidity % 100.00 100.00 100.00 100.00 100.00 100.000 8 Dry bulb temperature oC 0.000
COLD AIR
8 Relative humidity % 0.000 13 Temperature oC 27.60 28.80 32.10 28.50 28.60 29.120 13 Volume flow rate GPM 83.30 83.20 84.10 82.90 82.30 83.160 13 Mass flow rate kg/s 5.25 5.25 5.31 5.23 5.19 5.246 14 Temperature oC 31.90 33.30 35.30 31.40 31.20 32.620 10 Temperature oC 31.70 33.30 34.50 31.90 31.30 32.540 16 Specific gravity 1.003 1.004 1.004 1.004 1.003 1.004 16 Volume flow rate Gal 0.00 50.00 24.00 10.00 4.00 17.600 16 Volume Gal 88 88.000
FRESH WATER
16 Mass flow rate kg/s 0.000 0.026 0.013 0.011 0.011 0.012
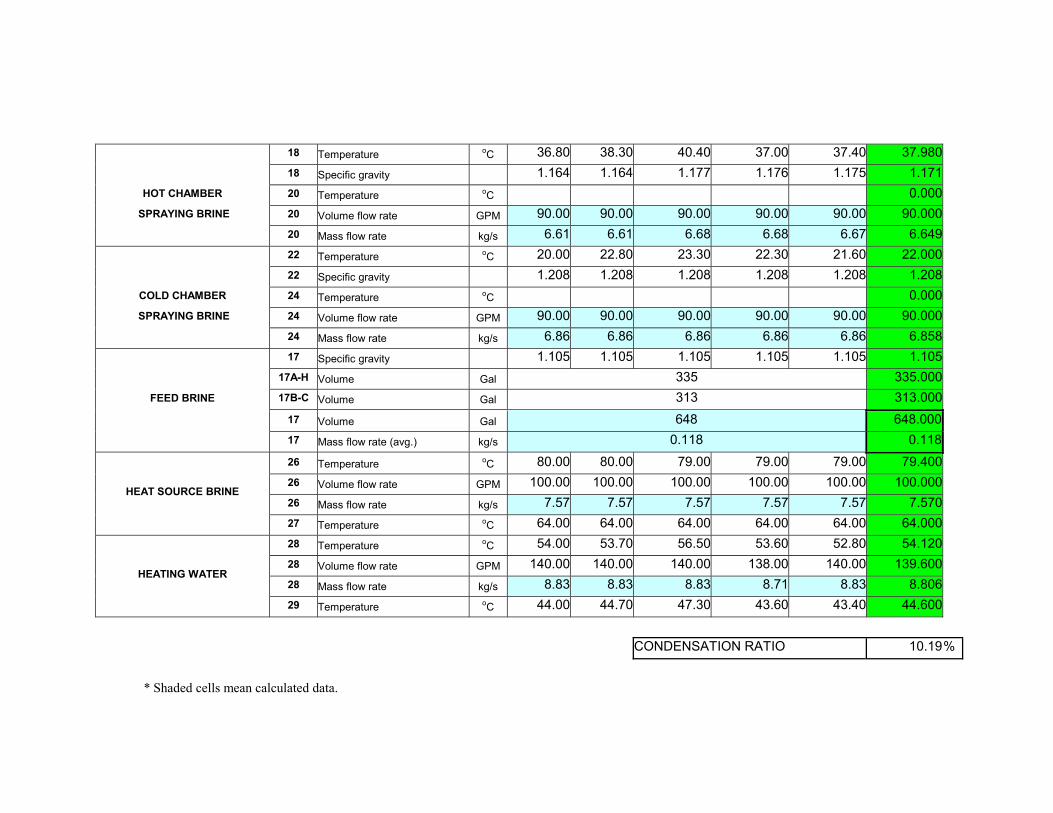
18 Temperature oC 36.80 38.30 40.40 37.00 37.40 37.980 18 Specific gravity 1.164 1.164 1.177 1.176 1.175 1.171
HOT CHAMBER 20 Temperature oC 0.000 SPRAYING BRINE 20 Volume flow rate GPM 90.00 90.00 90.00 90.00 90.00 90.000
20 Mass flow rate kg/s 6.61 6.61 6.68 6.68 6.67 6.649 22 Temperature oC 20.00 22.80 23.30 22.30 21.60 22.000 22 Specific gravity 1.208 1.208 1.208 1.208 1.208 1.208
COLD CHAMBER 24 Temperature oC 0.000 SPRAYING BRINE 24 Volume flow rate GPM 90.00 90.00 90.00 90.00 90.00 90.000
24 Mass flow rate kg/s 6.86 6.86 6.86 6.86 6.86 6.858 17 Specific gravity 1.105 1.105 1.105 1.105 1.105 1.105
17A-H Volume Gal 335 335.000 17B-C Volume Gal 313 313.000
17 Volume Gal 648 648.000 FEED BRINE
17 Mass flow rate (avg.) kg/s 0.118 0.118 26 Temperature oC 80.00 80.00 79.00 79.00 79.00 79.400 26 Volume flow rate GPM 100.00 100.00 100.00 100.00 100.00 100.000 26 Mass flow rate kg/s 7.57 7.57 7.57 7.57 7.57 7.570
HEAT SOURCE BRINE
27 Temperature oC 64.00 64.00 64.00 64.00 64.00 64.000 28 Temperature oC 54.00 53.70 56.50 53.60 52.80 54.120 28 Volume flow rate GPM 140.00 140.00 140.00 138.00 140.00 139.600 28 Mass flow rate kg/s 8.83 8.83 8.83 8.71 8.83 8.806
HEATING WATER
29 Temperature oC 44.00 44.70 47.30 43.60 43.40 44.600 CONDENSATION RATIO 10.19%
* Shaded cells mean calculated data.

10/25/00 STARTING TIME 9:30 Hrs.
VARIABLE 10/25/00 10/25/00 10/25/00 10/25/00 10/25/00 10/25/00 FLUID STATE NAME UNITS 11:16 12:00 13:00 14:00 15:00 AVG
0 Dry bulb temperature oC 20.00 21.00 22.00 21.00 21.00 21.000 AMBIENT AIR
0 Wet bulb temperature oC 10.00 13.00 13.00 13.00 13.00 12.400 1 Dry bulb temperature oC 19.00 18.50 11.40 20.10 25.10 18.820 1 Mass flow rate, moist kg/s 9.26 9.26 9.26 9.26 9.26 9.260 2 Dry bulb temperature oC 34.20 35.30 32.80 33.50 33.80 33.920 2 Relative humidity % 3 Dry bulb temperature oC 0.000
HOT AIR
3 Relative humidity % 0.000 6 Dry bulb temperature oC 16.20 18.50 18.30 16.50 19.00 17.700 6 Mass flow rate, moist kg/s 9.35 9.35 9.35 9.35 9.35 9.350 7 Dry bulb temperature oC 16.10 18.10 10.30 17.00 17.00 15.700 7 Relative humidity % 100.00 100.00 100.00 100.00 100.00 100.000 8 Dry bulb temperature oC 0.000
COLD AIR
8 Relative humidity % 0.000 13 Temperature oC 28.90 30.40 28.30 27.90 27.70 28.640 13 Volume flow rate GPM 152.00 152.00 154.60 152.30 150.70 152.320 13 Mass flow rate kg/s 9.59 9.59 9.75 9.61 9.51 9.609 14 Temperature oC 31.90 32.70 31.00 30.10 31.70 31.480 10 Temperature oC 31.50 33.20 31.00 33.10 32.00 32.160 16 Specific gravity 1.003 1.003 1.003 1.002 1.002 1.003 16 Volume flow rate Gal 57.00 24.00 26.00 26.00 27.00 32.000 16 Volume Gal 160 160.000
FRESH WATER
16 Mass flow rate kg/s 0.034 0.034 0.027 0.027 0.028 0.030
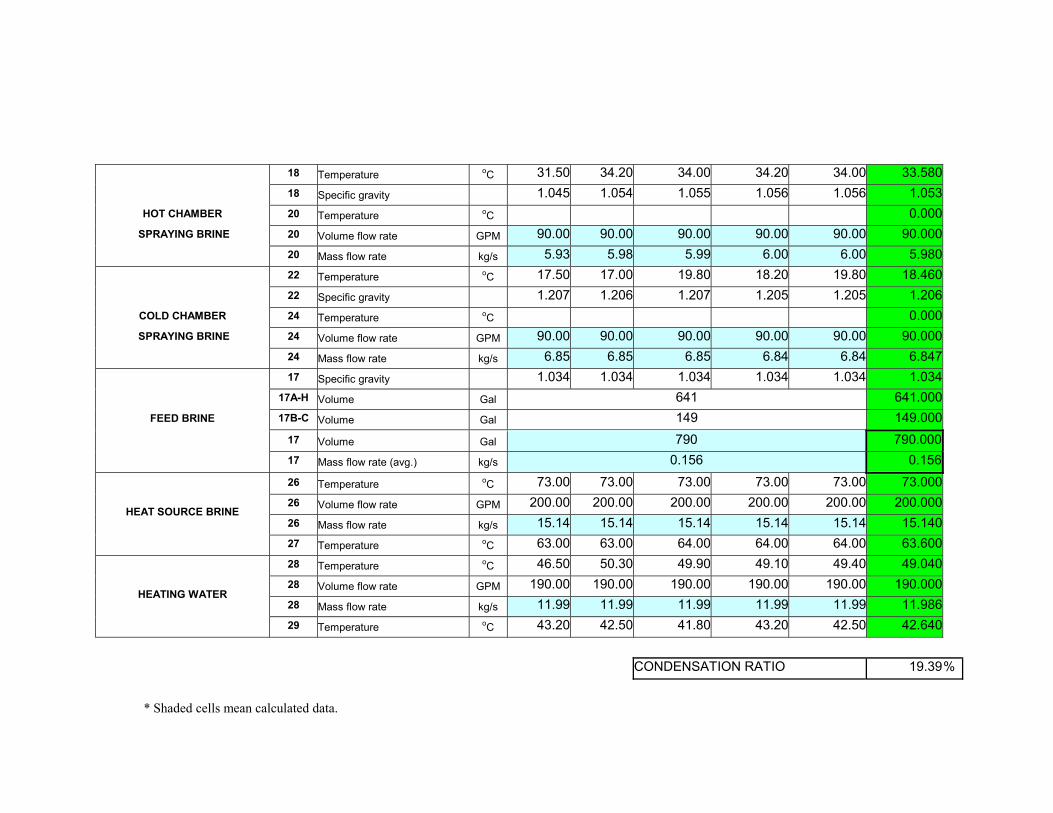
18 Temperature oC 31.50 34.20 34.00 34.20 34.00 33.580 18 Specific gravity 1.045 1.054 1.055 1.056 1.056 1.053
HOT CHAMBER 20 Temperature oC 0.000 SPRAYING BRINE 20 Volume flow rate GPM 90.00 90.00 90.00 90.00 90.00 90.000
20 Mass flow rate kg/s 5.93 5.98 5.99 6.00 6.00 5.980 22 Temperature oC 17.50 17.00 19.80 18.20 19.80 18.460 22 Specific gravity 1.207 1.206 1.207 1.205 1.205 1.206
COLD CHAMBER 24 Temperature oC 0.000 SPRAYING BRINE 24 Volume flow rate GPM 90.00 90.00 90.00 90.00 90.00 90.000
24 Mass flow rate kg/s 6.85 6.85 6.85 6.84 6.84 6.847 17 Specific gravity 1.034 1.034 1.034 1.034 1.034 1.034
17A-H Volume Gal 641 641.000 17B-C Volume Gal 149 149.000
17 Volume Gal 790 790.000 FEED BRINE
17 Mass flow rate (avg.) kg/s 0.156 0.156 26 Temperature oC 73.00 73.00 73.00 73.00 73.00 73.000 26 Volume flow rate GPM 200.00 200.00 200.00 200.00 200.00 200.000 26 Mass flow rate kg/s 15.14 15.14 15.14 15.14 15.14 15.140
HEAT SOURCE BRINE
27 Temperature oC 63.00 63.00 64.00 64.00 64.00 63.600 28 Temperature oC 46.50 50.30 49.90 49.10 49.40 49.040 28 Volume flow rate GPM 190.00 190.00 190.00 190.00 190.00 190.000 28 Mass flow rate kg/s 11.99 11.99 11.99 11.99 11.99 11.986
HEATING WATER
29 Temperature oC 43.20 42.50 41.80 43.20 42.50 42.640 CONDENSATION RATIO 19.39%
* Shaded cells mean calculated data.

10/26/00 STARTING TIME 10:34 Hrs.
VARIABLE 10/26/00 10/26/00 10/26/00 10/26/00 10/26/00 10/26/00 FLUID STATE NAME UNITS 11:34 12:34 13:34 14:31 15:25 AVG
0 Dry bulb temperature oC 19.00 20.40 21.00 23.40 22.50 21.260 AMBIENT AIR
0 Relative humidity % 49.00 46.00 32.00 37.90 28.90 38.760 1 Dry bulb temperature oC 19.10 22.50 17.30 24.50 24.60 21.600 1 Mass flow rate, moist kg/s 9.26 9.26 9.26 9.26 9.26 9.260 2 Dry bulb temperature oC 32.00 31.90 31.60 32.40 32.20 32.020 2 Relative humidity % 3 Dry bulb temperature oC 0.000
HOT AIR
3 Relative humidity % 0.000 6 Dry bulb temperature oC 14.60 20.20 21.30 19.00 21.80 19.380 6 Mass flow rate, moist kg/s 9.35 9.35 9.35 9.35 9.35 9.350 7 Dry bulb temperature oC 15.60 15.80 16.10 17.00 17.20 16.340 7 Relative humidity % 8 Dry bulb temperature oC 0.000
COLD AIR
8 Relative humidity % 0.000 13 Temperature oC 24.90 25.00 24.80 25.70 27.30 25.540 13 Volume flow rate GPM 115.80 112.70 113.70 113.40 113.00 113.720 13 Mass flow rate kg/s 7.31 7.11 7.17 7.15 7.13 7.174 14 Temperature oC 29.00 27.40 29.70 30.20 23.80 28.020 10 Temperature oC 29.70 29.20 29.70 29.80 25.10 28.700 16 Specific gravity 1.003 1.002 1.002 1.002 1.002 1.002 16 Volume flow rate Gal 30.40 30.40 30.40 30.40 30.40 30.400 16 Volume Gal 152 152.000
FRESH WATER
16 Mass flow rate kg/s 0.032 0.032 0.032 0.034 0.036 0.033

18 Temperature oC 32.90 32.40 32.30 33.50 33.30 32.880 18 Specific gravity 1.060 1.061 1.065 1.061 1.070 1.063
HOT CHAMBER 20 Temperature oC 0.000 SPRAYING BRINE 20 Volume flow rate GPM 90.00 90.00 90.00 90.00 90.00 90.000
20 Mass flow rate kg/s 6.02 6.02 6.05 6.02 6.07 6.037 22 Temperature oC 16.00 16.50 17.10 33.50 18.90 20.400 22 Specific gravity 1.205 1.202 1.207 1.208 1.201 1.205
COLD CHAMBER 24 Temperature oC 0.000 SPRAYING BRINE 24 Volume flow rate GPM 90.00 90.00 90.00 90.00 90.00 90.000
24 Mass flow rate kg/s 6.84 6.82 6.85 6.86 6.82 6.839 17 Specific gravity 1.031 1.031 1.031 1.031 1.031 1.031
17A-H Volume Gal 325 325.000 17B-C Volume Gal 253 253.000
17 Volume Gal 578 578.000 FEED BRINE
17 Mass flow rate (avg.) kg/s 0.129 0.129 26 Temperature oC 72.00 72.00 72.00 72.00 72.00 72.000 26 Volume flow rate GPM 152.00 152.00 152.00 152.00 152.00 152.000 26 Mass flow rate kg/s 11.51 11.51 11.51 11.51 11.51 11.506
HEAT SOURCE BRINE
27 Temperature oC 61.00 61.00 62.00 61.00 61.00 61.200 28 Temperature oC 47.70 47.50 47.70 47.90 47.80 47.720 28 Volume flow rate GPM 154.00 154.00 154.00 154.00 154.00 154.000
28 Mass flow rate kg/s 9.71 9.71 9.71 9.71 9.71 9.715
HEATING WATER
29 Temperature oC 39.50 40.70 39.40 40.30 39.70 39.920 CONDENSATION RATIO 25.55%
* Shaded cells mean calculated data.

11/02/00 STARTING TIME 9:45 Hrs.
VARIABLE 11/02/00 11/02/00 11/02/00 11/02/00 11/02/00 11/02/00 FLUID STATE NAME UNITS 10:16 11:16 12:20 13:15 14:15 AVG
0 Dry bulb temperature oC 15.40 16.30 17.80 18.60 19.60 17.540 AMBIENT AIR
0 Relative humidity % 40.30 31.50 26.60 28.40 30.80 31.520 1 Dry bulb temperature oC 15.80 16.90 16.60 17.50 18.90 17.140 1 Mass flow rate, moist kg/s 9.26 9.26 9.26 9.26 9.26 9.260 2 Dry bulb temperature oC 27.80 30.20 31.10 31.20 31.10 30.280 2 Relative humidity % 3 Dry bulb temperature oC 0.000
HOT AIR
3 Relative humidity % 0.000 6 Dry bulb temperature oC 11.70 14.30 14.50 15.50 16.60 14.520 6 Mass flow rate, moist kg/s 9.35 9.35 9.35 9.35 9.35 9.350 7 Dry bulb temperature oC 7.80 11.90 13.10 13.10 14.50 12.080 7 Relative humidity % 8 Dry bulb temperature oC 0.000
COLD AIR
8 Relative humidity % 0.000 13 Temperature oC 13.70 16.80 23.80 23.50 15.80 18.720 13 Volume flow rate GPM 97.40 100.90 99.00 98.80 100.20 99.260 13 Mass flow rate kg/s 6.14 6.37 6.25 6.23 6.32 6.262 14 Temperature oC 21.00 28.50 28.30 29.90 30.20 27.580 10 Temperature oC 17.20 28.00 26.00 29.20 29.20 25.920 16 Specific gravity 1.001 1.001 1.001 1.002 1.002 1.001 16 Volume flow rate Gal 0.00 28.00 33.00 23.00 23.00 21.400 16 Volume Gal 107 107.000
FRESH WATER
16 Mass flow rate kg/s 0.000 0.029 0.033 0.026 0.024 0.023
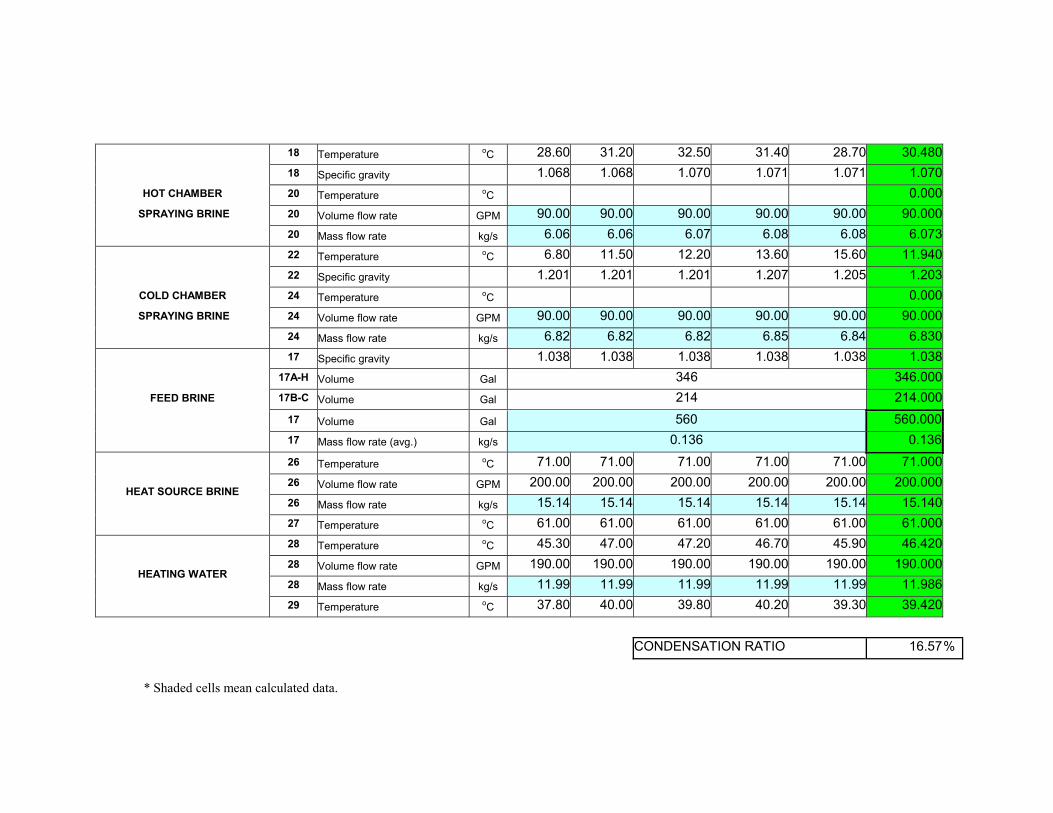
18 Temperature oC 28.60 31.20 32.50 31.40 28.70 30.480 18 Specific gravity 1.068 1.068 1.070 1.071 1.071 1.070
HOT CHAMBER 20 Temperature oC 0.000 SPRAYING BRINE 20 Volume flow rate GPM 90.00 90.00 90.00 90.00 90.00 90.000
20 Mass flow rate kg/s 6.06 6.06 6.07 6.08 6.08 6.073 22 Temperature oC 6.80 11.50 12.20 13.60 15.60 11.940 22 Specific gravity 1.201 1.201 1.201 1.207 1.205 1.203
COLD CHAMBER 24 Temperature oC 0.000 SPRAYING BRINE 24 Volume flow rate GPM 90.00 90.00 90.00 90.00 90.00 90.000
24 Mass flow rate kg/s 6.82 6.82 6.82 6.85 6.84 6.830 17 Specific gravity 1.038 1.038 1.038 1.038 1.038 1.038
17A-H Volume Gal 346 346.000 17B-C Volume Gal 214 214.000
17 Volume Gal 560 560.000 FEED BRINE
17 Mass flow rate (avg.) kg/s 0.136 0.136 26 Temperature oC 71.00 71.00 71.00 71.00 71.00 71.000 26 Volume flow rate GPM 200.00 200.00 200.00 200.00 200.00 200.000 26 Mass flow rate kg/s 15.14 15.14 15.14 15.14 15.14 15.140
HEAT SOURCE BRINE
27 Temperature oC 61.00 61.00 61.00 61.00 61.00 61.000 28 Temperature oC 45.30 47.00 47.20 46.70 45.90 46.420 28 Volume flow rate GPM 190.00 190.00 190.00 190.00 190.00 190.000 28 Mass flow rate kg/s 11.99 11.99 11.99 11.99 11.99 11.986
HEATING WATER
29 Temperature oC 37.80 40.00 39.80 40.20 39.30 39.420 CONDENSATION RATIO 16.57%
* Shaded cells mean calculated data.
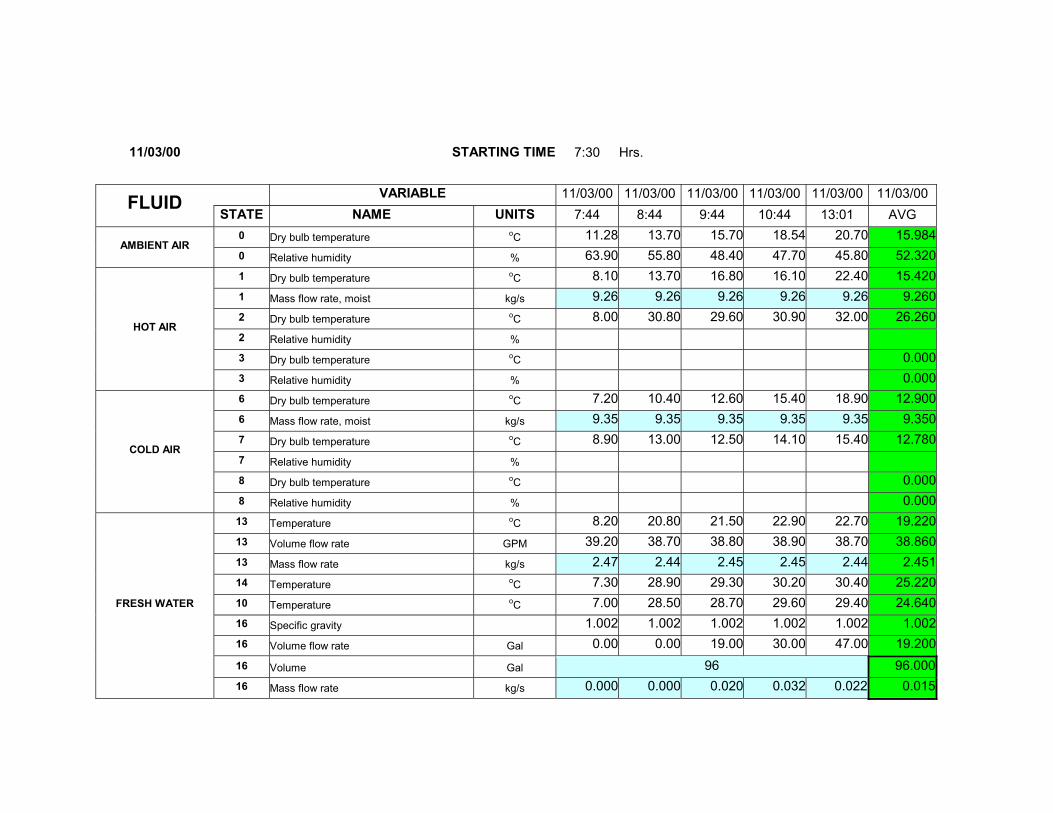
11/03/00 STARTING TIME 7:30 Hrs.
VARIABLE 11/03/00 11/03/00 11/03/00 11/03/00 11/03/00 11/03/00 FLUID STATE NAME UNITS 7:44 8:44 9:44 10:44 13:01 AVG
0 Dry bulb temperature oC 11.28 13.70 15.70 18.54 20.70 15.984 AMBIENT AIR
0 Relative humidity % 63.90 55.80 48.40 47.70 45.80 52.320 1 Dry bulb temperature oC 8.10 13.70 16.80 16.10 22.40 15.420 1 Mass flow rate, moist kg/s 9.26 9.26 9.26 9.26 9.26 9.260 2 Dry bulb temperature oC 8.00 30.80 29.60 30.90 32.00 26.260 2 Relative humidity % 3 Dry bulb temperature oC 0.000
HOT AIR
3 Relative humidity % 0.000 6 Dry bulb temperature oC 7.20 10.40 12.60 15.40 18.90 12.900 6 Mass flow rate, moist kg/s 9.35 9.35 9.35 9.35 9.35 9.350 7 Dry bulb temperature oC 8.90 13.00 12.50 14.10 15.40 12.780 7 Relative humidity % 8 Dry bulb temperature oC 0.000
COLD AIR
8 Relative humidity % 0.000 13 Temperature oC 8.20 20.80 21.50 22.90 22.70 19.220 13 Volume flow rate GPM 39.20 38.70 38.80 38.90 38.70 38.860 13 Mass flow rate kg/s 2.47 2.44 2.45 2.45 2.44 2.451 14 Temperature oC 7.30 28.90 29.30 30.20 30.40 25.220 10 Temperature oC 7.00 28.50 28.70 29.60 29.40 24.640 16 Specific gravity 1.002 1.002 1.002 1.002 1.002 1.002 16 Volume flow rate Gal 0.00 0.00 19.00 30.00 47.00 19.200 16 Volume Gal 96 96.000
FRESH WATER
16 Mass flow rate kg/s 0.000 0.000 0.020 0.032 0.022 0.015
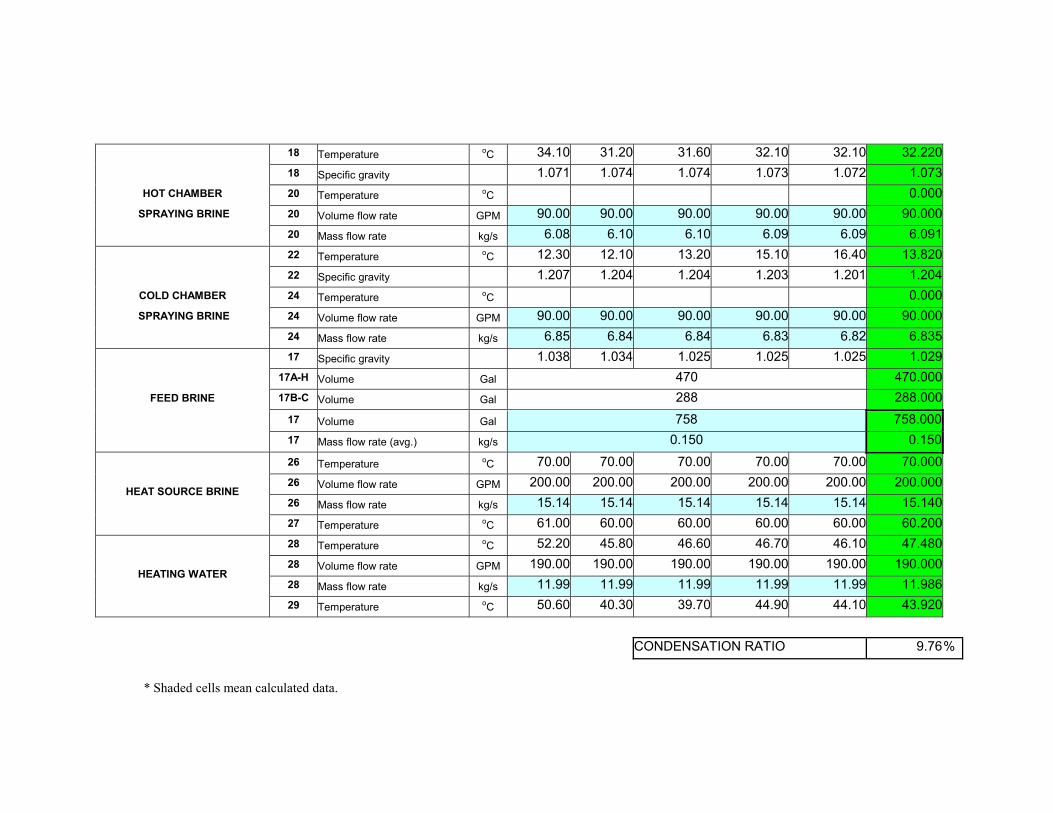
18 Temperature oC 34.10 31.20 31.60 32.10 32.10 32.220 18 Specific gravity 1.071 1.074 1.074 1.073 1.072 1.073
HOT CHAMBER 20 Temperature oC 0.000 SPRAYING BRINE 20 Volume flow rate GPM 90.00 90.00 90.00 90.00 90.00 90.000
20 Mass flow rate kg/s 6.08 6.10 6.10 6.09 6.09 6.091 22 Temperature oC 12.30 12.10 13.20 15.10 16.40 13.820 22 Specific gravity 1.207 1.204 1.204 1.203 1.201 1.204
COLD CHAMBER 24 Temperature oC 0.000 SPRAYING BRINE 24 Volume flow rate GPM 90.00 90.00 90.00 90.00 90.00 90.000
24 Mass flow rate kg/s 6.85 6.84 6.84 6.83 6.82 6.835 17 Specific gravity 1.038 1.034 1.025 1.025 1.025 1.029
17A-H Volume Gal 470 470.000 17B-C Volume Gal 288 288.000
17 Volume Gal 758 758.000 FEED BRINE
17 Mass flow rate (avg.) kg/s 0.150 0.150 26 Temperature oC 70.00 70.00 70.00 70.00 70.00 70.000 26 Volume flow rate GPM 200.00 200.00 200.00 200.00 200.00 200.000 26 Mass flow rate kg/s 15.14 15.14 15.14 15.14 15.14 15.140
HEAT SOURCE BRINE
27 Temperature oC 61.00 60.00 60.00 60.00 60.00 60.200 28 Temperature oC 52.20 45.80 46.60 46.70 46.10 47.480 28 Volume flow rate GPM 190.00 190.00 190.00 190.00 190.00 190.000 28 Mass flow rate kg/s 11.99 11.99 11.99 11.99 11.99 11.986
HEATING WATER
29 Temperature oC 50.60 40.30 39.70 44.90 44.10 43.920 CONDENSATION RATIO 9.76%
* Shaded cells mean calculated data.