Embed Size (px)
Citation preview
Copyright ConSol, 2011
Zero Net Energy & Flat Load Profiles
Rob Hammon, Ph.D. President, BIRAenergy
Principal, ConSol
Copyright ConSol, 2011
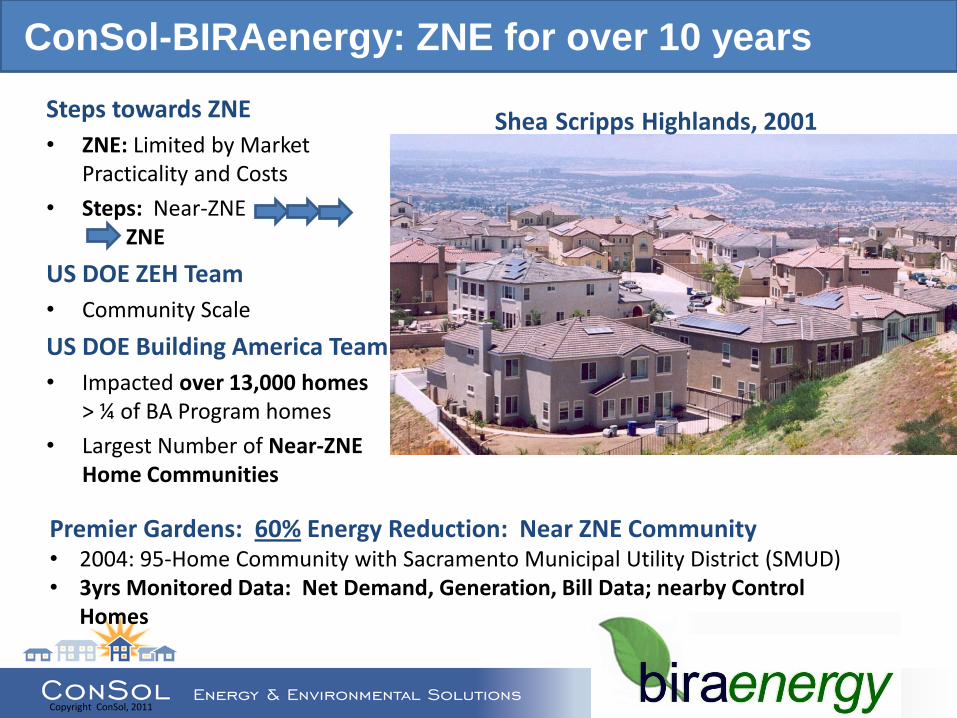
ConSol-BIRAenergy: ZNE for over 10 years
Steps towards ZNE
• ZNE: Limited by Market Practicality and Costs
• Steps: Near-ZNE ZNE
US DOE ZEH Team
• Community Scale
US DOE Building America Team
• Impacted over 13,000 homes > ¼ of BA Program homes
• Largest Number of Near-ZNE Home Communities
Premier Gardens: 60% Energy Reduction: Near ZNE Community • 2004: 95-Home Community with Sacramento Municipal Utility District (SMUD) • 3yrs Monitored Data: Net Demand, Generation, Bill Data; nearby Control
Homes
Shea Scripps Highlands, 2001
Copyright ConSol, 2011
ZNE : Pluses and Minuses
2020 CA Goal: + New homes Zero Net Energy (ZNE)
+ Long-term strategy
- Distribution & other issues
Flat Load Profile (FLP) + Utility benefits
+ Distribution & Grid benefits
+ Long-term strategy – Business Case
ZNE with FLP ?
Copyright ConSol, 2011
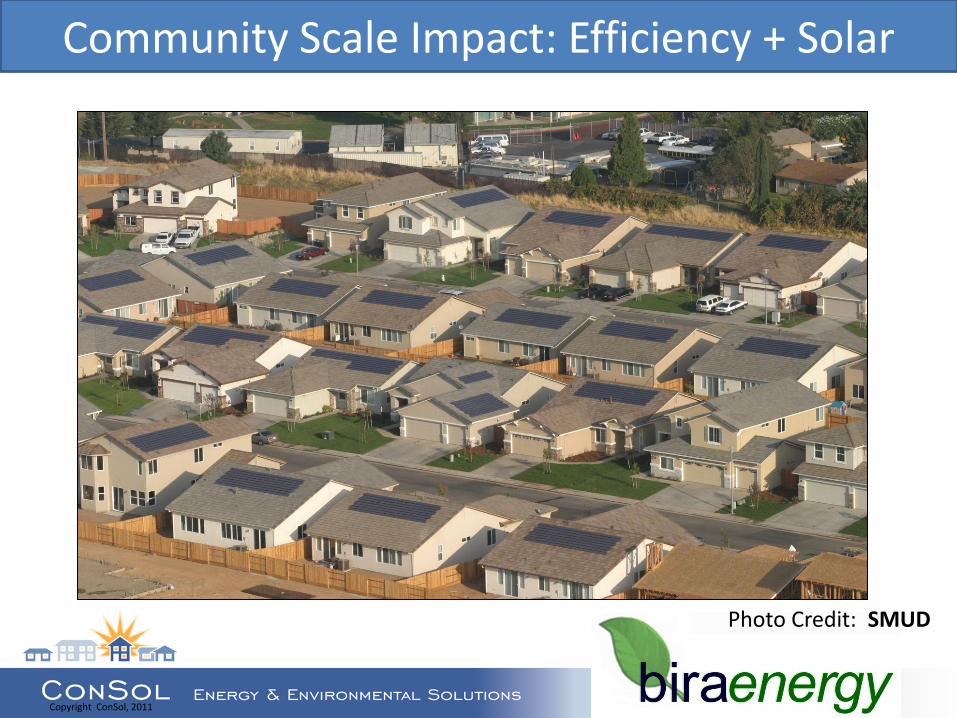
Community Scale Impact: Efficiency + Solar
Photo Credit: SMUD
Copyright ConSol, 2011
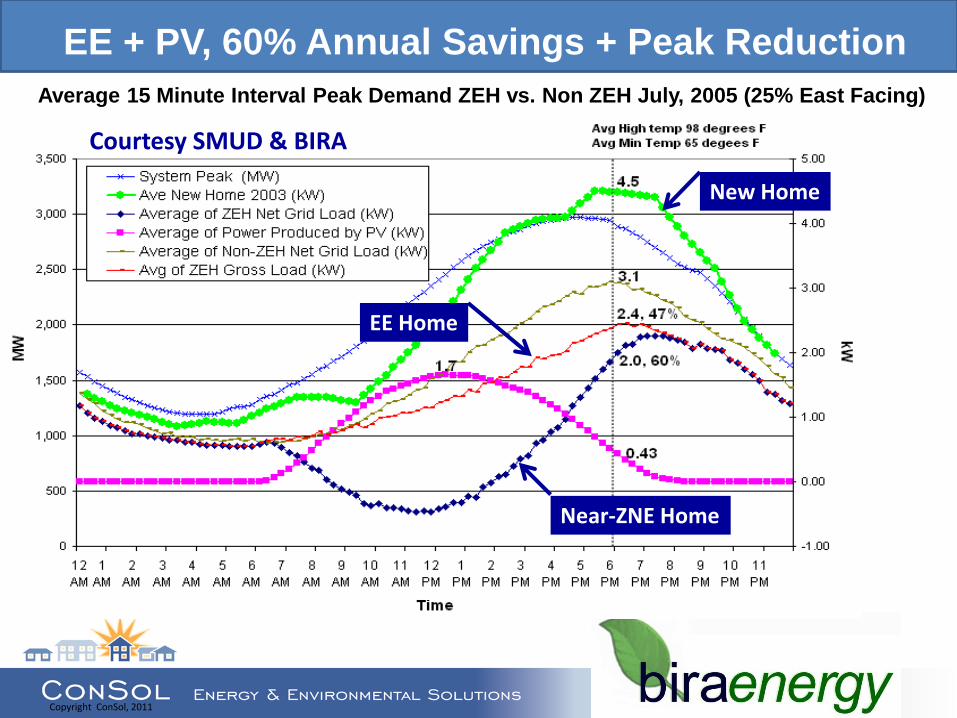
EE + PV, 60% Annual Savings + Peak Reduction
Average 15 Minute Interval Peak Demand ZEH vs. Non ZEH July, 2005 (25% East Facing)
Courtesy SMUD & BIRA
Near-ZNE Home
New Home
EE Home
Copyright ConSol, 2011
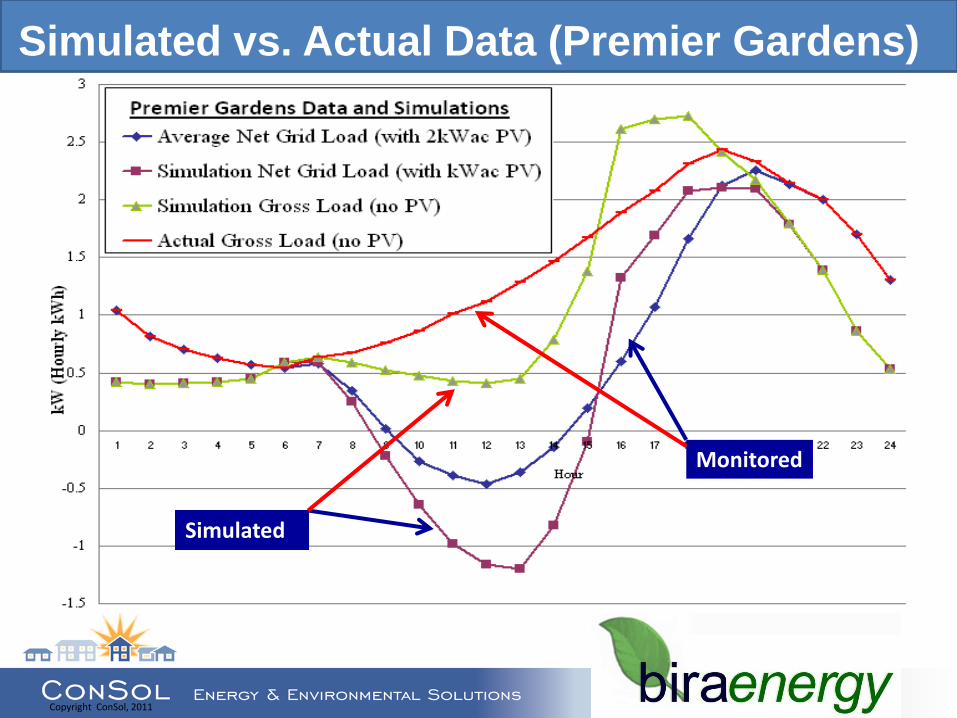
Simulated vs. Actual Data (Premier Gardens)
Monitored
Simulated
Copyright ConSol, 2011
Load Factor = Average Load (kWh)/Peak Load (kW) Average Daily Cycles From Multiple Homes Over July
The electrical power usage can be averaged over various periods of time, in this case ranging from a day to, more typically, a year. Generally when the peak is cyclic, at least one full cycle (in this case a day) should be used to calculate the average.
ZNE Grid Efficiency Impact: Load Factors
Copyright ConSol, 2011
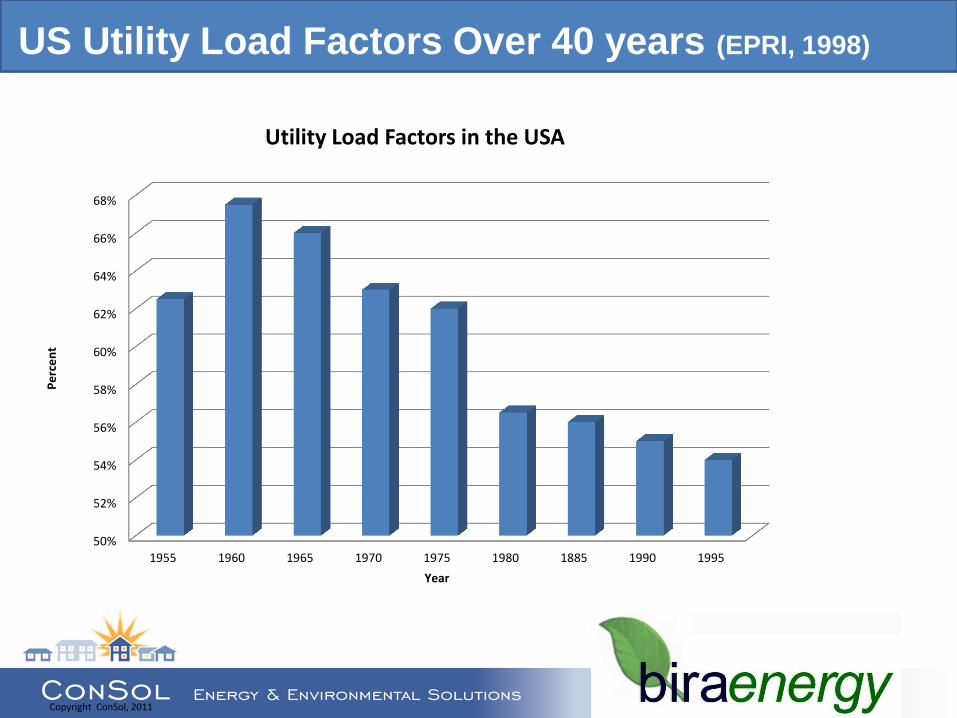
US Utility Load Factors Over 40 years (EPRI, 1998)
50%
52%
54%
56%
58%
60%
62%
64%
66%
68%
1955 1960 1965 1970 1975 1980 1885 1990 1995
Pe
rce
nt
Year
Utility Load Factors in the USA
Copyright ConSol, 2011
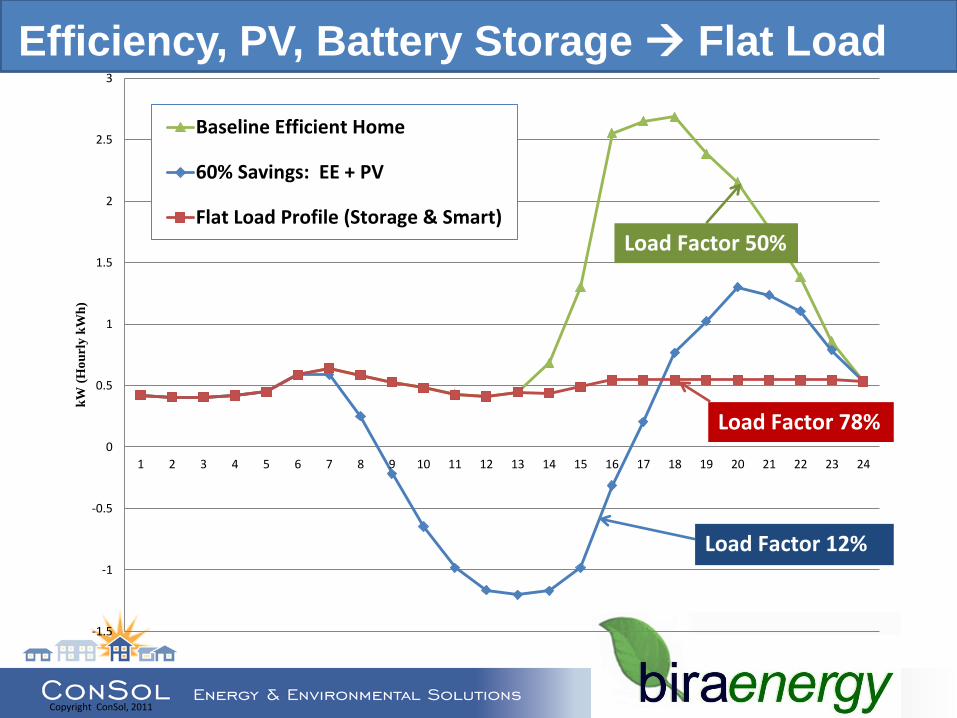
Efficiency, PV, Battery Storage Flat Load
-1.5
-1
-0.5
0
0.5
1
1.5
2
2.5
3
1 2 3 4 5 6 7 8 9 10 11 12 13 14 15 16 17 18 19 20 21 22 23 24
kW
(H
ou
rly
kW
h)
Baseline Efficient Home
60% Savings: EE + PV
Flat Load Profile (Storage & Smart)
Load Factor 50%
Load Factor 78%
Load Factor 12%
Copyright ConSol, 2011
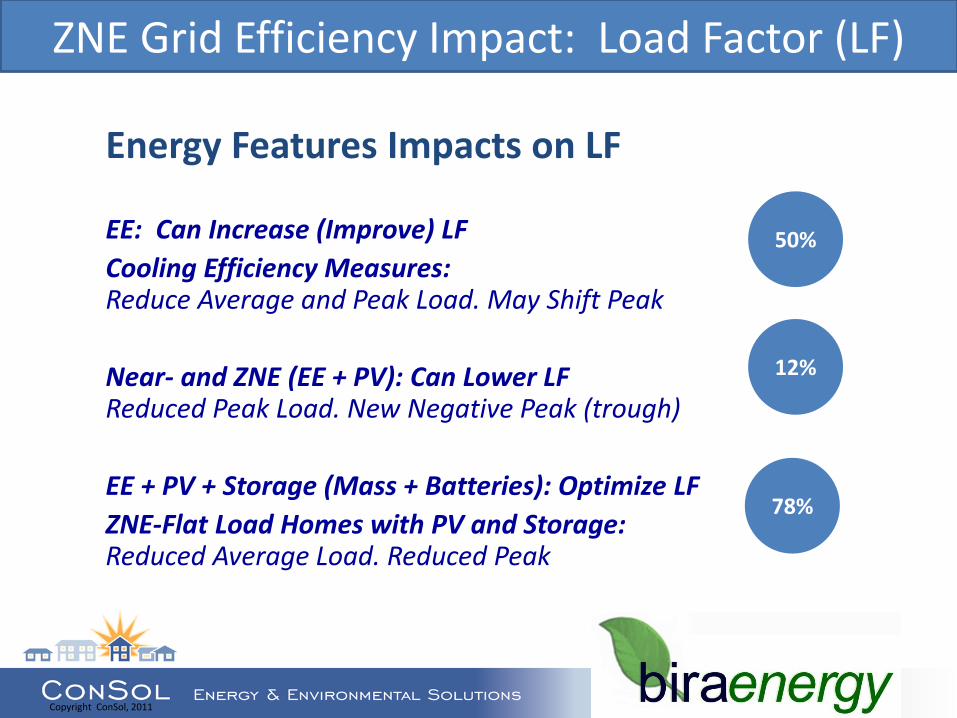
Energy Features Impacts on LF
EE: Can Increase (Improve) LF
Cooling Efficiency Measures: Reduce Average and Peak Load. May Shift Peak
Near- and ZNE (EE + PV): Can Lower LF Reduced Peak Load. New Negative Peak (trough)
EE + PV + Storage (Mass + Batteries): Optimize LF
ZNE-Flat Load Homes with PV and Storage: Reduced Average Load. Reduced Peak
ZNE Grid Efficiency Impact: Load Factor (LF)
12%
78%
50%
Copyright ConSol, 2011
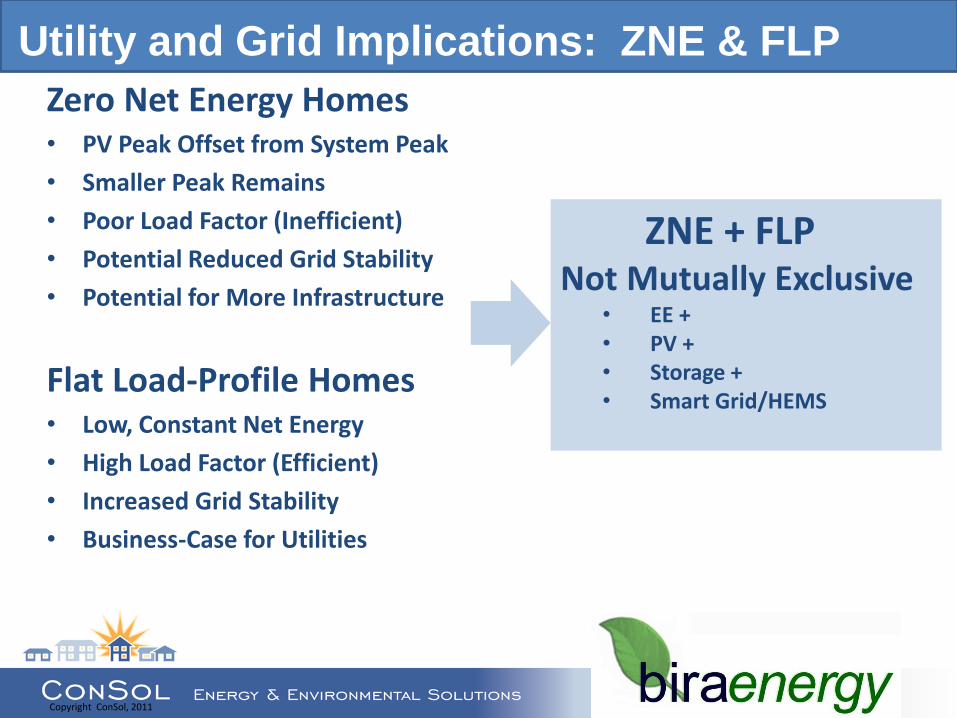
Utility and Grid Implications: ZNE & FLP
Zero Net Energy Homes • PV Peak Offset from System Peak
• Smaller Peak Remains
• Poor Load Factor (Inefficient)
• Potential Reduced Grid Stability
• Potential for More Infrastructure
Flat Load-Profile Homes • Low, Constant Net Energy
• High Load Factor (Efficient)
• Increased Grid Stability
• Business-Case for Utilities
ZNE + FLP Not Mutually Exclusive
• EE + • PV + • Storage + • Smart Grid/HEMS