Embed Size (px)
Citation preview
11/4/2015
1
© 2015, New Buildings Institute
Getting to Zero Energy Outcomes
November 4, 2015
J. Craig V
etnerInstitute | LaJolla, C
A P
hoto: Stephen W
alker Photography
Mark FrankelNew Buildings
Institute
Paul TorcelliniPrincipal Engineer,
National Renewable Energy Laboratory
Ryan ColkerDirector, Consultative Council/Presidential Advisor National Institute of Building Sciences
Ruwan JayaweeraSenior Associate, PAE Consulting
Engineers
© 2015, New Buildings Institute
Today’s session sponsor:

11/4/2015
2
Thank you to our sponsors!
redefining what’s possible in the built environment

11/4/2015
3
Upcoming Getting to Zero Webinars
All sessions 10-11:30 am Pacific/1-2:30 pm Eastern
January 13, 2016 Both Sides of the Meter
February 17, 2016 From Policy to Practice
March 16, 2016 Strategies for Getting to Zero
April 20, 2016 Beyond a Building
May 18, 2016 ZNE Policies within and Across Borders
More information at newbuildings.org/demand-webinars
Save the DateOctober 12-14, 2016 | Denver, CO
Ber
tsch
iS
cho
ol S
cien
ce W
ing
Sea
ttle
, W
A |
Ph
oto
: K
MD
Arc
hit
ects

11/4/2015
4
© New Buildings Institute, 2015
ZNE in the Occupancy Phase
Glazing performance –building orientation –cooling efficiency –infiltration –operating hours –climate –weather –occupant density –heating efficiency –duct design –fan size
–window area –HVAC control sophistication –building mass –interior shading –occupant habits –data centers –kitchen equipment –lighting power density –filter
condition –wall color –lighting controls ‐ furniture configuration –exterior vegetation ‐operable window use –insolation‐glazing orientation –wall insulation –ventilation rate ‐exposed interior surface characteristics ‐domestic hot water use –number of computers –copiers and printers –elevators –exterior lighting ‐occupant gender ratio –elevation –
photovoltaics ‐development density –register location –cooling distribution system –roof insulation –building manager training –cool roof –building surface to volume ratio –building use type –janitorial services –metering strategies –commissioning –structural system –acoustic treatment –slab edge detailing –night setback temperature –ground water temperature –humidity –occupant dress code –lamp replacement strategy –roof slope –daylight controls –sensor calibration –corporate culture –lease terms –utility meter characteristics –parking garage ventilation –HVAC system capacity –number of separate tenants –retail space –age of equipment –ceiling height –heating fuel –
transformer capacity –window mullion pattern –terms of maintenance contract –wall thickness –building height –lighting fixture layout –overhangs –thermostat location –exit lighting –private offices –refrigerators –solar hot water –utility meter –load diversity

11/4/2015
5
Glazing performance –building orientation –cooling efficiency –infiltration –operating hours –climate –weather –occupant density –heating efficiency –duct design –fan size
–window area –HVAC control sophistication –building mass –interior shading –occupant habits –data centers –kitchen equipment –lighting power density –filter
condition –wall color –lighting controls ‐ furniture configuration –exterior vegetation ‐operable window use –insolation‐glazing orientation –wall insulation –ventilation rate ‐exposed interior surface characteristics ‐domestic hot water use –number of computers –copiers and printers –elevators–exterior lighting ‐occupant gender ratio –elevation –
photovoltaics ‐development density –register location –cooling distribution system –roof insulation –building manager training –cool roof –building surface to volume ratio –building use type –janitorial services –metering strategies –commissioning –structural system –acoustic treatment –slab edge detailing –night setback temperature –ground water temperature –humidity –occupant dress code –lamp replacement strategy –roof slope –daylight controls –sensor calibration –corporate culture –lease terms –utility meter characteristics –parking garage ventilation –HVAC system capacity –number of separate tenants –retail space –age of equipment –ceiling height –heating fuel –
transformer capacity –window mullion pattern –terms of maintenance contract –wall thickness–building height –lighting fixture layout –overhangs–thermostat location –exit lighting –private offices –refrigerators –solar hot water –utility meter –load diversity
10
Performance Expectations vs. Outcome
140120100806040200
3.0
2.5
2.0
1.5
1.0
0.5
0.0
Design EUI (Adj2)
Act
ual /
Des
ign
EUI
(Adj
2)
1
CertifiedSilverGoldPlatinum
LEEDlevel

11/4/2015
6
Different Players Affect Building Performance
DesignOperation
Tenants
Computers and EquipmScheduleHabits
LayoutIntegrationInstallationComponents and Fea
StaffingControls
MaintenanceCommissioning
Components of energy outcomes
0
1
2000 2010 2020 2030
Ene
rgy
Use
Design Components

11/4/2015
7
Building Operation
Photo: DPR Construction
BedZEDAttribution: Elekhh
0
1
2000 2010 2020 2030
Ene
rgy
Use
Operating Characteristics
Design Components
Components of energy outcomes

11/4/2015
8
Occupancy
Hood River Middle School, OR . Courtesy: Michael Mathers
0
1
2000 2010 2020 2030
Ene
rgy
Use
Operating Characteristics
Design Components
Tenant Behavior
Components of energy outcomes

11/4/2015
9
Solar PV Production‐7% Elevator
2%
Plugs/Misc44%
Lighting23%
HVAC, DHW,Fans 31%
RFM: Energy End Use based on 2 years
Solar Produced
Elevator
Plugs/Misc
Lighting
HVAC,DHW,Fans
End Use in HP Buildings
EUI = 20 kBtu/sf/yr
Net Zero Site Limits

11/4/2015
10
© New Buildings Institute, 2015
Operator & Occupant Engagement
© New Buildings Institute, 2015
Performance Analysis Tools

11/4/2015
11
Outcome Project Examples• Edith Green Wendell Wyatt Federal
Building; Portland -SERA• George Deukmejian Courthouse, Long
Beach –AECOM/Clark• Federal Center South; Seattle -ZGF
NBI 2015

11/4/2015
12
It’s High‐Performance NOT High‐Desires
Ryan M. Colker, J.D.Director, Consultative Council/Presidential Advisor
National Institute of Building Sciences1090 Vermont Ave., NW • Suite 700
Washington, DC 20005, USA202-289-7800 [email protected]
@rmcolker
Public Law 93‐383, Sect. 809
Develop and maintain performance criteria for maintenance of life, safety, health, and public welfare for the built environmentEvaluate and prequalify building technology and productsConduct related and needed investigationsAssemble, store, and disseminate technical data and related information
Congress directed the Institute to “exercise its functions and responsibilities in four general areas………..”

11/4/2015
13
The Institute at Work
Industry Advocacy & Outreach
Consultative Council
Council on Finance, Insurance and Real Estate (CFIRE)
Off‐Site Construction Council (OSCC)
Science, Technology, Engineering and Mathematics
(STEM)
Commercial Workforce Credentialing Council (CWCC)
National Council of Governments on Building
Codes and Standards (NCGBCS)
Facility Performance & Sustainability
Building Enclosure Technology and Environment Council
(BETEC)
Sustainable Buildings Industry Council (SBIC)
High Performance Building Council (HPBC)
National Mechanical Insulation Committee
Facility Maintenance and Operation Committee (FMOC)
Information Resources & Technology
Whole Building Design Guide
National Clearinghouse for Educational Facilities
Building Research Information Knowledgebase (BRIK)
buildingSMART alliance
National BIM Standard‐U.S.
Security & Disaster
Preparedness
Building Seismic Safety Council (BSSC)
Multihazard Mitigation Council (MMC)
Integrated Resilient Design Program
Multihazard Risk Assessment/HAZUS
High‐Performance building means a building that
integrates and optimizes on a life‐cycle basis all
major high‐performance attributes, including
energy [and water] conservation, environment,
safety, security, durability, accessibility, cost‐
benefit, productivity, sustainability, functionality,
and operational considerations.‐Energy Independence and Security Act of 2007 §401 (PL 110‐140)
High-Performance Buildings

11/4/2015
14
Identifying a Path Forward
• Wide‐ranging examination of key issues with recommendations
• http://newbuildings.org/performance‐outcomes‐event‐report
• Follow‐on discussions in early 2016
11/4/2015
15
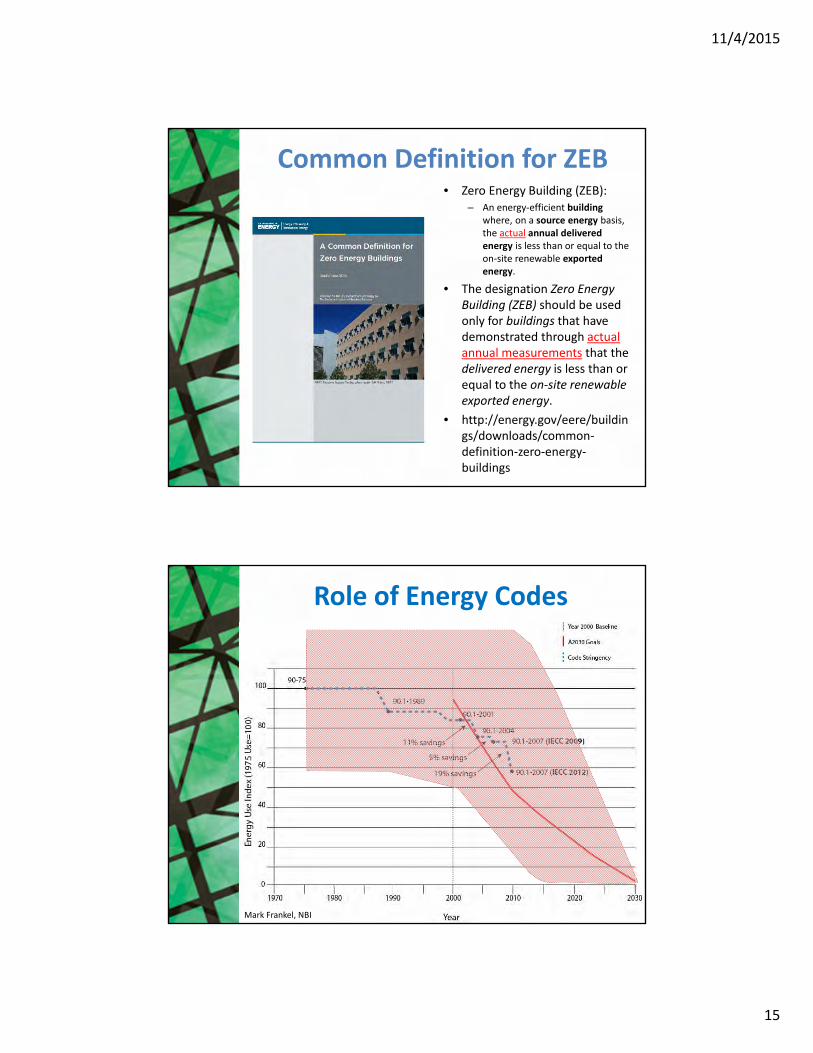
Common Definition for ZEB• Zero Energy Building (ZEB):
– An energy‐efficient building where, on a source energy basis, the actual annual delivered energy is less than or equal to the on‐site renewable exported energy.
• The designation Zero Energy Building (ZEB) should be used only for buildings that have demonstrated through actual annual measurements that the delivered energy is less than or equal to the on‐site renewable exported energy.
• http://energy.gov/eere/buildings/downloads/common‐definition‐zero‐energy‐buildings
Mark Frankel, NBI
Role of Energy Codes

11/4/2015
16
Individual sub‐systems have become more efficient, but overall efficiency has been flat
BuildingCooling Sub Systems
GlazingSub Systems
Energy Efficient Buildings Hub/Consortium for Building Energy Innovation
Efficiency Improvements:Building Sector vs. Other Sectors
Aircraft Systems
Automobile
32Energy Efficient Buildings Hub/Consortium for Building Energy Innovation

11/4/2015
17
Driving to Outcomes• We’ve done the easy stuff
– Optimized current equipment/methodologies– Honed individual disciplines
• Drive for high‐performance– Integrate and optimize to achieve multiple requirements
• Owners, Occupants, Policymakers demanding results
• Fundamental shift to life‐cycle performance– Driving new tools, contracts, delivery methods
• Comprehensive strategy, collaborative approach– Integrated Design, BIM, Delivery Methods, Contracts, Commissioning

11/4/2015
18
Tackling the Energy Code Challenges
• Bring wider focus to designconstructionoperations
• Tie to actual, measured results
• Limit burdens on code departments
• Incent smooth handover
• Move beyond prescriptive and component‐by‐component approach
• All energy uses covered
• Compliance through most cost‐effective means
Outcome‐based Pathway in the International Green Construction
Code• Sets targets
– Table based on CBECS– Ratio of actual performance to table reference
• Compliance– Issue Temporary Certificate of Occupancy or Post Occupancy Verification Permit
– Owner bears burden of reporting to resolve TCO/POVP• 12 months compliant data within 3 years• Certified by registered design professional• Could hinder financing, insurance, leasing, sale, permitting, etc.
– Penalties/resolution up to AHJ– Requires links with other policies/departments

11/4/2015
19
Seattle Target Performance Path
• Outcome‐based pathway
• Establishes energy use targets
• Requires demonstration of operational energy use
• Financial security to be used as penalty ($4sqft)
– Proportion eligible for mitigation
Setting the Stage• Link with comprehensive policy approaches to
performance goals
• Coupled with benchmarking & reporting can begin to develop localized targets
• Supports movement beyond one time demonstration to ongoing compliance
• Allows future focus on regulating performance of existing buildings
• Create feedback loops within & between AEC, O+M, government
• Drive improvements in performance data, modeling, turnover, integrated design and operations

11/4/2015
20
Establish Building Team
ArchitectEngineerContractorOwnerO&M
CommissioningSpecialists
Contract TypesIPD w/targets
DBOMPPP
Energy Saving Agreement
Energy Saving Purchase Agreement
Design‐Build Plus
Set Targets
Owner/
Team
Policies
Collaborative Design
Data collection
Model
Data collection
Construction
Commissioning
Operations
Monitor
Checkpoints
Data collectionFeedback
Codes + Regulation (benchmark & reporting, etc.)Incentives (utility, tax, permitting, etc.)
IncentivesPenalties
A Pathway for Outcome‐Based
Performance
It’s Not Just Codes. . .
• Emergence of Performance Contracting
– GSA
– Washington
– California
• Advancing past Design‐Bid‐Build
• New AIA Guide on PPP– http://www.aia.org/aiaucmp/groups/aia/documents/pdf/aiab104939.pdf
• Commission on Environmental Cooperation Integrated Design & Delivery Guide

11/4/2015
21
Procurement methods
Design / Build Operate
Design Bid/Build Operate
Re‐examine Procurement Methods
Design / Build Operate/Maintain

11/4/2015
22
Governor Deukmejian Courthouse, Long Beach
• Public‐Private Partnership/DBFOM
• The performance‐based contract allowed the courthouse to be constructed without any public funding and provides for the ongoing maintenance and performance of the facility. Under the terms of the agreement, the Judicial Council can deduct a specific amount from the availability payment if components of the building do not work. For example, there is a $5,000 deduct for every two hours that certain elevators are inoperable.
GSA Federal Center South

11/4/2015
23
Olympia, Washington Government Project
Just having the map doesn’t mean you get the treasure. . .
• Need leaders to step up and lead the way
• Share your experiences/Educate peers
• Demand results/Deliver results
• Participate in development of tools, policies

11/4/2015
24
Overall Needs for Effective Outcomes
• Education across industry
– AEC
– Code Officials
– Government
• Guidance documents
– Modeling
– Benchmarking
– Policy Frameworks
• Insurance Markets
• Contracting Tools
Overall Needs for Effective Outcomes
• Procurement guides
• Data protocols
• Links with 111(d) programs as measurable, verified reductions in energy/GHGs
• Shifts in processes, design fees, risk profiles, project scope, attitudes
• Case studies

11/4/2015
25
ResultsAchieve net zero energy
Reduce water consumption Protect environment
Reduced carbon footprintMeet LEED goals
Meet Energy Star GoalsAsset optimization
High Performance Buildings• Operationally Cost effective• Sustainable / Green / Energy
Efficient• Resilient / DR‐COOP• Supports Productivity /
Mission• Functional / Operational• Preserve historical value• Safe to work in• Secure from threats• Accessible• Aesthetically pleasing
Improved Facility Delivery• Reduce product waste• Prefabrication• Improve supply chain• Process optimization• Systems analysis• Performance analysis• Commissioning• Improve product selection• Common information base• Coordinate decision making• Integrate scheduling• Optimize design• Design to sustain
Initial Investment Costs + Lifetime Cost Reductions = Zero or Net Positive
Shifting Perceptions on the Cost of High Performance

11/4/2015
26
Utilizing BIM to Optimize Operations
• UK Government leading the way
– Soft Landings
– Focus on the “Golden Thread”
• Why we build the building in the first place
• BIM is not just a design tool, but a life‐cycle management tool
Courtesy of Autodesk
The Facility Lifecycle
52

11/4/2015
27
Simulations-Comfort-Ventilation, heating-Energy-Light, sound-Insulation-Fire, usage-Environment-Life time predictions-Crowd behavior- Safety
Specifications-Specification sheets-Classification standards-Estimates, accounting
Briefing-Functional req.-Estimates-Conditions-Requirements
Knowledge databases-Best practise knowledge-Own practice
Laws and regulations-Building regulations-Building specifications
Design and Analysis-Drawings, calculations-Architect, engineer,…
Modeling-Visualisation, 3D models
Procurement-Product databases-Price databases
Facility management-Letting, sale, operations-Maintenance-Guaranties
Demolition, refurbishment-Rebuild-Demolition-Restoration
Construction management-Scheduling-Logistics, 4D
By Lars BjørkhaugIllustrations by: Byggforsk, Olof Granlund, NBLN University of California, Stanford University
Costing- Initial cost- Life-cycle- Value Engineering
Two Key Pieces in the Puzzle
Data Finance

11/4/2015
28
http://www.wbdg.org/resources/outcomebasedpathways.php
http://newbuildings.org/outcome‐based‐energy‐codes

11/4/2015
29
National Performance Based Design Guide
Go to http://npbdg.wbdg.org for latest version
National Performance Based Design Guide
Go to http://npbdg.wbdg.org for latest version

11/4/2015
30
Owner’s Performance Requirements Tool Assists the design community to plan new building designs and retrofit projects by analyzing different performance scenarios and producing cost effective strategies as outputs
Allows decision makers to make judgments in terms of how much exposure and cost is acceptable for:
Resilience performance
Overall Risk levels
Seismic risk
Flood risk
Tornado risk
Blast range threat
Ballistic threat
Available at www.oprtool.org
CBR exposure
Exterior glazing
Air tightness/leakage
Unit energy cost
Natural ventilation
Solar energy
Noise control
OPR Enables Owner ROI AnalysisPlanning Process
Fire, SafetySecurityEnergyEnvironment
Retrofit
Owner Prioritized HP A&D
Owner Prioritized Engineering
Owner Prioritized Engineering
New Construction
OPR
OPR
HP ConsiderationsHP MaterialsMulti‐Hazards
Cost vs. Resilience (Return on Investment)
Performance Improvements Selected Results
• Illustrates how the OPR tool can show the ROI when increasing performance.
• Based on a realistic example of an office building. Performance was increased for all safety and security attributes – CBR not included
Highest Improved Performance Scenario – Negligible damage, minor repairs required to the envelope, no disruption in operations
70%Increase in CapEx
1200%Decrease in Exposure
Moderate Improved PerformanceScenario ‐ Repairable damage to envelope, some disruption in operations
57%Increase In CapEx
230%Decrease in Exposure
Lowest Improved Performance Scenario (Life Safety) – Building destroyed but does not collapse
20%IncreaseIn CapEx
0 % Decrease in Exposure
OPR also evaluates ROI from operational improvements (energy savings, and durability)

11/4/2015
31
NREL is a national laboratory of the U.S. Department of Energy, Office of Energy Efficiency and Renewable Energy, operated by the Alliance for Sustainable Energy, LLC.
Occupant Inputs =
Zero Energy Output
Paul A. Torcellini, Ph.D., P.E. Principal Engineer, NREL
November 4, 2015
62
• RSF uses 50% less energy than if it were built to current commercial codes at no extra capital cost
• RSF increases space at NREL by 60% but only increases energy use by 6%
NREL/17833

11/4/2015
32
63
RSF Built for “No Additional Cost”
PROJECTS AND LEED CERTIFICATION
RSF 1$259/sqftRSF 2
$246/sqft
Average$335/sqft
64
Measured Versus Modeled Monthly and Cumulative EUI
64
Cre
dit:
Cha
d Lo
bato
/NR
EL
0
4
8
12
16
20
24
28
32
36
0.0
0.5
1.0
1.5
2.0
2.5
3.0
3.5
4.0
4.5
Mod
el
RS
F
PV
Mod
el
RS
F
PV
Mod
el
RS
F
PV
Mod
el
RS
F
PV
Mod
el
RS
F
PV
Mod
el
RS
F
PV
Mod
el
RS
F
PV
Mod
el
RS
F
PV
Mod
el
RS
F
PV
Mod
el
RS
F
PV
Mod
el
RS
F
PV
Mod
el
RS
F
PV
October2010
November2010
December2010
January2011
February2011
March2011
April2011
May2011
June2011
July2011
August2011
September2011
An
nu
al E
UI
(kB
tu/f
t2)
Mo
nth
ly E
UI
(kB
tu/f
t2)
PV
Data Center
Mechanical Systems
Plug Loads
Lighting
Heating
Cooling
Model Annual EUI
RSF Annual EUI
The PV system is sized for an annual EUI of 35.1 kBtu/ft2.
Note: The annual EUI values are demand side valuesand do not include the

11/4/2015
33
65
Buildings Are For Occupants!
65
• Occupants and Operators ultimately control all the energy loads
• Frustration when Occupants are expected to “perform” but have no levers to control
• Plug loads
• Design elements for the Occupants
• Occupant training
66
RSF Energy Modeling
Space Heating24%
Space Cooling3%
Pumps1%
Ventilation Fans5%
Domestic Hot Water
3%
Exterior Lights0%
Lights6%
Office Plug Loads22%
Task Lights0%
Data Center35%
Data Center Cooling
0%
Data Center Fans1%
NREL RSF Energy Use Breakdown
Credit: Chad Lobato/NREL
Cre
dit:
Sta
ntec
End Use kBtu/ft2
Space Heating 8.58Space Cooling 0.85Pumps 0.48Ventilation Fans 1.88Domestic Hot Water 0.90Exterior Lights 0.12Lights 2.07Office Plug Loads 7.87Task Lights 0.10Data Center 12.11Data Center Cooling 0.02Data Center Fans 0.20

11/4/2015
34
67
Day vs. Night Plug and Process Loads
Annual Plug Load Energy Use Intensity (kBtu/ft2)
Unoccupied Hours Power Density (W/ft2)0.10 0.20 0.30 0.40 0.50 0.60 0.70 0.80 0.90 1.00 1.10 1.20 1.30 1.40 1.50
Occ
up
ied
Ho
urs
Po
wer
D
ensi
ty(W
/ft2
)
0.10 3.0 5.2 7.4 9.7 11.9 14.1 16.3 18.6 20.8 23.0 25.2 27.4 29.7 31.9 34.10.20 3.8 6.0 8.2 10.4 12.7 14.9 17.1 19.3 21.5 23.8 26.0 28.2 30.4 32.7 34.90.30 4.5 6.8 9.0 11.2 13.4 15.6 17.9 20.1 22.3 24.5 26.8 29.0 31.2 33.4 35.60.40 5.3 7.5 9.7 12.0 14.2 16.4 18.6 20.9 23.1 25.3 27.5 29.7 32.0 34.2 36.40.50 6.1 8.3 10.5 12.7 15.0 17.2 19.4 21.6 23.8 26.1 28.3 30.5 32.7 35.0 37.20.60 6.8 9.1 11.3 13.5 15.7 17.9 20.2 22.4 24.6 26.8 29.1 31.3 33.5 35.7 38.00.70 7.6 9.8 12.0 14.3 16.5 18.7 20.9 23.2 25.4 27.6 29.8 32.1 34.3 36.5 38.70.80 8.4 10.6 12.8 15.0 17.3 19.5 21.7 23.9 26.2 28.4 30.6 32.8 35.0 37.3 39.50.90 9.1 11.4 13.6 15.8 18.0 20.3 22.5 24.7 26.9 29.1 31.4 33.6 35.8 38.0 40.31.00 9.9 12.1 14.4 16.6 18.8 21.0 23.2 25.5 27.7 29.9 32.1 34.4 36.6 38.8 41.01.10 10.7 12.9 15.1 17.3 19.6 21.8 24.0 26.2 28.5 30.7 32.9 35.1 37.3 39.6 41.81.20 11.4 13.7 15.9 18.1 20.3 22.6 24.8 27.0 29.2 31.4 33.7 35.9 38.1 40.3 42.61.30 12.2 14.4 16.7 18.9 21.1 23.3 25.5 27.8 30.0 32.2 34.4 36.7 38.9 41.1 43.31.40 13.0 15.2 17.4 19.6 21.9 24.1 26.3 28.5 30.8 33.0 35.2 37.4 39.7 41.9 44.11.50 13.7 16.0 18.2 20.4 22.6 24.9 27.1 29.3 31.5 33.8 36.0 38.2 40.4 42.6 44.9
Only occupied about ⅓ of the me‐Nights Unoccupied‐Weekends Unoccupied‐Holidays Unoccupied
68
Plug Loads
• 4 Quads—20% of commercial building energy use
• Office equipment is 7% of total electrical use
• Very diverse and diffuse making them hard to manage and control
• Evaluated current plug loads• Developed a process to reduce
o Unused equipmento Space conditioningo Lighting needs

11/4/2015
35
69
RSF Plug Load Reduction Strategies
• Elevators– Use energy efficient traction elevators– Change elevator lighting to energy efficient
fluorescent lighting– Turn off elevator lighting when the elevator is
unoccupied• Break Rooms
– Increase the number of people that use each break room from approximately 40 to 60
– Eliminate the cooler on the drinking fountain• Task Lights
– Move from 35W fluorescent task lights to 6W LED task lights
• Phones– Go from 1000 standard phones to 1000 VOIP phone
that consumes 2W each• Copiers, Printers, Fax Machines
– Decrease the number people that use individual copiers, printers and fax machines
– Increase the number of people that use common, or group, copiers, printers and fax machines from 15 to 20
– Increase the use of all‐in‐one machines• Computers
– Go from approximately 260 laptops, 33% of staff, to 720, 90% of staff, ensure standby mode works for all workstations
• Data Center– Blade Servers with Virtualization– High efficiency UPS– 65W/employee current to 48W/employee in RSF
• The result of these strategies is a 47% reduction in plug loads
0.00
5.00
10.00
15.00
20.00
Baseline RSF
EU
I (k
Btu
/ft2
)
Baseline vs RSF Plug Load EUICoffee Kiosk
Elevator Lighting
Elevators
Drinking Fountains
Vending Machines
Microwaves
Coffee Pots
Refrigerators
Task Lights
Phones
Fax Machines
Copiers
Printers
Computers
Data Center
Conference RoomEquipment
Telecom RoomEquipment
Misc
70
Graphics and Technical Resources
70
Technical Resources
• Utility Incentives Spreadsheet
• “How To” 1‐Pager for Office Desk
• Decision Trees

11/4/2015
36
71
0.00
0.05
0.10
0.15
0.20
0.25
0.30
0.35
0.40
0.45
0.50
0.55
0.60
0.65
0 2 4 6 8 10 12 14 16 18 20 22 24
Po
wer
Den
sity
(W
/ft2
)
Time of Day
Model Average
October 2010
November 2010
December 2010
January 2011
February 2011
March 2011
April 2011
May 2011
June 2011
July 2011
August 2011
October 2010 – August 2011 Plug Load Power Density
Note: The elevators are included in the plug loadsCredit: Chad Lobato/NREL
72
Tools Deployed
• Effective break rooms
o Water
o Refrigeration
o Thermal comfort
• Advanced Power Strips
• Automatically turn off outlets when not needed

11/4/2015
37
73
Lighting Control
• Must look like an on/off switch
• Give the users control
• Vacancy control strategy
73
7474
Is this photo significant?
Credit: Jennifer Scheib/NREL

11/4/2015
38
75
76

11/4/2015
39
77
Radiant Ceilings
Thermal Mass Walls
Operable Windows
UnderfloorVentilation
78
6 watt task light50 fc
Daylight
Ambient lighting with daylight sensors for 25 fc
Hallway Glare Control

11/4/2015
40
79
Space Layout
79
• Inviting stairwells
• Hallways with bright ends
• Elevators only in the center spline
80

11/4/2015
41
81
82

11/4/2015
42
83
Summary
• Keep the building simple
• Let the occupants help with the controls—engage them
• Default is maximum energy savings
• Make the user interface SIMPLE
• Design the building to be robust and to work with the occupants, not ignore the occupants
• Occupants can be come your biggest ally.
www.nrel.gov/rsf
Buildingdata.energy.gov/cbrd
Paul Torcellini

11/4/2015
43
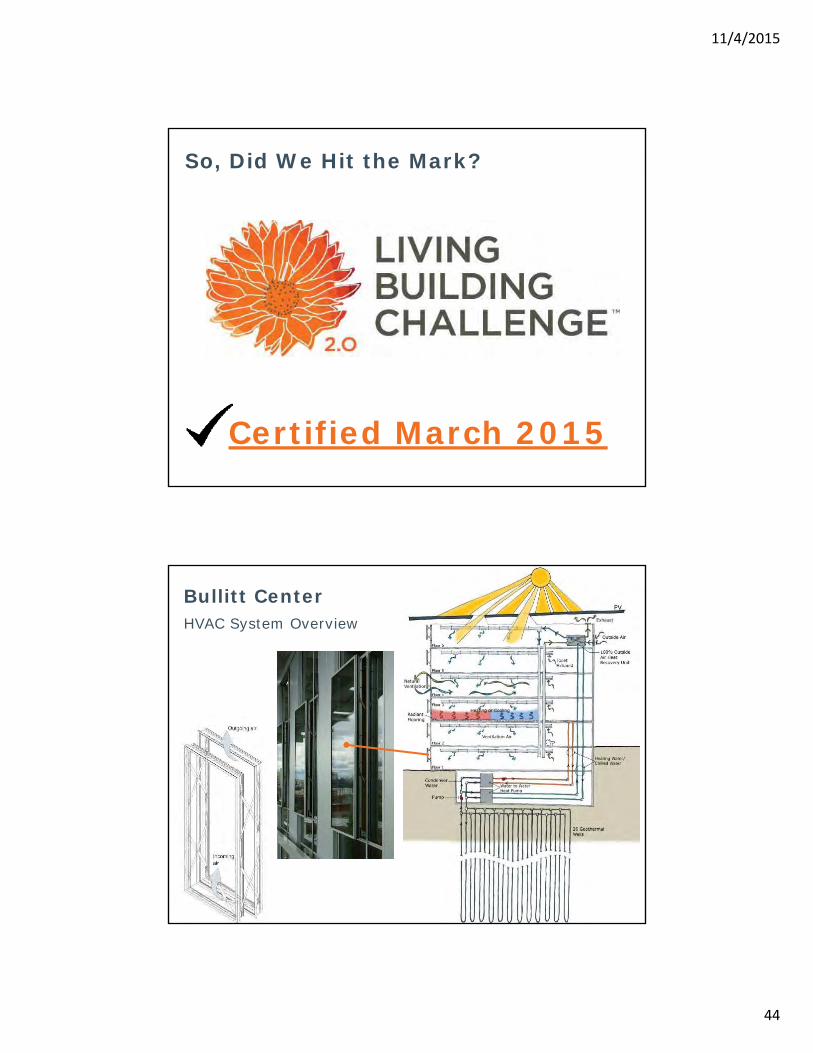
Results from a Living Building
The Bullitt Center Turns Two
Presented By: Ruwan Jayaweera, PE, LEED AP, Senior Associate
High Performance
Goal
High Performance
Goal
EnableHIGH
PERFORMANCE BUILDING
ProveMEASUREMENT
&VERIFICATION
MotivateBEHAVIOR
&AWARENESS
11/4/2015
44
So, Did We Hit the Mark?
Certified March 2015
Bullitt CenterHVAC System Overview

11/4/2015
45
Proposed Building Energy Use
Actual Performance

11/4/2015
46
Net positive building
EUI under 10 in 2014 | Predicted EUI of 16
85% occupied
Bullitt Center Performance
Predicted vs. ActualBullitt Center Performance
-40,000
-30,000
-20,000
-10,000
0
10,000
20,000
30,000
40,000
50,000
60,000
Jan Feb Mar Apr May Jun Jul Aug Sep Oct Nov Dec Jan Feb Mar Apr May Jun Jul Aug Sep Oct Nov Dec Jan Feb Mar Apr May Jun Jul Aug
Elec
tric
Con
sum
ptio
n, k
Wh
Bullitt Center PerformanceActuals, 10/1/15
SCL Power Used PV Exported to SCL PV Used by BullittSavings over Baseline Bullitt Building Use Est. Code BaselineSCL Net Meter - SVC 4 Proposed Tenant Building

11/4/2015
47
Bullitt Center EnergyPredicted Energy Production & Consumption
0
5,000
10,000
15,000
20,000
25,000
30,000
35,000
40,000
45,000
Ener
gy C
onsu
mpt
ion
(kW
h)
PREDICTED Energy Consumption 100% OCCUPIED PREDICTED Energy Production
Bullitt Center EnergyPredicted Energy Production & Consumption
0
5,000
10,000
15,000
20,000
25,000
30,000
35,000
40,000
45,000
Ener
gy C
onsu
mpt
ion
(kW
h)
ACTUAL Energy ConsumptionACTUAL Energy Production

11/4/2015
48
0
5,000
10,000
15,000
20,000
25,000
30,000
35,000
40,000
45,000
Ener
gy
Co
nsu
mp
tio
n (
kWh
)
ACTUAL Energy Consumption ACTUAL Energy Production
PREDICTED Energy Consumption 100% OCCUPIED PREDICTED Energy Consumption 75% OCCUPIED
PREDICTED Energy Consumption 50% OCCUPIED PREDICTED Energy Consumption 25% OCCUPIED
PREDICTED Energy Production
Bullitt Center EnergyPredicted vs. Actual Energy Production & Consumption
8.5 EUI
16.7 EUI
11.1 EUI
16.7 EUI
Performance Predicted Weather
0
500
1000
1500
2000
2500
HO
UR
S
TEMPERATURES
Predicted Values (TMY3)Temperature and Humidity Plot, Seattle, WA
All Hours
0 to 20 RH 20 to 40 RH 40 to 60 RH 60 to 80 RH 80 to 100 RH

11/4/2015
49
Performance Actual Weather
0
500
1000
1500
2000
2500
HO
UR
S
TEMPERATURES
Actual Values (from Bullitt DDC)Temperature and Humidity Plot, Seattle, WA
All Hours
0 to 20 RH 20 to 40 RH 40 to 60 RH 60 to 80 RH 80 to 100 RH
0
10
20
30
40
50
60
70
80
90
100
12:03:00 AM
3:18:00 AM
6:33:00 AM
9:48:00 AM
1:03:00 PM
4:18:00 PM
7:33:00 PM
10:48:00 PM
2:03:00 AM
5:18:00 AM
8:33:00 AM
11:48:00 AM
3:03:00 PM
6:18:00 PM
9:33:00 PM
12:48:00 AM
4:03:00 AM
7:18:00 AM
10:33:00 AM
1:48:00 PM
5:03:00 PM
8:18:00 PM
11:33:00 PM
2:48:00 AM
6:03:00 AM
9:18:00 AM
12:33:00 PM
3:48:00 PM
7:03:00 PM
10:18:00 PM
1:33:00 AM
4:48:00 AM
8:03:00 AM
11:18:00 AM
2: 33:00 PM
5:48:00 PM
9:03:00 PM
12:18:00 AM
3:33:00 AM
6:48:00 AM
10:03:00 AM
1:19:00 PM
4:34:00 PM
7:49:00 PM
11:04:00 PM
2:19:00 AM
5:34:00 AM
8:49:00 AM
12:04:00 PM
3:19:00 PM
6:34:00 PM
9:49:00 PM
North Zone Summer Temperature Profile
ZONE 1 SLAB TEMPERATURE ZONE 1 SPACE TEMPERATURE OUTSIDE AIR TEMPERATURE
Performance Thermal Comfort

11/4/2015
50
0
10
20
30
40
50
60
70
80
90
100
12:01:00 AM
3:16:00 AM
6:31:00 AM
9:46:00 AM
1:01:00 PM
4:16:00 PM
7:31:00 PM
10:46:00 PM
2:01:00 AM
5:16:00 AM
8:31:00 AM
11:46:00 AM
3:01:00 PM
6:16:00 PM
9:31:00 PM
12:46:00 AM
4:01:00 AM
7:16:00 AM
10:31:00 AM
1:46:00 PM
5:01:00 PM
8:16:00 PM
11:31:00 PM
2:46:00 AM
6:01:00 AM
9:16:00 AM
12:31:00 PM
3:46:00 PM
7:01:00 PM
10:16:00 PM
1:31:00 AM
4:46:00 AM
8:01:00 AM
11:16:00 AM
2: 31:00 PM
5:46:00 PM
9:01:00 PM
12:16:00 AM
3:31:00 AM
6:46:00 AM
10:01:00 AM
1:16:00 PM
4:31:00 PM
7:46:00 PM
11:01:00 PM
2:16:00 AM
5:31:00 AM
8:46:00 AM
12:01:00 PM
3:16:00 PM
6:31:00 PM
9:46:00 PM
South Zone Summer Temperature Profile
ZONE 1 SLAB TEMPERATURE ZONE 1 SPACE TEMPERATURE OUTSIDE AIR TEMPERATURE
Performance Thermal Comfort
0
10
20
30
40
50
60
70
80
90
100
12:03:00 AM
3:18:00 AM
6:33:00 AM
9:48:00 AM
1:03:00 PM
4:18:00 PM
7:33:00 PM
10:48:00 PM
2:03:00 AM
5:18:00 AM
8:33:00 AM
11:48:00 AM
3:03:00 PM
6:18:00 PM
9:33:00 PM
12:48:00 AM
4:03:00 AM
7:18:00 AM
10:33:00 AM
1:48:00 PM
5:03:00 PM
8:18:00 PM
11:33:00 PM
2:48:00 AM
6:03:00 AM
9:18:00 AM
12:33:00 PM
3:48:00 PM
7:03:00 PM
10:18:00 PM
1:34:00 AM
4:49:00 AM
8:04:00 AM
11:18:00 AM
2: 34:00 PM
5:49:00 PM
9:04:00 PM
12:19:00 AM
3:34:00 AM
6:49:00 AM
10:04:00 AM
1:19:00 PM
4:34:00 PM
7:49:00 PM
11:04:00 PM
2:19:00 AM
5:34:00 AM
8:49:00 AM
12:04:00 PM
3:19:00 PM
6:34:00 PM
9:49:00 PM
North Zone Shoulder Temperature Profile
ZONE 1 SLAB TEMPERATURE ZONE 1 SPACE TEMPERATURE OUTSIDE AIR TEMPERATURE
Performance Thermal Comfort

11/4/2015
51
0
10
20
30
40
50
60
70
80
90
100
12:02:00 AM
3:12:00 AM
6:22:00 AM
9:32:00 AM
12:42:00 PM
3:52:00 PM
7:02:00 PM
10:12:00 PM
1:22:00 AM
4:32:00 AM
7:42:00 AM
10:52:00 AM
2:02:00 PM
5:12:00 PM
8:22:00 PM
11:32:00 PM
2:42:00 AM
5:52:00 AM
9:02:00 AM
12:12:00 PM
3:22:00 PM
6:32:00 PM
9:42:00 PM
12:52:00 AM
4:02:00 AM
7:12:00 AM
10:22:00 AM
1:32:00 PM
4:42:00 PM
7:52:00 PM
11:02:00 PM
2:12:00 AM
5:22:00 AM
8:32:00 AM
11:42:00 AM
2:52:00 PM
6:02:00 PM
9:12:00 PM
12:22:00 AM
3:32:00 AM
6:42:00 AM
9:52:00 AM
1:02:00 PM
4:12:00 PM
7:22:00 PM
10:32:00 PM
1:42:00 AM
4:53:00 AM
8:03:00 AM
11:27:00 AM
2:37:00 PM
5:48:00 PM
8:58:00 PM
South Zone Shoulder Temperature Profile
ZONE 1 SLAB TEMPERATURE ZONE 1 SPACE TEMPERATURE OUTSIDE AIR TEMPERATURE
Performance Thermal Comfort
0
10
20
30
40
50
60
70
80
90
100
12:02:00 AM
3:17:00 AM
6:32:00 AM
9:47:00 AM
1:02:00 PM
4:17:00 PM
7:32:00 PM
10:47:00 PM
2:03:00 AM
5:18:00 AM
8:32:00 AM
11:47:00 AM
3:03:00 PM
6:18:00 PM
9:33:00 PM
12:48:00 AM
4:03:00 AM
7:18:00 AM
10:33:00 AM
1:48:00 PM
5:03:00 PM
8:18:00 PM
11:33:00 PM
2:48:00 AM
6:03:00 AM
9:18:00 AM
12:33:00 PM
3:48:00 PM
7:03:00 PM
10:18:00 PM
1:33:00 AM
4:48:00 AM
8:03:00 AM
11:18:00 AM
2: 33:00 PM
5:48:00 PM
9:03:00 PM
12:18:00 AM
3:33:00 AM
6:48:00 AM
10:03:00 AM
1:18:00 PM
4:33:00 PM
7:48:00 PM
11:03:00 PM
2:18:00 AM
5:33:00 AM
8:48:00 AM
12:03:00 PM
3:18:00 PM
6:33:00 PM
9:48:00 PM
North Zone Winter Temperature Profile
ZONE 1 SLAB TEMPERATURE ZONE 1 SPACE TEMPERATURE OUTSIDE AIR TEMPERATURE
Performance Thermal Comfort

11/4/2015
52
0
10
20
30
40
50
60
70
80
90
100
12:02:00 AM
3:17:00 AM
6:32:00 AM
9:47:00 AM
1:02:00 PM
4:17:00 PM
7:32:00 PM
10:47:00 PM
2:02:00 AM
5:17:00 AM
8:32:00 AM
11:47:00 AM
3:02:00 PM
6:17:00 PM
9:32:00 PM
12:47:00 AM
4:02:00 AM
7:17:00 AM
10:32:00 AM
1:47:00 PM
5:02:00 PM
8:17:00 PM
11:32:00 PM
2:47:00 AM
6:02:00 AM
9:17:00 AM
12:32:00 PM
3:47:00 PM
7:02:00 PM
10:18:00 PM
1:33:00 AM
4:48:00 AM
8:02:00 AM
11:18:00 AM
2: 33:00 PM
5:48:00 PM
9:03:00 PM
12:18:00 AM
3:33:00 AM
6:48:00 AM
10:03:00 AM
1:18:00 PM
4:33:00 PM
7:48:00 PM
11:03:00 PM
2:18:00 AM
5:33:00 AM
8:48:00 AM
12:03:00 PM
3:18:00 PM
6:33:00 PM
9:48:00 PM
South Zone Winter Temperature Profile
ZONE 1 SLAB TEMPERATURE ZONE 1 SPACE TEMPERATURE OUTSIDE AIR TEMPERATURE
Performance Thermal Comfort
Living in a Living BuildingBuilding Culture

11/4/2015
53
0%
20%
40%
60%
80%
100%Modes of Arrival to the 6th Floor by
Week
Trips viaElevator
Trips viaStair
May July Sept. Nov. Jan. Mar.
2013 …………………………………………………………………………………………… 2014 ………………
Research by: Heather Burpee, University of Washington Integrated Design Lab
11/4/2015
54
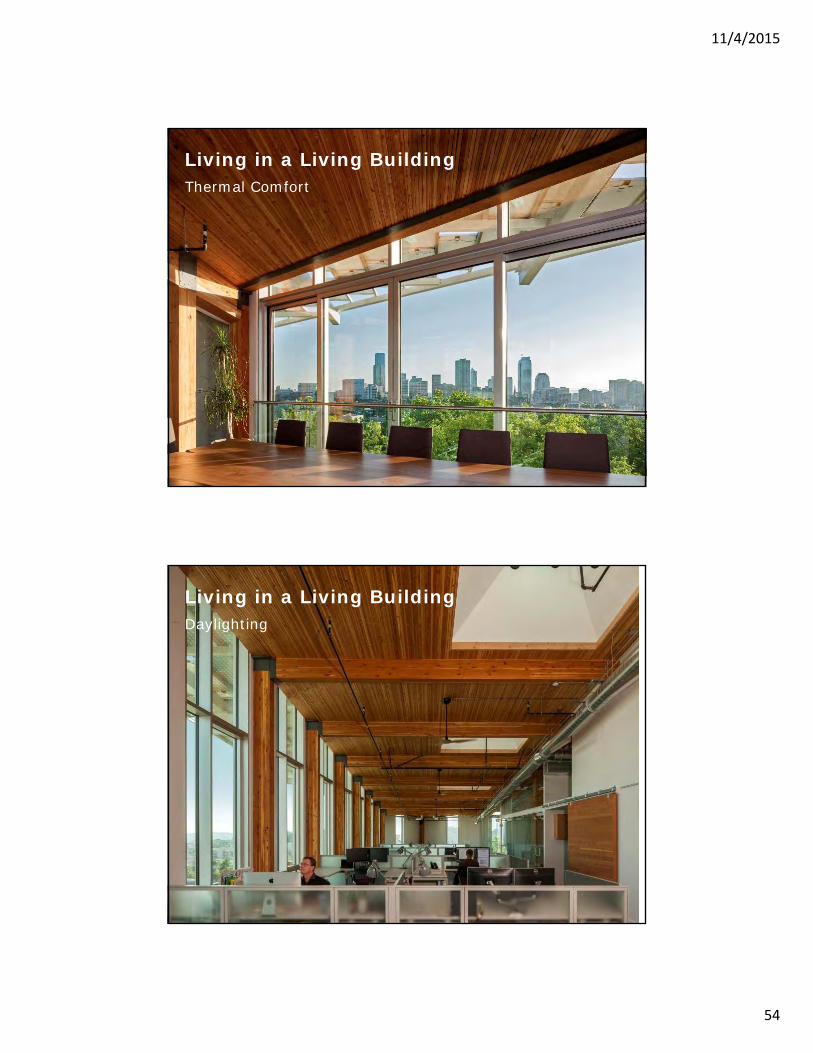
Living in a Living BuildingThermal Comfort
Living in a Living BuildingDaylighting

11/4/2015
55
Living in a Living BuildingIndoor Air Quality
Living in a Living BuildingThe Restroom Experience

11/4/2015
56
Grrrrrrrrr…
Living in a Living Building

11/4/2015
57
Composting Toilet SystemFirst Compost Removal
Composting Toilet SystemFirst Compost Removal
No odors, just dry compost

11/4/2015
58
Lessons Learned
Living in a Living BuildingTenant Buy-In

11/4/2015
59
Living in a Living BuildingIssues
Living In A Living BuildingSolutions

11/4/2015
60
Post Occupancy Adjustments
Building Operation
Ensuring energy performance
Metering challenges
3rd party option

11/4/2015
61
Tenant Budgets
-
5,000
10,000
15,000
20,000
25,000
150 100 250 200 300 400 500 600 650
kWh
/yr
Suite
7.2%
10.4%
4.6%
6.8%
17.8% 17.8% 17.7%
6.9%
10.8%
What Metering Tells UsM&V at PAE’s Portland Office

11/4/2015
62
What Metering Tells UsM&V at PAE’s Portland Office
What Metering Tells UsM&V at PAE’s Portland Office

11/4/2015
63
What Metering Tells UsM&V at PAE’s Portland Office
The Bullitt Center Gates Foundation HQ Stone 34
Financial ConsiderationsComparisons
52,000 sf
$32.5 M
$625/sf
Seattle, WALiving Building,
Net Zero
900,000 sf
$500 M
$556/sf
Seattle, WA
LEED Platinum
120,000 sf
$70.1 M
$584/sf
Seattle, WA
LEED Platinum

11/4/2015
64
Ruwan Jayaweera, PE, LEED [email protected]
What Would You Like to Know?
Interested in Sponsoring?
© 2015, New Buildings Institute
We are actively seeking sponsors for these sessions. Are you interested in promoting
your business while helping provide leading edge information on zero net energy?
Contact [email protected]

11/4/2015
65
Thank you for joining us!J. C
raig Vetner
Institute | LaJolla, CA
Photo: S
tephen Walker P
hotographyr
© 2015, New Buildings Institute
Slides will be available tomorrow on our website:newbuildings.org/demand-webinars
A survey will open as you exit the webinar, please help us make the best webinars possible by answering the survey. Your opportunity to enter your
AIA member number for credits is in the survey.