Embed Size (px)
Citation preview

Zhangxi LinISQS 7342-001Texas Tech University
Note: Most slides are from Decision Tree Modeling by SAS
Lecture Notes 5Auxiliary Uses of Trees

2
Chapter 4: Auxiliary Uses of Trees
4.1 Auxiliary Uses of Trees
4.2 Selecting Important Inputs
4.3 Collapsing Levels
4.4 Auxiliary Uses of Trees
4.5 Interactive Training

3
Auxiliary Uses of Trees
Data exploration Selecting important inputs Collapsing levels Discretizing interval inputs Interaction detection Regression imputation

4
Chapter 4: Auxiliary Uses of Trees
4.1 Auxiliary Uses of Trees
4.2 Selecting Important Inputs
4.3 Collapsing Levels
4.4 Auxiliary Uses of Trees
4.5 Interactive Training

5
Data Exploration Initial data analysis (IDA) helps getting a preliminary impression
of the predictive power of the data. Decision trees are well suited for exploratory data analysis It is
often useful to build several tree varieties using different settings. Trees are used as auxiliary tools in building more familiar models
such as logistic regression. Standard regression models are constrained to be linear and
additive (on the link scale). They require more data preparation steps such as missing value imputation and dummy-coding nominal variables. Their statistical and computational efficiency can be badly affected by the presence of many irrelevant and redundant input variables.

6
IDA/EDA
Interpretability
No strict assumptions concerning the functional form of the model
Resistant to the curse of dimensionality
Robust to outliers in the input space
No need to create dummy variables for nominal inputs
Missing values do not need to be imputed
Computationally fast (usually)
7
Modifying the Input Space – the Use of Tree
Dimension Reduction Input subset selection Collapsing levels of nominal inputs
Dimension Enhancement Discretizing interval inputs Stratified modeling

8
Input Selection
Inputs
Input Subset
Tree
Neural

9
Chapter 4: Auxiliary Uses of Trees
4.1 Auxiliary Uses of Trees
4.2 Selecting Important Inputs
4.3 Collapsing Levels
4.4 Auxiliary Uses of Trees
4.5 Interactive Training

10
Demonstration
• Data Set: INSURANCE
• Parameters • Partition: 70%, 30%• Decision Tree (2): # of Surrogate = 1
• Purposes• Observe the effect of surrogate split on the output
variables

11
The Diagram

12
Explore the variable selection feature
In the partial output, only those inputs with Training Importance values greater than 0.05 will be set to Input in the subsequent Neural Network node.
The Nodes column indicates the number of times a variable was used to split a node.
In the partial output above, only those inputs with Training Importance values greater than 0.05 willbe set to Input in the subsequent Neural Network node. The Nodes column indicates the number oftimes a variable was used to split a node.

13
The Output Variables without Using Surrogate Split

14
Variable Importance table with # Surrogate Rules = 1
The number of selected inputs is now 15. The Surrogates column indicates the number of timesthat a variable was used as a surrogate. Notice that Money Market Balance is the fifth mostimportant variable in the tree model, yet it is never used as a primary splitter (NODES=0).

15
The Output Variables by Using Surrogate Split

16
Maximum depth =10, # of surrogate rules = 0
In this example, the depth increase resulted in one additional (11) inputs.

17
Splitting criterion = GiniAssessment Measure = Average Square Error
Compared to 11 inputs selected by the classification tree, the class probability tree selects 23.
The variable Credit Score will be rejected because it has a training importance value less than 0.05.

18
Collapsing Levels
x
a b x
fx
c d e
x
a b d ec f
one inputone level deepmultiway split one input

19
Collapsing Levels
Nominal inputs can be included in regression models by using binary indicators (dummy variables) for each level. This practice can cause a disastrous increase in dimension when the nominal inputs have many levels (for example, zip codes).
Trees are effective tools for collapsing levels of nominal inputs. If a tree is fitted using only a single nominal input, the leaves represent subsets of the levels. Any type of tree will suffice, but a depth-one tree with a multiway split is easier to interpret visually.
Collapsing levels based on subject-matter considerations is usually better than any data-driven approach. However, there are many situations where the knowledge about potentially important inputs is lacking.

20
Chapter 4: Auxiliary Uses of Trees
4.1 Auxiliary Uses of Trees
4.2 Selecting Important Inputs
4.3 Collapsing Levels
4.4 Auxiliary Uses of Trees
4.5 Interactive Training

21
Collapsing Levels
A Decision Tree is used to convert the nominal variable with too many values into a few groups of values. Choose the right variable and deselect others Depth = 1 Allow multiway split No post-pruning
Use the group as a new input to replace the original input for the next classification node, such as Neural Network, or Regression Set the original variable “Don’t use” Set the new variable as “Use”

22
Demonstration
• Data Set: INSURANCE• Parameters
– Set use of all input variables except BRANCH to No– Maximum number of branches from a node = the number of bank
branch levels (19).– Set the maximum depth to 1.– Use a large p-value. Set the significance level to 1.0.– Bonferonni Adjustment = No– SubTree Method = Largest– Output Variable Selection = No and Leaf Role = Input.
Purposes• How trees are applied for the collapsed categorical variables

23
Diagram and Results
Decision Tree (2) generates four branches. Make sure variable Branch will be rejected for the Regression node. The dummy variable _NODE_ will be used.

24
Tree Application - Discretizing Interval Inputs
Y
X X
Dimension Inflation
6 df

25
Interaction Detection
6 9
1 8x
2 2x 10 52 2x
12 2
1 8x
2 5x 10 52 2x
obviousinteraction
subtleinteraction

26
Interaction Detection
Trees do not produce anything as simple as an ANOVA table. It is usually quite difficult to determine the strengths of interactions just by looking at a tree diagram.
Trees might be better described as automatic interaction accommodators. Crossover (qualitative) interactions (effect reversals) are
somewhat easier to detect by scanning splits on the same input in different regions of the tree.
Magnitude (quantitative) interactions can be considerably more difficult to detect.

27
Regression Imputation
x1
8.6?
6.33.81.44.65.5?
1.76.85.8
x2
144322?
196326?
822330
x3
?1.42.7?
1.11.02.3?
2.81.81.2
1
2 3( , )
y x
x x
x
2
1 3( , )
y x
x x
x
3
1 2( , )
y x
x x
x

28
Chapter 4: Auxiliary Uses of Trees
4.1 Auxiliary Uses of Trees
4.2 Selecting Important Inputs
4.3 Collapsing Levels
4.4 Auxiliary Uses of Trees
4.5 Interactive Training

29
Demonstration
• Data Sets: INSURANCE, CUSTOMERS
• Purposes:• Explore auxiliary uses of trees
• Imputation• Variable selection• Collapsed levels

30
Diagram

31
Model configuration

32
Results from the Variable Selection Tree Node
a. Configure the variable selection Tree node to fit a Class Probability-like tree (Splitting RuleCriterion – Gini, Maximum Depth - 8, Subtree Assessment Measure – Average Square Error).b. Run the Tree node and view the Variable Importance list in the Tree Results Output window or inthe Variables window in the Interactive Tree Desktop Application view.
Seventeen inputs are selected by the tree.

33
Chapter 4: Auxiliary Uses of Trees
4.1 Auxiliary Uses of Trees
4.2 Selecting Important Inputs
4.3 Collapsing Levels
4.4 Auxiliary Uses of Trees
4.5 Interactive Training

34
Interactive Training
Force and Remove Inputs Define Split Values Manually Prune branches
and leaves
Demonstration: INSURANCE

35
Diagram

36
Manual Split Input Selection
37
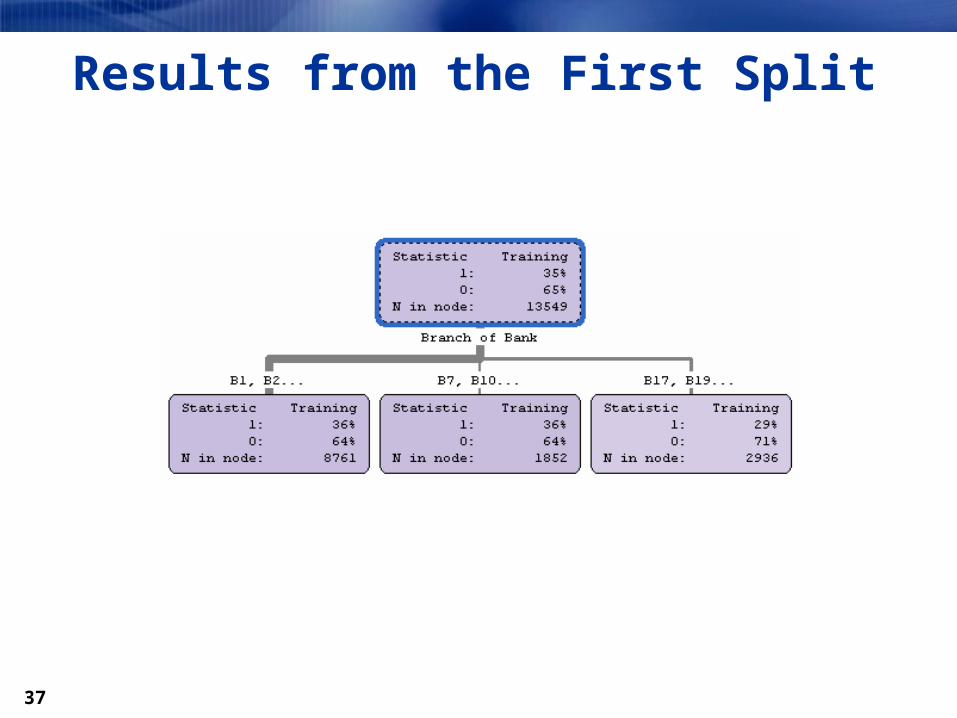
Results from the First Split

38
The Outcome of the Second Level Split

39
Interactive Tree Training
Manual Pruning

40
Assessment Plot