Embed Size (px)
Citation preview

Zignago Vetro Group
Company Overview
March 2015

2
Zignago Holding Group Structure
65%
Santa Margherita S.p.A.
Wine producer
35%
100%
100%
Real estate
Zignago Power S.r.l.
Electricity producer
100%
Verreries Brosse
54,3 mln Euro
Vetri Speciali
139,3 mln Euro (*)
100% 50% 30%
Vetreco
9,1 mln Euro (*)
2014 figures
(*) figures referred to 100%
Zignago Holding S.p.A.
(MARZOTTO FAMILY)
Huta Szkla Czechy
19,8 mln Euro
Zignago Vetro SpA
161,7 mln Euro
100%
Zignago Immobiliare S.r.l.
FREE FLOAT on the
ITALIAN STOCK EXCHANGE(since 2007)
The only listed glass manufacturer in Italy

3
A proven track record of successful acquisitions in and outside Italy across different Glass sectors
Milestones
1979
2007 2011
Portogruaro plant: F&B + C&P
2002
Acquisition of Empoli plant: F&B
2013
1987
2004
Establishment of Vetreco: Cullet recycling
Acquisition of Specialty containers production plan ts, then merged into Vetri Speciali
1994 1995
Acquisition of VB in France: Luxury Perfumery
Listing on the Italian Stock Exchange
Acquisition of HSC in Poland: C&P and F&B

4
Competitive StrengthsMain FeaturesProducts2014 (€m)
Presence in Selected Business Segments
� Personalization
� Small-run production
Vetri SpecialiSales €69.6m (50%)
Highly customized specialty glass containers produced in very short
runs with strong focus on efficiency
� Innovation
� QualityVerreries BrosseSales €54.3m
Extraordinary high-quality, tailor-made product offering and
efficiency
Focus on high-end perfumery market
� Flexibility
Flexibility, efficiency and technical know-how key for
success
� Quality
Food & Beverage
Cosmetics & Perfumery
Luxury
Perfumery
Market Segment
� Personalization
� Small-run production
Huta Szkła CzechySales €19.8m
Wide range of personalised products for niches of the global
market of glass containers for cosmetics and perfumery, and for
food and beverages
Specialty Containers
Food & Beverage
Cosmetics & Perf.
Zignago Vetro Sales €161.7m
VetrecoSales €2.7m (30%)
Cullet Recycling
� Located in a strategic area with strong potential to grow
Forefront technology to reprocess cullet to the highest standards of color separation to yield the best
quality of finished cullet
Focus on selected segments of food & beverage and cosmetics & perfumery
5
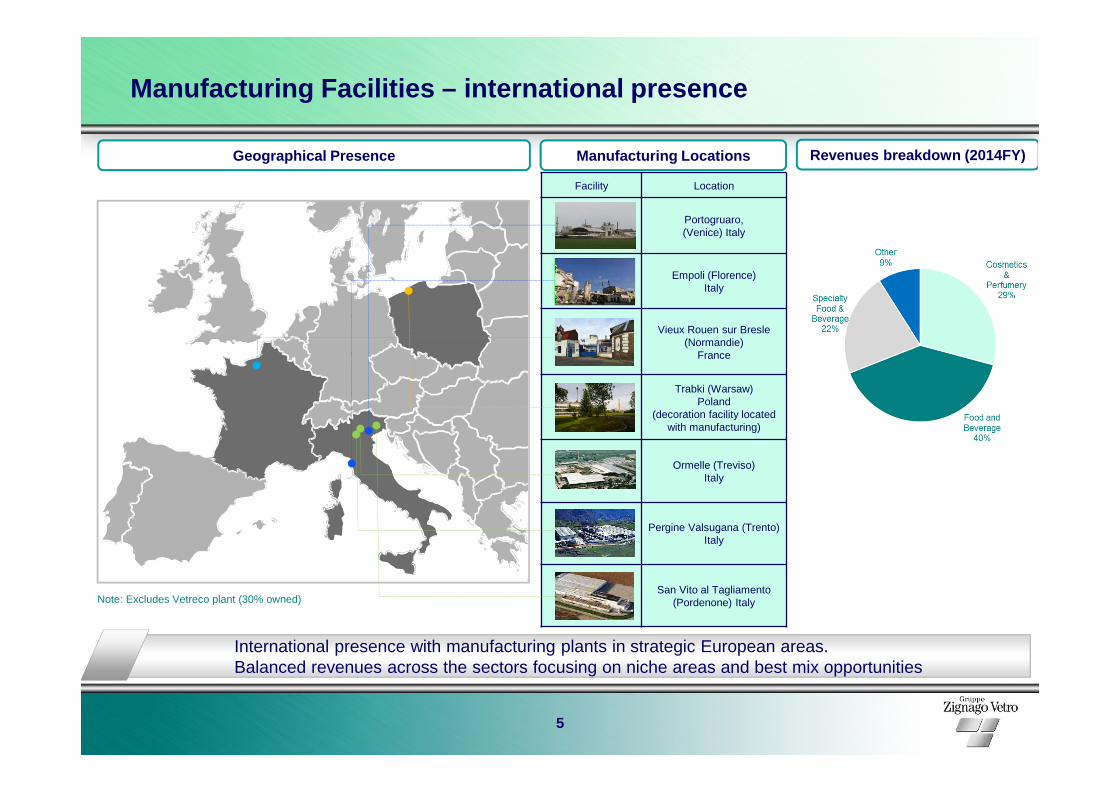
Manufacturing Facilities – international presence
Manufacturing LocationsGeographical Presence
Facility Location
Portogruaro,(Venice) Italy
Empoli (Florence)Italy
Vieux Rouen sur Bresle(Normandie)
France
Trabki (Warsaw)Poland
(decoration facility located with manufacturing)
Ormelle (Treviso)Italy
Pergine Valsugana (Trento) Italy
San Vito al Tagliamento(Pordenone) ItalyNote: Excludes Vetreco plant (30% owned)
Revenues breakdown (2014FY)
International presence with manufacturing plants in strategic European areas. Balanced revenues across the sectors focusing on niche areas and best mix opportunities

6
95%22%Vetri Speciali
98%45%Verreries Brosse
88%18%Zignago Vetro
Customer loyalty 1
(Revenues )
Concentration rate of first 5 clients 2
Business model and Client Relationships
1 Revenues from clients present also the 2 previous years (dat a referred to 2014)
2 Net of intercompany sales
HSC 27% 86%

7
33,8 34,9 30,9 26,1 23,8
12,8%12,0%
10,3%8,9%
7,9%
0,05,0
10,015,020,025,030,035,040,0
2010 2011 2012 2013 20140%
2%
4%
6%
8%
10%
12%
Net Results (€m) Margin (%)
Financial Performance
Revenues (€m) EBITDA (€m)
EBIT (€m) Net Result (€m)
70,7 76,9 70,6 67,0 65,8
26,7%
21,8%26,4%
22,9%23,6%
20
30
40
50
60
70
80
2010 2011 2012 2013 20140%
5%
10%
15%
20%
25%
EBITDA (€m) Margin (%)
47,7 52,245,0 40,6 36,9
18,0% 17,9%
15,1%13,9%
12,2%
05
101520253035404550
2010 2011 2012 2013 20140%
5%
10%
15%
EBIT (€m) Margin (%)
298,8 292,3302,0
264,9 291,2
0
50
100
150
200
250
300
2010 2011 2012 2013 2014
+3.3%+10.0% -2.2%+2.6%

8
Zignago Vetro Group: Sales and Profitability Track Record
40,449,3
62,1
89,5 94,9
132,7
192,6
256,7
291,2301,9
10,5 11,1 10,5
27,3 23,733,4
49,9
69,976,9
65,9
0
50
100
150
200
250
300
350
1988 1989 1990 1991 1992 1993 1994 1995 1996 1997 1998 1999 2000 2001 2002 2003 2004 2005 2006 2007 2008 2009 2010 2011 2012 2013 2014
Sales EBITDA
Sales and EBITDA (1988-2014)
Euro (m)
CAGR: +7,3%
CAGR: +8,0%
Profitable growth with record revenues in 2014 driven by both inorganic and organic expansion

9
Solid Balance Sheet to Support Organic and External Growth
183,5 196,6 216,9 235,4 241,5
0
50
100
150
200
250
2010 2011 2012 2013 2014
Net Capital Employed (€m) Net Working Capital (€m)
Net Equity (€m)
42,3 50,464,7 64,7
76,060,5
16,0%
21,7% 21,7%
26,0%
20,0%17,3%
01020304050607080
2010 2011 2012 2012 2013 20140%
4%
8%
12%16%
20%
24%
28%
Net working Capital (€m) on sales (%)
Net Financial Debt (€m)
108,1 118,3 125,5 129,6 133,8
0
20
40
60
80
100
120
140
2010 2011 2012 2013 2014
75,5 75,591,4
105,8 107,7
0
20
40
60
80
100
120
2010 2011 2012 2013 2014

10
Cash Flow from Operations (before capex) (€m)
Cash Flow From Operations and Capex
Capex (€m)
Net Capex related to VS acquisition
62,354,7
41,3
67,0
39,9
0,0
5,0
10,0
15,0
20,0
25,0
30,0
35,0
40,0
45,0
50,0
55,0
60,0
65,0
70,0
2010 2011 2012 2013 2014
36,0
22,4
30,7 32,3
49,37,6
2,7
0
5
10
15
20
25
30
35
40
45
50
2010 2011 2012 2013 2014
HSC acquisition* of which 13,8 mln for debts to suppliers of capex at y ear end
*
Capex mainly depends on furnaces refurbishment and capacity increase

11
Financial structure, EPS and dividends
EPS and Dividend distribution (Euro)Key financial structure ratios
0,70,9
1,3
1,11,0
1,3
1,61,6
0,60,7
0,9
0,70,6
0,70,8 0,8
0,4
0,6
0,8
1,0
1,2
1,4
1,6
2007 2008 2009 2010 2011 2012 2013 2014
Net financial debt / EBITDA
Net financial debt / Net Equity
(1) 2015 Board of Directors’ proposal
EPS: since 2012 calculated on 88 mln shares (after a scrip issue of 10%)
0,31
0,420,35
0,42 0,440,35
0,30 0,27
0,220,30
0,24 0,30 0,310,25 0,22
0,20(1)
70% 70% 70% 71% 71% 71% 74% 74%(1)
30%
40%
50%
60%
70%
0,00
0,20
0,40
0,60
2007 2008 2009 2010 2011 2012 2013 2014
EPS Div per share Pay out %
Pay out guidance: 70% of net group result