Embed Size (px)
Citation preview

8/8/2019 Zignals: Building a Trading Strategy
http://slidepdf.com/reader/full/zignals-building-a-trading-strategy 1/19
Part I: Building a Trading Strategy in Zignals
For this article I am working with the Zignals MarketPortal which gives full access to
all of our services (trading system, stock alerts, stock charts, stock screener,
watchlist and portfolio manager) in a single application. The key advantage to the
MarketPortal over stand-alone applications is the seamless switching between
applications and is recommended for users wishing to publish their own trading
strategies.
The first strategy will be built around a price cross above a 20-day Simple Moving
Average (SMA). This will be a long only strategy.
On loading the Trading System interface you will be greeted with a grid-interface;
along the top is a set of menu options and on the left is a series of steps, numbered
1 to 5, which are required to create a strategy.
8/8/2019 Zignals: Building a Trading Strategy
http://slidepdf.com/reader/full/zignals-building-a-trading-strategy 2/19
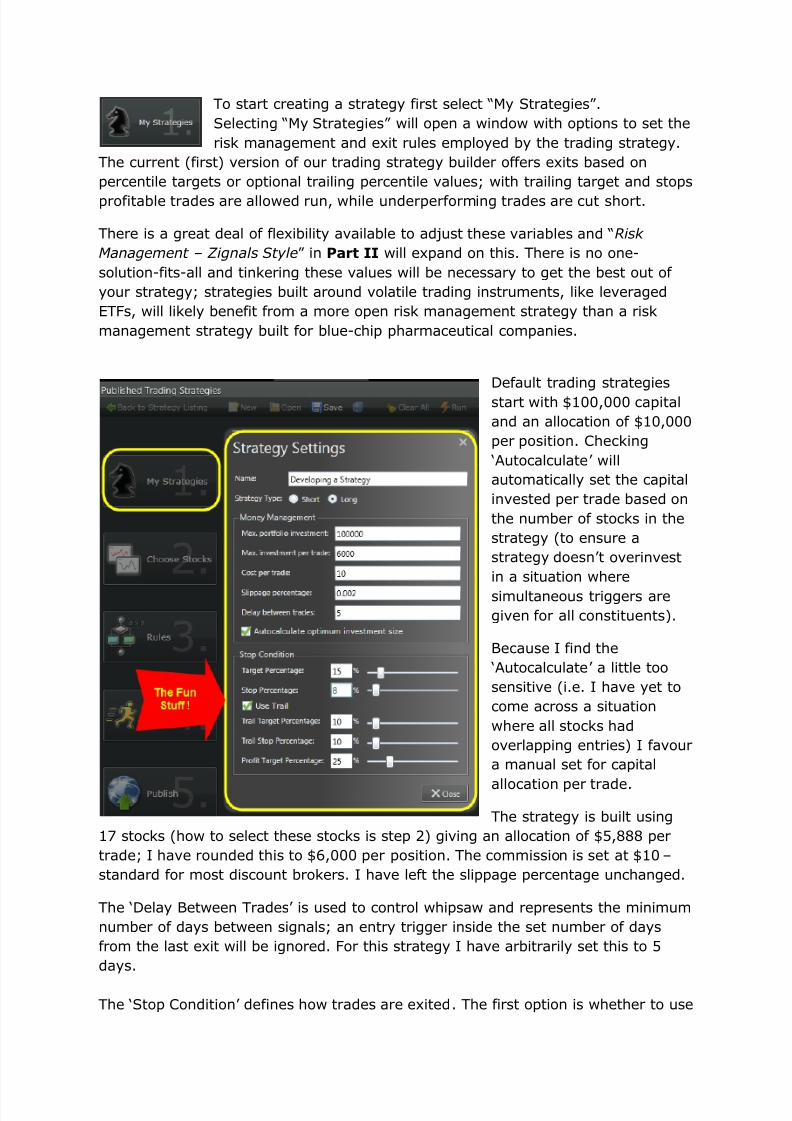
To start creating a strategy first select “My Strategies” .
Selecting “My Strategies” will open a window with options to set the
risk management and exit rules employed by the trading strategy.
The current (first) version of our trading strategy builder offers exits based on
percentile targets or optional trailing percentile values; with trailing target and stops
profitable trades are allowed run, while underperforming trades are cut short.
There is a great deal of flexibility available to adjust these variables and “Risk
Management – Zignals Style” in Part II will expand on this. There is no one-
solution-fits-all and tinkering these values will be necessary to get the best out of
your strategy; strategies built around volatile trading instruments, like leveraged
ETFs, will likely benefit from a more open risk management strategy than a risk
management strategy built for blue-chip pharmaceutical companies.
Default trading strategies
start with $100,000 capital
and an allocation of $10,000
per position. Checking
„Autocalculate‟ will
automatically set the capital
invested per trade based on
the number of stocks in the
strategy (to ensure a
strategy doesn‟t overinvest
in a situation where
simultaneous triggers are
given for all constituents).
Because I find the
„Autocalculate‟ a little too
sensitive (i.e. I have yet to
come across a situation
where all stocks had
overlapping entries) I favour
a manual set for capital
allocation per trade.
The strategy is built using
17 stocks (how to select these stocks is step 2) giving an allocation of $5,888 per
trade; I have rounded this to $6,000 per position. The commission is set at $10 –
standard for most discount brokers. I have left the slippage percentage unchanged.
The „Delay Between Trades‟ is used to control whipsaw and represents the minimum
number of days between signals; an entry trigger inside the set number of days
from the last exit will be ignored. For this strategy I have arbitrarily set this to 5
days.
The „Stop Condition‟ defines how trades are exited. The first option is whether to use
8/8/2019 Zignals: Building a Trading Strategy
http://slidepdf.com/reader/full/zignals-building-a-trading-strategy 3/19
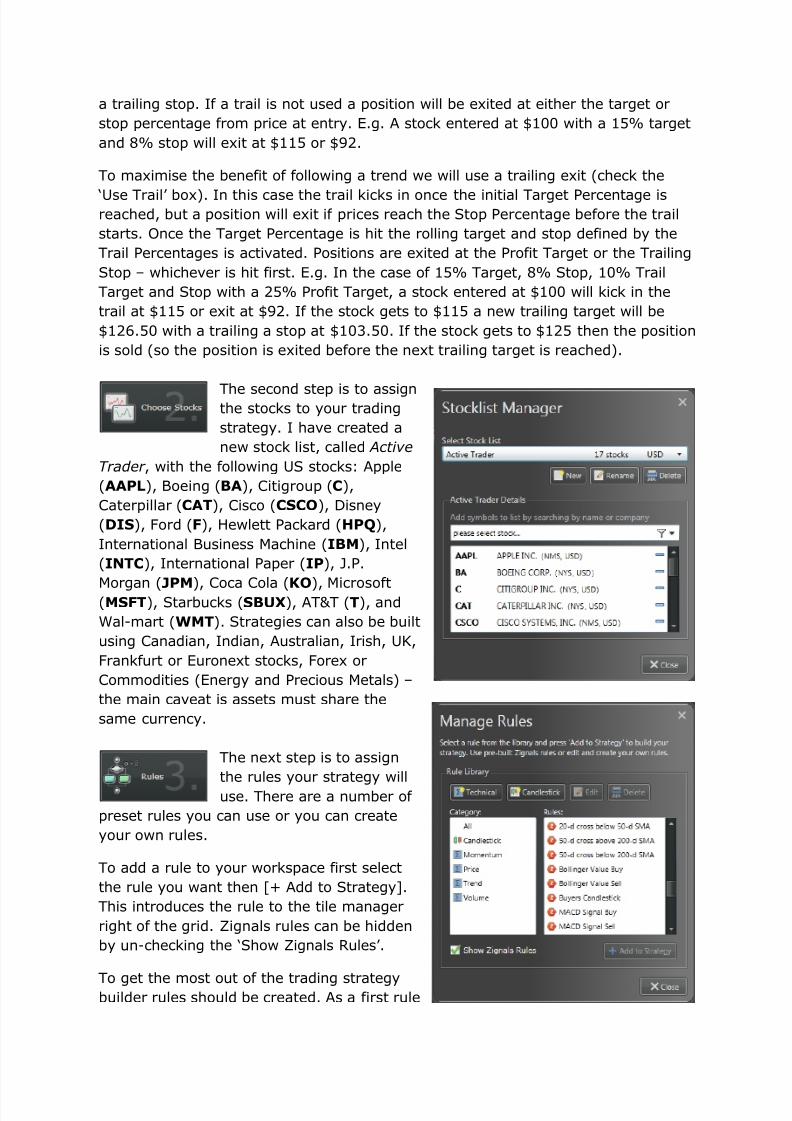
a trailing stop. If a trail is not used a position will be exited at either the target or
stop percentage from price at entry. E.g. A stock entered at $100 with a 15% target
and 8% stop will exit at $115 or $92.
To maximise the benefit of following a trend we will use a trailing exit (check the
„Use Trail‟ box). In this case the trail kicks in once the initial Target Percentage isreached, but a position will exit if prices reach the Stop Percentage before the trail
starts. Once the Target Percentage is hit the rolling target and stop defined by the
Trail Percentages is activated. Positions are exited at the Profit Target or the Trailing
Stop – whichever is hit first. E.g. In the case of 15% Target, 8% Stop, 10% Trail
Target and Stop with a 25% Profit Target, a stock entered at $100 will kick in the
trail at $115 or exit at $92. If the stock gets to $115 a new trailing target will be
$126.50 with a trailing a stop at $103.50. If the stock gets to $125 then the position
is sold (so the position is exited before the next trailing target is reached).
The second step is to assignthe stocks to your trading
strategy. I have created a
new stock list, called Active
Trader , with the following US stocks: Apple
(AAPL), Boeing (BA), Citigroup (C),
Caterpillar (CAT), Cisco (CSCO), Disney
(DIS), Ford (F), Hewlett Packard (HPQ),
International Business Machine (IBM), Intel
(INTC), International Paper (IP), J.P.
Morgan (JPM), Coca Cola (KO), Microsoft(MSFT), Starbucks (SBUX), AT&T (T), and
Wal-mart (WMT). Strategies can also be built
using Canadian, Indian, Australian, Irish, UK,
Frankfurt or Euronext stocks, Forex or
Commodities (Energy and Precious Metals) –
the main caveat is assets must share the
same currency.
The next step is to assign
the rules your strategy will
use. There are a number of
preset rules you can use or you can create
your own rules.
To add a rule to your workspace first select
the rule you want then [+ Add to Strategy].
This introduces the rule to the tile manager
right of the grid. Zignals rules can be hidden
by un-checking the „Show Zignals Rules‟.
To get the most out of the trading strategybuilder rules should be created. As a first rule
8/8/2019 Zignals: Building a Trading Strategy
http://slidepdf.com/reader/full/zignals-building-a-trading-strategy 4/19
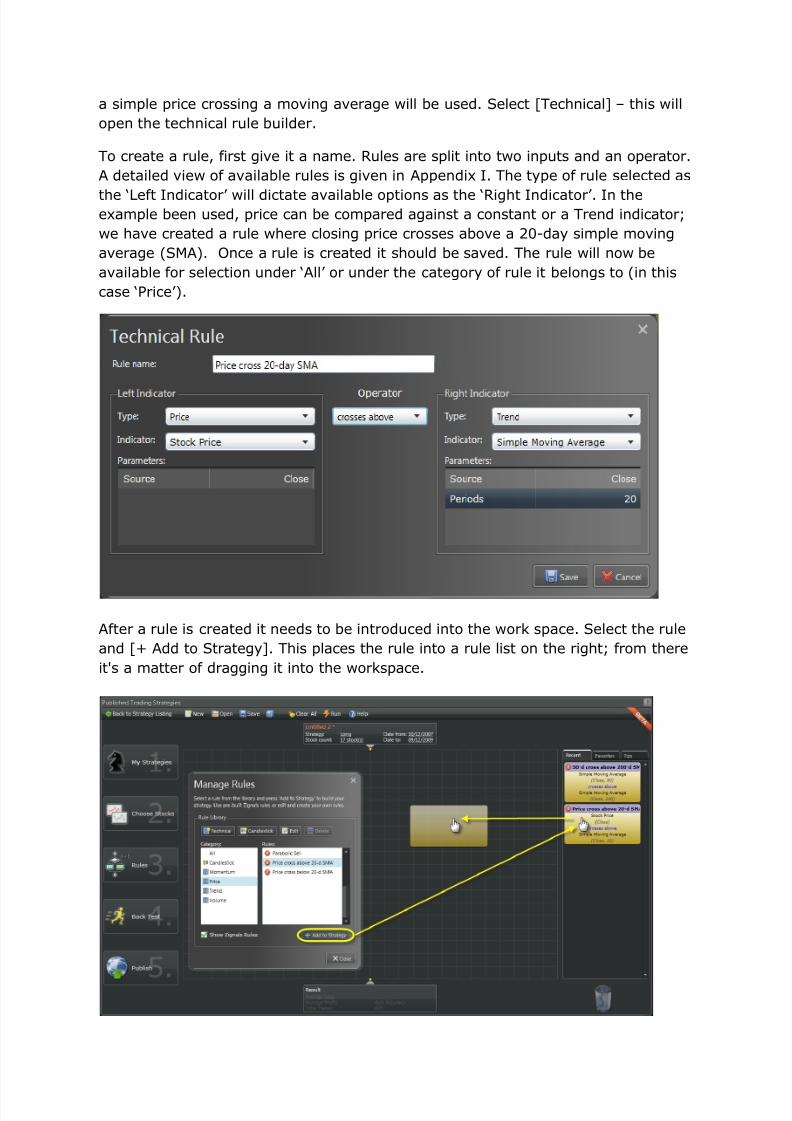
a simple price crossing a moving average will be used. Select [Technical] – this will
open the technical rule builder.
To create a rule, first give it a name. Rules are split into two inputs and an operator.
A detailed view of available rules is given in Appendix I. The type of rule selected as
the „Left Indicator‟ will dictate available options as the „Right Indicator‟. In theexample been used, price can be compared against a constant or a Trend indicator;
we have created a rule where closing price crosses above a 20-day simple moving
average (SMA). Once a rule is created it should be saved. The rule will now be
available for selection under „All‟ or under the category of rule it belongs to (in this
case „Price‟).
After a rule is created it needs to be introduced into the work space. Select the rule
and [+ Add to Strategy]. This places the rule into a rule list on the right; from there
it's a matter of dragging it into the workspace.

8/8/2019 Zignals: Building a Trading Strategy
http://slidepdf.com/reader/full/zignals-building-a-trading-strategy 5/19
The first rule dragged-in will automatically connect to the starting point. Other rules
you drag-in can either be connected to existing rules, or by dragging the top box
down to the new rule, connect to the dragged-in rule (see below).
Multiple rule paths are possible (see below); the key thing is to ensure rules are
connected from top to bottom. With multiple rule paths only one signal is supported
i.e. trades in a given stock are only entered once – there is no doubling, trebling etc.
of positions.

8/8/2019 Zignals: Building a Trading Strategy
http://slidepdf.com/reader/full/zignals-building-a-trading-strategy 6/19
The final step is to connect the price-cross-SMA rule
to the end-point to complete the rule flow.
Once you are happy with your strategy it should
then be saved.
Step 4 defines the back-test period.
The default period is the past 2-
years from the previous day, but the
back-test period can be run for any period back to
2001 (for US stocks).
When a back test is run an historical portfolio is
created displaying all the trades over the test
period. The portfolio can be given a name (or the
default name will be used – usually „Untitled x ‟ ) and
will be listed in the drop-down menu of the Portfolio
Manager application. The option to view the
portfolio is offered at the end of the back test run.
After viewing a back-test portfolio two options are available:
[1] The strategy rules can be further edited, with updated portfolios produced OR
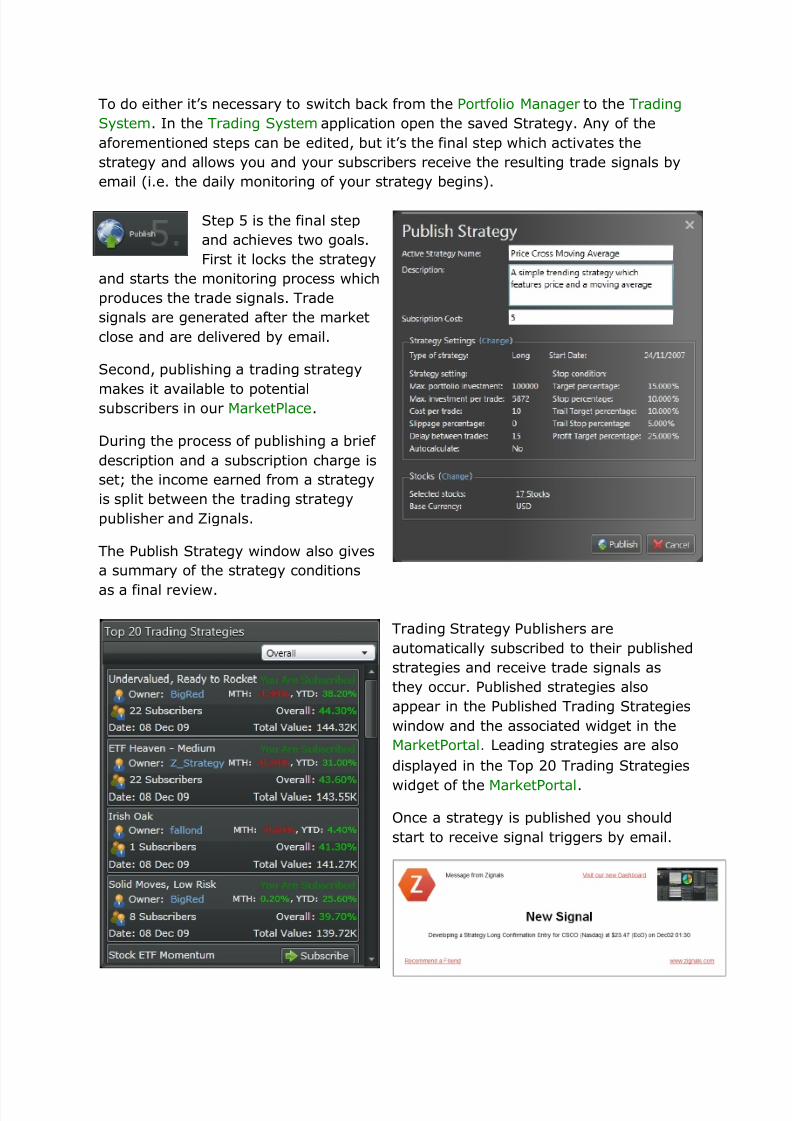
[2] The strategy can be Published so that the trading signals can be received
by email.
8/8/2019 Zignals: Building a Trading Strategy
http://slidepdf.com/reader/full/zignals-building-a-trading-strategy 7/19

8/8/2019 Zignals: Building a Trading Strategy
http://slidepdf.com/reader/full/zignals-building-a-trading-strategy 8/19

8/8/2019 Zignals: Building a Trading Strategy
http://slidepdf.com/reader/full/zignals-building-a-trading-strategy 9/19
Trailing Target is hit the Trailing Stop is updated. If at any point the Trailing Stop is
hit then the position is exited. The Trailing Target continues until the Profit Target is
hit. Once a Profit Target is hit the position is exited.
The strategy was based on a long entry following a price cross above a stock‟s 20-
day SMA.
For the back-test period the dates 24th Nov 2007 to 23rd Nov 2009 were used.
What were the returns based on default ‘Stop Condition’ settings?
Target Percentage: 15%
Stop Percentage: 10%
Trail Used: Yes
Trail Target Percentage: 10%
Trail Stop Percentage: 10%
Profit Target Percentage: 25%
No. of Trades: 142
Profitable Trades: 47%
Net Profit: 17%
What happened when ‘Stop Conditions’ were changed?
The adjustment to the initial „Stop Percentage‟ generated the following returns:
The relatively close-to-market Beta of our component stocks allowed for a relatively
strong return with a tight stop of 4%, even though there was a sharp drop in the
percentage of winning trades.
Taking the 6% stop as a fixed point and adjusting the „Target Percentage‟ (the price
at which the Trailing prices kicked in) brought an improvement in the percentage of
profitable trades. Dropping the Target price from 15% to 10% increased the
percentage of profitable trades to a morale boosting 57% with an additional kick on
the resulting percentage profit.
8/8/2019 Zignals: Building a Trading Strategy
http://slidepdf.com/reader/full/zignals-building-a-trading-strategy 10/19
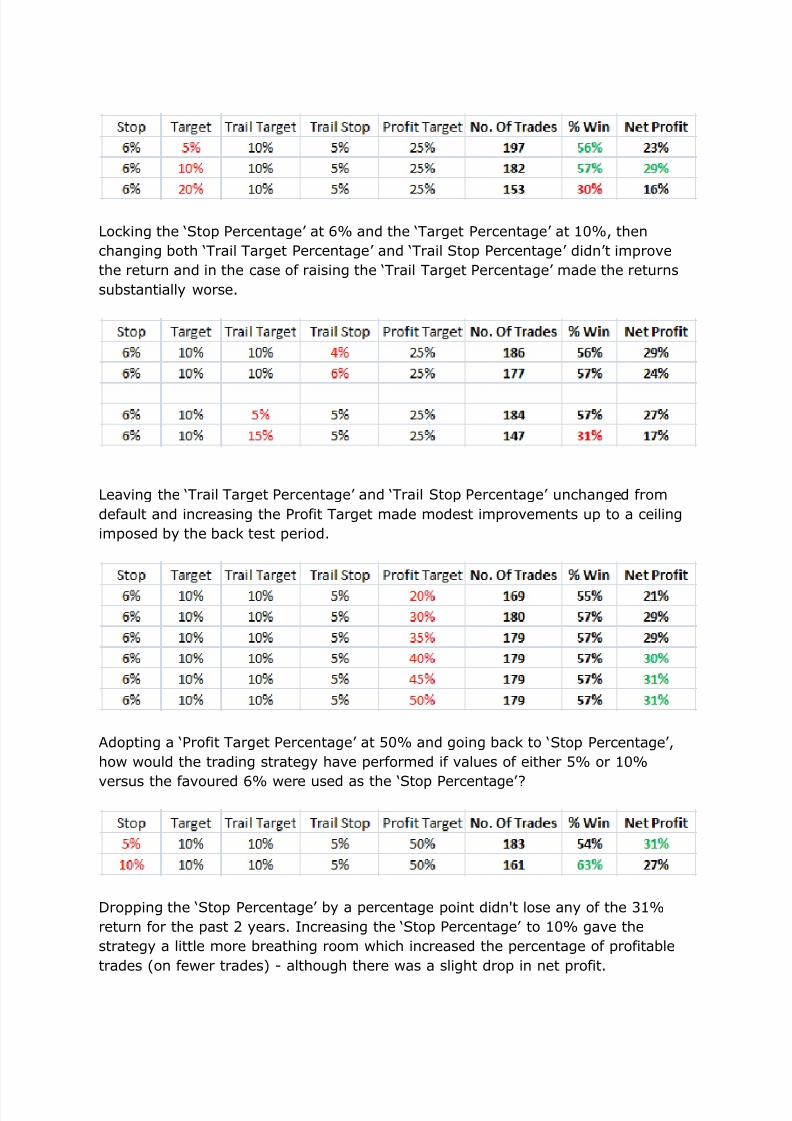
Locking the „Stop Percentage‟ at 6% and the „Target Percentage‟ at 10%, then
changing both „Trail Target Percentage‟ and „Trail Stop Percentage‟ didn‟t improve
the return and in the case of raising the „Trail Target Percentage‟ made the returns
substantially worse.
Leaving the „Trail Target Percentage‟ and „Trail Stop Percentage‟ unchanged from
default and increasing the Profit Target made modest improvements up to a ceiling
imposed by the back test period.
Adopting a „Profit Target Percentage‟ at 50% and going back to „Stop Percentage‟ ,
how would the trading strategy have performed if values of either 5% or 10%
versus the favoured 6% were used as the „Stop Percentage‟ ?
Dropping the „Stop Percentage‟ by a percentage point didn't lose any of the 31%
return for the past 2 years. Increasing the „Stop Percentage‟ to 10% gave the
strategy a little more breathing room which increased the percentage of profitable
trades (on fewer trades) - although there was a slight drop in net profit.

8/8/2019 Zignals: Building a Trading Strategy
http://slidepdf.com/reader/full/zignals-building-a-trading-strategy 11/19
For the purposes of building a new strategy the following settings are a good
starting point.
Stop Percentage: 10%
Target Percentage: 10%
Use Trail: Yes
Trail Target Percentage: 10%
Trail Stop Percentage: 5%
Profit Target Percentage: 25% (or 50%?)
For the simple one-rule strategy used on a core set of relatively price stable US
stocks, the largest impact on net profit and percentage of winning trades came from
adjustments in the initial „Target Percentage‟ and „Stop Percentage‟ values versus
changes in the values of „Trail Target Percentage‟ and „Trail Stop Percentage‟ .
However, trading strategies built around different assets and rule types will responddifferently to the risk management plan outlined here. For example, it‟s unlikely a
trading strategy built on x2 or x3 leveraged index ETFs will give as strong returns
with a 5% stop percentage as they might with a 10% stop percentage. Only by
testing different exit strategies is it possible to get the best out of your developed
trading strategies.
8/8/2019 Zignals: Building a Trading Strategy
http://slidepdf.com/reader/full/zignals-building-a-trading-strategy 12/19
Part III: Modifying and Testing Indicators
For new or existing users of our Trading System builder the time will come to modify
or create new technical rules with the objective of finding the most profitable
combination of rules for the core group of stocks on which a strategy is based. How
can this be achieved?
In line with the initial How to Build a Trading Strategy article we will call the new
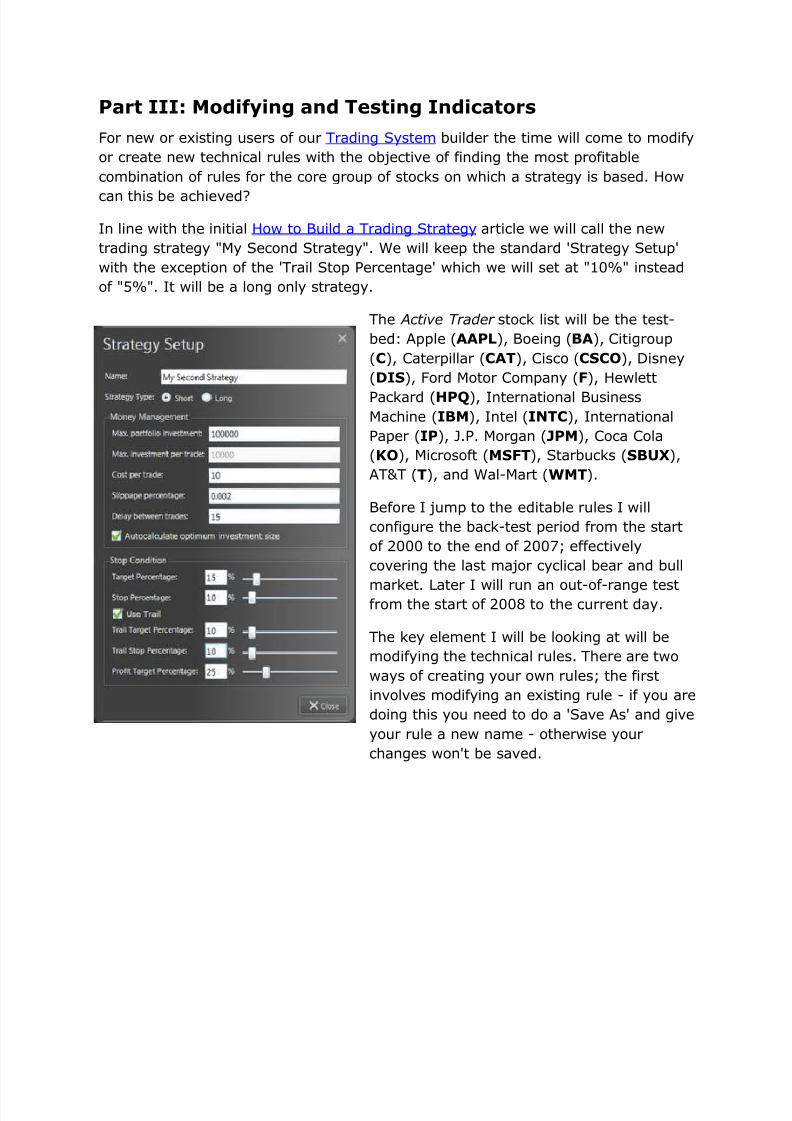
trading strategy "My Second Strategy". We will keep the standard 'Strategy Setup'
with the exception of the 'Trail Stop Percentage' which we will set at "10%" instead
of "5%". It will be a long only strategy.
The Active Trader stock list will be the test-
bed: Apple (AAPL), Boeing (BA), Citigroup
(C), Caterpillar (CAT), Cisco (CSCO), Disney
(DIS), Ford Motor Company (F), Hewlett
Packard (HPQ), International Business
Machine (IBM), Intel (INTC), International
Paper (IP), J.P. Morgan (JPM), Coca Cola
(KO), Microsoft (MSFT), Starbucks (SBUX),
AT&T (T), and Wal-Mart (WMT).
Before I jump to the editable rules I will
configure the back-test period from the start
of 2000 to the end of 2007; effectively
covering the last major cyclical bear and bull
market. Later I will run an out-of-range testfrom the start of 2008 to the current day.
The key element I will be looking at will be
modifying the technical rules. There are two
ways of creating your own rules; the first
involves modifying an existing rule - if you are
doing this you need to do a 'Save As' and give
your rule a new name - otherwise your
changes won't be saved.
8/8/2019 Zignals: Building a Trading Strategy
http://slidepdf.com/reader/full/zignals-building-a-trading-strategy 13/19
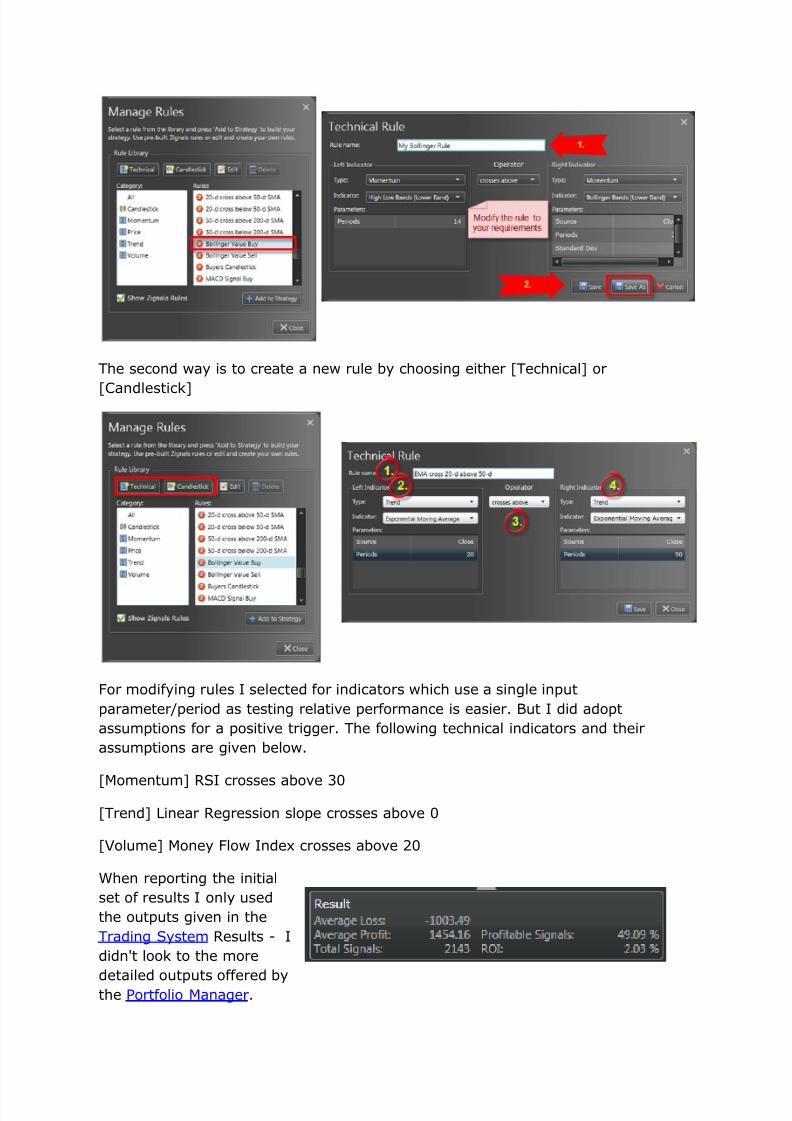
The second way is to create a new rule by choosing either [Technical] or
[Candlestick]
For modifying rules I selected for indicators which use a single input
parameter/period as testing relative performance is easier. But I did adopt
assumptions for a positive trigger. The following technical indicators and their
assumptions are given below.
[Momentum] RSI crosses above 30
[Trend] Linear Regression slope crosses above 0
[Volume] Money Flow Index crosses above 20
When reporting the initial
set of results I only used
the outputs given in the
Trading System Results - I
didn't look to the more
detailed outputs offered bythe Portfolio Manager.

8/8/2019 Zignals: Building a Trading Strategy
http://slidepdf.com/reader/full/zignals-building-a-trading-strategy 14/19
First Step
How did each indicator perform independently?
There were two strong performing indicators: RSI and Money Flow. In the case of
RSI the best returns came from using non-traditional period settings, although thetotal number of trades generated was low (which can skew the results). Similarly,
Money Flow also posted good returns using higher period settings. For both RSI and
Money Flow, period values of 20 days or more generated an average ROI of over 4%
per trade. The caveat is the use of trailing stops and defined targets - not the
traditional inverse 'sell' trigger for an exit - so this may in part explain the stronger
performance from the longer period range. When you consider the (non-)
performance of the S&P over the test period this is quite incredible.

8/8/2019 Zignals: Building a Trading Strategy
http://slidepdf.com/reader/full/zignals-building-a-trading-strategy 15/19
Second Step
We could probably stop here and just use either a long period RSI or Money Flow
indicator as our entry trigger. But is there a way to improve this return? Will a mix-
and-match offer a better return?
The first match was to use RSI [5] with Linear Regression Slope [5] and Money Flow
Index [5]. For each combination type there were a large number of signals,
increasing the probability for a good subset of results. For a trigger to be true, all
signals must occur on the close of business on the same day.
Pairing of the aforementioned indicators brought improved performance over
individual indicators. Better still, using all three in tandem brought the strongest
performance with a healthy 156 trades (approximately 22 a year) with an average
return of 5% per trade and nearly 60% winning trades. Of the paired indicators, a
combination of momentum (RSI) and trend (Linear Regression Slope) brought the
best returns at an ROI of just over 4% per trade with 56% winners.
A unique feature of the
Zignals Trading System
Builder is the ability to create
multiple trigger paths for a
trade. So while the
aforementioned examples
were created with simple
linear paths we can modify
them to allow for OR
scenarios.
A selection of OR
combinations did not improve
the ROI of the strategy and
was considerably worse than
the linear flow of all three
rules together. The additional
rule path also lowered the
ROI of the paired rule set.

8/8/2019 Zignals: Building a Trading Strategy
http://slidepdf.com/reader/full/zignals-building-a-trading-strategy 16/19

8/8/2019 Zignals: Building a Trading Strategy
http://slidepdf.com/reader/full/zignals-building-a-trading-strategy 17/19
The last comparison paired Linear Regression (Slope) with Money Flow. As with the
earlier pairing of Linear Regression (Slope) with RSI, the number of generated
trades was low. Linear Regression (Slope) [5] matched with Money Flow [5] or [10]
had the most trades with a 3.40% and 2.42% ROI respectively - the worst return forany of the pairings.
Fourth Step
The final step extends the second step by looking at alternative period settings
for the three indicators together. But outside the initial set of RSI [5], Linear
Regression Slope [5] and Money Flow [5] there were very few trades.
Out-of-test
The final phase ran the two best set-ups from the start of 2008 to the current day.
The three-indicator set up - RSI [5], Linear Regression (Slope) [5], Money Flow [5] -
generated 37 trades with 65% winners and an ROI of 6.92%. RSI
[20] didn't perform as strongly with 58 trades on 52% winners and 2.26% ROI.

8/8/2019 Zignals: Building a Trading Strategy
http://slidepdf.com/reader/full/zignals-building-a-trading-strategy 18/19
Global Trading Strategies
Based on the aforementioned results I have published the following strategies
available in Trading Strategy MarketPlace:
Tri-Indicator US, Tri-Indicator UK, Tri-Indicator India, Tri-Indicator Aussie, Tri-Indicator Frankfurt, Tri-Indicator Forex, Tri-Indicator ETF, Tri-Indicator Irish, Tri-
Indicator Canada, and Tri-Indicator US Dividends.
Relative US, Relative UK, Relative India, Relative Aussie, Relative Frankfurt, Relative
Forex, Relative ETF, Relative Irish, Relative Canada, and Relative US Dividends
How did the strategy perform across market types? This time there was a clear
winner:
RSI [20] had an average ROI range of -2.86% to 4.04% with a Standard Deviation
of 2.66%.
RSI [5] + Money Flow [5] + Linear Regression (Slop) [5] had an average ROI of
4.03% with a range of 0.68% to 7.60% on a Standard Deviation of 2.45%
Summary
Single even triggers can offer strong returns but sacrifice consistency. Multiple
trigger events per trade can improve performance stability across market
conditions and market types, even if net return per trade can sometimes be lower.

8/8/2019 Zignals: Building a Trading Strategy
http://slidepdf.com/reader/full/zignals-building-a-trading-strategy 19/19
Appendix I: Rule Types
Trend Operator
Exponential Moving Average
Accumulation Swing Index
Linear Regression (Forecast, Intercept, R-Squared, Slope)
MACD
MACD Signal
Moving Average Envelope
Parabolic SAR
Time Series Moving Average
Variable Moving Average
VIDYA
Weighted Close
Weighted Moving AverageWelles Wilder Smoothing
Crosses above
Crosses below
SmallerEqual or Smaller
Equal
Greater or Equal
Greater
Between
Momentum Candlestick
Bollinger Bands
Chande Momentum Oscillator
CCI
Detrended Price Oscillator
High / Low Bands
Mass Index
Median
Momentum OscillatorPrice Oscillator
Rate of Change
Relative Strength Index
Standard Deviation
Stochatics
Swing Index
Typical Price
Ultimate Oscillator
Williams % R
Bearish Doji Star
Bearish Engulfing Pattern
Bullish Doji Star
Bullish Engulfing Line
Dark Cloud Cover
Evening Star
Hanging Man
Harami CrossMorning Star
Piercing Line
Shooting Star
Spinning Top
Volume PriceChaikin Money Flow
Chaikin Volatility Oscillator
Ease of Movement
Money Flow Index
On-balance-volume
Positive Volume Index
Price Volume Trend
Volume Oscillator
Volume Rate of Change
Williams Accumulation Distribution
Open
High
Low
Close
Volume