Embed Size (px)
Citation preview
Zimbabwe-South Africa relations
under pressure:
An eye for an eye or turn the other cheek?
The political and economic developments in Zimbabwe remain of significance to
South Africa as an immediate neighbour, as well as to an economically-
interdependent SADC region. The risk of ‘beggar-my-neighbour’ policies has risen.
This research document looks specifically into some of the practical implications of
the recent selective ban on South African products being imported into Zimbabwe.
The study highlights the unintended consequences that larger macro-political and
economic pressures in Zimbabwe have on South-Africa-Zimbabwe trade relations and
policy. The research document also examines a few of the options open to South
Africa at this important juncture.
22 September 2016
2
Table of Contents
1. Background ................................................................................................................. 4
2. Can Zimbabwe industry fill the void created by the import ban? ............................. 6
3. Implications of the import ban for Zimbabwe-South Africa relations ....................... 7
4. What are South Africa’s options going forward? ....................................................... 9
Bibliography .................................................................................................................. 11
Annexures ..................................................................................................................... 14
Figures ....................................................................................................................... 14
Tables ........................................................................................................................ 16
3
List of Figures
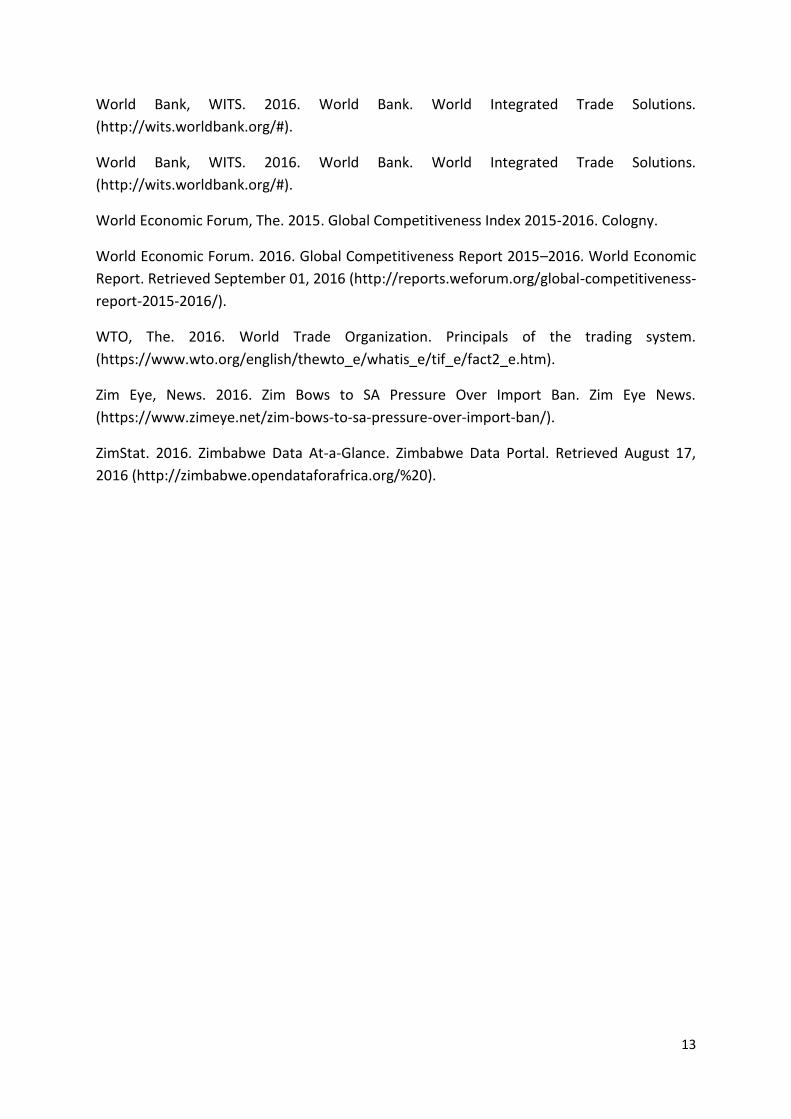
Figure 1: Quantity and share of products under Zimbabwe's import ban .................. 14
Figure 2: Top 10 export partners of Zimbabwe............................................................ 15
Figure 3: Top 10 import partners of Zimbabwe ........................................................... 15
Figure 4: SA’s exports to Zimbabwe including a 5-year trend ..................................... 16
Figure 5: SA’s imports from Zimbabwe including a 5-year trend ................................ 17
List of Tables
Table 1: GCI: Rank and value of South Africa, Zimbabwe and Sub-Saharan Africa ..... 18
Table 2: Zimbabwe: Disaggregated Global Competitiveness Index ............................. 18
Table 3: List of South African products banned by Zimbabwe ................................... 19
Table 4: Trade indicators for selected SADC countries ................................................ 20
Table 5: Top 10 export partners of Zimbabwe (2015) ................................................. 21
Table 6: Top 10 import partners of Zimbabwe (2015) ................................................. 21
4
1. Background
Ten years ago, the Zimbabwe economy was teetering on the edge of collapse, with
surging inflation, a currency in free fall and a formal business sector that had all but
stopped producing any meaningful levels of output. 2005 was a watershed year in
which a serious shortage of foreign reserves (Coomer and Gstraunthaler, 2011) and a
relaxation in monetary policy sent inflation into an upward spiral. With the
government facing dwindling revenue as a result, it directed the Reserve Bank of
Zimbabwe (RBZ) to print money so that it could meet its spending requirements and
service its debts. This fanned the inflationary flames even more, and hyperinflation
set in.
Hyperinflation in the country peaked in 2008, at a mind-boggling 500 billion per cent
(IMF, 2009), which was the second highest rate that had ever been recorded in the
world (Hanke, 2014). Various measures were adopted in an attempt to rein in the
inflation rate – from periodically lopping off several zeros on the printed bank notes,
to declaring inflation ‘illegal’. Finally, in 2009, with no solution in sight to arrest the
country’s runaway price increases and currency slide, the authorities took the drastic
step of abandoning the Zimbabwe dollar and officially adopting a combination of
other currencies, with the US dollar and the South African rand leading the way.
June 2009 marked the start of a period in which Zimbabwe eventually broke free of
the grip of hyperinflation. Yet political uncertainties (including ongoing hostilities
between the ruling party, ZANU-PF, and the main opposition party, the MDC) and
sluggish economic thinking and activity have in the meantime constrained inward
investment and commercial output. A policy of indigenisation of companies (making
it mandatory for the majority of shares in companies to be held by Zimbabwean
nationals) and extensive price controls have helped to suppress economic activity in
the country in recent years (Coomer and Gstraunthaler, 2011).
Today, almost ironically, Zimbabwe is confronted by a new challenge: deflation. In
May 2016, for example, Zimbabwe’s annual inflation rate was reported to be -1.69%
(Reserve Bank of Zimbabwe, 2016). Deflation is problematic for Zimbabwe because it
encourages consumers to postpone making purchases in the expectation that prices
will continue to fall the longer they wait. In the face of lower demand for goods and
services, the country’s producers have had no choice but to slow down their
production, which has put a damper on economic growth and job prospects. This is
compounded by the fact that the government is in arrears in its repayments to
5
external lenders (RBZ, 2015), thus making it very difficult to raise additional sources
of finance for growth-stimulating initiatives.
Hyperinflation might not be a problem anymore in Zimbabwe, but it was a clear
symptom of underlying, systemic (often politically-derived) problems in the
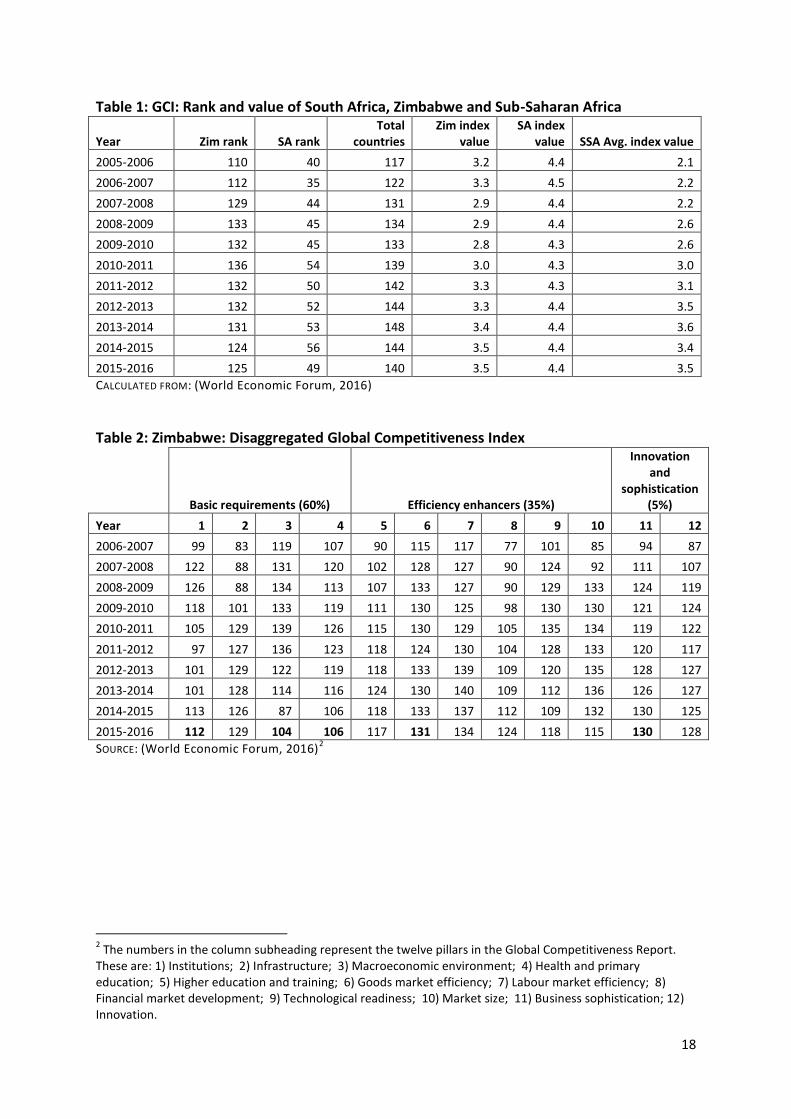
economy, which persist to this day. In the World Economic Forum’s Global
Competitiveness Report 2015-2016, Zimbabwe ranked 15th from the bottom of the
list (of 140 countries). Although this is an improvement over its 2005 ranking of 7th
from the bottom of the list (of 117 countries) — Zimbabwe’s economic problems are
deeply rooted. Also evident in the GCR 2015-2016 was Zimbabwe’s relatively poor
showing in terms of institutional capacity and effectiveness, ranking 112th (of 140
countries). While Zimbabwe’s GCI (Global Competitiveness Index) score of 3.5 in
2015-2016 was a positive change from its 2005-2006 score of 2.1 (see Table 1), the
better showing was due to improvements in only two of the pillars, i.e. health and
primary education and macroeconomic environment, as indicated in Table 2 (World
Economic Forum, 2016).
It is only through major restructuring of those institutions in the country that are
charged with determining and/or implementing economic policy that Zimbabwe will
have any chance of becoming a vehicle for improved competitiveness, sustainable
growth and employment, and social harmony (Parsons, 2007).
When a country in a geographically-connected region succumbs to acute economic
problems, its neighbours inevitably feel the fallout — in the form of shrinking
markets for their exporters, an influx of job seekers and/or damaged trade relations.
Thus, the question should be asked: should regional powers stand by and let
Zimbabwe possibly exercise poor judgement again in the face of its new economic
challenges? In the early 2000s, when the economic crisis in Zimbabwe was
escalating, former President Thabo Mbeki‘s approach to handling the crisis was to
display ‘quiet diplomacy’. In more recent years, too, the South African government
has evidently been content to leave Zimbabwe largely to its own devices (Mlambo,
2016). Although South Africa is believed to have the means to put pressure on
President Robert Mugabe to deviate from his destructive path and avert a further
crisis in that country (with all the unwanted spill-over effects for South Africa and
others), it has generally chosen to stay out of the fray. The importance of respecting
Zimbabwe’s sovereignty has been put forward as the main argument supporting
South Africa’s policy of non-interference.
However, a recent policy decision by the Zimbabwe government has put Zimbabwe-
South Africa relations under pressure and has created an unusual level of tension
6
between the respective governments. On 17 June 2016, the Zimbabwe government
unexpectedly announced that a list of 43 South African product categories would be
banned from importation into Zimbabwe. Gazetted under Statutory Instrument 164
of 2016 (SI 164), the ban — according to Zimbabwe’s Minister of Industry and
Commerce, Mike Bimha — had been initiated to “support our local industry” (The
Herald, 2016). By unilaterally tampering with an established pattern of trade and
also threatening the livelihoods of thousands of informal traders on either side of the
border, the Zimbabwe government appears to have taken their sovereign right to
extremes, at the expense of formal trade protocols and established government-to-
government etiquette. South Africa’s response to this curved ball from Zimbabwe is
important as it is likely to set the tone for a new type of engagement between the
two governments and could even set a new precedent for the resolution of other
regional squabbles that arise in the future.
2. Can Zimbabwe industry fill the void created by the import ban?
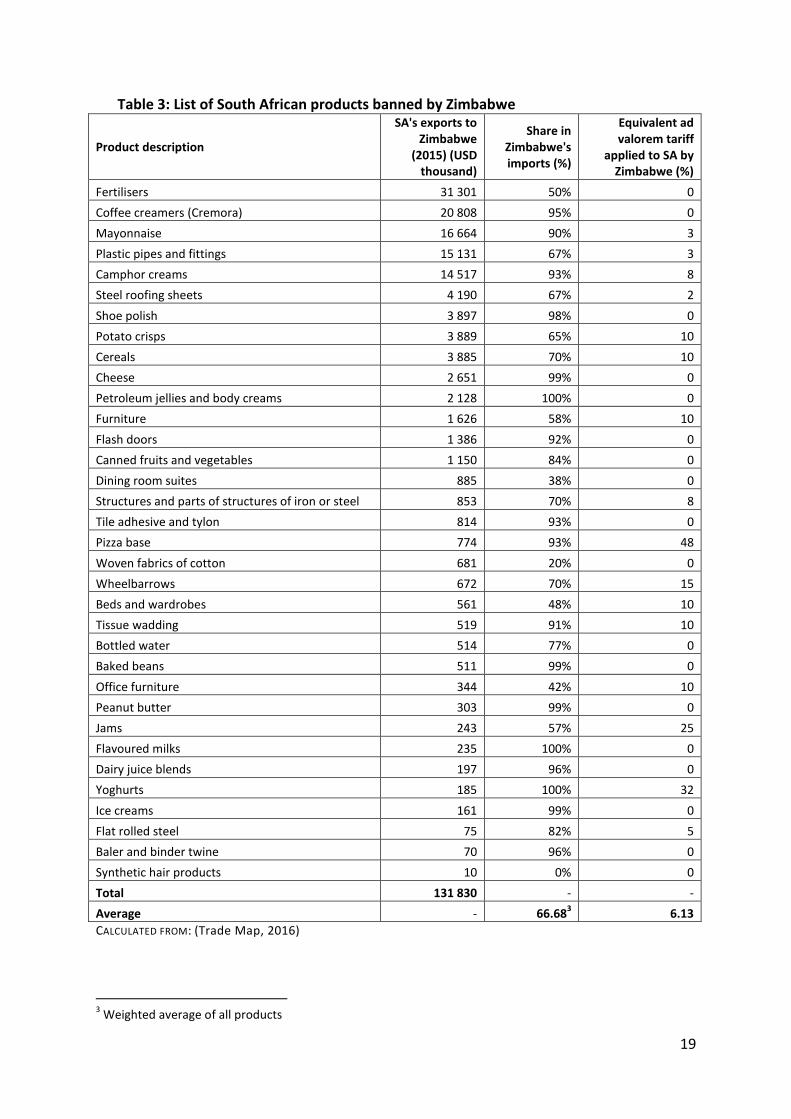
According to 2015 figures (see Table 3), the list of now-banned South African
products that can no longer be imported into Zimbabwe had a value of USD 131.83
million1 that year. Exceptions would be those products for which an import licence
might be issued by the Zimbabwe government “when local production cannot meet
the national demand” (The Herald, 2016). As Table 3 and Figure 1 indicate, fertilisers,
coffee creamer, mayonnaise, plastic pipes and fittings, and camphor creams are the
most affected by the ban.
Although, in total, the banned products represented only 5.72% of Zimbabwe’s
imports from South Africa in 2015, the number of affected products is nevertheless
significant. Perhaps the most important observation that can be made is the large
share held by South African products in Zimbabwe’s imports of the various product
groups. Table 3 attests to this. Of all the products appearing on the banned list,
South African products constituted a weighted average of 66.68% of the total
imports of these products into Zimbabwe in 2015.
With a number of products being banned, the question of just how Zimbabwe is
going to replace them certainly arises – especially given the country’s poor goods
market efficiency and low levels of business sophistication, which were ranked 130th
and 131st respectively in the GCR 2015-2016 (World Economic Forum, 2016). The
1 Figures for second-hand tyres, maheu and compounds and blends were unavailable, indicating that the
calculated figure of USD 131.83 million should be even higher. Some products were grouped together into overarching categories, e.g. ‘beds’ and ‘wardrobes’ were combined under ‘furniture’, thereby whittling the original list of 43 products down to 34.
7
Zimbabwean authorities claim that the country can fill the gap via its local
manufacturing base. However, there is little evidence of this. As production figures
are nearly impossible to obtain, an examination of Zimbabwe’s trade figures as an
alternative reveals that the country will fall miserably short if it tries to replace the
previously-imported products with local substitutes. The country currently has a
negative trade balance in respect of nearly ALL of the product groups (except for
peanut butter and baler twine). In fact, the value of exports represented a mere
7.52% of the value of imports in 2015. Nevertheless, Davison Norupiri, president of
Zimbabwe’s National Chamber of Commerce, has asserted that while some
companies have been adversely affected by the country’s economic woes, “others
have seen increases of well above 30% capacity utilisation and increased
productivity” (Zim Eye, 2016). If Zimbabwe does have the capacity to
manufacture/produce these products, then it is doing a fine job of keeping such
capabilities a secret.
3. Implications of the import ban for Zimbabwe-South Africa
relations
The imposition of a ban on a range of South African goods which, it is claimed,
interfere with Zimbabwe’s local manufacturing drive should be seen within the
broader context of Zimbabwe’s export and import performance, and its trading
relationship with South Africa.
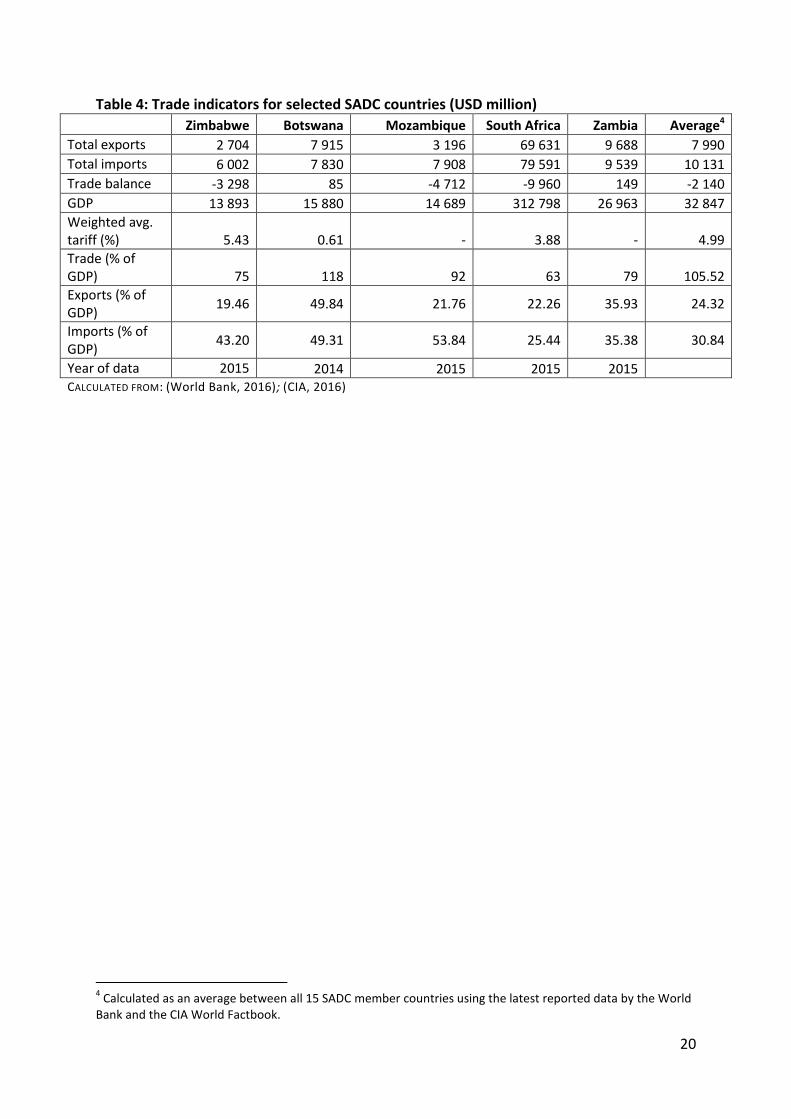
In 2015, Zimbabwe reported a negative trade balance of USD 3.3 billion (USD 6
billion-worth of imports vs only USD 2.7 billion-worth of exports), as shown in Table
4. Trade constituted more than 75% of Zimbabwe’s GDP – below the SADC average
of 106% but a sizeable proportion nonetheless. This is a sign of how far the country
has come in terms of trade liberalisation. Not all of Zimbabwe’s trade is regional but
a great deal of intra-SADC trade does take place, with South Africa leading the way as
a source of imports into Zimbabwe and as an export destination for Zimbabwe
goods.
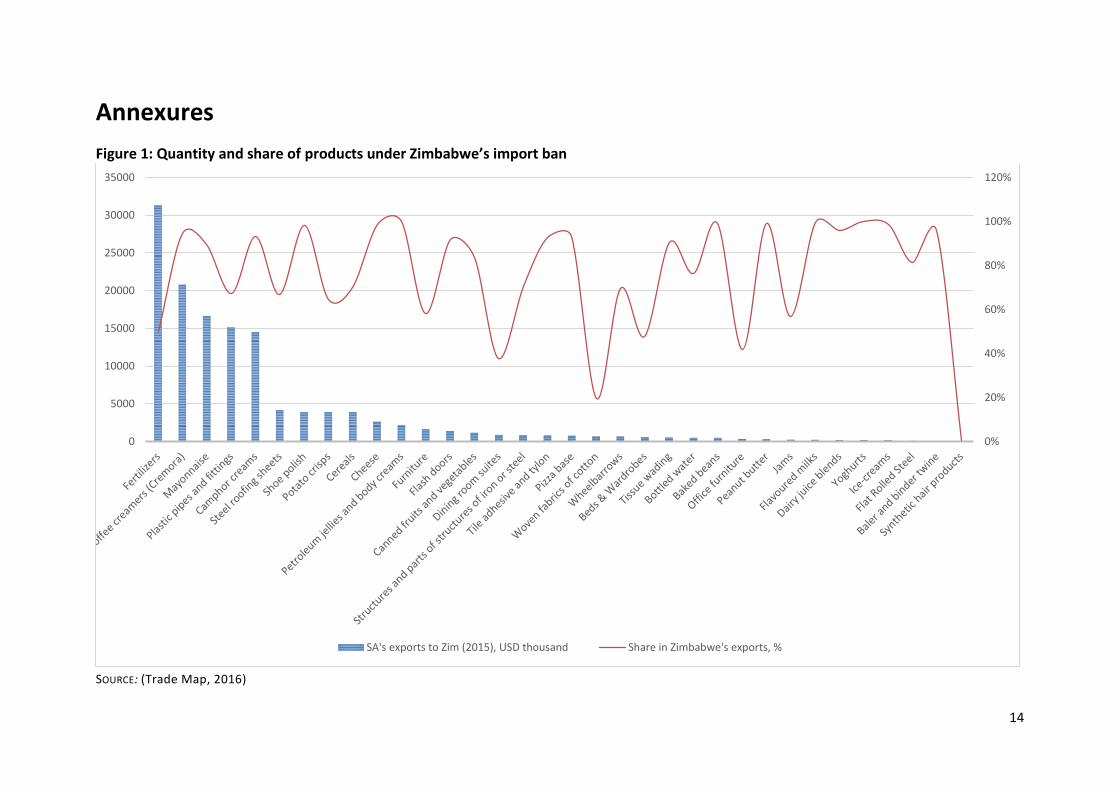
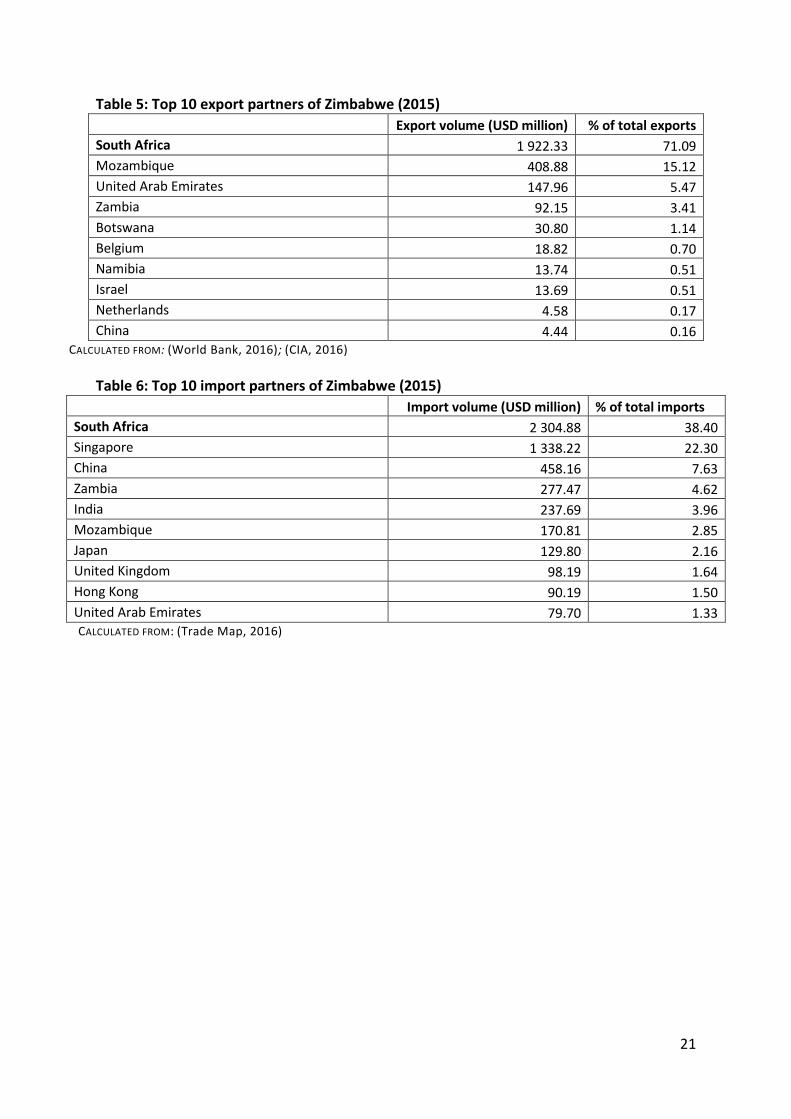
Figure 2 shows that South Africa is the recipient of more than 71% (in terms of value)
of all products exported from Zimbabwe. Neighbouring Zambia and Mozambique
also feature in the top 10 export destinations, but their relative importance is
dwarfed by that of South Africa. Similarly, Figure 3 highlights the importance of
South Africa to Zimbabwe’s trade. South Africa supplies more than a third of
Zimbabwe’s imports, surpassing the proportion supplied by Singapore (Zimbabwe’s
second largest source of imports) by 72% (in terms of value). Two other SADC
8
neighbours, Zambia and Mozambique, are listed in the top 10 but their respective
contributions are small. South Africa’s importance as a trading partner to Zimbabwe
is further reinforced in Tables 5 and 6.
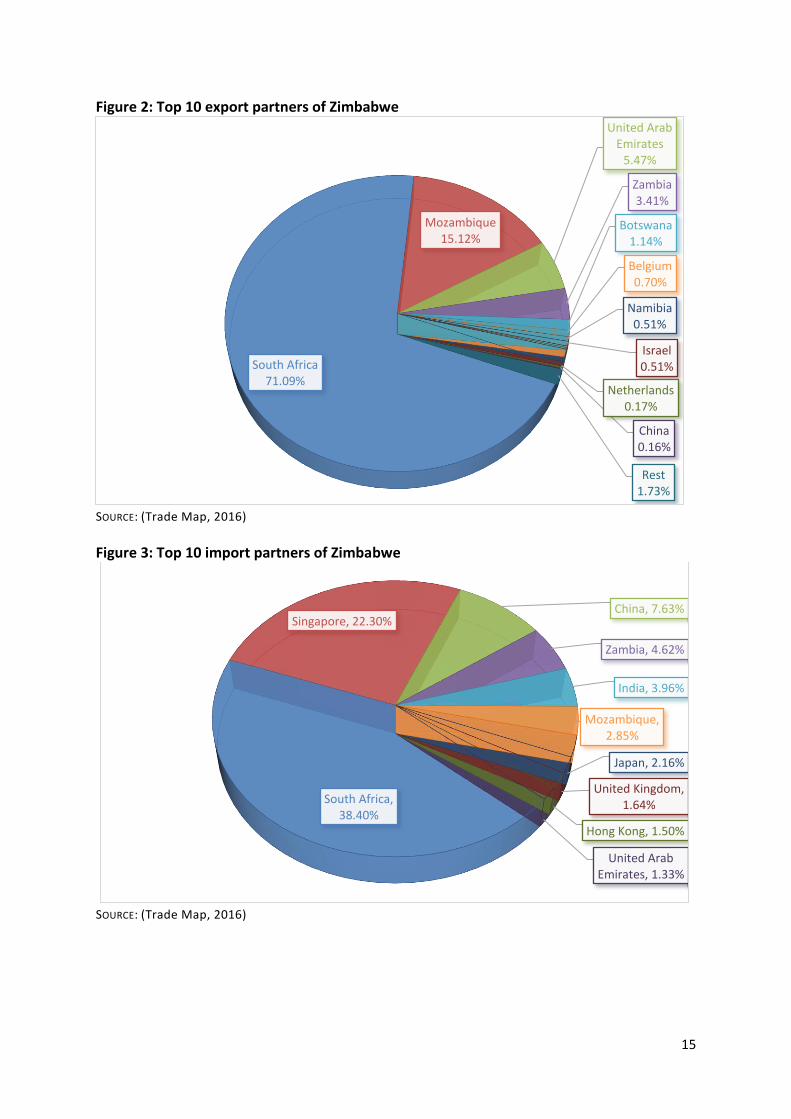
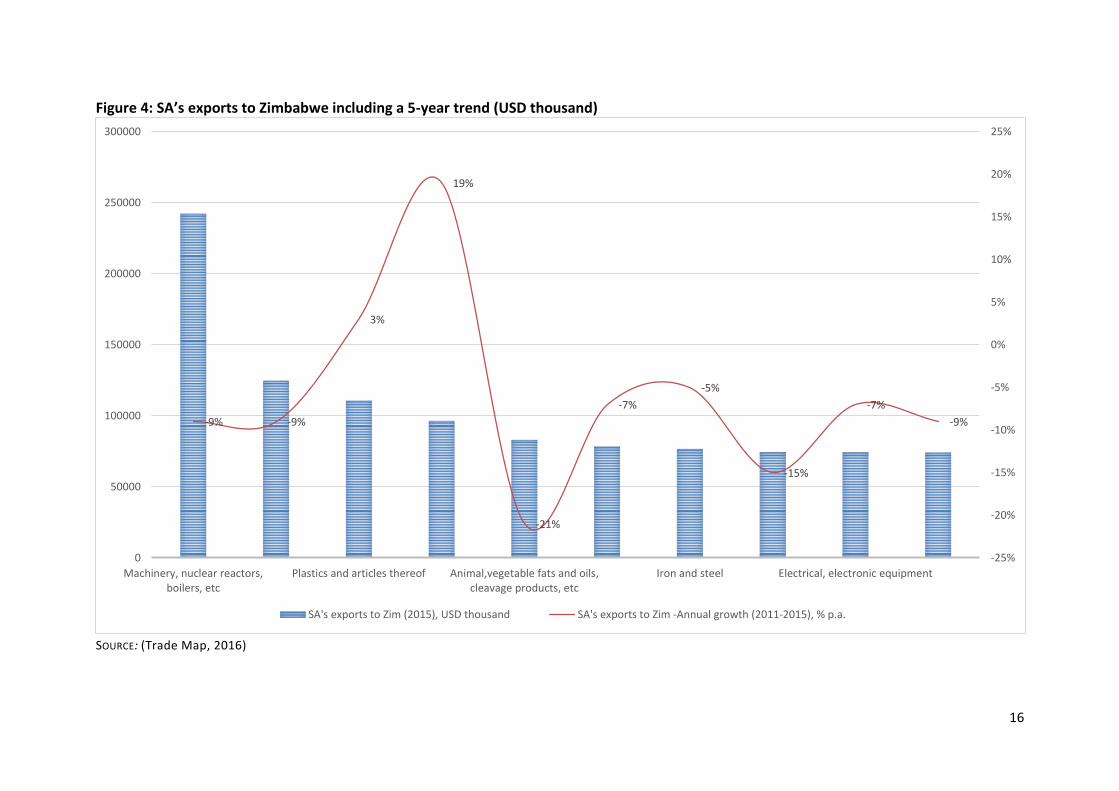
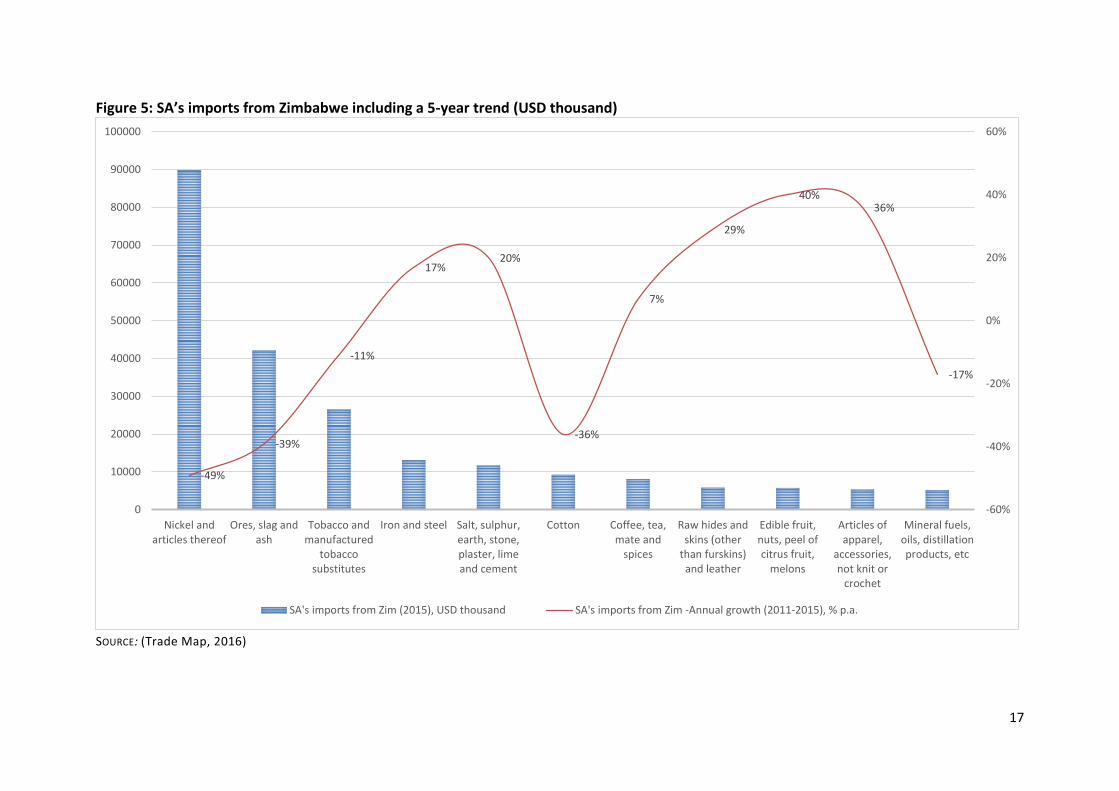
Clearly, South Africa is a natural and strategically important ally of Zimbabwe on both
the export and import fronts. A sector-specific picture of the two countries’ trade
interdependence is shown in Figures 4 and 5. With Zimbabwe having adopted an
open economy approach and with trade accounting for almost 75% of GDP (World
Bank, 2016), the imposition of a ban on its most important trading partner is cause
for alarm and raises some serious questions. Protectionist arguments appear
somewhat misplaced in the light of the current narrative about regional integration
and its many benefits. Having said that, a selective ban on South African imports
could help to push Zimbabwe out of its deflation trap. As with the switch to the US
dollar some years ago, this appears to be a desperate attempt to escape the latest
economic crisis and is another reminder of the economic bungling that has long
characterised Robert Mugabe’s administration.
Even if a lack of competitiveness (and a shortage of foreign exchange) prompted the
Zimbabwe government to impose emergency ad hoc measures against imports from
South Africa, Zimbabwe immediately opened itself up to the possibility of South
Africa reciprocating. For example, the unilateral decision by Zimbabwe to ‘turn off
the tap’ to a range of South African exports could be countered by South Africa
deciding to ‘turn off the lights’ since South Africa supplies Zimbabwe with 300 MW of
power per day (African News Agency, 2016). Whether South Africa decides to exploit
its position or not, the country clearly has an upper hand in terms of the economic
power it wields. This has induced Zimbabwe to offer to make certain ‘concessions’,
according to Minister Bimha (Zim Eye, 2016). Exactly what these concessions will
entail have yet to be clarified. At the time of writing, Rob Davies, South Africa’s
Minister of Trade and Industry, was still locked in discussions with his Zimbabwe
counterpart on the best way forward.
On face value, the import ban compromises Zimbabwe’s trade obligations under the
Southern African Development Community (SADC) Trade Protocol (SADC, 2016) and
infringes on basic WTO principles (WTO, 2016). As both SADC and the WTO promote
freer trade and greater integration between individual countries and the region as a
whole, it is alarming that Zimbabwe is deciding to ‘take the opposite view’. Other
SADC countries not directly affected by the ban have said that Zimbabwe’s action
flies in the face of formal trade protocols and regional cooperation. However, many
Zimbabwean manufacturers are adamant that they need protecting. Wheat
9
producers in the country now want the ban to extend to imported wheat flour in a
bid to stop the decline of bread production in Zimbabwe.
While the effects of the import ban are unfolding rather slowly at a macro level, at a
micro level they are already being keenly felt. Many small-scale traders make a living
by engaging in close proximity cross-border trade between the two countries.
Preliminary studies point to the main economic impact being felt in the South African
town of Musina in the Limpopo province near the Zimbabwe border. “The loss to the
Limpopo economy will be approximately R100 million per month in terms of loss of
sales” (Mostert, 2016). In July 2016, the International Cross-border Traders
Association threatened to close down the Beit Bridge border again if the Zimbabwe
government did not lift its ban on imports of basic goods (Manyathela, 2016).
4. What are South Africa’s options going forward?
South Africa could consider lodging a complaint with the WTO as the SADC Trade
Protocol makes no provision for formal dispute settlement (Khumalo, 2016).
However, this process could be extremely time-consuming. Trade disputes between
WTO members are dealt with through the WTO Dispute Settlement Body and
typically take about 15 months to resolve, although some trade disputes have
dragged on for as long as three years (WTO, 2016).
An alternative approach would be to try and force SADC countries to reinstate Annex
VI of the SADC Trade Protocol (concerning the settlement of disputes between
member countries) or at least reinstate the Tribunal that was disbanded (Khumalo,
2016). Adopting a regional approach might deliver a swifter resolution, but it would
depend on cooperation from the SADC governments.
South Africa could take a tough stance and retaliate with a similar ban in the
opposite direction, or take even more drastic steps and cut back on the supply of
electricity to Zimbabwe. As South Africa has historically behaved in a very diplomatic
fashion towards its noisy neighbour, invoking this option would come as a great
surprise.
All things considered, South Africa is extremely unlikely to lodge an official appeal
with the WTO, and will probably also desist from reciprocating with a ban of its own.
As a result, Zimbabwe is essentially ‘buying time’. As disputes under WTO rules can
be settled between countries at any time, the Zimbabwean Industry and Commerce
Ministry no doubt expects South Africa to opt for this gentler route rather than lodge
10
an official complaint. As the two countries are already engaged in negotiations over
the matter, a complaint will surely not arise, and external intervention is unlikely.
But what will the ultimate cost to South Africa be of ‘turning the other cheek’?
Considering South Africa’s difficult economic climate at present and with credit
agencies circling menacingly, any delay in resolving this ‘sudden inconvenience’ will
add to South Africa’s cost burden and compromise its regional reputation — at a
time when the country can least afford it. If history has taught people anything about
the relations between Zimbabwe and South Africa, it is that doing nothing leads to
nothing. If South Africa does not toughen up and send the right message to
Zimbabwe, it will set a precedent for similar incidents to occur in the future — to the
detriment of the trading communities at large who play a pivotal role in their
countries’ economies.
11
Bibliography
African News Agency. 2016. Eskom in 'secretive deal' to provide power to Zimbabwe.
Engineering News. (http://www.engineeringnews.co.za/article/eskom-in-secretive-deal-to-
provide-power-to-zimbabwe-2016-01-04).
African News Agency. 2016. Eskom 'in secretive deal' to provide power to Zimbabwe.
Creamer Media's Engineering News. Retrieved August 22, 2016
(http://www.engineeringnews.co.za/article/eskom-in-secretive-deal-to-provide-power-to-
zimbabwe-2016-01-04/rep_id:4136).
Aljazeera. 2016. Zimbabwe war veterans denounce 'dictatorial' Mugabe. Aljazeera.
(http://www.aljazeera.com/news/2016/07/zimbabwe-war-veterans-denounce-dictatorial-
mugabe-160721185632903.html).
BBC. 2016. Zimbabwe profile - Timeline. BBC News. Retrieved August 15, 2016
(http://www.bbc.com/news/world-africa-14113618).
Chiumia, S. 2014. Is Zimbabwe’s unemployment rate 4%, 60% or 95%? Why the data is
unreliable. Africa Check.
CIA World Factbook. 2016. CIA. (https://www.cia.gov/).
CIA. 2016. Zimbabwe. The CIA World Factbook. Retrieved August 17, 2016
(https://www.cia.gov/library/publications/the-world-factbook/geos/zi.html).
Coomer, J. and Gstraunthaler, T. 2011. The Hyperinflation in Zimbabwe. The Quarterly
Journal of Austrian Economics, 14(3):311–346.
DTI. 2016. Zimbabwe to Address Trade Restrictions. Media Statement, Department of Trade
and Industry.
DTI. 2016. Zimbabwe to address trade restrictions. The Department of Trade and Industry.
(http://www.thedti.gov.za/editmedia.jsp?id=3816).
Hanke, S.H. 2014. R.I.P. Zimbabwe Dollar. CATO Intitute. Retrieved August 14, 2016
(http://www.cato.org/zimbabwe).
IMF. 2009. Zimbabwe: 2009 Article IV Consultation—Staff Report; Public Information Notice
on the Executive board Discussion; and Statement by the Executive Director for Zimbabwe.
IMF Country Report No. 09/139, International Monetary Fund.
Khumalo, Nkululeko. 2016. South Africa — Zimbabwe trade war: time for WTO
intervention? Tutwa Consulting. (http://www.tutwaconsulting.com/south-africa-zimbabwe-
trade-war-time-for-wto-intervention/).
12
Mangudya, J.P. 2016. Monetary Policy Statement: January 2016. Reserve Bank of Zimbabwe.
Manyathela, Clement. 2016. New threat to close Beitbridge Border over imports ban.
Eyewitness News. (http://ewn.co.za/2016/07/19/New-threats-to-close-Beitbridge-border-
over-imports-ban).
Mlambo, A.S. 2016. "Zimbabwe is not a South African Province": Historicising South Africa's
Zimbabwe Policy since the 1960s. Historia, 61(1):18–40.
Mostert, J. 2016. NWU Trade: Zimbabwe Import Ban. August 23.
Ndlovu, R. 2016. Zimbabwe's commerce minister 'too busy' to meet Rob Davies. BDlive.
Retrieved August 22, 2016 (http://www.bdlive.co.za/business/trade/2016/
07/29/zimbabwes-commerce-minister-too-busy-to-meet-rob-davies).
Ndluvo, Ray. 2016. Zimbabwe's Commerce Minister 'too busy' to meet Rob Davies. Business
Day Live. (http://www.bdlive.co.za/business/trade/2016/07/29/zimbabwes-commerce-
minister-too-busy-to-meet-rob-davies).
Parsons, R.W.K. 2007. After Mugabe goes — The political and economic reconstruction of
Zimbabwe. South African Journal of Economics, 75(4):599 - 615.
Pitso, Reitumetse. 2016. Davies puts Harare on notice over exports impasse. Business Day
Live. (http://www.bdlive.co.za/business/trade/2016/08/05/davies-puts-harare-on-notice-
over-exports-impasse).
RBZ. 2015. Zimbabwe: Strategies for clearing external debt arrears and the supportive
economic reform agenda. Reserve Bank of Zimbabwe.
Reserve Bank of Zimbabwe. 2016. Monthly Economic Review: May 2016. Monthly Economic
Review, Reserve Bank of Zimbabwe.
SADC, The. 2016. Free Trade Area. Southern Africa Development Community.
(http://www.sadc.int/about-sadc/integration-milestones/free-trade-area/).
The Herald. 2016. New import regulations gazetted. The Herald. Retrieved August 22, 2016
(http://www.herald.co.zw/new-import-regulations-gazetted/).
The World Bank. 2016. Data for Zimbabwe, Angola, Botswana, Lesotho, Malawi, Mauritius,
Mozambique, Namibia, Seychelles, South Africa, Swaziland, Tanzania, Zambia, Congo, Dem.
Rep. The World Bank. Retrieved August 17, 2016
(http://data.worldbank.org/?locations=ZW-AO-BW-LS-MW-MU-MZ-NA-SC-ZA-SZ-TZ-ZM-
CD).
Trade Map, ITC. 2016. Trade Statistics for International Business Development.
(http://www.trademap.org/Country_SelProductCountry.aspx?nvpm=1|716||||TOTAL|||2|
1|1|1|1||2||).
13
World Bank, WITS. 2016. World Bank. World Integrated Trade Solutions.
(http://wits.worldbank.org/#).
World Bank, WITS. 2016. World Bank. World Integrated Trade Solutions.
(http://wits.worldbank.org/#).
World Economic Forum, The. 2015. Global Competitiveness Index 2015-2016. Cologny.
World Economic Forum. 2016. Global Competitiveness Report 2015–2016. World Economic
Report. Retrieved September 01, 2016 (http://reports.weforum.org/global-competitiveness-
report-2015-2016/).
WTO, The. 2016. World Trade Organization. Principals of the trading system.
(https://www.wto.org/english/thewto_e/whatis_e/tif_e/fact2_e.htm).
Zim Eye, News. 2016. Zim Bows to SA Pressure Over Import Ban. Zim Eye News.
(https://www.zimeye.net/zim-bows-to-sa-pressure-over-import-ban/).
ZimStat. 2016. Zimbabwe Data At-a-Glance. Zimbabwe Data Portal. Retrieved August 17,
2016 (http://zimbabwe.opendataforafrica.org/%20).
14
Annexures
Figure 1: Quantity and share of products under Zimbabwe’s import ban
SOURCE: (Trade Map, 2016)
0%
20%
40%
60%
80%
100%
120%
0
5000
10000
15000
20000
25000
30000
35000
SA's exports to Zim (2015), USD thousand Share in Zimbabwe's exports, %
15
Figure 2: Top 10 export partners of Zimbabwe
SOURCE: (Trade Map, 2016)
Figure 3: Top 10 import partners of Zimbabwe
SOURCE: (Trade Map, 2016)
South Africa 71.09%
Mozambique 15.12%
United Arab Emirates
5.47%
Zambia 3.41%
Botswana 1.14%
Belgium 0.70%
Namibia 0.51%
Israel 0.51%
Netherlands 0.17%
China 0.16%
Rest 1.73%
South Africa, 38.40%
Singapore, 22.30% China, 7.63%
Zambia, 4.62%
India, 3.96%
Mozambique, 2.85%
Japan, 2.16%
United Kingdom, 1.64%
Hong Kong, 1.50%
United Arab Emirates, 1.33%
16
Figure 4: SA’s exports to Zimbabwe including a 5-year trend (USD thousand)
SOURCE: (Trade Map, 2016)
-9% -9%
3%
19%
-21%
-7%
-5%
-15%
-7%
-9%
-25%
-20%
-15%
-10%
-5%
0%
5%
10%
15%
20%
25%
0
50000
100000
150000
200000
250000
300000
Machinery, nuclear reactors,boilers, etc
Plastics and articles thereof Animal,vegetable fats and oils,cleavage products, etc
Iron and steel Electrical, electronic equipment
SA's exports to Zim (2015), USD thousand SA's exports to Zim -Annual growth (2011-2015), % p.a.
17
Figure 5: SA’s imports from Zimbabwe including a 5-year trend (USD thousand)
SOURCE: (Trade Map, 2016)
-49%
-39%
-11%
17% 20%
-36%
7%
29%
40% 36%
-17%
-60%
-40%
-20%
0%
20%
40%
60%
0
10000
20000
30000
40000
50000
60000
70000
80000
90000
100000
Nickel andarticles thereof
Ores, slag andash
Tobacco andmanufactured
tobaccosubstitutes
Iron and steel Salt, sulphur,earth, stone,plaster, limeand cement
Cotton Coffee, tea,mate and
spices
Raw hides andskins (other
than furskins)and leather
Edible fruit,nuts, peel ofcitrus fruit,
melons
Articles ofapparel,
accessories,not knit or
crochet
Mineral fuels,oils, distillationproducts, etc
SA's imports from Zim (2015), USD thousand SA's imports from Zim -Annual growth (2011-2015), % p.a.
18
Table 1: GCI: Rank and value of South Africa, Zimbabwe and Sub-Saharan Africa
Year Zim rank SA rank Total
countries Zim index
value SA index
value SSA Avg. index value
2005-2006 110 40 117 3.2 4.4 2.1
2006-2007 112 35 122 3.3 4.5 2.2
2007-2008 129 44 131 2.9 4.4 2.2
2008-2009 133 45 134 2.9 4.4 2.6
2009-2010 132 45 133 2.8 4.3 2.6
2010-2011 136 54 139 3.0 4.3 3.0
2011-2012 132 50 142 3.3 4.3 3.1
2012-2013 132 52 144 3.3 4.4 3.5
2013-2014 131 53 148 3.4 4.4 3.6
2014-2015 124 56 144 3.5 4.4 3.4
2015-2016 125 49 140 3.5 4.4 3.5
CALCULATED FROM: (World Economic Forum, 2016)
Table 2: Zimbabwe: Disaggregated Global Competitiveness Index
Basic requirements (60%) Efficiency enhancers (35%)
Innovation and
sophistication (5%)
Year 1 2 3 4 5 6 7 8 9 10 11 12
2006-2007 99 83 119 107 90 115 117 77 101 85 94 87
2007-2008 122 88 131 120 102 128 127 90 124 92 111 107
2008-2009 126 88 134 113 107 133 127 90 129 133 124 119
2009-2010 118 101 133 119 111 130 125 98 130 130 121 124
2010-2011 105 129 139 126 115 130 129 105 135 134 119 122
2011-2012 97 127 136 123 118 124 130 104 128 133 120 117
2012-2013 101 129 122 119 118 133 139 109 120 135 128 127
2013-2014 101 128 114 116 124 130 140 109 112 136 126 127
2014-2015 113 126 87 106 118 133 137 112 109 132 130 125
2015-2016 112 129 104 106 117 131 134 124 118 115 130 128
SOURCE: (World Economic Forum, 2016)2
2 The numbers in the column subheading represent the twelve pillars in the Global Competitiveness Report.
These are: 1) Institutions; 2) Infrastructure; 3) Macroeconomic environment; 4) Health and primary education; 5) Higher education and training; 6) Goods market efficiency; 7) Labour market efficiency; 8) Financial market development; 9) Technological readiness; 10) Market size; 11) Business sophistication; 12) Innovation.
19
Table 3: List of South African products banned by Zimbabwe
Product description
SA's exports to Zimbabwe
(2015) (USD thousand)
Share in Zimbabwe's imports (%)
Equivalent ad valorem tariff
applied to SA by Zimbabwe (%)
Fertilisers 31 301 50% 0
Coffee creamers (Cremora) 20 808 95% 0
Mayonnaise 16 664 90% 3
Plastic pipes and fittings 15 131 67% 3
Camphor creams 14 517 93% 8
Steel roofing sheets 4 190 67% 2
Shoe polish 3 897 98% 0
Potato crisps 3 889 65% 10
Cereals 3 885 70% 10
Cheese 2 651 99% 0
Petroleum jellies and body creams 2 128 100% 0
Furniture 1 626 58% 10
Flash doors 1 386 92% 0
Canned fruits and vegetables 1 150 84% 0
Dining room suites 885 38% 0
Structures and parts of structures of iron or steel 853 70% 8
Tile adhesive and tylon 814 93% 0
Pizza base 774 93% 48
Woven fabrics of cotton 681 20% 0
Wheelbarrows 672 70% 15
Beds and wardrobes 561 48% 10
Tissue wadding 519 91% 10
Bottled water 514 77% 0
Baked beans 511 99% 0
Office furniture 344 42% 10
Peanut butter 303 99% 0
Jams 243 57% 25
Flavoured milks 235 100% 0
Dairy juice blends 197 96% 0
Yoghurts 185 100% 32
Ice creams 161 99% 0
Flat rolled steel 75 82% 5
Baler and binder twine 70 96% 0
Synthetic hair products 10 0% 0
Total 131 830 - -
Average - 66.683 6.13
CALCULATED FROM: (Trade Map, 2016)
3 Weighted average of all products
20
Table 4: Trade indicators for selected SADC countries (USD million)
Zimbabwe Botswana Mozambique South Africa Zambia Average4
Total exports 2 704 7 915 3 196 69 631 9 688 7 990
Total imports 6 002 7 830 7 908 79 591 9 539 10 131
Trade balance -3 298 85 -4 712 -9 960 149 -2 140
GDP 13 893 15 880 14 689 312 798 26 963 32 847
Weighted avg. tariff (%) 5.43 0.61 - 3.88 - 4.99
Trade (% of GDP) 75 118 92 63 79 105.52
Exports (% of GDP)
19.46 49.84 21.76 22.26 35.93 24.32
Imports (% of GDP)
43.20 49.31 53.84 25.44 35.38 30.84
Year of data 2015 2014 2015 2015 2015 CALCULATED FROM: (World Bank, 2016); (CIA, 2016)
4 Calculated as an average between all 15 SADC member countries using the latest reported data by the World
Bank and the CIA World Factbook.
21
Table 5: Top 10 export partners of Zimbabwe (2015)
Export volume (USD million) % of total exports
South Africa 1 922.33 71.09
Mozambique 408.88 15.12
United Arab Emirates 147.96 5.47
Zambia 92.15 3.41
Botswana 30.80 1.14
Belgium 18.82 0.70
Namibia 13.74 0.51
Israel 13.69 0.51
Netherlands 4.58 0.17
China 4.44 0.16 CALCULATED FROM: (World Bank, 2016); (CIA, 2016)
Table 6: Top 10 import partners of Zimbabwe (2015)
Import volume (USD million) % of total imports
South Africa 2 304.88 38.40
Singapore 1 338.22 22.30
China 458.16 7.63
Zambia 277.47 4.62
India 237.69 3.96
Mozambique 170.81 2.85
Japan 129.80 2.16
United Kingdom 98.19 1.64
Hong Kong 90.19 1.50
United Arab Emirates 79.70 1.33 CALCULATED FROM: (Trade Map, 2016)