Embed Size (px)
Citation preview
1
Zinc-Lead-Silver Producer
Corporate Presentation – mineLatinAmerica 2014 Conference TSX: TV BVL: TV | www.trevali.com | November 2014
Disclaimer1
Certain statements contained in this document, including, without limitation, those concerning the economic outlook for the mining industry, expectations regarding metal prices and production, the completion and commencement of commercial operations of certain of Trevali Mining Corporation’s (“TV”) projects, and its liquidity and capital resources and expenditure, contain certain forward-looking statements regarding TV’s economic performance and financial condition. Although TV believes that the expectations reflected in such forward-looking statements are reasonable, no assurance can be given that such expectations will prove to have been correct. Accordingly, results could differ materially from those set out in the forward-looking statements as a result of, among other factors, changes in economic and market conditions, success of business initiatives, changes in the regulatory environment and other government actions, fluctuations in metal prices and exchange rates, and business and operational risk management. TV undertakes no obligation to update publicly or release any revisions to these forward-looking statements to reflect events or circumstances after the date of the annual report. All subsequent written or oral forward-looking statements attributable to TV or any person acting on its behalf are qualified by the cautionary statements herein.
Trevali's production plans at Santander and Caribou-Halfmile-Stratmat are based only on Indicated and Inferred Mineral Resources1 and not Mineral Reserves, and do not have demonstrated economic viability. Inferred Mineral Resources are considered too speculative geologically to have the economic considerations applied to them that would enable them to be categorized as Mineral Reserves, and there is therefore no certainty that the conclusions of the production plans and Preliminary Economic Assessment will be realized.
2 1Please refer to Appendix: Disclosures for important items relating to the resource estimates and production plans.
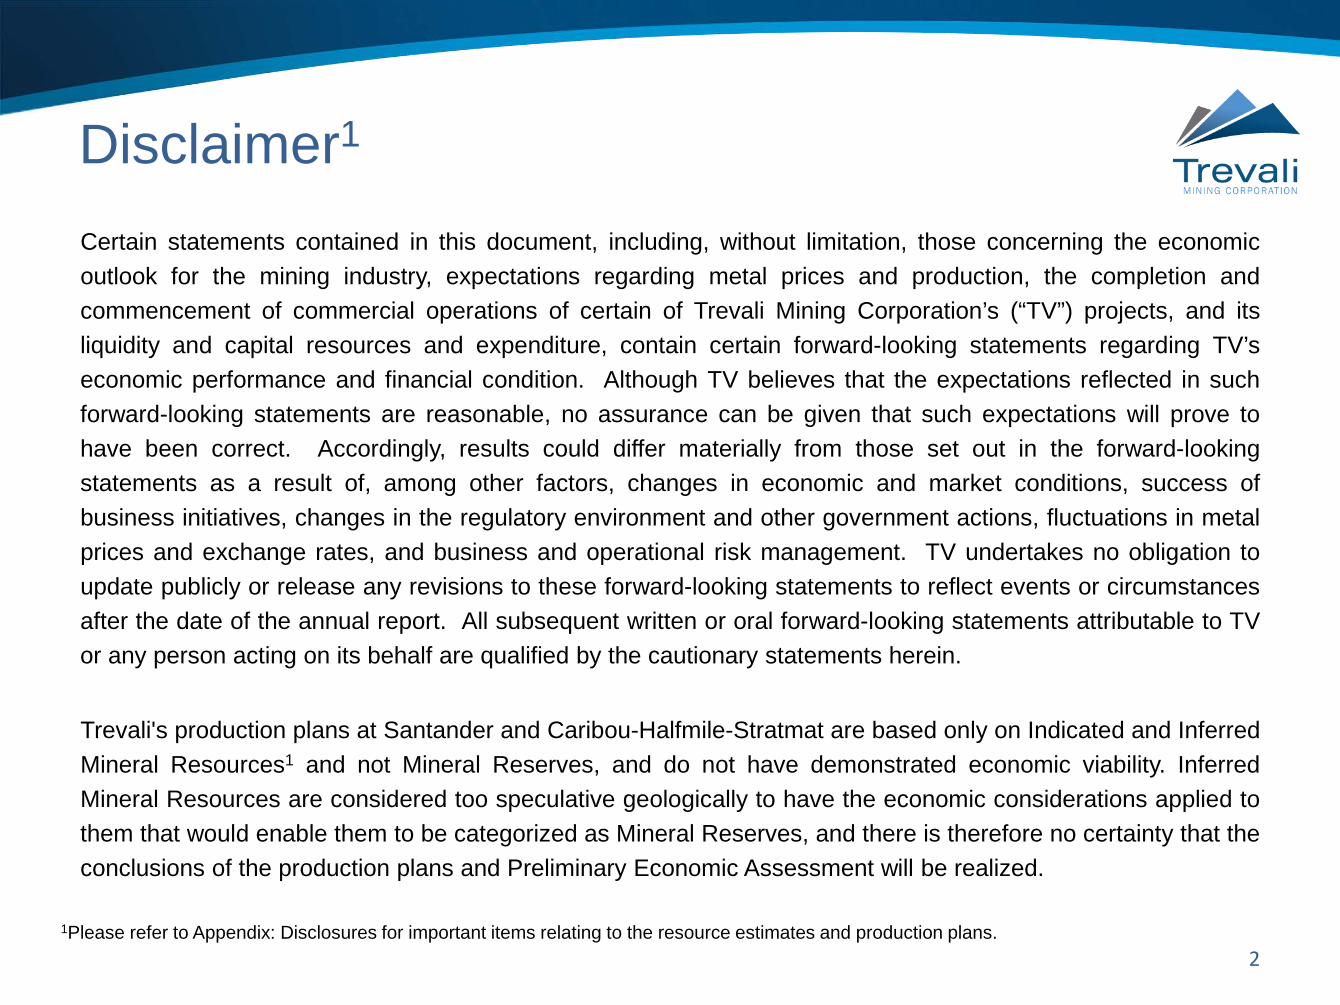
Why Zinc?
3 Source: Glencore Xstrata Presentation, includes Metallgesellschaft, WoodMackenzie and Glencore estimates
Zinc demand strengthens while supply tightens: Strong Western demand plus record Chinese imports (H1-2014) driving significant global zinc
inventory drawdowns – moving towards deficit Imminent closure of major global zinc mines (Century, Lisheen, Skorpion, etc.) – an overall
reduction of approx. 10% of global production is forecast; New marquee projects deferred
Santander production commences
Caribou production commencing
Potential Halfmile-Stratmat development
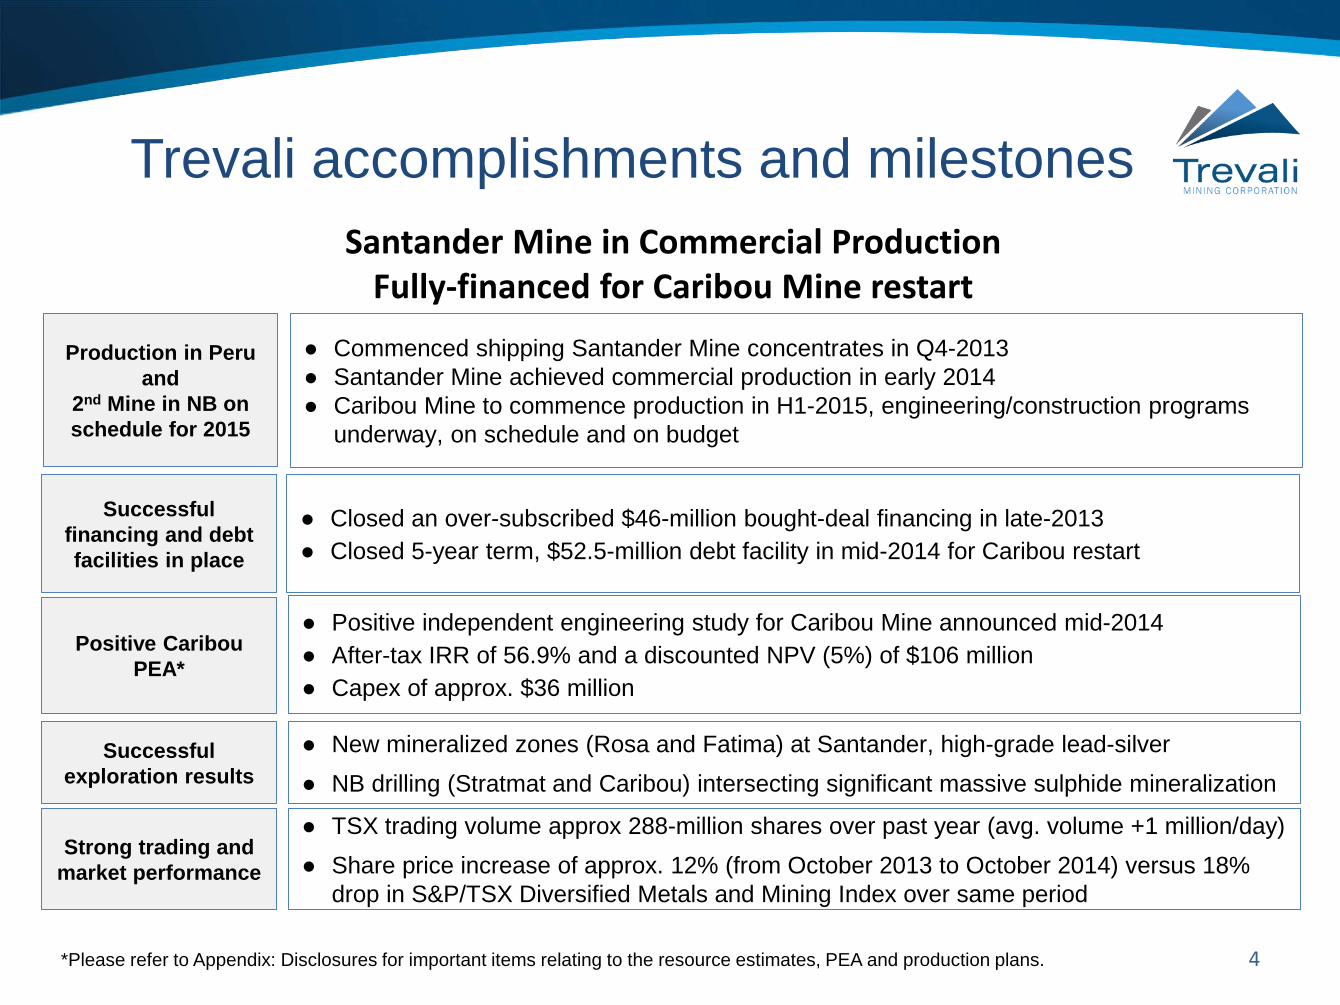
● Closed an over-subscribed $46-million bought-deal financing in late-2013
● Closed 5-year term, $52.5-million debt facility in mid-2014 for Caribou restart
Trevali accomplishments and milestones
4
● Commenced shipping Santander Mine concentrates in Q4-2013 ● Santander Mine achieved commercial production in early 2014 ● Caribou Mine to commence production in H1-2015, engineering/construction programs
underway, on schedule and on budget
● New mineralized zones (Rosa and Fatima) at Santander, high-grade lead-silver ● NB drilling (Stratmat and Caribou) intersecting significant massive sulphide mineralization
Positive Caribou PEA*
Successful financing and debt facilities in place
Production in Peru and
2nd Mine in NB on schedule for 2015
Successful exploration results
● TSX trading volume approx 288-million shares over past year (avg. volume +1 million/day) ● Share price increase of approx. 12% (from October 2013 to October 2014) versus 18%
drop in S&P/TSX Diversified Metals and Mining Index over same period
Strong trading and market performance
● Positive independent engineering study for Caribou Mine announced mid-2014 ● After-tax IRR of 56.9% and a discounted NPV (5%) of $106 million ● Capex of approx. $36 million
Santander Mine in Commercial Production Fully-financed for Caribou Mine restart
*Please refer to Appendix: Disclosures for important items relating to the resource estimates, PEA and production plans.
Trevali Capital Structure
5 1 Details of all of the outstanding options and warrants can be found in the Appendix
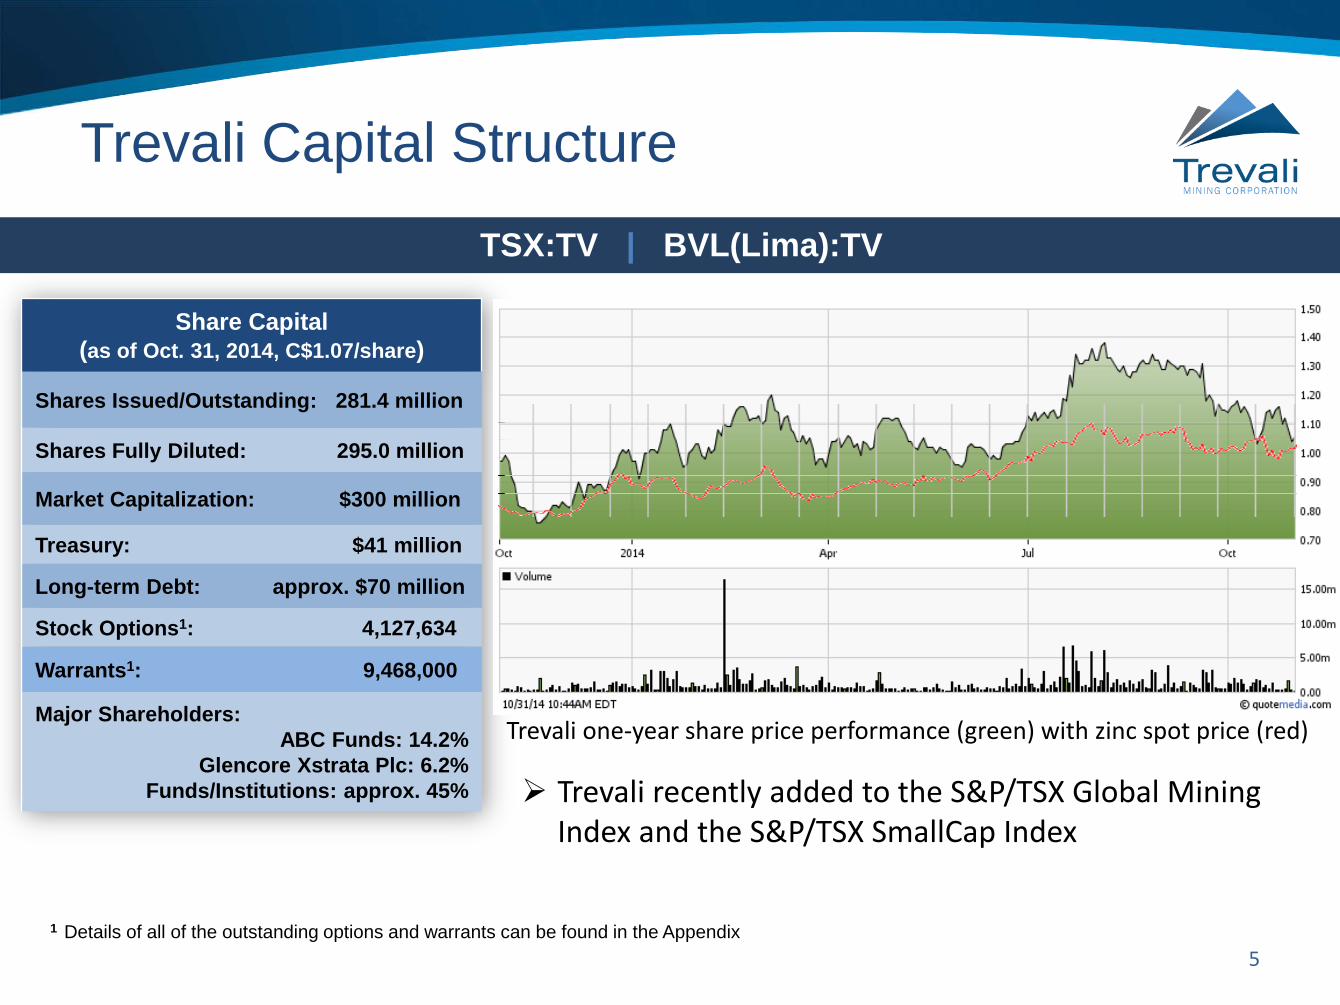
TSX:TV | BVL(Lima):TV
Share Capital (as of Oct. 31, 2014, C$1.07/share)
Shares Issued/Outstanding: 281.4 million
Shares Fully Diluted: 295.0 million
Market Capitalization: $300 million
Treasury: $41 million
Long-term Debt: approx. $70 million
Stock Options1: 4,127,634
Warrants1: 9,468,000
Major Shareholders: ABC Funds: 14.2%
Glencore Xstrata Plc: 6.2% Funds/Institutions: approx. 45% Trevali recently added to the S&P/TSX Global Mining
Index and the S&P/TSX SmallCap Index
Trevali one-year share price performance (green) with zinc spot price (red)
Trevali Management
6
DR. MARK CRUISE – PRESIDENT & CEO A base metal deposit specialist with over 20-years project experience from grass-roots exploration through resource definition to permitting and production in Europe and the America’s on behalf of Pasminco Exploration, Anglo American and various TSX-listed Juniors. Mark completed his Geology Ph.D. on the Irish zinc-lead orefield and was a member of Anglo American’s Lisheen Zinc-Lead Mine feasibility/technical team in Ireland that developed the 4,500 tpd mine.
PAUL KELLER, P.ENG. – CHIEF OPERATING OFFICER 28 years of mine operations experience in Canada, most recently as Manager of Technical Services for a major Canadian mining contractor where he led a team of engineers and designers on various mining contracts for major mining companies. Paul began his career with Rio Algom Limited and has also worked in various management roles with Barrick Gold's Hemlo mine in operations, engineering and maintenance.
ANNA LADD, CMA – CHIEF FINANCIAL OFFICER Over 15 years experience in financing and financial controls in the mining industry including responsibility for multiple large scale open pit and underground base and precious metal production units. Anna has served as VP Finance and CFO for a number of TSX-listed junior mining companies in addition to several mid-size to senior gold and base metal producers including Grande Cache Coal, Kinross Gold’s Fort Knox, Round Mountain and Kettle River operations and Vale Inco's Thompson and Sudbury base metal operations.
DAYLE RUSK – DIRECTOR OF GEOLOGY Over 30 years of exploration and production experience in underground and open-pit mines. Dayle has held roles as Senior Production Geologist at Goldcorp's Red Lake mine and Anglo American's Hudson Bay Mining and Smelting - Flin Flon production unit, and was Chief of Technical Services for Imperial Metals responsible for all aspects of engineering and production geology including short and long-range planning, mine design, resource-reserve calculations and subsequent production-reconciliation studies. DANIEL MARINOV – VP OF EXPLORATION Over 22 years of international experience in exploration and underground mining, and has held senior management roles with Rio Tinto and Anglo American. Recently Daniel was project manager at Anglo's Michiquillay porphyry copper-gold-molybdenum deposit in Peru. STEVE STAKIW – VP CORPORATE COMMUNICATIONS Geologist with over 25 years of mineral exploration industry, and research & finance market experience. Steve has held a senior management role with a leading mining research and investment publication and has consulted to resource-focused investment funds. ALAN HUGHES – VP HUMAN RESOURCES Over 25 years experience a global senior human resources professional. Previously held senior level roles in companies such as Talisman Energy, Rio Algom Ltd., Convergys, American Express and Pitney Bowes with experience in Canada, the United States, Peru and Chile.
Trevali Directors
7
DR. MARK CRUISE, PRESIDENT , CEO & DIRECTOR Base metal deposit specialist with over 20-years project experience from grass-roots exploration through resource definition to permitting and production in Europe and the America’s on behalf of Pasminco Exploration, Anglo American and TSX-listed companies. Completed Geology Ph.D. on the Irish zinc-lead orefield and was a member of Anglo American’s Lisheen Zinc-Lead Mine feasibility/technical team in Ireland.
DAVID HUBERMAN, CHAIRMAN & DIRECTOR Experienced lawyer specializing in corporate, commercial, banking, securities, regulatory and mining law. Director of Ivanhoe Mines Ltd. (recently renamed Turquoise Hill Resources) from 2003-2012 and its Chairman from 2011-2012. CHRIS ESKDALE, DIRECTOR Global Head Industrial Zinc for Glencore Plc. ANTON DRESCHER, DIRECTOR Certified Management Accountant with extensive public company board and officer experience.
MIKE HOFFMAN, DIRECTOR - OPERATIONS Over 25 years global mine development experience, most recently as Vice President Operations at Yamana Gold, Desert Sun and Goldcorp. CATHERINE GIGNAC, DIRECTOR Geologist and mining analyst with over 25 years experience at mining companies and several global brokerage firms (UBS, RBC and Merrill Lynch Canada) as well as independent boutiques firms (Wellington West, Loewen Ondaatje McCutcheon and Dundee). DR. VALENTIN PANIAGUA JARA, DIRECTOR Partner at Peruvian law firm Estudio Echecopar and head of its Natural Resources Department with extensive experience in: mining, environmental, mergers and acquisitions, corporate law, project finance; option, joint venture and royalty agreements, ore sales and marketing arrangements, and tenure and permitting issues. PETER MEREDITH, DIRECTOR Chartered Accountant with extensive public market and resource company experience. Served as director, CFO and deputy Chairman of Ivanhoe Mines Ltd. (now Turquoise Hill Resources), CEO and Chairman of SouthGobi Resources, in addition to sitting on the Board of several other resource development and exploration companies.
8
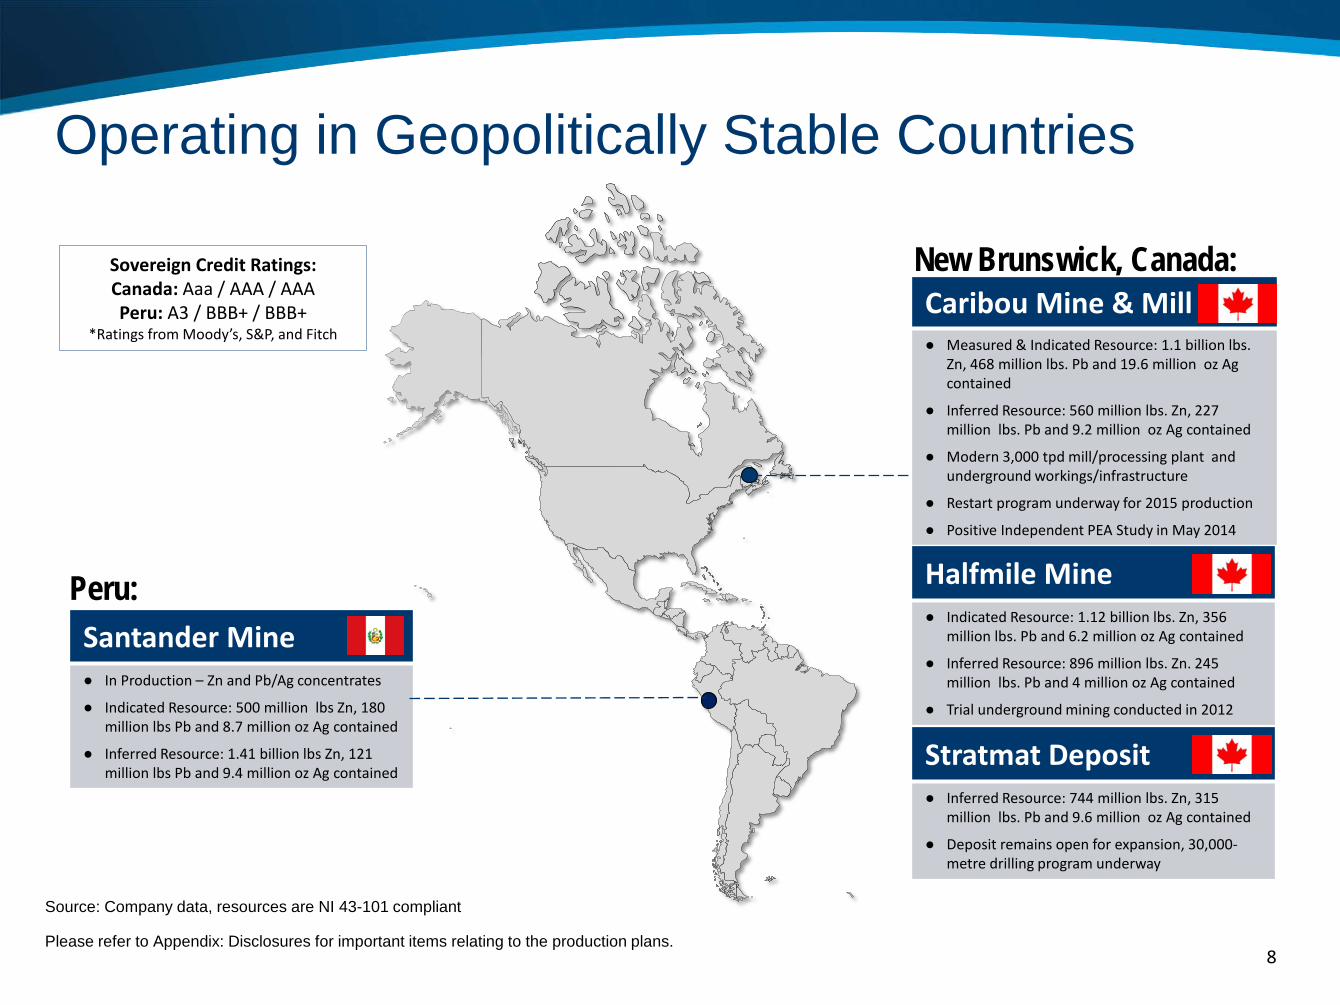
Operating in Geopolitically Stable Countries
Stratmat Deposit ● Inferred Resource: 744 million lbs. Zn, 315
million lbs. Pb and 9.6 million oz Ag contained
● Deposit remains open for expansion, 30,000-metre drilling program underway
Caribou Mine & Mill ● Measured & Indicated Resource: 1.1 billion lbs.
Zn, 468 million lbs. Pb and 19.6 million oz Ag contained
● Inferred Resource: 560 million lbs. Zn, 227 million lbs. Pb and 9.2 million oz Ag contained
● Modern 3,000 tpd mill/processing plant and underground workings/infrastructure
● Restart program underway for 2015 production
● Positive Independent PEA Study in May 2014
Halfmile Mine ● Indicated Resource: 1.12 billion lbs. Zn, 356
million lbs. Pb and 6.2 million oz Ag contained
● Inferred Resource: 896 million lbs. Zn. 245 million lbs. Pb and 4 million oz Ag contained
● Trial underground mining conducted in 2012
Santander Mine ● In Production – Zn and Pb/Ag concentrates
● Indicated Resource: 500 million lbs Zn, 180 million lbs Pb and 8.7 million oz Ag contained
● Inferred Resource: 1.41 billion lbs Zn, 121 million lbs Pb and 9.4 million oz Ag contained
Source: Company data, resources are NI 43-101 compliant
Please refer to Appendix: Disclosures for important items relating to the production plans.
Sovereign Credit Ratings: Canada: Aaa / AAA / AAA Peru: A3 / BBB+ / BBB+
*Ratings from Moody’s, S&P, and Fitch
Peru:
New Brunswick, Canada:
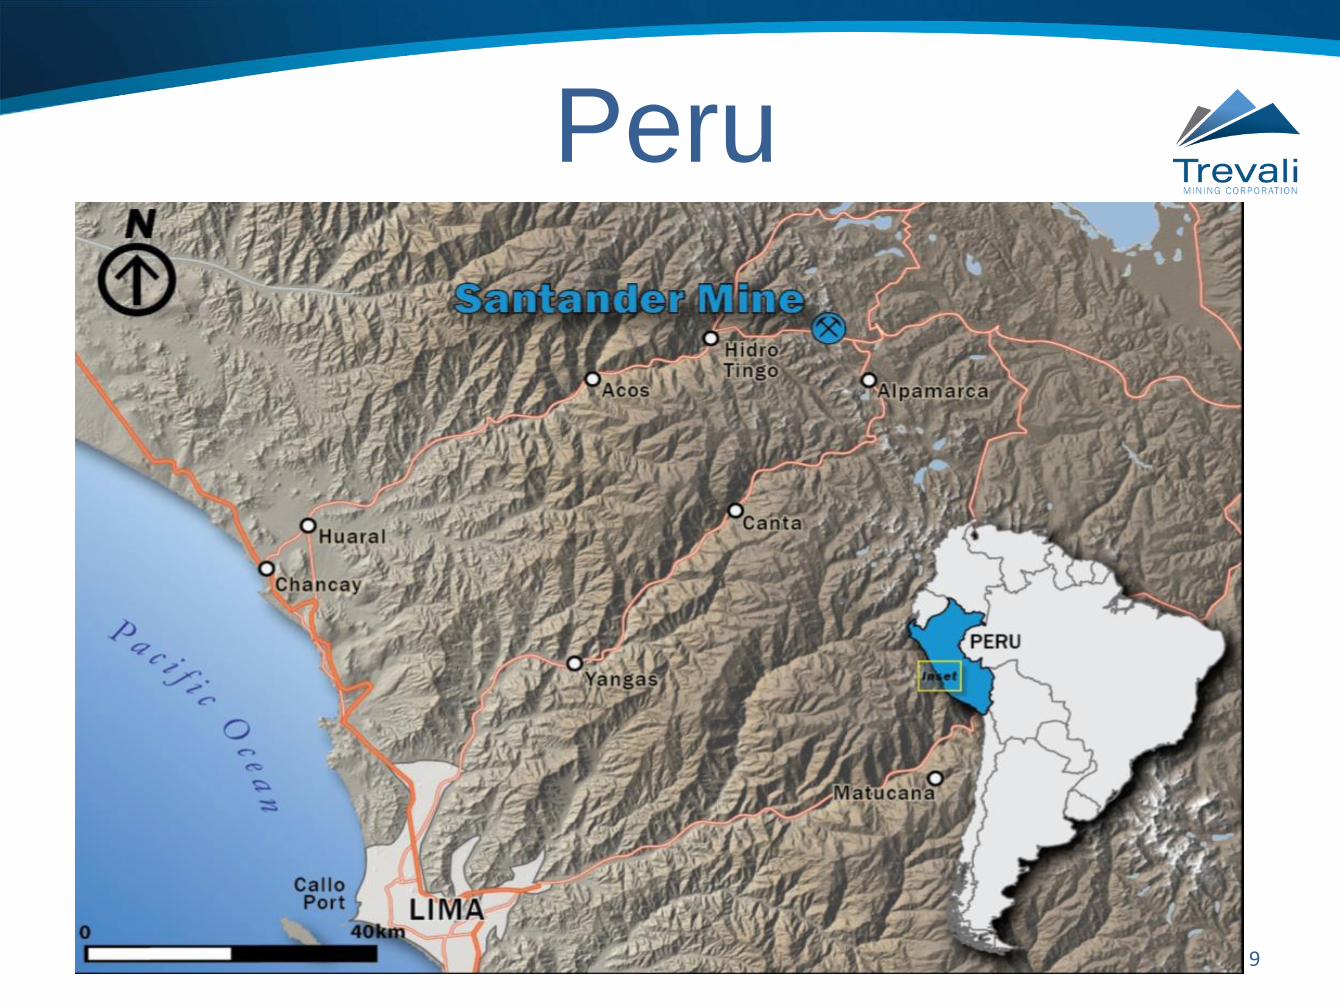
Peru
9
10
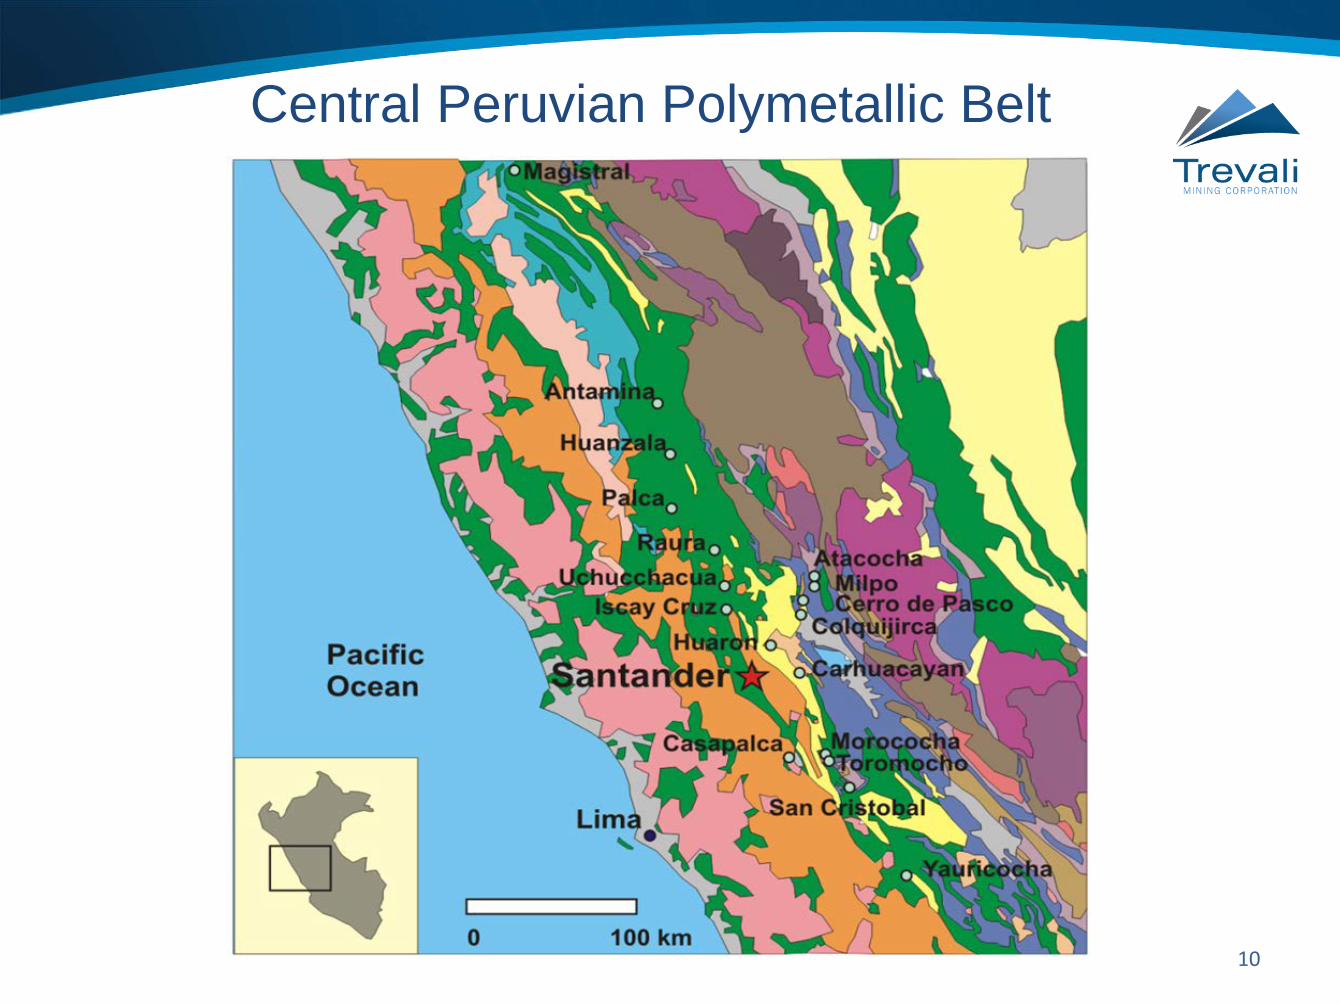
Central Peruvian Polymetallic Belt
11
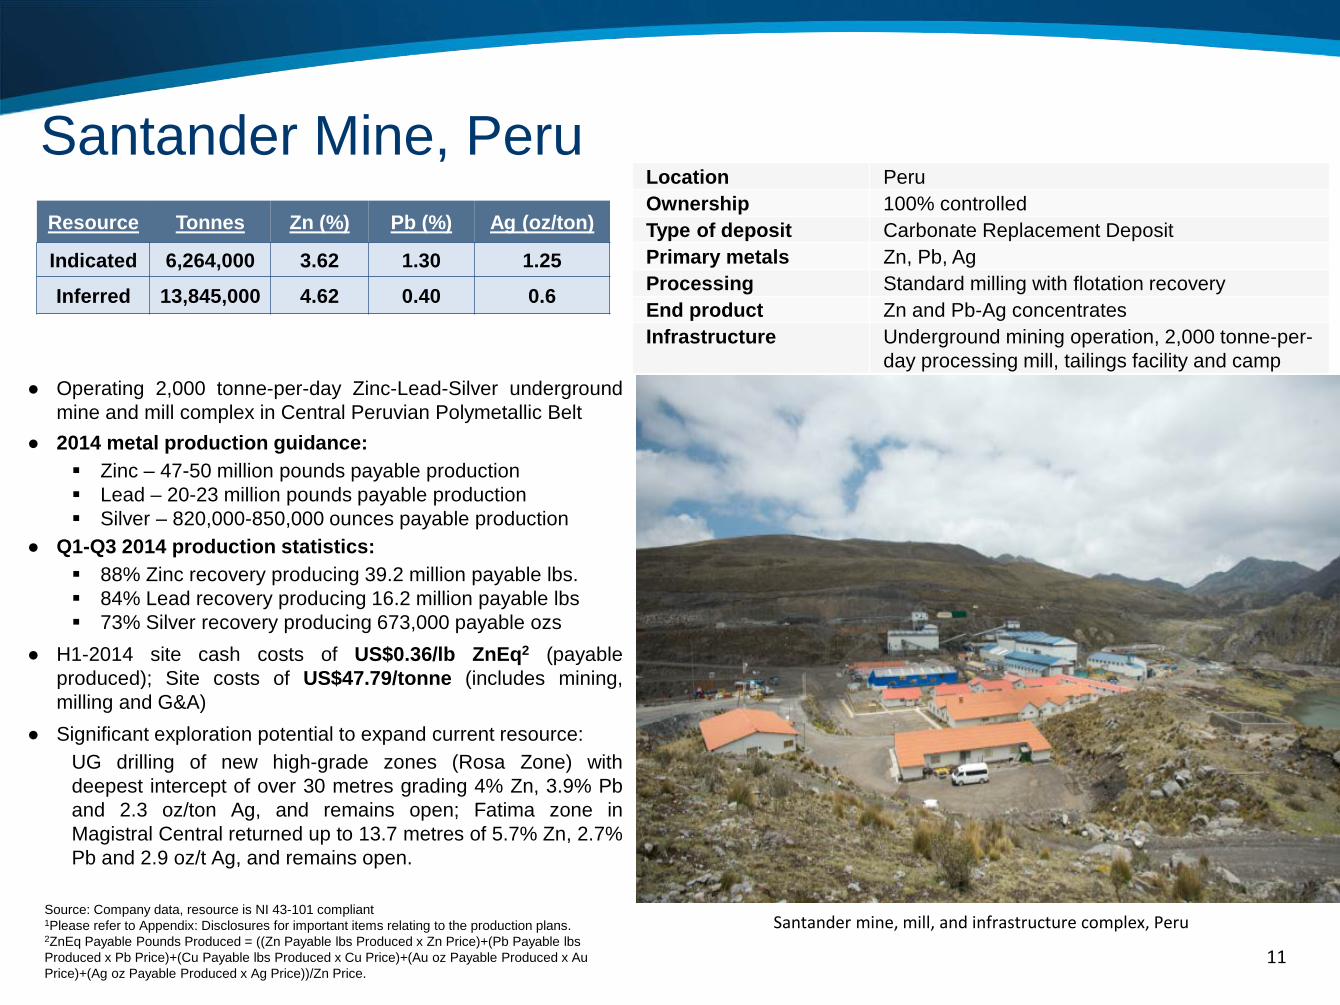
● Operating 2,000 tonne-per-day Zinc-Lead-Silver underground mine and mill complex in Central Peruvian Polymetallic Belt
● 2014 metal production guidance: Zinc – 47-50 million pounds payable production Lead – 20-23 million pounds payable production Silver – 820,000-850,000 ounces payable production
● Q1-Q3 2014 production statistics: 88% Zinc recovery producing 39.2 million payable lbs. 84% Lead recovery producing 16.2 million payable lbs 73% Silver recovery producing 673,000 payable ozs
● H1-2014 site cash costs of US$0.36/lb ZnEq2 (payable produced); Site costs of US$47.79/tonne (includes mining, milling and G&A)
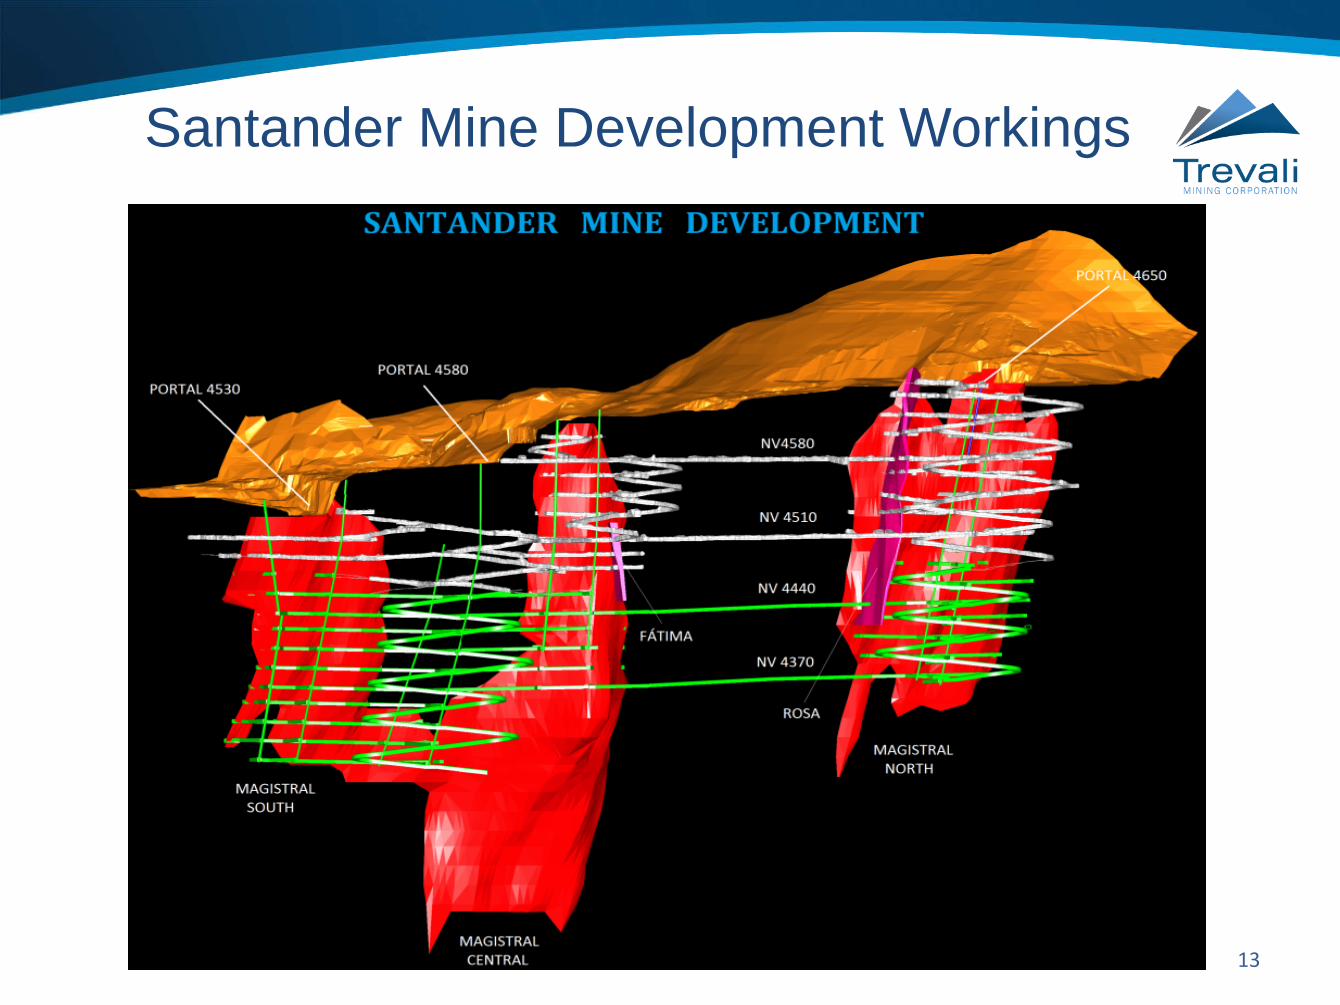
● Significant exploration potential to expand current resource: UG drilling of new high-grade zones (Rosa Zone) with deepest intercept of over 30 metres grading 4% Zn, 3.9% Pb and 2.3 oz/ton Ag, and remains open; Fatima zone in Magistral Central returned up to 13.7 metres of 5.7% Zn, 2.7% Pb and 2.9 oz/t Ag, and remains open.
Santander Mine, Peru
Source: Company data, resource is NI 43-101 compliant 1Please refer to Appendix: Disclosures for important items relating to the production plans. 2ZnEq Payable Pounds Produced = ((Zn Payable lbs Produced x Zn Price)+(Pb Payable lbs Produced x Pb Price)+(Cu Payable lbs Produced x Cu Price)+(Au oz Payable Produced x Au Price)+(Ag oz Payable Produced x Ag Price))/Zn Price.
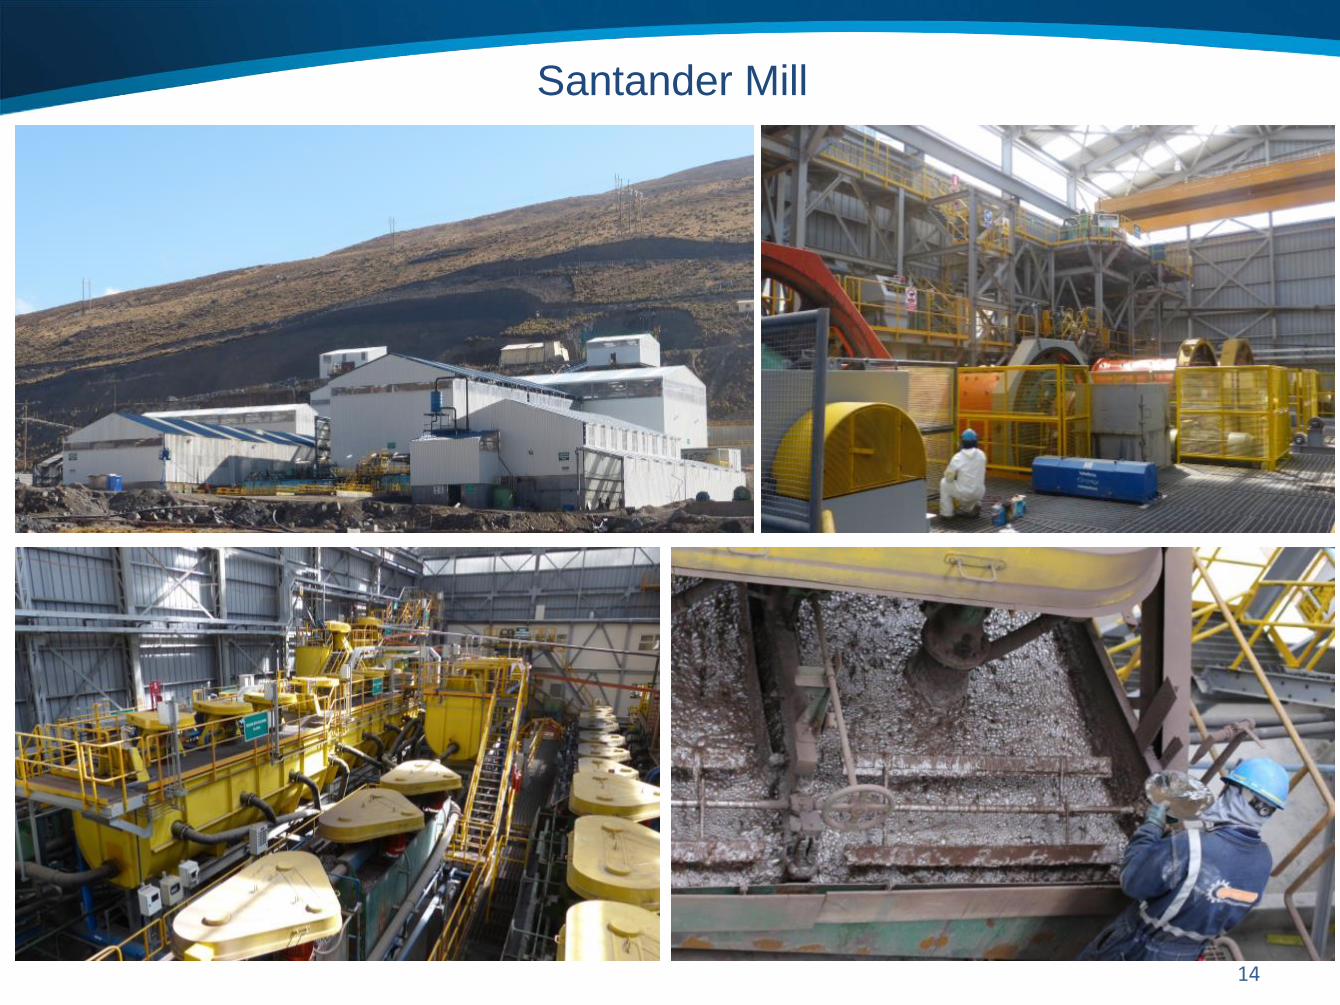
Location Peru Ownership 100% controlled Type of deposit Carbonate Replacement Deposit Primary metals Zn, Pb, Ag Processing Standard milling with flotation recovery End product Zn and Pb-Ag concentrates Infrastructure Underground mining operation, 2,000 tonne-per-
day processing mill, tailings facility and camp
Santander mine, mill, and infrastructure complex, Peru
Resource Tonnes Zn (%) Pb (%) Ag (oz/ton)
Indicated 6,264,000 3.62 1.30 1.25
Inferred 13,845,000 4.62 0.40 0.6
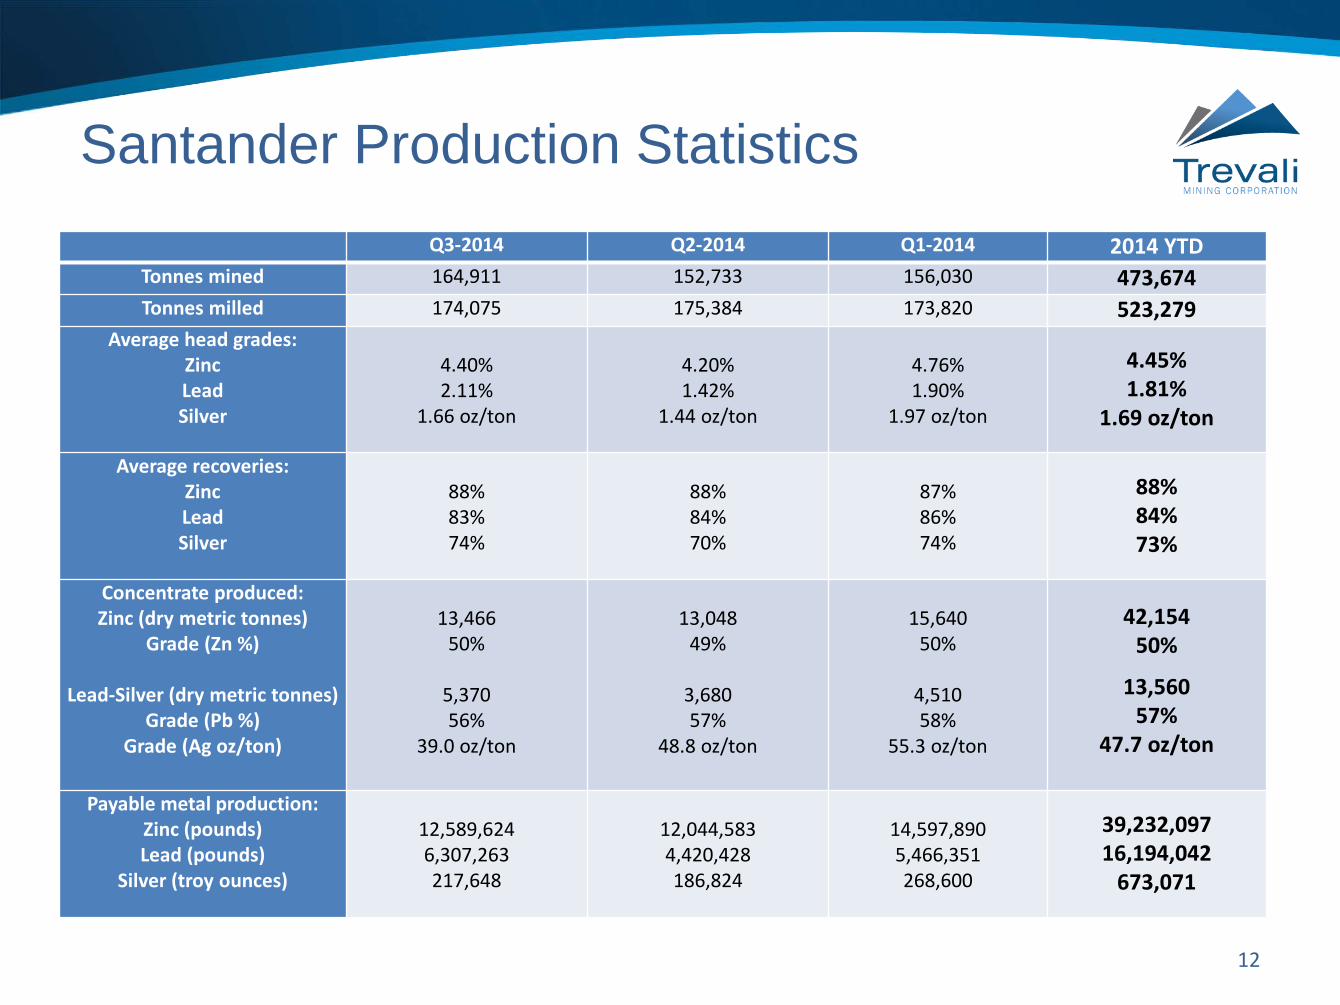
Santander Production Statistics Q3-2014 Q2-2014 Q1-2014 2014 YTD
Tonnes mined 164,911 152,733 156,030 473,674 Tonnes milled 174,075 175,384 173,820 523,279
Average head grades: Zinc Lead Silver
4.40% 2.11%
1.66 oz/ton
4.20% 1.42%
1.44 oz/ton
4.76% 1.90%
1.97 oz/ton
4.45% 1.81%
1.69 oz/ton
Average recoveries: Zinc Lead Silver
88% 83% 74%
88% 84% 70%
87% 86% 74%
88% 84% 73%
Concentrate produced: Zinc (dry metric tonnes)
Grade (Zn %)
Lead-Silver (dry metric tonnes) Grade (Pb %)
Grade (Ag oz/ton)
13,466
50%
5,370 56%
39.0 oz/ton
13,048
49%
3,680 57%
48.8 oz/ton
15,640
50%
4,510 58%
55.3 oz/ton
42,154
50%
13,560 57%
47.7 oz/ton
Payable metal production: Zinc (pounds) Lead (pounds)
Silver (troy ounces)
12,589,624 6,307,263 217,648
12,044,583 4,420,428 186,824
14,597,890 5,466,351 268,600
39,232,097 16,194,042
673,071
12
13
1
Santander Mine Development Workings
1
14
Santander Mill
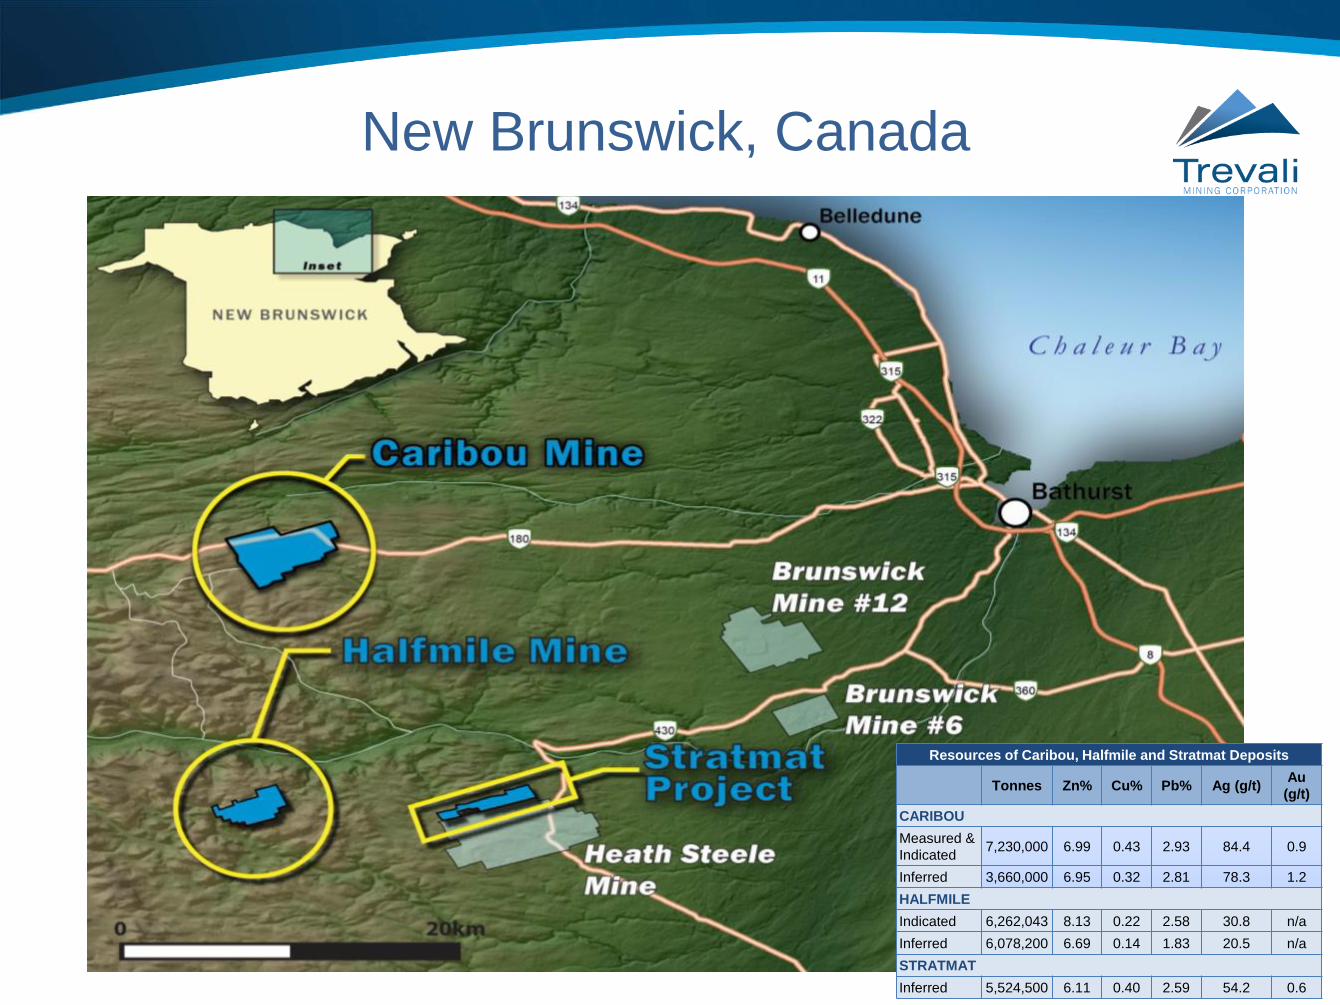
New Brunswick, Canada
15
Resources of Caribou, Halfmile and Stratmat Deposits
Tonnes Zn% Cu% Pb% Ag (g/t) Au (g/t)
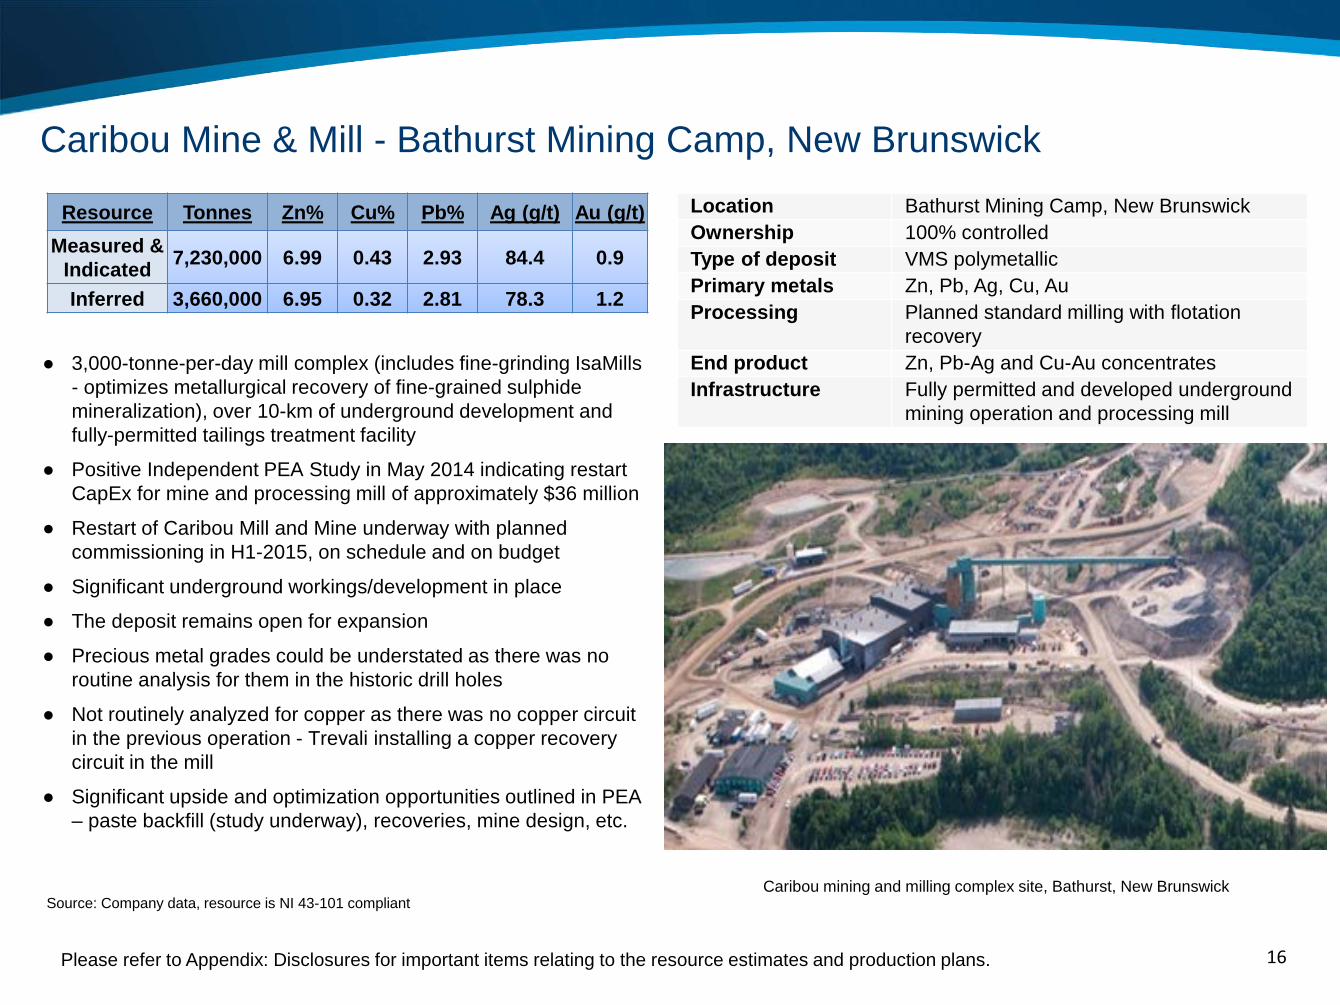
CARIBOU Measured & Indicated 7,230,000 6.99 0.43 2.93 84.4 0.9
Inferred 3,660,000 6.95 0.32 2.81 78.3 1.2 HALFMILE Indicated 6,262,043 8.13 0.22 2.58 30.8 n/a Inferred 6,078,200 6.69 0.14 1.83 20.5 n/a STRATMAT Inferred 5,524,500 6.11 0.40 2.59 54.2 0.6
16
● 3,000-tonne-per-day mill complex (includes fine-grinding IsaMills - optimizes metallurgical recovery of fine-grained sulphide mineralization), over 10-km of underground development and fully-permitted tailings treatment facility
● Positive Independent PEA Study in May 2014 indicating restart CapEx for mine and processing mill of approximately $36 million
● Restart of Caribou Mill and Mine underway with planned commissioning in H1-2015, on schedule and on budget
● Significant underground workings/development in place
● The deposit remains open for expansion
● Precious metal grades could be understated as there was no routine analysis for them in the historic drill holes
● Not routinely analyzed for copper as there was no copper circuit in the previous operation - Trevali installing a copper recovery circuit in the mill
● Significant upside and optimization opportunities outlined in PEA – paste backfill (study underway), recoveries, mine design, etc.
Caribou Mine & Mill - Bathurst Mining Camp, New Brunswick Location Bathurst Mining Camp, New Brunswick Ownership 100% controlled Type of deposit VMS polymetallic Primary metals Zn, Pb, Ag, Cu, Au Processing Planned standard milling with flotation
recovery End product Zn, Pb-Ag and Cu-Au concentrates Infrastructure Fully permitted and developed underground
mining operation and processing mill
Caribou mining and milling complex site, Bathurst, New Brunswick
Please refer to Appendix: Disclosures for important items relating to the resource estimates and production plans.
Resource Tonnes Zn% Cu% Pb% Ag (g/t) Au (g/t) Measured &
Indicated 7,230,000 6.99 0.43 2.93 84.4 0.9
Inferred 3,660,000 6.95 0.32 2.81 78.3 1.2
Source: Company data, resource is NI 43-101 compliant
17
1
NW
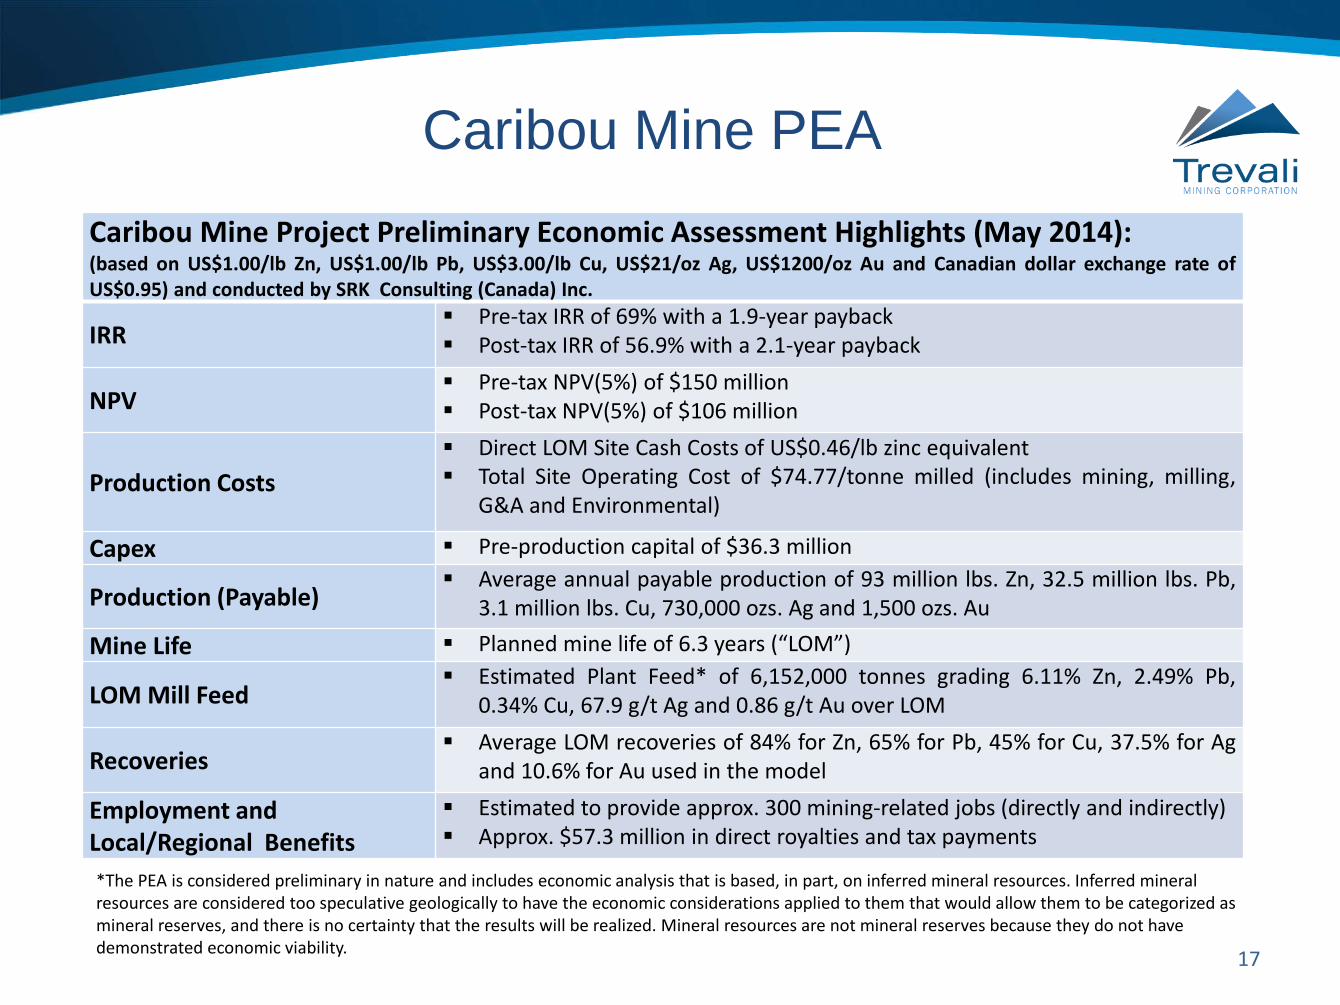
Caribou Mine PEA Caribou Mine Project Preliminary Economic Assessment Highlights (May 2014): (based on US$1.00/lb Zn, US$1.00/lb Pb, US$3.00/lb Cu, US$21/oz Ag, US$1200/oz Au and Canadian dollar exchange rate of US$0.95) and conducted by SRK Consulting (Canada) Inc.
IRR Pre-tax IRR of 69% with a 1.9-year payback Post-tax IRR of 56.9% with a 2.1-year payback
NPV Pre-tax NPV(5%) of $150 million Post-tax NPV(5%) of $106 million
Production Costs Direct LOM Site Cash Costs of US$0.46/lb zinc equivalent Total Site Operating Cost of $74.77/tonne milled (includes mining, milling,
G&A and Environmental)
Capex Pre-production capital of $36.3 million
Production (Payable) Average annual payable production of 93 million lbs. Zn, 32.5 million lbs. Pb,
3.1 million lbs. Cu, 730,000 ozs. Ag and 1,500 ozs. Au Mine Life Planned mine life of 6.3 years (“LOM”)
LOM Mill Feed Estimated Plant Feed* of 6,152,000 tonnes grading 6.11% Zn, 2.49% Pb,
0.34% Cu, 67.9 g/t Ag and 0.86 g/t Au over LOM
Recoveries Average LOM recoveries of 84% for Zn, 65% for Pb, 45% for Cu, 37.5% for Ag
and 10.6% for Au used in the model
Employment and Local/Regional Benefits
Estimated to provide approx. 300 mining-related jobs (directly and indirectly) Approx. $57.3 million in direct royalties and tax payments
*The PEA is considered preliminary in nature and includes economic analysis that is based, in part, on inferred mineral resources. Inferred mineral resources are considered too speculative geologically to have the economic considerations applied to them that would allow them to be categorized as mineral reserves, and there is no certainty that the results will be realized. Mineral resources are not mineral reserves because they do not have demonstrated economic viability.
18
1
NW
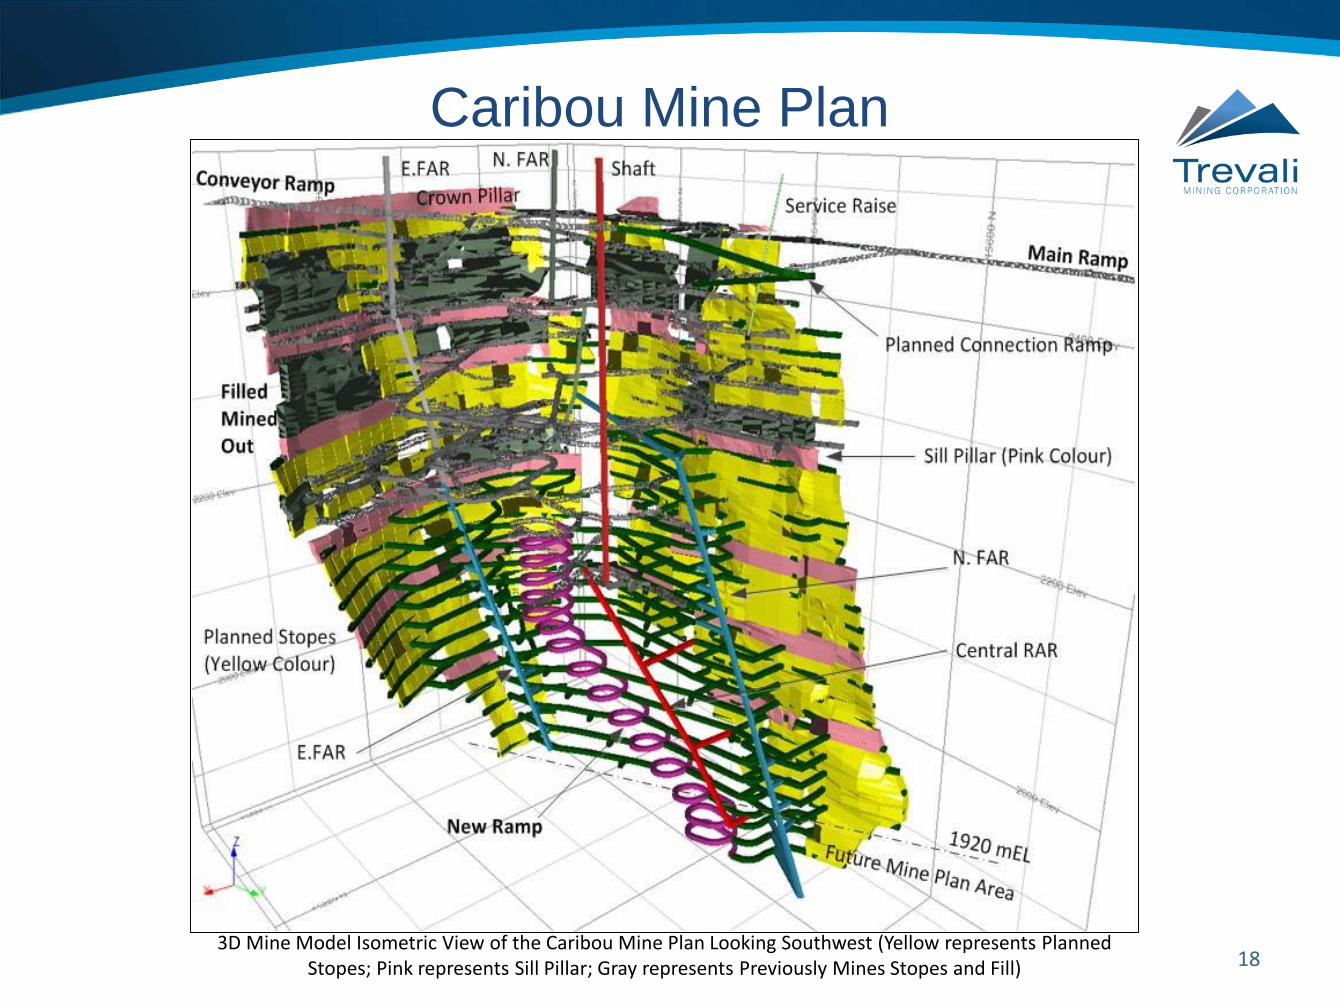
Caribou Mine Plan
3D Mine Model Isometric View of the Caribou Mine Plan Looking Southwest (Yellow represents Planned Stopes; Pink represents Sill Pillar; Gray represents Previously Mines Stopes and Fill)
19
1
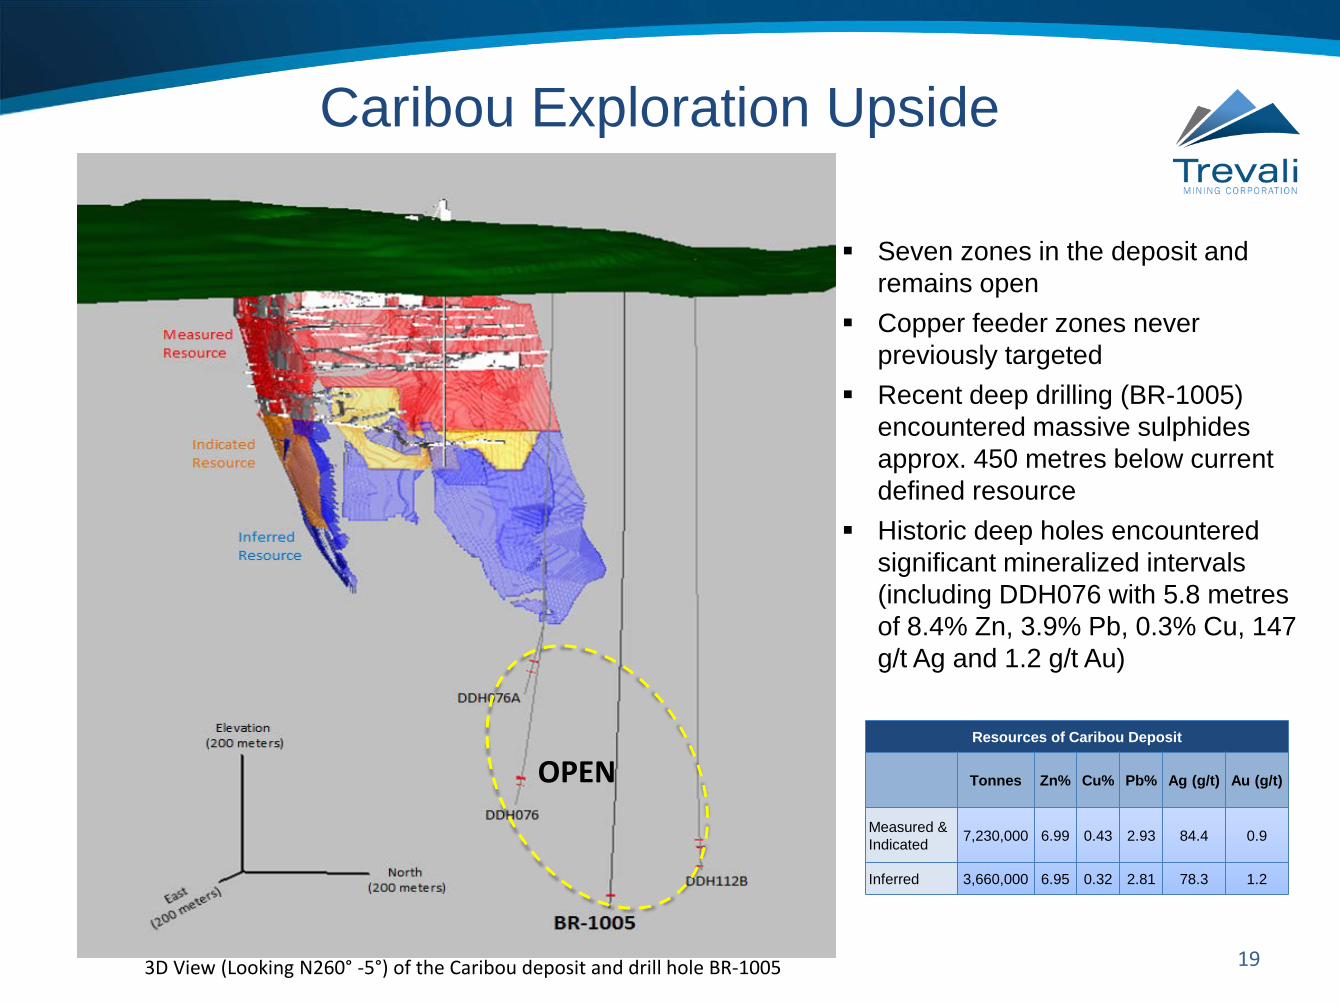
NW Seven zones in the deposit and remains open
Copper feeder zones never previously targeted
Recent deep drilling (BR-1005) encountered massive sulphides approx. 450 metres below current defined resource
Historic deep holes encountered significant mineralized intervals (including DDH076 with 5.8 metres of 8.4% Zn, 3.9% Pb, 0.3% Cu, 147 g/t Ag and 1.2 g/t Au)
Caribou Exploration Upside
Resources of Caribou Deposit
Tonnes Zn% Cu% Pb% Ag (g/t) Au (g/t)
Measured & Indicated 7,230,000 6.99 0.43 2.93 84.4 0.9
Inferred 3,660,000 6.95 0.32 2.81 78.3 1.2
3D View (Looking N260° -5°) of the Caribou deposit and drill hole BR-1005
OPEN
20
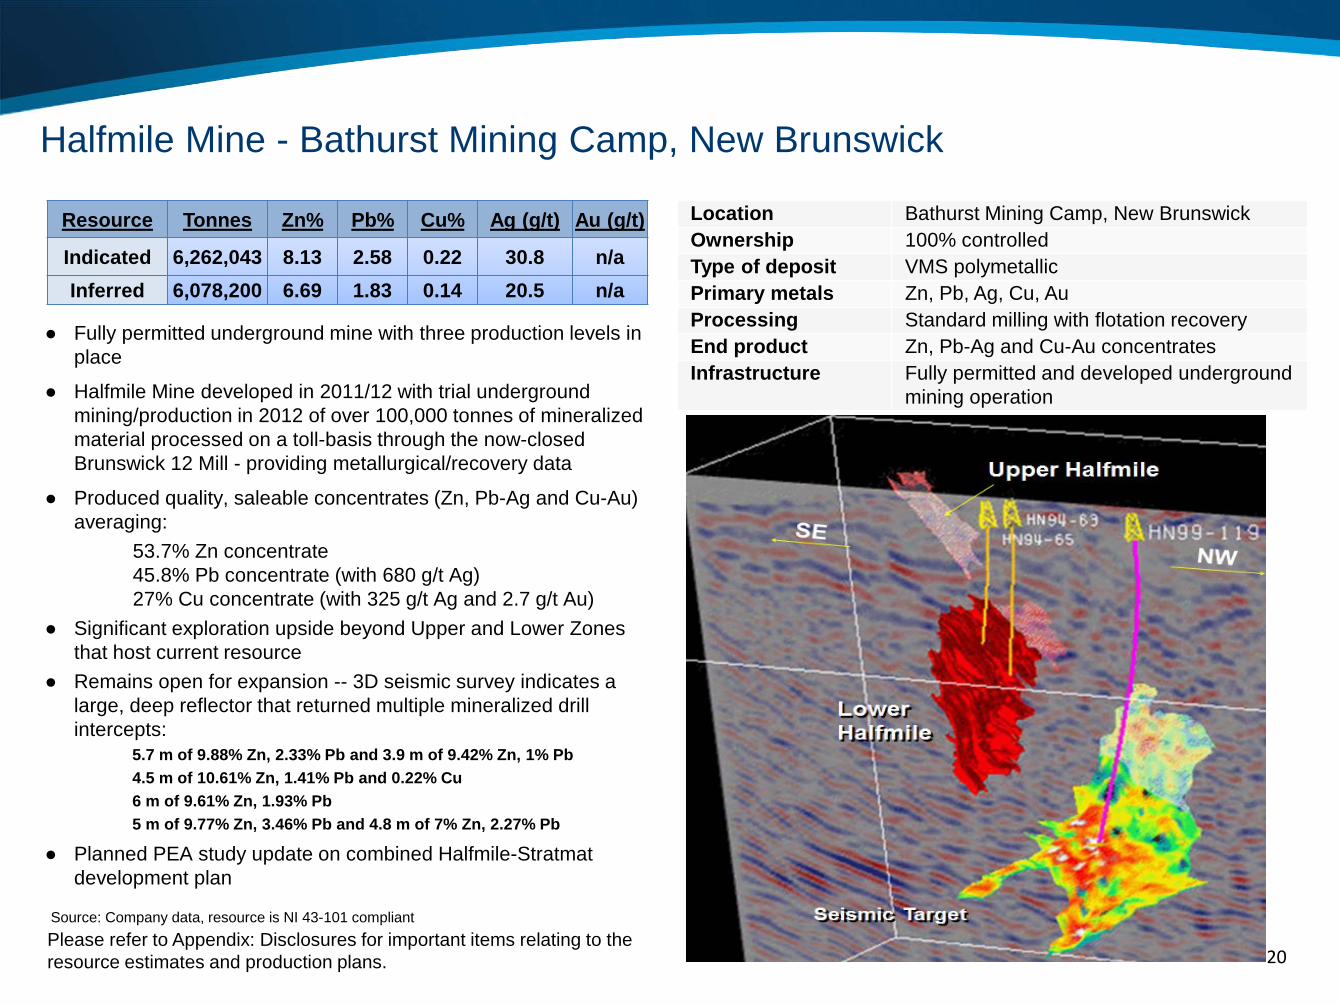
● Fully permitted underground mine with three production levels in place
● Halfmile Mine developed in 2011/12 with trial underground mining/production in 2012 of over 100,000 tonnes of mineralized material processed on a toll-basis through the now-closed Brunswick 12 Mill - providing metallurgical/recovery data
● Produced quality, saleable concentrates (Zn, Pb-Ag and Cu-Au) averaging:
53.7% Zn concentrate 45.8% Pb concentrate (with 680 g/t Ag) 27% Cu concentrate (with 325 g/t Ag and 2.7 g/t Au)
● Significant exploration upside beyond Upper and Lower Zones that host current resource
● Remains open for expansion -- 3D seismic survey indicates a large, deep reflector that returned multiple mineralized drill intercepts:
5.7 m of 9.88% Zn, 2.33% Pb and 3.9 m of 9.42% Zn, 1% Pb 4.5 m of 10.61% Zn, 1.41% Pb and 0.22% Cu 6 m of 9.61% Zn, 1.93% Pb 5 m of 9.77% Zn, 3.46% Pb and 4.8 m of 7% Zn, 2.27% Pb
● Planned PEA study update on combined Halfmile-Stratmat development plan
Halfmile Mine - Bathurst Mining Camp, New Brunswick
Location Bathurst Mining Camp, New Brunswick Ownership 100% controlled Type of deposit VMS polymetallic Primary metals Zn, Pb, Ag, Cu, Au Processing Standard milling with flotation recovery End product Zn, Pb-Ag and Cu-Au concentrates Infrastructure Fully permitted and developed underground
mining operation
Source: Company data, resource is NI 43-101 compliant Please refer to Appendix: Disclosures for important items relating to the resource estimates and production plans.
Resource Tonnes Zn% Pb% Cu% Ag (g/t) Au (g/t)
Indicated 6,262,043 8.13 2.58 0.22 30.8 n/a Inferred 6,078,200 6.69 1.83 0.14 20.5 n/a
21
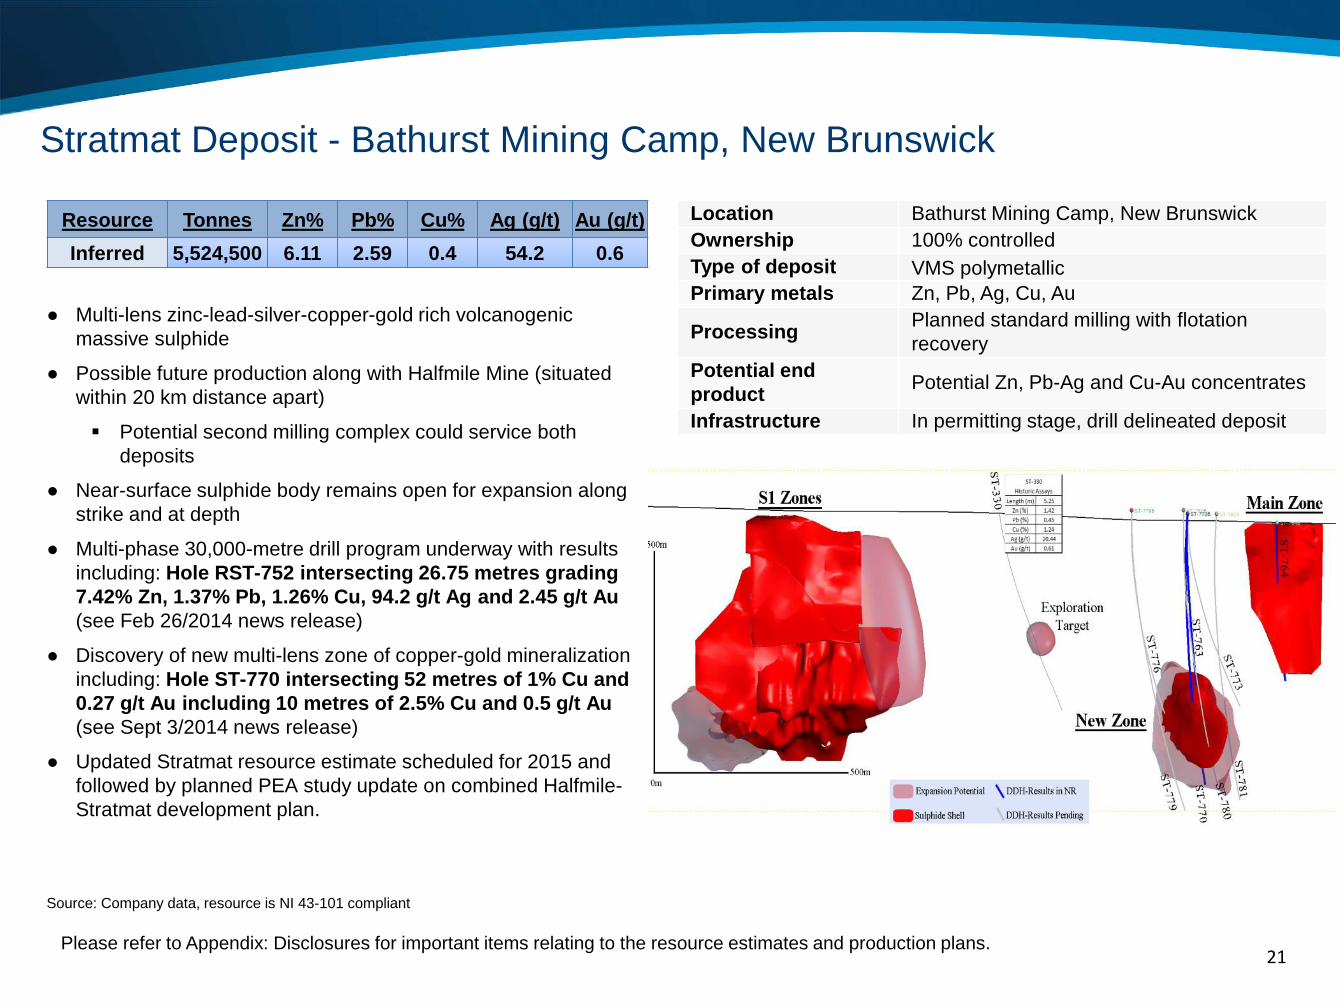
● Multi-lens zinc-lead-silver-copper-gold rich volcanogenic massive sulphide
● Possible future production along with Halfmile Mine (situated within 20 km distance apart)
Potential second milling complex could service both deposits
● Near-surface sulphide body remains open for expansion along strike and at depth
● Multi-phase 30,000-metre drill program underway with results including: Hole RST-752 intersecting 26.75 metres grading 7.42% Zn, 1.37% Pb, 1.26% Cu, 94.2 g/t Ag and 2.45 g/t Au (see Feb 26/2014 news release)
● Discovery of new multi-lens zone of copper-gold mineralization including: Hole ST-770 intersecting 52 metres of 1% Cu and 0.27 g/t Au including 10 metres of 2.5% Cu and 0.5 g/t Au (see Sept 3/2014 news release)
● Updated Stratmat resource estimate scheduled for 2015 and followed by planned PEA study update on combined Halfmile-Stratmat development plan.
Stratmat Deposit - Bathurst Mining Camp, New Brunswick
Source: Company data, resource is NI 43-101 compliant
Location Bathurst Mining Camp, New Brunswick Ownership 100% controlled Type of deposit VMS polymetallic Primary metals Zn, Pb, Ag, Cu, Au
Processing Planned standard milling with flotation recovery
Potential end product Potential Zn, Pb-Ag and Cu-Au concentrates
Infrastructure In permitting stage, drill delineated deposit
Please refer to Appendix: Disclosures for important items relating to the resource estimates and production plans.
Resource Tonnes Zn% Pb% Cu% Ag (g/t) Au (g/t) Inferred 5,524,500 6.11 2.59 0.4 54.2 0.6
New Brunswick Summary
Trevali has emerged as the dominant mining company in New Brunswick’s prolific Bathurst Mining Camp:
Multiple, advanced-stage Zn-Pb-Ag-Cu-Au deposits Fully permitted at Caribou and Halfmile Mines 3,000-tonne-per-day mill complex at Caribou First Nations Impact Benefit Agreement in place Positive PEA on Caribou mine model Caribou mine fully financed to production Caribou production on schedule to commence in H1-2015 All deposits (Caribou, Halfmile & Stratmat) are open for expansion Available, highly-skilled workforce following closure of Glencore
Xstrata’s Brunswick 12 Mine and Mill in 2013
22
Contact Information
23
TREVALI MINING CORPORATION 2300-1177 West Hastings Street Vancouver, BC, Canada, V6E 2K3 Phone: 1-604-488-1661 Fax: 1-604-408-7499 www.trevali.com
CONTACT: Steve Stakiw Vice President, Investor Relations and Corporate Communications [email protected] Direct phone:1-604-638-5623
A member of the
Appendix: Resources & Contained Metal
24
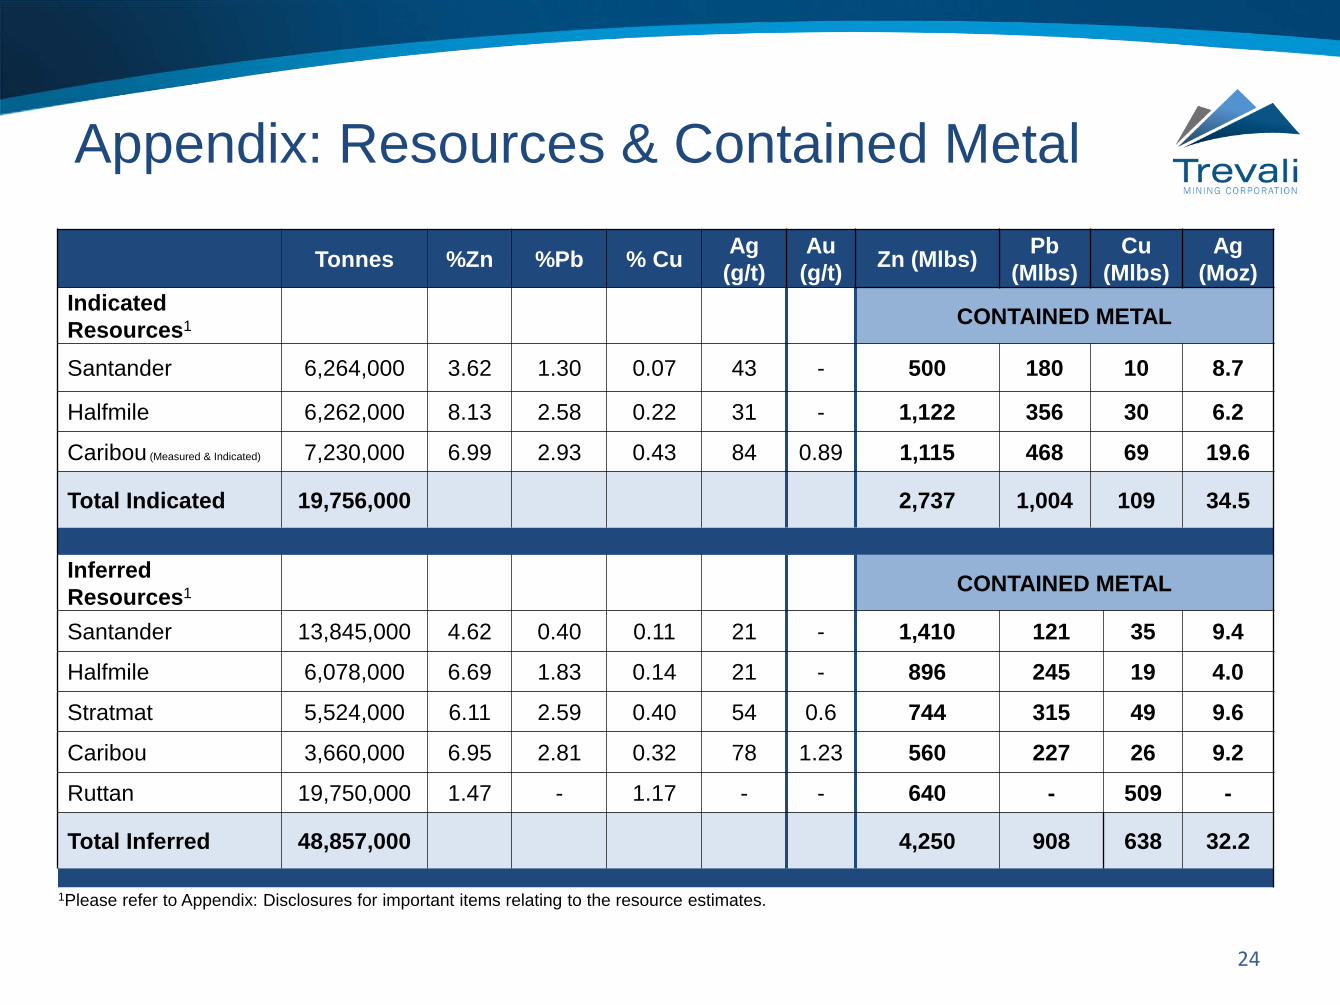
Tonnes %Zn %Pb % Cu Ag (g/t)
Au (g/t) Zn (Mlbs) Pb
(Mlbs) Cu
(Mlbs) Ag
(Moz) Indicated Resources1 CONTAINED METAL
Santander 6,264,000 3.62 1.30 0.07 43 - 500 180 10 8.7
Halfmile 6,262,000 8.13 2.58 0.22 31 - 1,122 356 30 6.2
Caribou (Measured & Indicated) 7,230,000 6.99 2.93 0.43 84 0.89 1,115 468 69 19.6
Total Indicated 19,756,000 2,737 1,004 109 34.5
Inferred Resources1 CONTAINED METAL
Santander 13,845,000 4.62 0.40 0.11 21 - 1,410 121 35 9.4
Halfmile 6,078,000 6.69 1.83 0.14 21 - 896 245 19 4.0
Stratmat 5,524,000 6.11 2.59 0.40 54 0.6 744 315 49 9.6
Caribou 3,660,000 6.95 2.81 0.32 78 1.23 560 227 26 9.2
Ruttan 19,750,000 1.47 - 1.17 - - 640 - 509 -
Total Inferred 48,857,000 4,250 908 638 32.2
1Please refer to Appendix: Disclosures for important items relating to the resource estimates.
Appendix: Options and Warrants
25
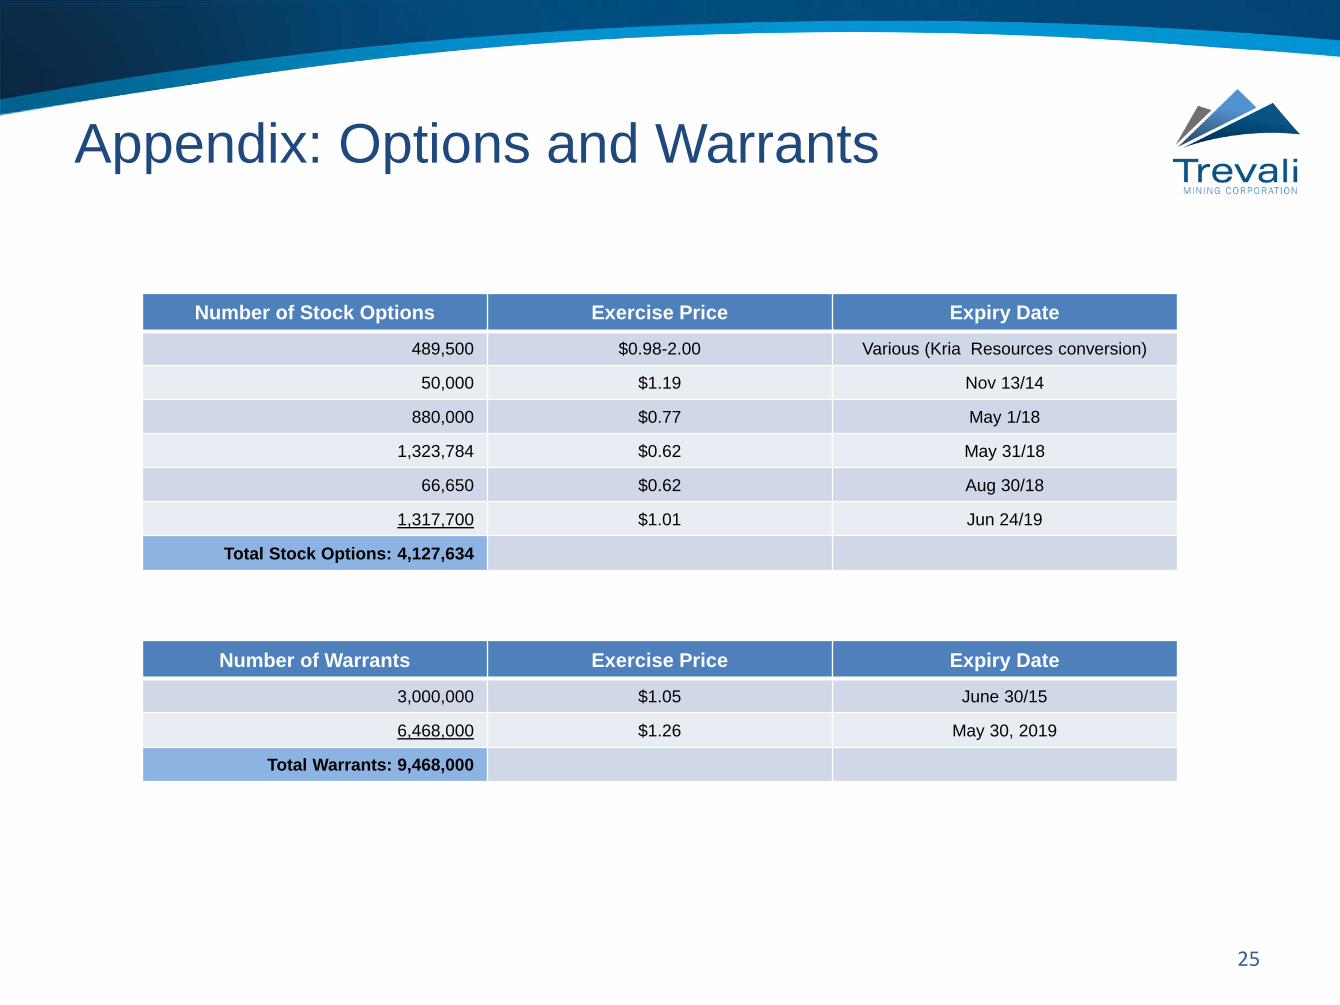
Number of Warrants Exercise Price Expiry Date
3,000,000 $1.05 June 30/15
6,468,000 $1.26 May 30, 2019
Total Warrants: 9,468,000
Number of Stock Options Exercise Price Expiry Date
489,500 $0.98-2.00 Various (Kria Resources conversion)
50,000 $1.19 Nov 13/14
880,000 $0.77 May 1/18
1,323,784 $0.62 May 31/18
66,650 $0.62 Aug 30/18
1,317,700 $1.01 Jun 24/19
Total Stock Options: 4,127,634
Appendix: Mining Analyst Coverage
26
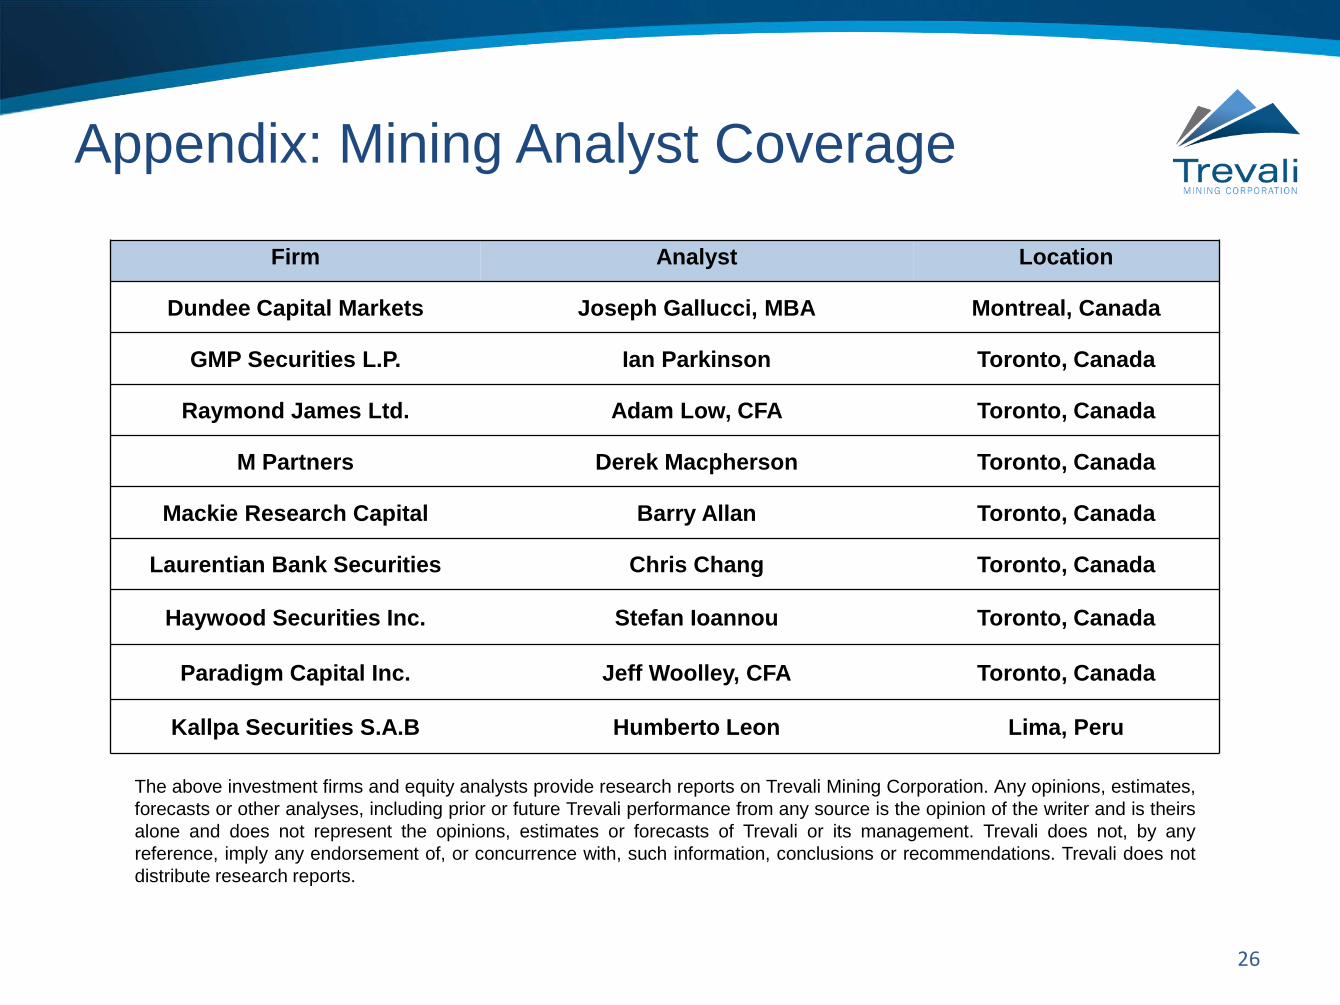
Firm Analyst Location
Dundee Capital Markets Joseph Gallucci, MBA Montreal, Canada
GMP Securities L.P. Ian Parkinson Toronto, Canada
Raymond James Ltd. Adam Low, CFA Toronto, Canada
M Partners Derek Macpherson Toronto, Canada
Mackie Research Capital Barry Allan Toronto, Canada
Laurentian Bank Securities Chris Chang Toronto, Canada
Haywood Securities Inc. Stefan Ioannou Toronto, Canada
Paradigm Capital Inc. Jeff Woolley, CFA Toronto, Canada
Kallpa Securities S.A.B Humberto Leon Lima, Peru
The above investment firms and equity analysts provide research reports on Trevali Mining Corporation. Any opinions, estimates, forecasts or other analyses, including prior or future Trevali performance from any source is the opinion of the writer and is theirs alone and does not represent the opinions, estimates or forecasts of Trevali or its management. Trevali does not, by any reference, imply any endorsement of, or concurrence with, such information, conclusions or recommendations. Trevali does not distribute research reports.
Appendix: Disclosures
27
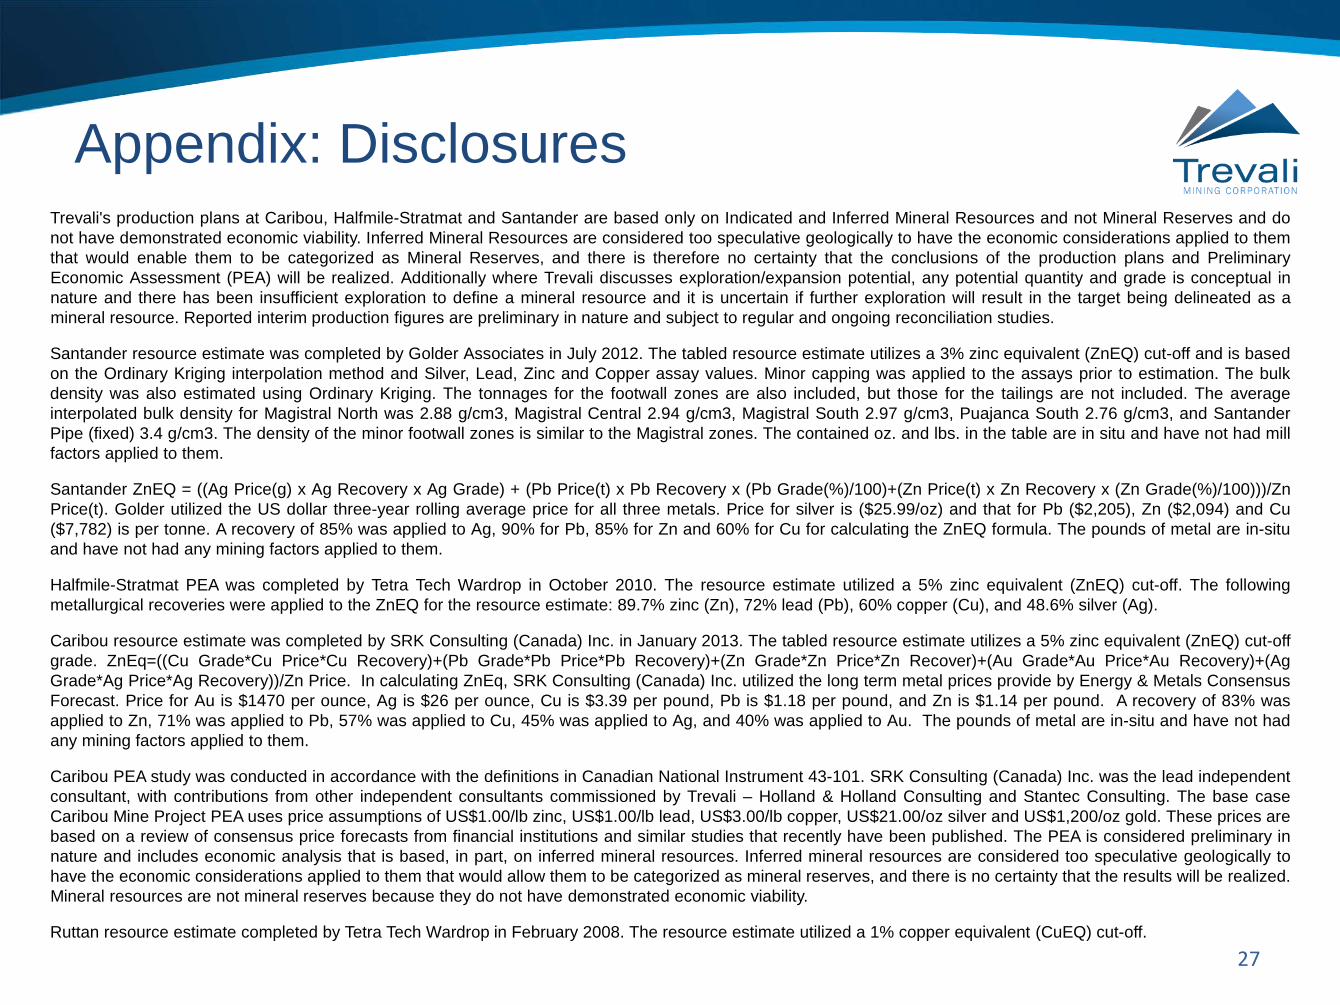
Trevali's production plans at Caribou, Halfmile-Stratmat and Santander are based only on Indicated and Inferred Mineral Resources and not Mineral Reserves and do not have demonstrated economic viability. Inferred Mineral Resources are considered too speculative geologically to have the economic considerations applied to them that would enable them to be categorized as Mineral Reserves, and there is therefore no certainty that the conclusions of the production plans and Preliminary Economic Assessment (PEA) will be realized. Additionally where Trevali discusses exploration/expansion potential, any potential quantity and grade is conceptual in nature and there has been insufficient exploration to define a mineral resource and it is uncertain if further exploration will result in the target being delineated as a mineral resource. Reported interim production figures are preliminary in nature and subject to regular and ongoing reconciliation studies. Santander resource estimate was completed by Golder Associates in July 2012. The tabled resource estimate utilizes a 3% zinc equivalent (ZnEQ) cut-off and is based on the Ordinary Kriging interpolation method and Silver, Lead, Zinc and Copper assay values. Minor capping was applied to the assays prior to estimation. The bulk density was also estimated using Ordinary Kriging. The tonnages for the footwall zones are also included, but those for the tailings are not included. The average interpolated bulk density for Magistral North was 2.88 g/cm3, Magistral Central 2.94 g/cm3, Magistral South 2.97 g/cm3, Puajanca South 2.76 g/cm3, and Santander Pipe (fixed) 3.4 g/cm3. The density of the minor footwall zones is similar to the Magistral zones. The contained oz. and lbs. in the table are in situ and have not had mill factors applied to them. Santander ZnEQ = ((Ag Price(g) x Ag Recovery x Ag Grade) + (Pb Price(t) x Pb Recovery x (Pb Grade(%)/100)+(Zn Price(t) x Zn Recovery x (Zn Grade(%)/100)))/Zn Price(t). Golder utilized the US dollar three-year rolling average price for all three metals. Price for silver is ($25.99/oz) and that for Pb ($2,205), Zn ($2,094) and Cu ($7,782) is per tonne. A recovery of 85% was applied to Ag, 90% for Pb, 85% for Zn and 60% for Cu for calculating the ZnEQ formula. The pounds of metal are in-situ and have not had any mining factors applied to them. Halfmile-Stratmat PEA was completed by Tetra Tech Wardrop in October 2010. The resource estimate utilized a 5% zinc equivalent (ZnEQ) cut-off. The following metallurgical recoveries were applied to the ZnEQ for the resource estimate: 89.7% zinc (Zn), 72% lead (Pb), 60% copper (Cu), and 48.6% silver (Ag). Caribou resource estimate was completed by SRK Consulting (Canada) Inc. in January 2013. The tabled resource estimate utilizes a 5% zinc equivalent (ZnEQ) cut-off grade. ZnEq=((Cu Grade*Cu Price*Cu Recovery)+(Pb Grade*Pb Price*Pb Recovery)+(Zn Grade*Zn Price*Zn Recover)+(Au Grade*Au Price*Au Recovery)+(Ag Grade*Ag Price*Ag Recovery))/Zn Price. In calculating ZnEq, SRK Consulting (Canada) Inc. utilized the long term metal prices provide by Energy & Metals Consensus Forecast. Price for Au is $1470 per ounce, Ag is $26 per ounce, Cu is $3.39 per pound, Pb is $1.18 per pound, and Zn is $1.14 per pound. A recovery of 83% was applied to Zn, 71% was applied to Pb, 57% was applied to Cu, 45% was applied to Ag, and 40% was applied to Au. The pounds of metal are in-situ and have not had any mining factors applied to them. Caribou PEA study was conducted in accordance with the definitions in Canadian National Instrument 43-101. SRK Consulting (Canada) Inc. was the lead independent consultant, with contributions from other independent consultants commissioned by Trevali – Holland & Holland Consulting and Stantec Consulting. The base case Caribou Mine Project PEA uses price assumptions of US$1.00/lb zinc, US$1.00/lb lead, US$3.00/lb copper, US$21.00/oz silver and US$1,200/oz gold. These prices are based on a review of consensus price forecasts from financial institutions and similar studies that recently have been published. The PEA is considered preliminary in nature and includes economic analysis that is based, in part, on inferred mineral resources. Inferred mineral resources are considered too speculative geologically to have the economic considerations applied to them that would allow them to be categorized as mineral reserves, and there is no certainty that the results will be realized. Mineral resources are not mineral reserves because they do not have demonstrated economic viability. Ruttan resource estimate completed by Tetra Tech Wardrop in February 2008. The resource estimate utilized a 1% copper equivalent (CuEQ) cut-off.