Embed Size (px)
Citation preview

Hitotsubashi University Repository
Title Zombie Firms and Economic Stagnation in Japan
Author(s) Ahearne, Alan G.; Shinada, Naoki
Citation
Issue Date 2005-06
Type Technical Report
Text Version publisher
URL http://hdl.handle.net/10086/13991
Right

Hi-Stat
Discussion Paper Series
No.95
Zombie Firms and Economic Stagnation in Japan
Alan G. Ahearne and Naoki Shinada
June 2005
Hitotsubashi University Research Unit for Statistical Analysis in Social Sciences
A 21st-Century COE Program
Institute of Economic Research
Hitotsubashi University Kunitachi, Tokyo, 186-8603 Japan
http://hi-stat.ier.hit-u.ac.jp/
Zombie Firms and Economic Stagnation in Japan
Alan G. Ahearne and Naoki Shinada*
Abstract
It is often claimed that one contributing factor to Japan’s weak economic performance over the
past decade is that Japanese banks have continued to provide financial support for highly
inefficient, debt-ridden companies, commonly referred to as “zombie” firms. Such poor banking
practices in turn prevent more productive companies from gaining market share, strangling a
potentially important source of productivity gains for the overall economy. To explore further the
zombie-firm hypothesis, we use industry- and firm-level Japanese data and find evidence that
productivity growth is low in industries reputed to have heavy concentrations of zombie firms.
We also find that the reallocation of market share is going in the wrong direction in these
industries, adding to already weak productivity performance. In addition, we find evidence that
financial support from Japanese banks may have played a role in sustaining this perverse
reallocation of market share.
Keywords: Productivity, banking system, creative destruction. Email: Alan Ahearne <[email protected]>; Naoki Shinada <[email protected]>
Zombie Firms and Economic Stagnation in Japan
Alan G. Ahearne and Naoki Shinada1
1. INTRODUCTION
It is often claimed that one factor contributing to Japan’s economic weakness over the
past decade is that Japanese banks have continued to provide financial support for highly
inefficient, debt-ridden companies, commonly referred to as “zombie” firms. 2 Measured
productivity growth of these firms has tended to be very low or even negative for many years,
putting a significant drag on the productivity performance of the Japanese economy. Moreover,
zombie firms prevent more productive companies from gaining market share, strangling a
potentially important source of productivity gains for the overall economy. In this paper, we use
industry- and firm-level data to explore this zombie-firm hypothesis, focusing on the construction,
wholesale, and retailing industries, which previous studies have pointed to as having heavy
concentrations of such firms.3
At the industry level, we find significant differences in productivity performance between
traded- and non-traded-goods sectors. Industries in which competitive pressures are most intense,
1 ALAN G. AHEARNE: Division of International Finance, Board of Governors of the Federal Reserve
System, [email protected]. NAOKI SHINADA: Development Bank of Japan, [email protected].
We are grateful to Patrick McGuire and participants in the Tokyo and Ann Arbor conferences for helpful
comments. All errors remain ours. The views in this paper are solely the responsibility of the authors and
should not be interpreted as reflecting the views of the Development Bank of Japan, the Board of
Governors of the Federal Reserve System or of any other person associated with the Federal Reserve
System
2 See, for example, Caballero, Hoshi and Kashyap (2003), Caballero and Kashyap (2002), The Economist
(2004), Feldman (2002), and Lincoln (2001).
3 Previous studies include Caballero, Hoshi and Kashyap (2003) and Peek and Rosengren (2003).
2
such as export-oriented sectors, tend to perform relatively well. In contrast, industries where
competition is suppressed—and where zombie firms reputably are prominent—display weak
productivity growth. Focusing on these poorly performing industries, we use firm-level data to
provide evidence that the reallocation of market share is going in the wrong direction, adding to
already poor productivity performance. Moreover, it appears that highly inefficient firms are
being sustained in large part by financial support from Japanese banks. In turn, these poor
banking practices are likely contributing to problems in the Japanese banking sector (see, for
example, Smith [2003]).
The rest of the paper is structured as follows. In the next section, we present some
estimates of recent productivity growth in Japan, both at an aggregate and industry level. The
third section summarizes a simple theoretical model of creative destruction, in which the banking
system is assigned a critical role in reallocating resources to their most efficient use. The fourth
section presents empirical evidence on the sources of low productivity growth and the allocation
of bank credit in a range of industries based on firm-level data. The final section outlines the
policy implications of our results.
2. PRODUCTIVITY PERFORMANCE
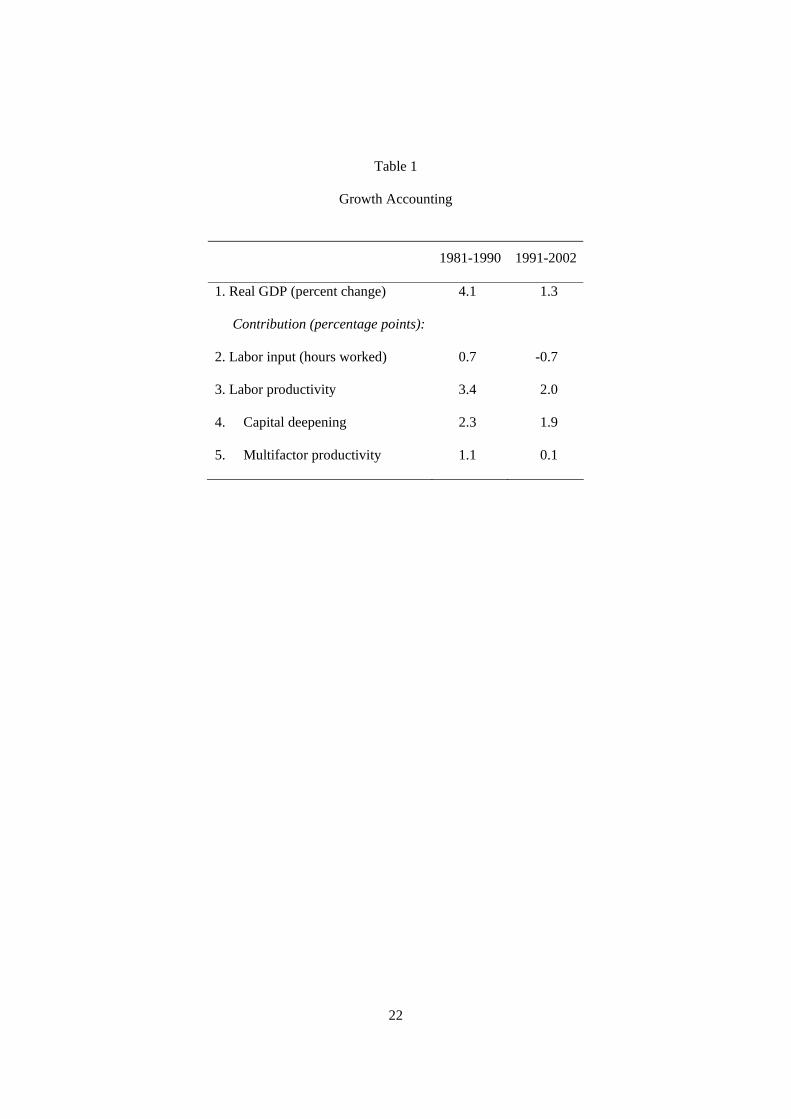
Table 1 reports results of a standard growth accounting exercise applied to Japanese
GDP.4 Of the sharp slowdown in real GDP growth since the early 1990s, half can be attributed to
4 The results in Table 1 are based on a standard framework for growth-accounting analysis, where labor
productivity growth is measured as the difference between the growth of output and the growth of the
number of hours worked. Multifactor productivity growth is measured as the difference between output
growth and total input growth. This measure, also known as the Solow residual, reflects the influence of
technological change not already embodied in new capital. This residual also reflects measurement errors
and cyclical factors not captured elsewhere. Total input growth is measured as a weighted average of labor
hours growth and capital growth. The weight for labor is this factor’s income share; one minus the share of
3
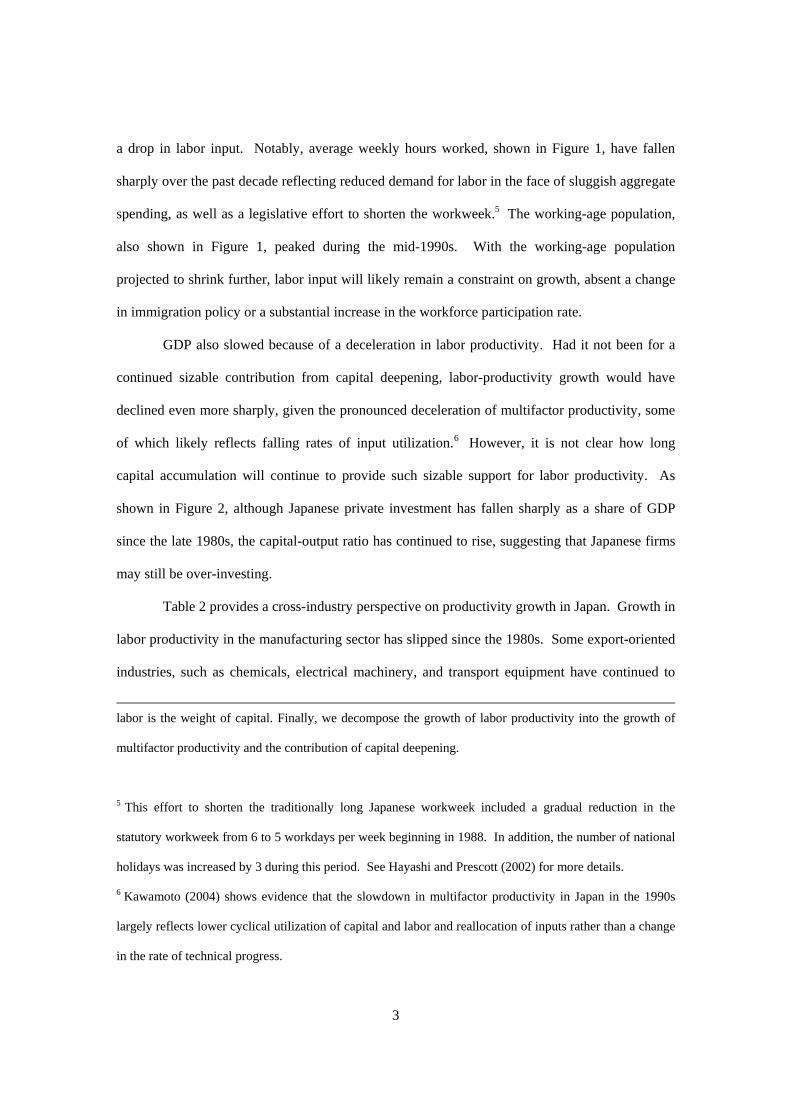
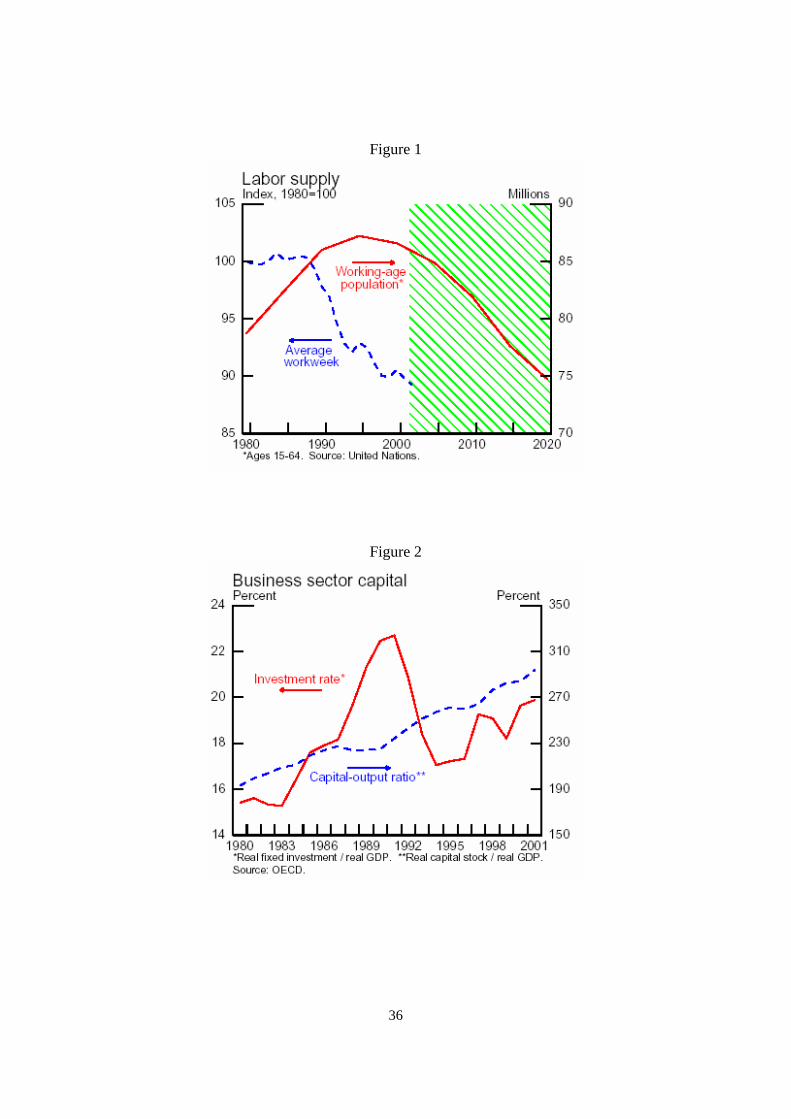
a drop in labor input. Notably, average weekly hours worked, shown in Figure 1, have fallen
sharply over the past decade reflecting reduced demand for labor in the face of sluggish aggregate
spending, as well as a legislative effort to shorten the workweek.5 The working-age population,
also shown in Figure 1, peaked during the mid-1990s. With the working-age population
projected to shrink further, labor input will likely remain a constraint on growth, absent a change
in immigration policy or a substantial increase in the workforce participation rate.
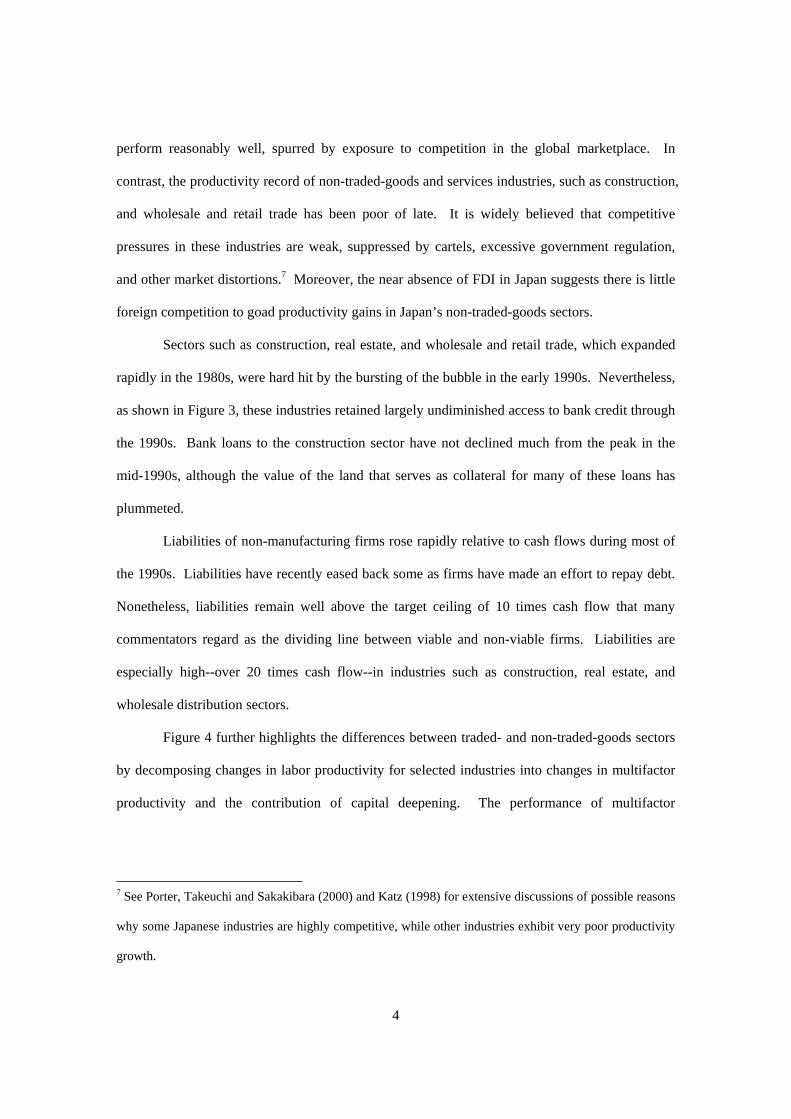
GDP also slowed because of a deceleration in labor productivity. Had it not been for a
continued sizable contribution from capital deepening, labor-productivity growth would have
declined even more sharply, given the pronounced deceleration of multifactor productivity, some
of which likely reflects falling rates of input utilization.6 However, it is not clear how long
capital accumulation will continue to provide such sizable support for labor productivity. As
shown in Figure 2, although Japanese private investment has fallen sharply as a share of GDP
since the late 1980s, the capital-output ratio has continued to rise, suggesting that Japanese firms
may still be over-investing.
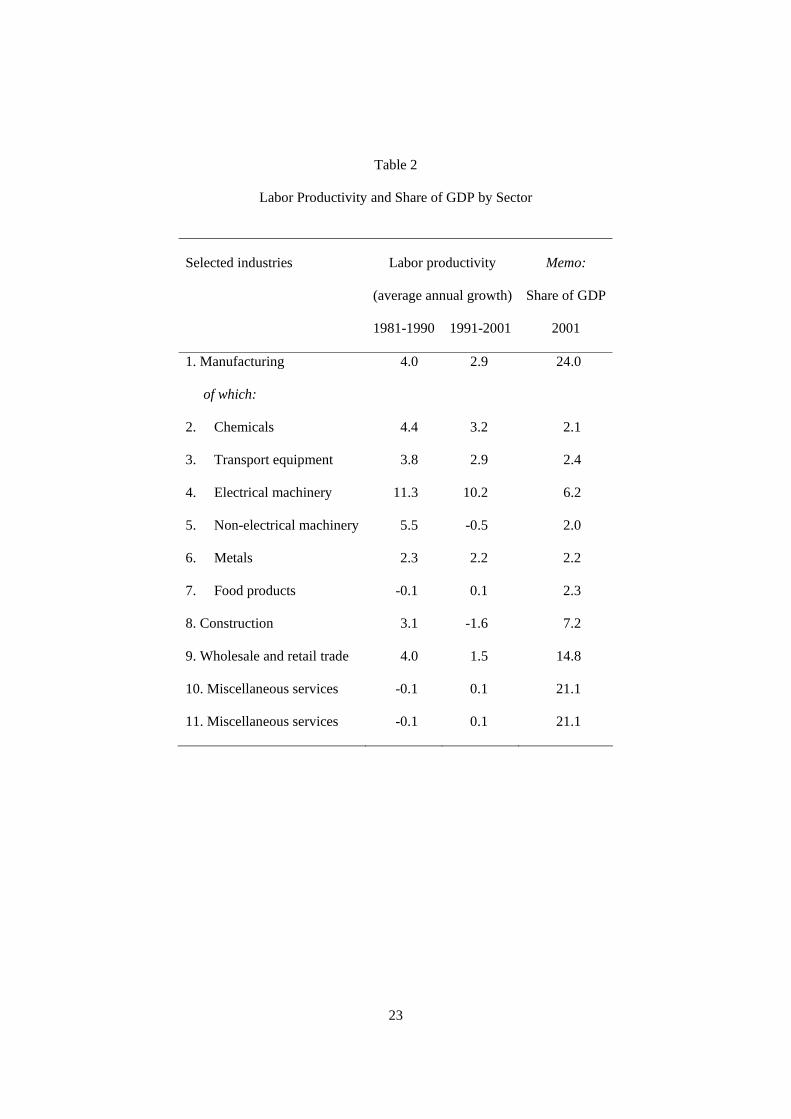
Table 2 provides a cross-industry perspective on productivity growth in Japan. Growth in
labor productivity in the manufacturing sector has slipped since the 1980s. Some export-oriented
industries, such as chemicals, electrical machinery, and transport equipment have continued to
labor is the weight of capital. Finally, we decompose the growth of labor productivity into the growth of
multifactor productivity and the contribution of capital deepening.
5 This effort to shorten the traditionally long Japanese workweek included a gradual reduction in the
statutory workweek from 6 to 5 workdays per week beginning in 1988. In addition, the number of national
holidays was increased by 3 during this period. See Hayashi and Prescott (2002) for more details.
6 Kawamoto (2004) shows evidence that the slowdown in multifactor productivity in Japan in the 1990s
largely reflects lower cyclical utilization of capital and labor and reallocation of inputs rather than a change
in the rate of technical progress.
4
perform reasonably well, spurred by exposure to competition in the global marketplace. In
contrast, the productivity record of non-traded-goods and services industries, such as construction,
and wholesale and retail trade has been poor of late. It is widely believed that competitive
pressures in these industries are weak, suppressed by cartels, excessive government regulation,
and other market distortions.7 Moreover, the near absence of FDI in Japan suggests there is little
foreign competition to goad productivity gains in Japan’s non-traded-goods sectors.
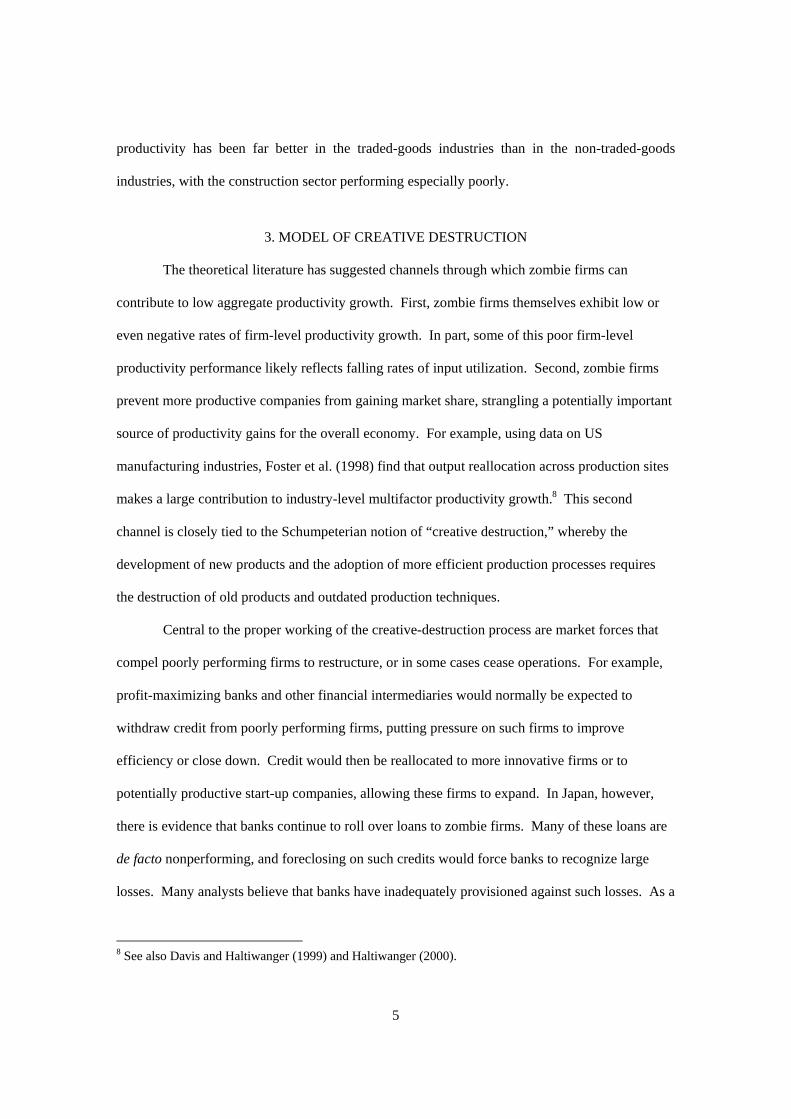
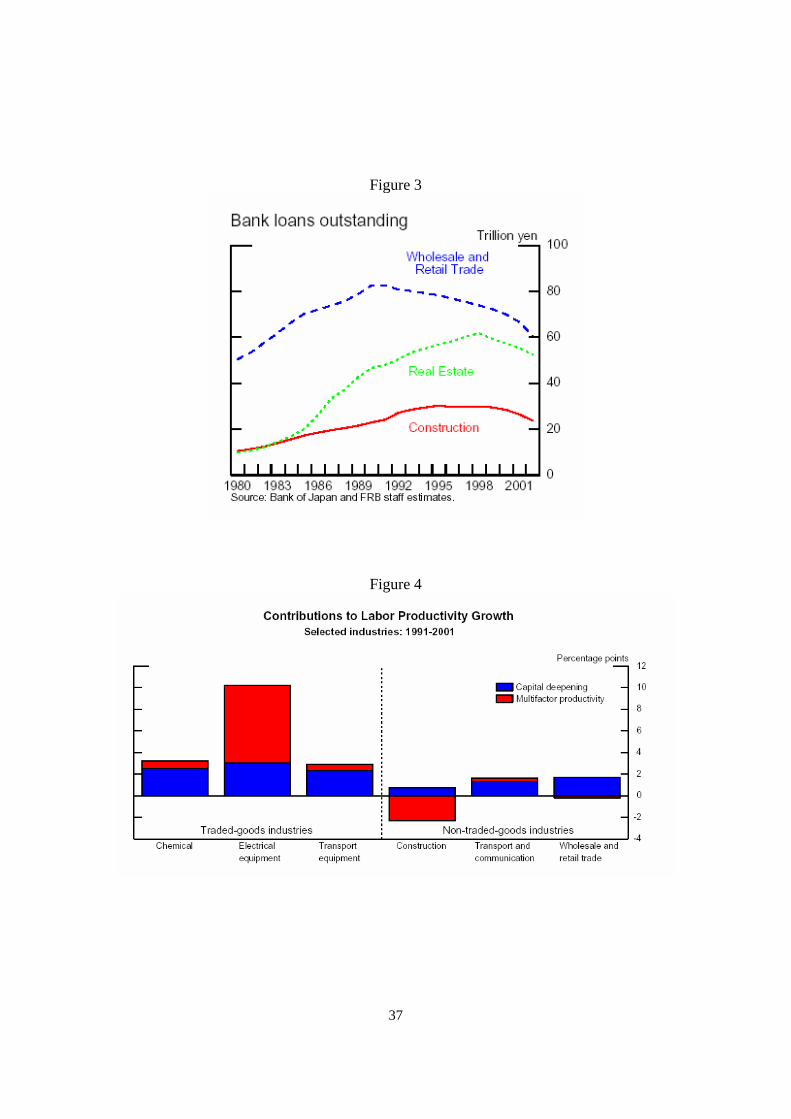
Sectors such as construction, real estate, and wholesale and retail trade, which expanded
rapidly in the 1980s, were hard hit by the bursting of the bubble in the early 1990s. Nevertheless,
as shown in Figure 3, these industries retained largely undiminished access to bank credit through
the 1990s. Bank loans to the construction sector have not declined much from the peak in the
mid-1990s, although the value of the land that serves as collateral for many of these loans has
plummeted.
Liabilities of non-manufacturing firms rose rapidly relative to cash flows during most of
the 1990s. Liabilities have recently eased back some as firms have made an effort to repay debt.
Nonetheless, liabilities remain well above the target ceiling of 10 times cash flow that many
commentators regard as the dividing line between viable and non-viable firms. Liabilities are
especially high--over 20 times cash flow--in industries such as construction, real estate, and
wholesale distribution sectors.
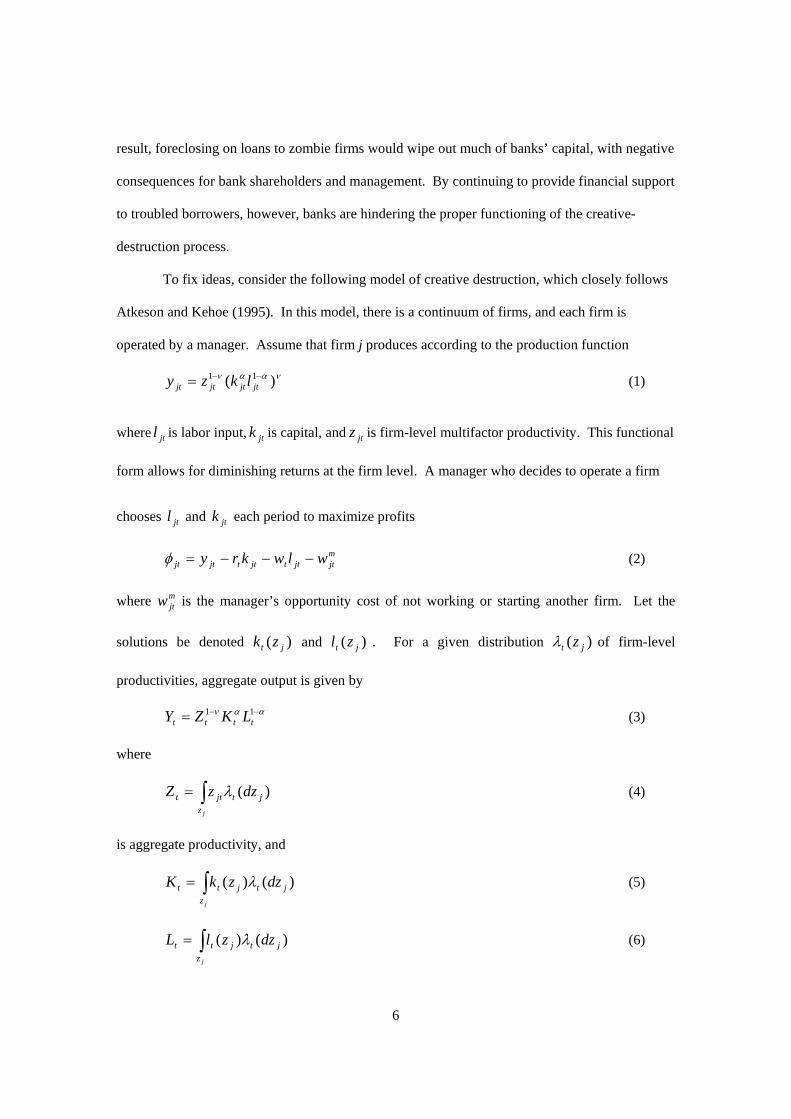
Figure 4 further highlights the differences between traded- and non-traded-goods sectors
by decomposing changes in labor productivity for selected industries into changes in multifactor
productivity and the contribution of capital deepening. The performance of multifactor
7 See Porter, Takeuchi and Sakakibara (2000) and Katz (1998) for extensive discussions of possible reasons
why some Japanese industries are highly competitive, while other industries exhibit very poor productivity
growth.
5
productivity has been far better in the traded-goods industries than in the non-traded-goods
industries, with the construction sector performing especially poorly.
3. MODEL OF CREATIVE DESTRUCTION
The theoretical literature has suggested channels through which zombie firms can
contribute to low aggregate productivity growth. First, zombie firms themselves exhibit low or
even negative rates of firm-level productivity growth. In part, some of this poor firm-level
productivity performance likely reflects falling rates of input utilization. Second, zombie firms
prevent more productive companies from gaining market share, strangling a potentially important
source of productivity gains for the overall economy. For example, using data on US
manufacturing industries, Foster et al. (1998) find that output reallocation across production sites
makes a large contribution to industry-level multifactor productivity growth.8 This second
channel is closely tied to the Schumpeterian notion of “creative destruction,” whereby the
development of new products and the adoption of more efficient production processes requires
the destruction of old products and outdated production techniques.
Central to the proper working of the creative-destruction process are market forces that
compel poorly performing firms to restructure, or in some cases cease operations. For example,
profit-maximizing banks and other financial intermediaries would normally be expected to
withdraw credit from poorly performing firms, putting pressure on such firms to improve
efficiency or close down. Credit would then be reallocated to more innovative firms or to
potentially productive start-up companies, allowing these firms to expand. In Japan, however,
there is evidence that banks continue to roll over loans to zombie firms. Many of these loans are
de facto nonperforming, and foreclosing on such credits would force banks to recognize large
losses. Many analysts believe that banks have inadequately provisioned against such losses. As a
8 See also Davis and Haltiwanger (1999) and Haltiwanger (2000).
6
result, foreclosing on loans to zombie firms would wipe out much of banks’ capital, with negative
consequences for bank shareholders and management. By continuing to provide financial support
to troubled borrowers, however, banks are hindering the proper functioning of the creative-
destruction process.
To fix ideas, consider the following model of creative destruction, which closely follows
Atkeson and Kehoe (1995). In this model, there is a continuum of firms, and each firm is
operated by a manager. Assume that firm j produces according to the production function
νααν )( 11 −−= jtjtjtjt lkzy (1)
where jtl is labor input, jtk is capital, and jtz is firm-level multifactor productivity. This functional
form allows for diminishing returns at the firm level. A manager who decides to operate a firm
chooses jtl and jtk each period to maximize profits
mjtjttjttjtjt wlwkry −−−=φ (2)
where mjtw is the manager’s opportunity cost of not working or starting another firm. Let the
solutions be denoted )( jt zk and )( jt zl . For a given distribution )( jt zλ of firm-level
productivities, aggregate output is given by
ααν −−= 11tttt LKZY (3)
where
∫=jz
jtjtt dzzZ )(λ (4)
is aggregate productivity, and
∫=jz
jtjtt dzzkK )()( λ (5)
∫=jz
jtjtt dzzlL )()( λ (6)
7
are aggregate capital and labor, respectively. It appears from equation (4) that aggregate
productivity depends on the average productivity of firms that are in operation.
Firm-level productivity is an idiosyncratic random variable, which evolves over time
according to the following rule: a firm with productivity jz at time t has productivity εjz at
time 1+t , where the shock ε is drawn from a probability distribution )(επ . A manager’s
decision whether to operate a firm is described by the Bellman equation
)](,0max[)( jO
tjt zVzV = (7)
where
=)( jO
t zV max[ mjtjttjttjt wlwkry −−− ] + ∫ ++ ε
επε )()(1
11 jt
t
zVR
(8)
Here, tR is the interest rate, )( jO
t zV is the return from operating a firm in the current period,
and )( jt zV is the maximum of the returns from either shutting down the firm or operating it.
New plants can enter according to a similar process.
For simplicity, assume that there are only two firms in the economy, firm 1 and firm 2.
Suppose that firm 1 is a zombie firm, and banks lend to firm 1 at a subsidized interest
rate, )1(ˆ11 ttt RR τ−= . In contrast, banks are assumed to lend to firm 2, a “normal” firm, at a
relatively high interest rate, )1(ˆ22 ttt RR τ+= . It is clear that the zombie firm will discount the
future less than the normal firm. Substituting these distorted interest rates into equation (8)
produces different solutions to the managers’ dynamic programming problems for firms 1 and 2.
In particular, the manager will choose to operate the zombie firm in situations where the normal
firm would choose to shut down. Even if a zombie firm experiences a low productivity shock, it
will be more prone to borrow to cover losses and to continue operating, hoping for a favorable
shock to increase its productivity in the future. In an economy with many zombie firms and many
8
normal firms, this behavior changes the mix of firms that operate, leading to many continuing
inefficient low-productivity firms. This leads to a lower value of aggregate productivity.
4. EMPIRICAL EVIDENCE
To investigate further the sources of low productivity growth in Japan, we use firm-level
data to study a range of industries. Our data are from the Corporate Finance Database of the
Development Bank of Japan, which contains detailed financial-statement data on all companies
listed on Japanese stock exchanges. The data cover the period from 1970 to 2001. However,
mirroring the analysis of aggregate productivity in Section 2, we focus our attention on the stark
contrast in productivity performance in the 1980s compared with the 1990s. Our sample includes
604 firms from which data are reported in every year over the entire sample period. These firms
are classified into 33 different industry groups. However, for a number of groups our dataset
contains only a small number of firms. As a result, we limit our analysis to a selected set of
industries for which we have a sufficient number of firms.9
For each firm, we calculate firm-level value added and multifactor productivity (MFP)
using the methodology described below. Shinada (2003) provides a more detailed presentation of
our data and methods for calculating firm-level productivity.
Assume firm j produces real output jty according to the Cobb-Douglas function
)1( αα −= jtjtjtjt lkzy (9)
9 In particular, our dataset contains only two firms in the real estate industry. Presumably, many Japanese
real estate firms are not listed on Japanese stock exchanges and are therefore not included in the
Development Bank of Japan’s Corporate Finance Database. In addition, we suspect that several listed
firms that are involved in real estate are included in our dataset under the “construction” or “other
construction” groupings. Both these industry groupings are included in our sample.

9
where jtl is labor input (hours worked), jtk is real capital, and jtz is multifactor productivity (MFP).
Taking natural logarithms of the production function and rearranging terms, we measure firm-
level MPF as the difference between real output and total inputs
jtjtjtjt lkyz ln)1(lnlnln αα −−−= (10)
Real output is defined as firm nominal value added deflated by a wholesale price index
defined at the industry level. Our data set contains information on factor incomes that we use to
construct a measure of nominal firm-level value added (at factor cost): nominal value added =
expenditures on labor + rental expenses + depreciation expenses + operating profits (before
interest) + taxes and public charges + patent license fees. An alternative approach would be to
calculate value added by subtracting intermediate inputs from gross output. In our data set based
on firms’ financial statements, the value of intermediate inputs is measured by the Cost of Goods
Sold (COGS). Of course, in theory both approaches yield essentially the same results. However,
in practice, simply subtracting COGS from gross output does not match value added for several
reasons. First, for manufacturing companies, COGS includes factory labor income. In addition,
COGS includes depreciation of production assets. Further, the definition of COGS differs from
industry to industry. As a result, we prefer to estimate value added using the factor incomes
approach.10
Labor input is measured by the total hours worked at each firm, calculated as the number
of workers multiplied by the average number of hours worked. The number of workers is the
total number of employees of each firm at the end of the period, including regular employees as
well as temporary and contract workers. Average hours worked is estimated using industry
indexes of working hours from the Monthly Labor Survey conducted by the Ministry of Health,
10 We note that the Bank of Japan and Japan’s Ministry of Finance both also use the factor incomes method
to calculate their statistics on corporate performance.
10
Labor and Welfare (MHLW). To be specific, we use MHLW’s series for average hours at
establishments with 30 or more employees. Hours worked include both “scheduled working
hours” and “non-scheduled working hours.”
To calculate capital input, we follow the literature on estimating Tobin's q such as
Hayashi and Inoue (1991) and Hoshi and Kashyap (1990) and include the current value of land
and inventory in our measure of the real capital stock. Thus, we begin by separating capital
stocks into: (1) depreciable assets, (2) real estate, and (3) inventory assets.
For depreciable assets, we assume that the flow of capital services is proportional to the
stock of capital. Our methodology for measuring firm-level capital stock is based on the law of
motion
jtjtjt xkk +−=+ )1(1 δ (11)
where jtx is real gross investment and δ is the depreciation rate.
The depreciation rates are set to correspond to the rates reported by Hayashi and Inoue
(1991) and Nagahata and Sekine (2002). We set the elasticity of output with respect to capital
equal to the industry-level share of capital, calculated as one minus the share of labor.
We estimate jtx by deflating nominal gross investment by the price of capital goods.
Nominal gross investment is measured using the reported cost of new tangible fixed assets.
Wholesale price indexes for capital goods are then used to deflate nominal investment. We take
1970 as our base year and estimate the real capital stock by industry. Real net capital stock by
industry is estimated based on the National Accounts and Price Sector Corporate Capital Stock of
the Cabinet Office. The book value of tangible fixed assets of non-financial corporations from
the Annual Report of Corporate Statistics is used for capital stock book value by industry. The
real net capital stock of each firm was then estimated by determining the market value/book value
ratio by industry in 1970 using the above data and multiplying that by the asset book price of
each company in 1970. See Shinada (2003) for further details.
11
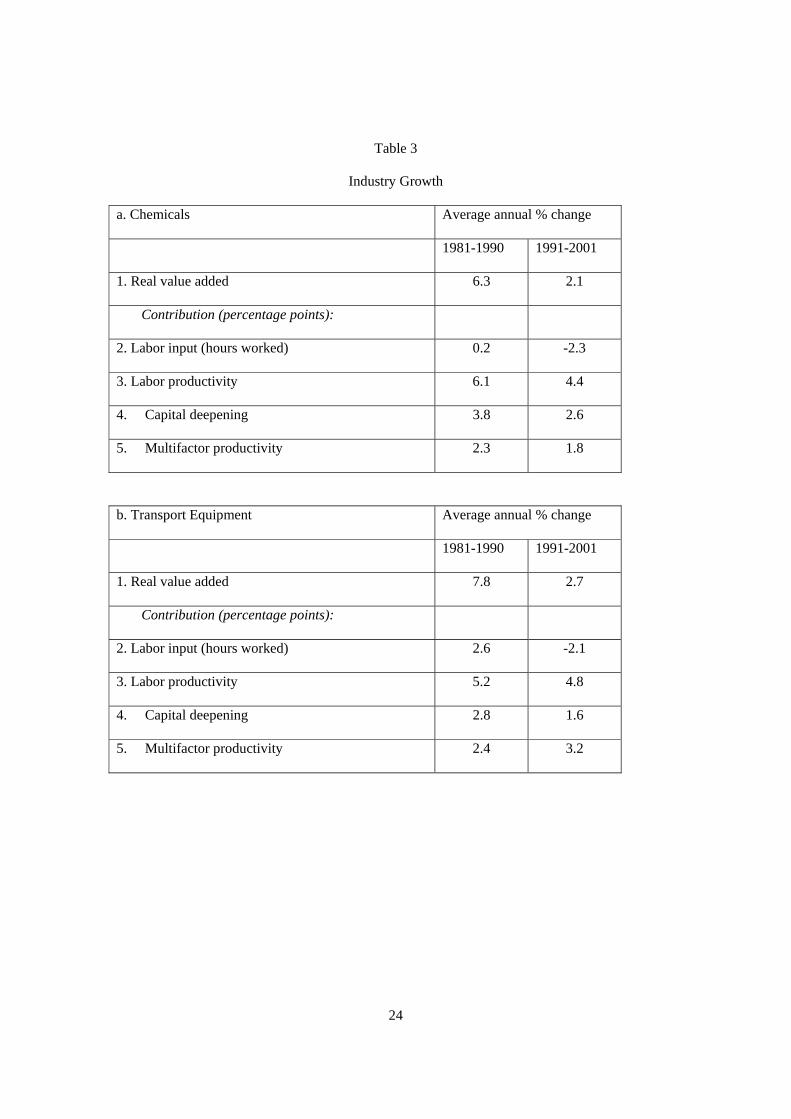
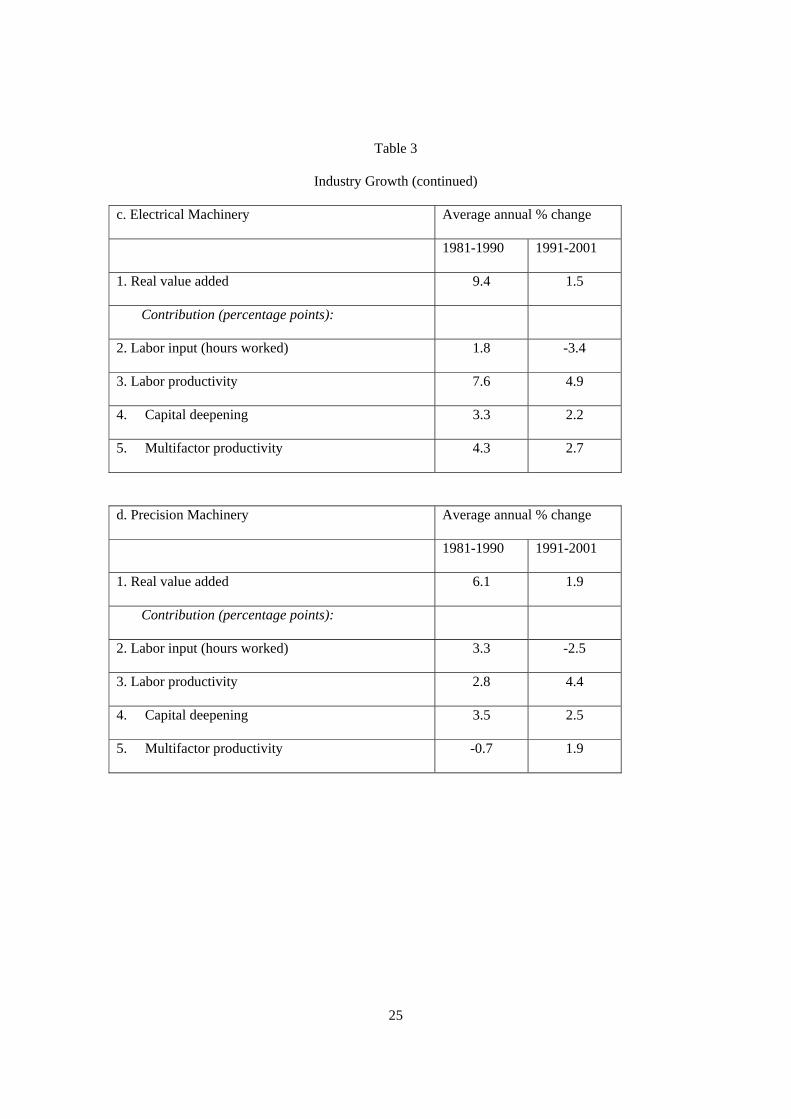
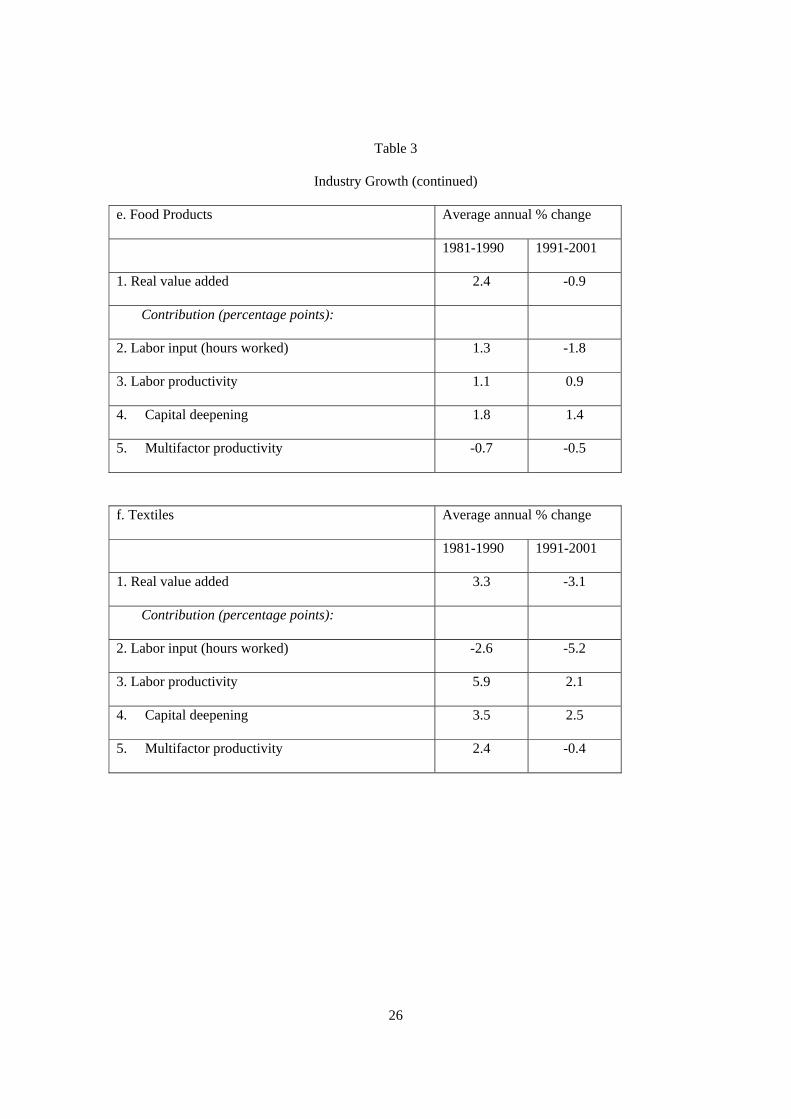
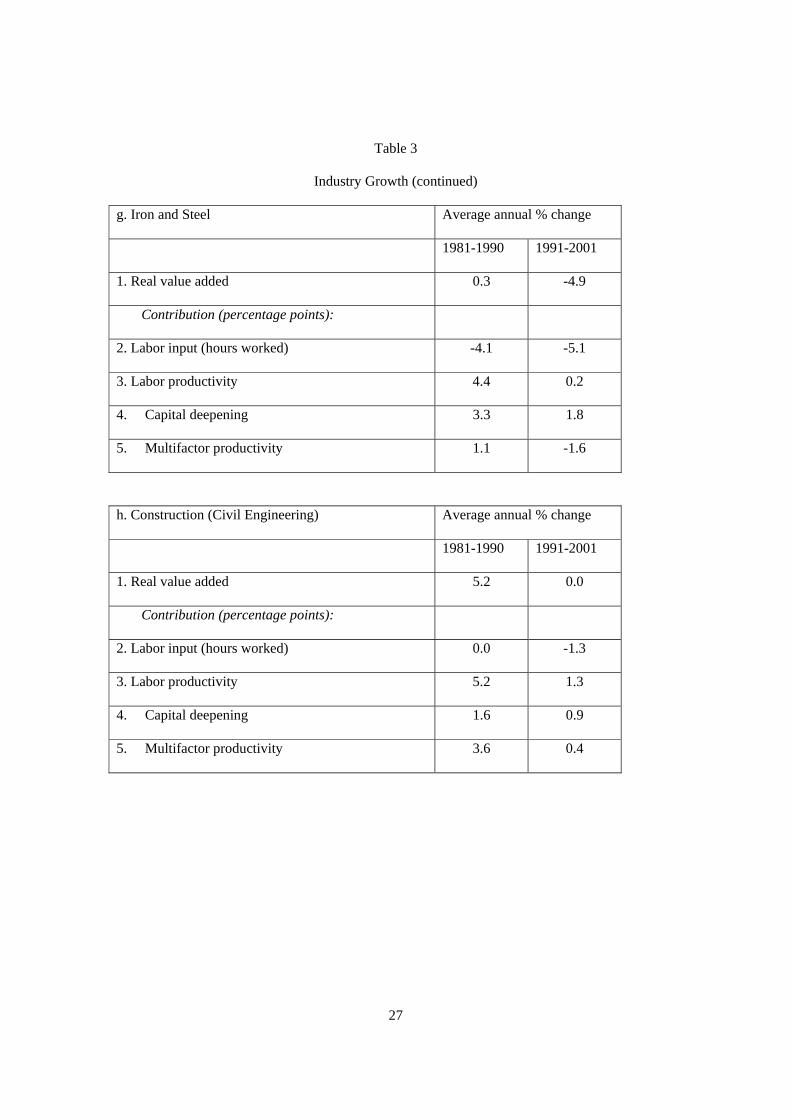
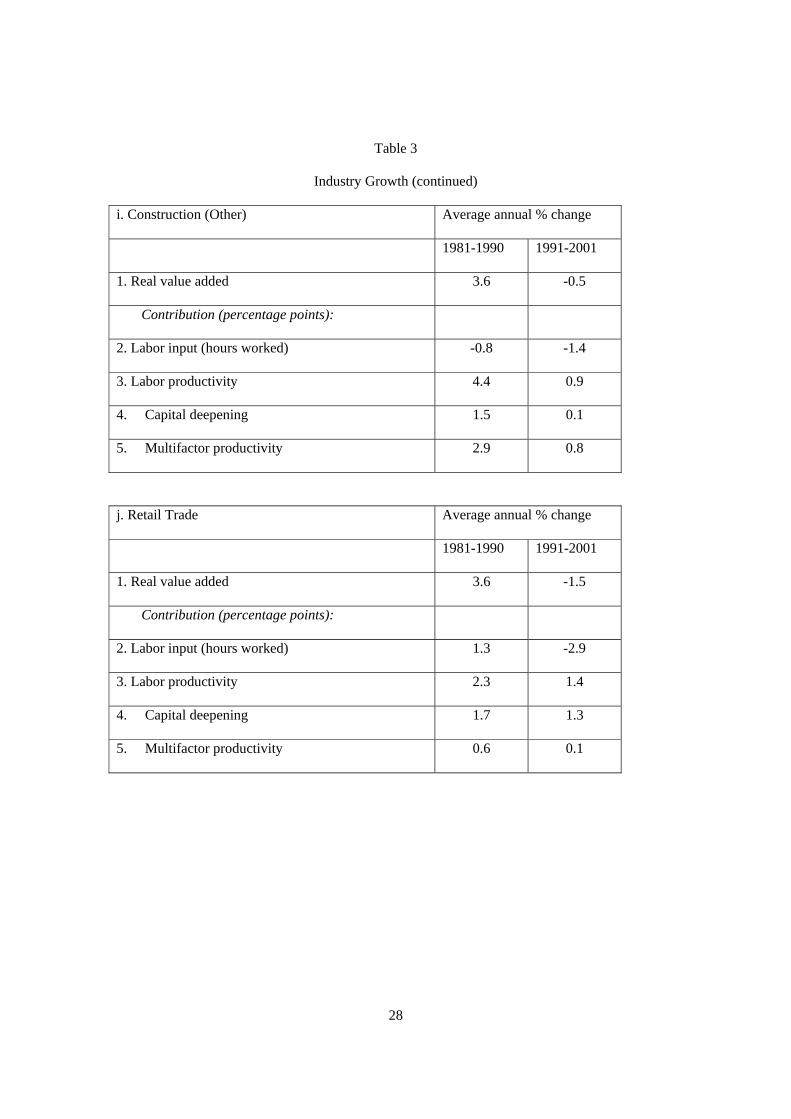
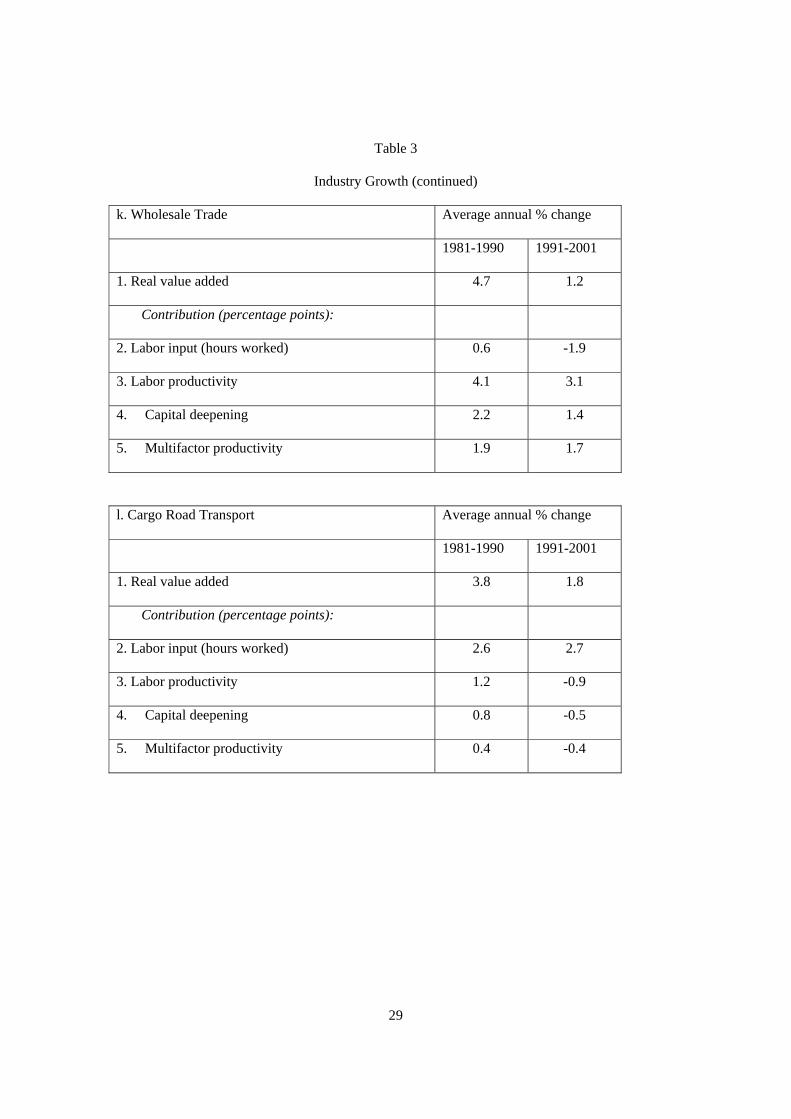
Aggregating across all firms in industry i , we calculate the growth of industry output and
inputs. Table 3 shows the results of these calculations for a range of industries that contain a
sufficiently large number of firms. As in the industry-level analysis presented in Section 2, labor
productivity slowed in the 1990s compared with the 1980s in almost all industries (line 3 of each
industry table). The slowdown was much more pronounced in industries in the non-traded-goods
sector, particularly construction (Table 3h and 3i) and transport (Table 3l). Export-oriented
sectors such as chemicals, transport equipment, and electrical machinery (Tables 3a to 3c)
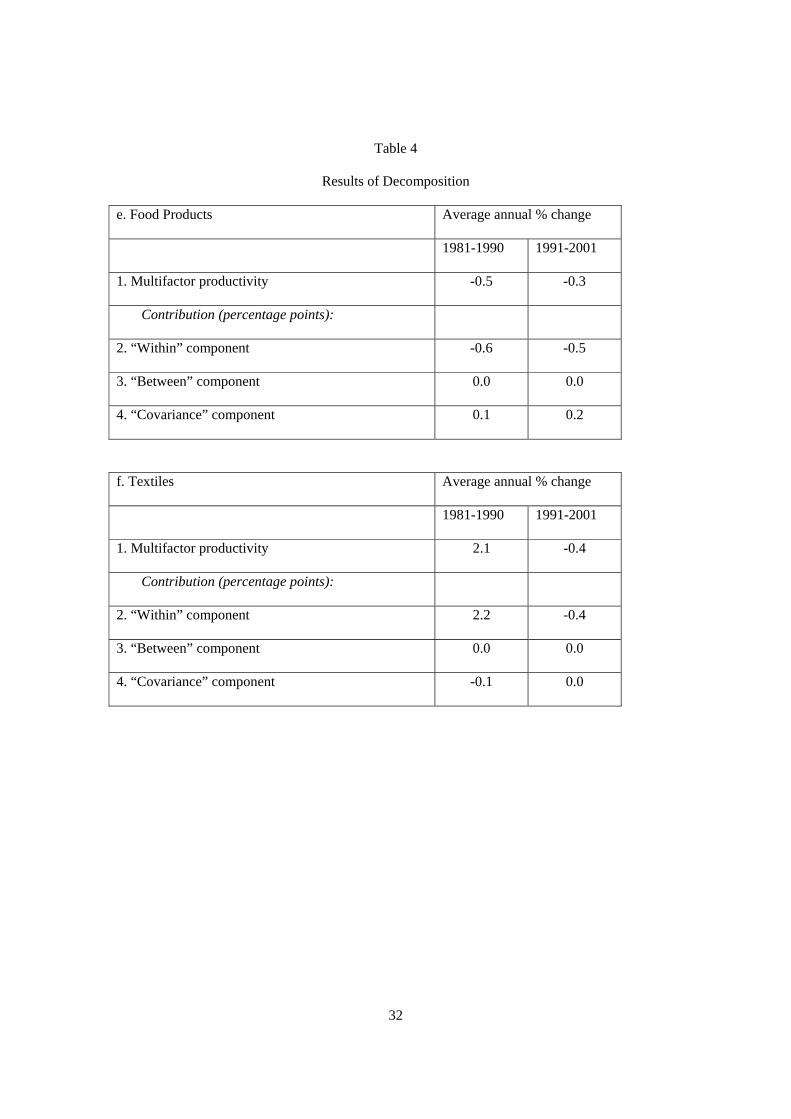
continued to record robust rates of labor productivity in the 1990s, though the pace slowed a bit
from the previous decade. Labor productivity actually accelerated in the precision machinery
industry (Table 3d). The performances of several other manufacturing sectors were more mixed,
including food production (which is largely domestically oriented) and textiles (which
experienced a mass migration of production facilities to China.)
One point worth noting about the estimates of labor-productivity growth constructed
from firm-level data and presented in Table 3 is that they are broadly similar to the estimates
from industry-level data shown in Table 2. This suggests that we can be reasonably confident
that the firms in our sample are relatively representative of the larger population. That said, for
several industries, labor-productivity growth based on our dataset of firms is faster than the
estimate based on aggregate data, probably reflecting the fact that our sample of firms consists of
only listed companies, and therefore excludes many small- and medium-sized firms that may
have performed especially poorly in the 1990s.
In the traded-goods sectors, the slowdown in labor productivity largely reflected a
marked retrenchment in capital spending, while multifactor productivity growth held up well or
even increased. In contrast, in the non-traded sector the 1990s were generally associated with
sluggish multifactor productivity growth, and included a slump in productivity in sub-sectors of
the construction industry.
12
How much of this slow in productivity in the 1990s in the non-traded industries reflects
poor performance within individual firms, and how much is because of changes in market share?
To answer this question, we follow Haltiwanger (1997) and define industry productivity as the
market-share weighted sum of the firms’ productivity levels
∑∈
=Ij
jtjtit zZ lnln θ (12)
where I is the set of firms in industry i , and jθ is firm j ’s share of nominal sales in industry i .
Growth in industry productivity between periods kt − and t is given by
kititit ZZZ −−=∆ lnlnln (13)
Next, we decompose changes in industry productivity into several terms
( ) ( ) ( )∑∑∑∈∈
−−∈
− ∆∆+∆−+∆=∆Ij
jtjtIj
jtkitkjtIj
jtkjtit ZZZZZ lnlnlnlnln θθθ (14)
The first term, which we refer to as the “within” firm component, measures what would have
happened to industry productivity as a result of changes in productivity within individual firms,
had market shares stayed constant. It is calculated as the sum across all firms in the industry of
each individual firm’s own productivity growth, weighted by the firm’s initial market share. The
second term, the “between” firm component, measures the additional impact on industry
productivity due to changes in market shares. It is calculated by summing changes in each firm’s
market share, weighted by the deviation of initial firm productivity from the initial industry
productivity. The third term is a covariance component. Industry productivity would rise (fall)
if: (1) individual firm productivity increased (decreased), or (2) if there was a reallocation of
market share from low (high) productivity to high (low) productivity firms, or (3) if there was a
reallocation of market share to firms with rapidly rising (falling) productivity11. 11 Because we use a balanced panel of firms for our analysis, we do not include exit and entry terms in our
decomposition. In part, our decision to use a balanced panel reflects the difficulty of interpreting firm
“entry” in a dataset of listed firms. For example, many firms operate for considerable periods of time prior
13
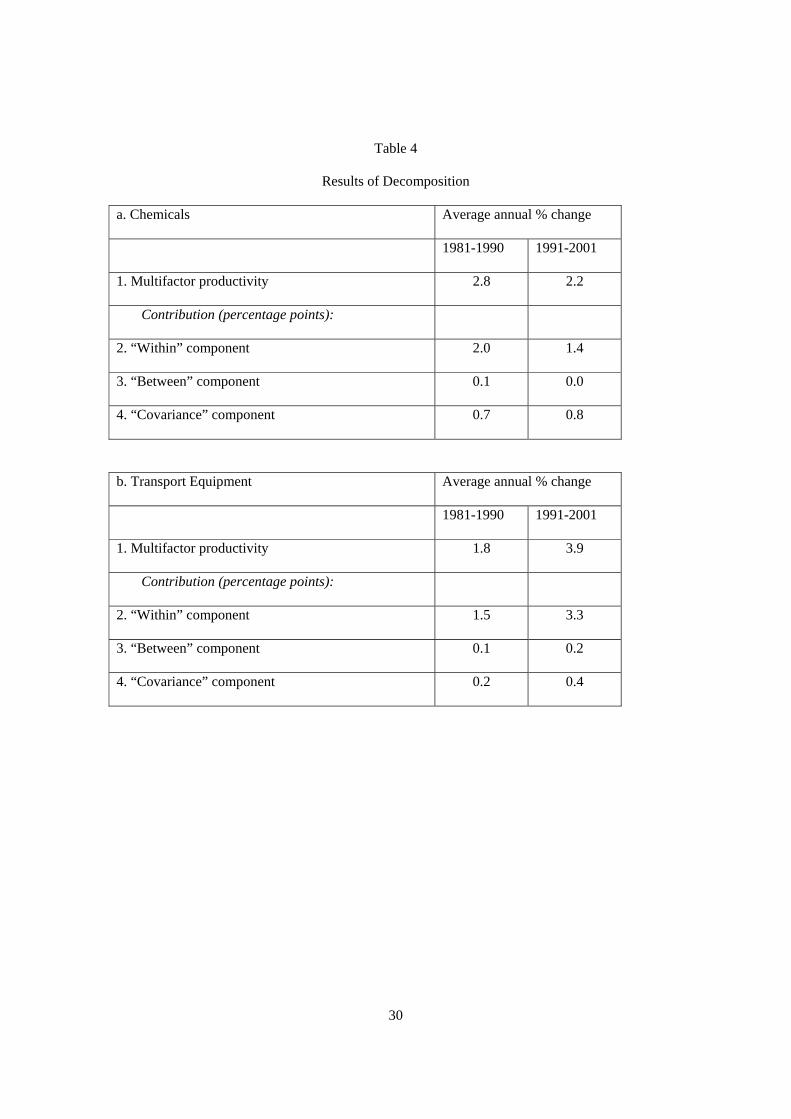
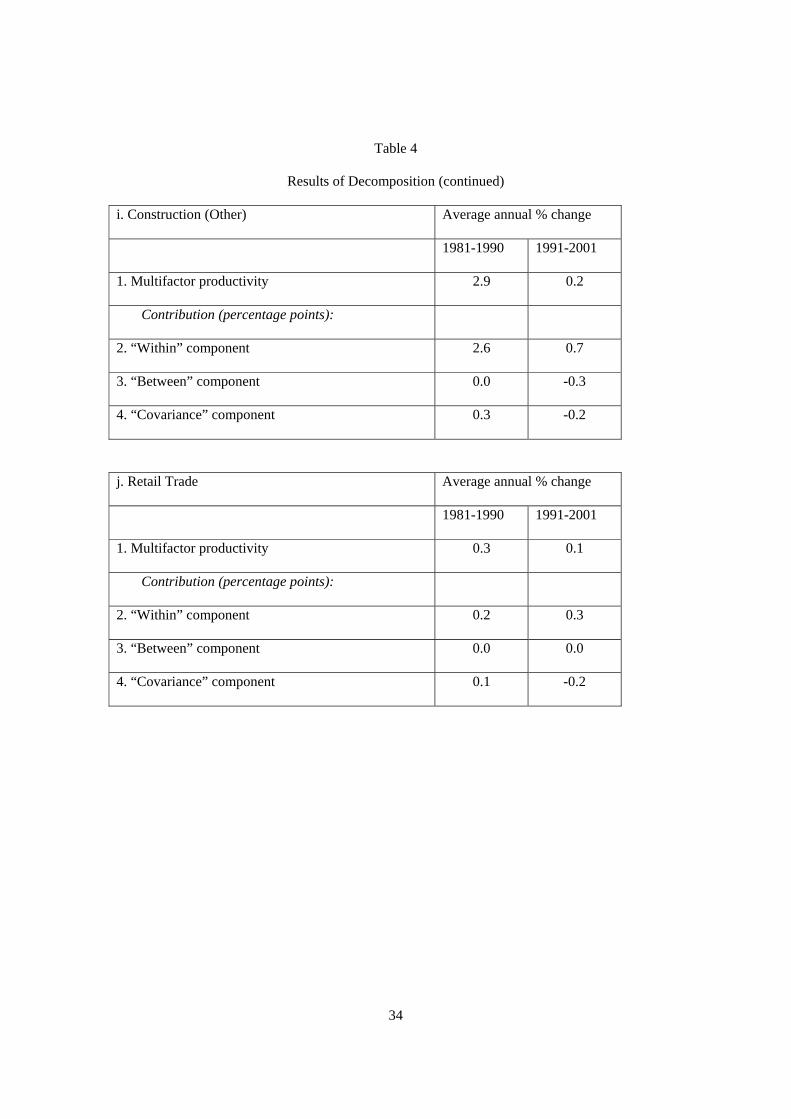
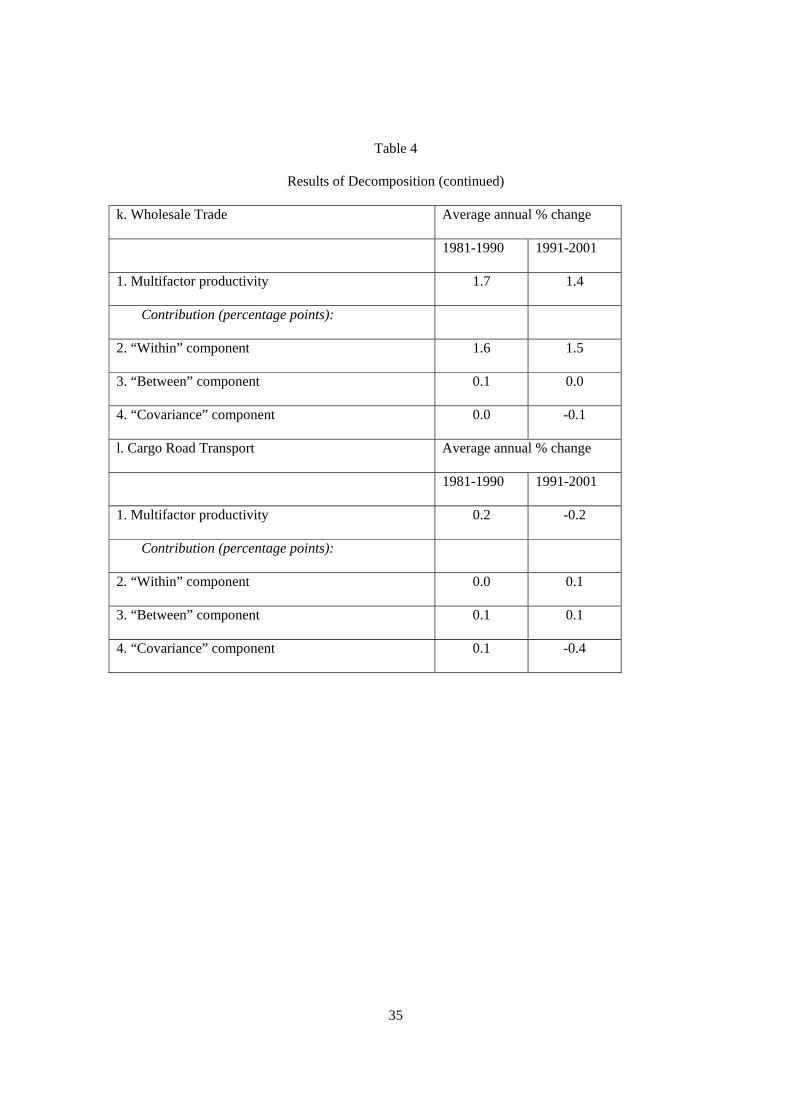
The results of this decomposition for the industries in our sample are reported in Table 4.
Note that the estimates of multifactor productivity growth reported in Table 4 differ somewhat
from those in Table 3. These differences arise because firms are weighted by nominal sales in the
construction of industry aggregates in Table 4, whereas in Table 3 aggregates are calculated by
(implicitly) weighting firms by value added. In most cases the differences are modest, and both
sets of estimates paint the same qualitative picture of multifactor productivity growth across
industries. That is, multifactor productivity growth held up well or even increased in the 1990s in
traded-goods sectors, while growth in non-traded sectors generally was sluggish and often
declined.
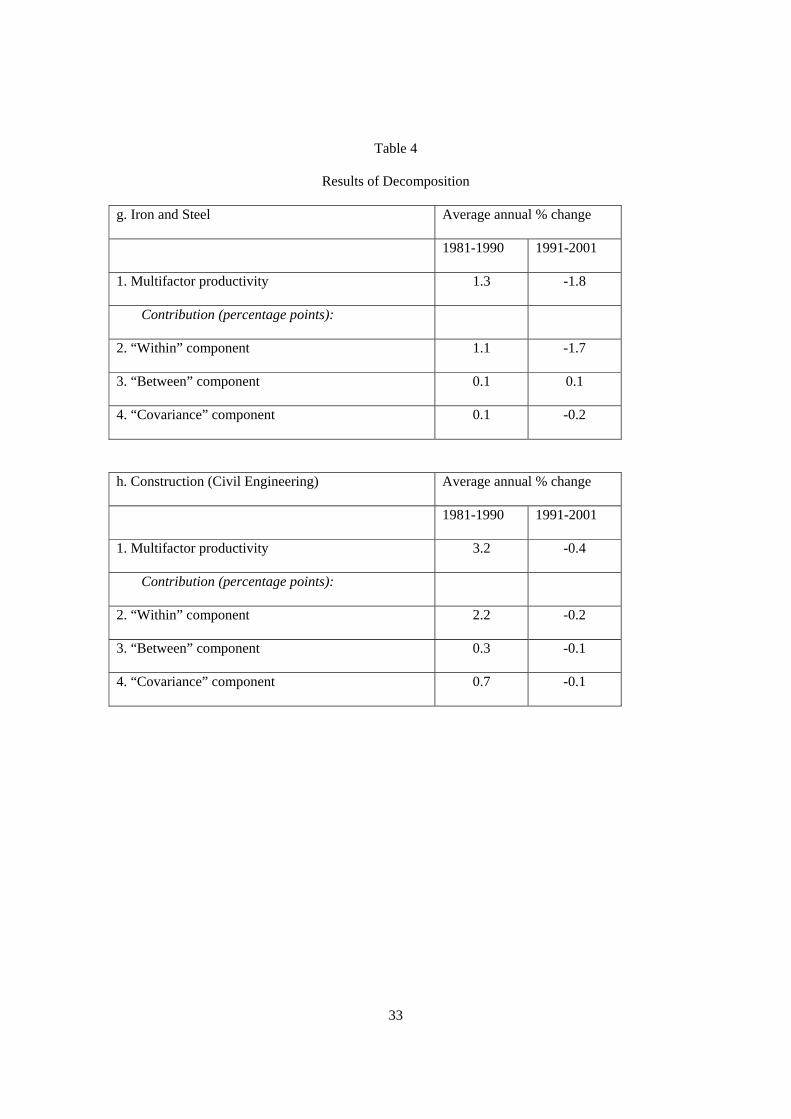
Focusing on Table 4, of the roughly ½ percent rate of average annual decline in
multifactor productivity over the 1990s in the civil engineering sub-sector of the construction
industry (Table 4h), roughly one half resulted from falling productivity within firms. The
remainder resulted from gains in market share by less productive firms at the expense of firms
with higher or more rapidly growing levels of productivity.12 Multifactor productivity growth in
other construction sectors (Table 4i) crawled to a standstill in the 1990s, as the contribution from
productivity growth within firms slowed from 2½ percentage points in the 1980s to ¾ percentage
point in the 1990s. In addition, the contribution from the reallocation of market share turned from
a positive rate of roughly ¼ percentage point in the 1980s to a negative contribution of ½
percentage point in the 1990s. One possible explanation for this perverse reallocation of market
share is that banks continued to make loans to inefficient firms. In addition, many such firms are
to being listed on a stock exchange. In addition, there are technical reasons associated with our method for
computing firms’ real capital stocks that render the use of an unbalanced panel highly problematic.
12 These results are consistent with the findings in Nishimura, Nakajima and Kiyota (2004) that efficient
firms exited the Japanese economy while inefficient ones survived during the banking crisis of 1996-1997.
14
reportedly closely connected with the ruling Liberal Democratic Party and continued to bid
successfully for public works projects.13
In the retail trade sector (Table 4j) and the wholesale trade sector (Table 4k), multifactor
productivity growth slowed some in the 1990s. In the retail trade sector, this slowdown occurred
despite a larger contribution from rising productivity within firms. In both sectors, the
contribution from the reallocation of market share, which was already negligible in the 1980s,
turned slightly negative in the 1990s.
Similarly, the cargo road transport sector (Table 4l) saw the contribution from the
reallocation of market share turn negative in the 1990s, resulting in a decline in multifactor
productivity.
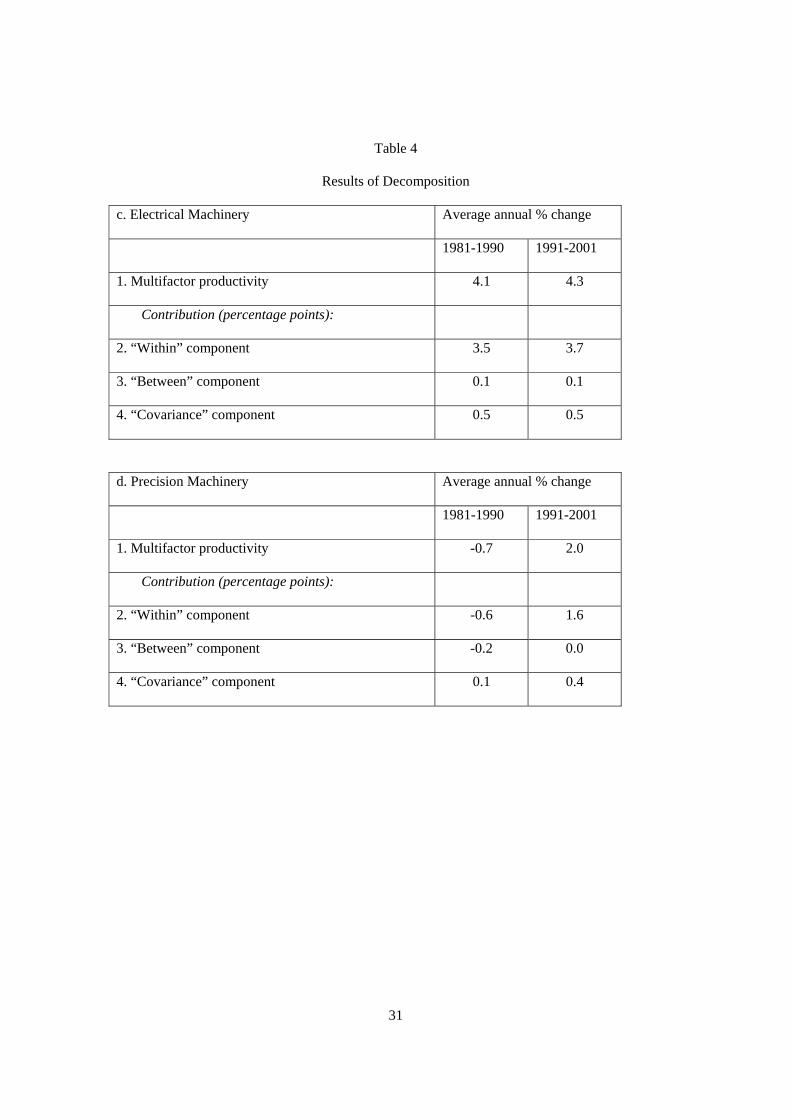
In contrast, the contributions to productivity growth from the reallocation of market share
in traded industries such as chemicals, transport equipment, and electrical machinery (Table 4a,
4b, and 4c, respectively) showed little change over the two decades. In these industries, the
reallocation of market share continued to make contributions of between ½ to 1 percentage points
to average annual growth in multifactor productivity. In the precision machinery industry (Table
4d), performance of multifactor productivity improved markedly in the 1990s, in part resulting
from a swing to a positive contribution from the reallocation of market share.
The results above are consistent with the zombie-firm hypothesis. During the 1990s,
inefficient zombie firms in Japan’s non-traded-goods sectors appear to have prevented more
productive companies from gaining market share. In the remainder of this section, we use firm-
level data from the Corporate Finance Database on borrowing from banks by the firms in our
sample to try to ascertain whether financial support from Japanese banks may have played a role
in sustaining this perverse reallocation of market share. Peek and Rosengren (2003) find that
Japanese firms are far more likely to receive additional bank credit if they are in poor financial
13 See Ahearne et al. (2002) for a review of Japanese fiscal policy during the 1990s.
15
condition, and that troubled Japanese banks allocate credit to severely impaired borrowers
primarily to avoid the realization of losses on their own balance sheets.
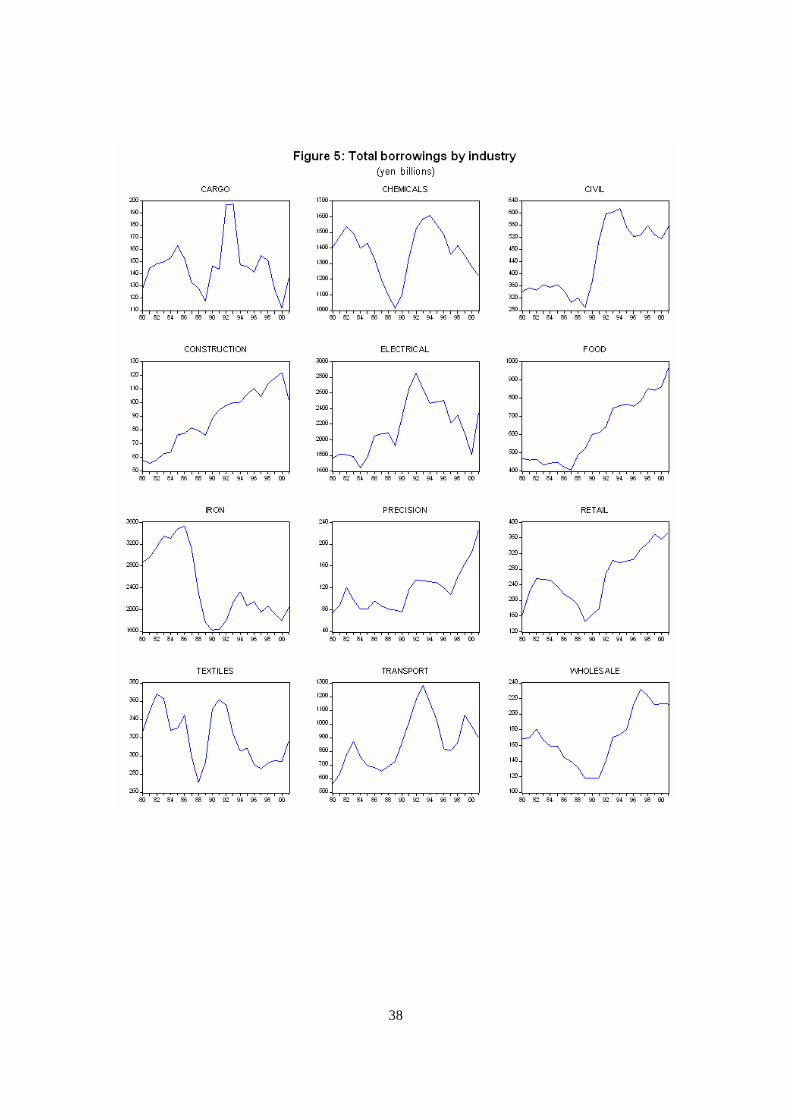
Figure 5 shows total outstanding borrowing from banks aggregated by industry. Total
borrowings are calculated as the sum of short-term borrowings, current portion of long-term
borrowings (which will be paid back within a year), and long-term borrowings (which will be
paid back two or more years later). Many industries show a rapid run-up in borrowing from
banks during the bubble period of the late 1980s. In traded-goods sectors, such as chemicals,
electrical machinery, and transport machinery, borrowing peaked in the early 1990s, before
declining sharply throughout much of the decade. In contrast, total borrowing from banks by
firms in non-traded-goods sectors such as construction (other), retail trade, and wholesale trade
rose sharply during the 1990s, before turning down in 2000 and 2001. The outcome is that
relatively poorly performing industries were increasing their share of total borrowing from banks
relative to better performing sectors.
In part, the patterns during the 1990s described above may reflect an increasing proclivity
of firms in traded-goods sectors to tap capital markets directly, allowing them to reduce their
reliance on banks as sources of finance. In addition, Japanese banks may have been reluctant to
cut off lending to poorly performing firms in the non-traded-goods sectors because such actions
may have required that the banks be recapitalized.
The results in Table 5 provide additional evidence of misallocation of credit by banks in
Japan. Based on our firm-level data, Table 5 shows the correlation between changes in market
share and changes in the share of outstanding loans from banks. For example, in the chemicals
industry, we find a strong positive correlation (0.75) over the period 1980-1990, meaning that
firms that gained market share over this period also tended to increase their share of total bank
loans to the chemical industry. Most other industries also showed positive correlations over this
period.
16
In the 1990s, however, correlations in traded-goods industries such as transport
equipment, electrical machinery, and precision machinery swung into highly negative territory,
and the correlation in the chemicals sector dropped to near zero. These swings are consistent
with better performing firms in these sectors increasingly tapping capital markets directly (and
hence borrowing less from banks) while gaining market share. In contrast, in zombie-laden
sectors such as construction, retail trade, and wholesale trade the correlations remain positive in
the 1990s. Crucially, these are the industries where, as seen earlier, the reallocation of market
share is going in the wrong direction. Our reading of the combination of results in Table 4 and
Table 5 is that relatively less efficient firms gained market share in several non-traded-goods
sectors during the 1990s, and this process was facilitated by these firms gaining a rising share of
bank lending.
5. CONCLUSION
The low pace of productivity growth in Japan’s non-traded-goods sectors suggests
considerable scope for “catch-up” in these industries and represents a potentially important source
of future Japanese growth, but one that can be tapped only if the most inefficient firms in these
industries close down or undergo substantial restructuring and the remaining firms work to
improve performance.
The results of our study of Japanese firm-level data suggest that in some non-traded
industries the allocation of market share is going in the wrong direction, adding to already poor
productivity performance in these sector. One possible explanation is that inefficient firms are
being sustained in part by financial support from Japanese banks. Thus, it seems clear that
corporate restructuring needs to happen and is not coming about through competitive pressure.
One policy implication is that banks should be provided incentives to withdraw this support and
force these firms to meaningfully restructure or in some cases close. Such actions, however,
would be unlikely outside of a more thorough reform of the financial sector, in part because if

17
banks acknowledged the full extent of their non-performing loans problem, they may have to be
recapitalized.
We should note that because of the availability of data, our sample ends in 2001 and
therefore does not include the period of financial system reforms introduced by Prime Minister
Koizumi and Financial Services Agency Minister Takenaka. When data for post-2001 do become
available, it will be interesting to see whether the allocation process has improved over recent
years.
A possible extension of our study would be use the methodology in Kawamoto (2004)
that controls for increasing returns, imperfect competition, and cyclical utilization of factors to
estimate firm-level productivity. Another extension would be to explore the misallocation of
assets across firms in different sectors. We leave these as issues for future research.
18
REFERENCES
Ahearne, A. G. et al. (2002), ‘Preventing Deflation: Lessons from Japan’s Experience in the
1990s,’ International Finance Discussion Papers, 729, Board of Governors of the Federal
Reserve System.
Atkeson, A. and P. J. Kehoe (1995), ‘Industry Evolution and Transition: Measuring Investment in
Organizational Capital,’ Research Department Staff Report, 201, Federal Reserve Bank of
Minneapolis.
Aw, B. Y., X. Chen, and M. Roberts (1997), ‘Firm-Level Evidence on Productivity Differentials,
Turnover and Export in Taiwanese Manufacturing,’ NBER Working Paper 6235.
Caballero, R., T. Hoshi, and A Kashyap (2003), ‘Zombie Lending and Depresses Restructuring in
Japan,’ Working Paper.
Caballero, R. and A. Kashyap (2002), ‘Japan’s Indian Summer,’ The Wall Street Journal, July 18.
Davis, S. and J. Haltiwanger (1999), ‘Gross Job Flows,’ in O. Ashenfelter and D. Card (eds.),
Handbook of Labor Economics, Volume 3.
The Economist (2004), ‘Dead Firms Walking,’ Special report on Japan’s service economy,
September 25, 2004.
Feldman, R. (2002), ‘A Double Dip?’ The Economist, August 17.
19
Foster, L., J. Haltiwanger, and C. J. Krizan (1998), ‘Aggregate Productivity Growth: Lessons
from Microeconomic Evidence,’ Working Paper.
Griliches, Z. and H. Regev (1995), ‘Firm Productivity in Israeli Industry: 1979-1988,’ Journal of
Econometrics, 5, 1, 175-203.
Haltiwanger, J. (1997), ‘Measuring and Analyzing Aggregate Fluctuations: The Importance of
Building from Microeconomic Evidence?’ Federal Reserve Bank of St. Louis Review, May/June.
Haltiwanger, J. (2000), ‘Aggregate Growth: What Have We Learned from Microeconomic
Evidence?’ Working Paper.
Hayashi, F. and T. Inoue (1991), ‘The Relation Between Firm Growth and Q with Multiple
Capital Goods: Theory and Evidence from a Panel Data on Japanese Firms,’ Econometrica, 59,
731-53.
Hayashi, F. and E. Prescott (2002), ‘The 1990s in Japan: A Lost Decade,’ Review of Economic
Dynamics, January.
Hoshi, T. and A. Kashyap (1990), ‘Evidence on q and Investment for Japanese Firms,’ Journal of
the Japanese and International Economies, 4, 371-400.
Hoshi, T. and A. Kashyap (2000), ‘The Japanese Banking Crisis: Where Did It Come From and
How Will It End?’ in B. Bernanke and J. Rotemberg (eds.), NBER Macroeconomics Annual, 14.
Katz, R. (1998), Japan: The System that Soured (London: M.E. Sharpe).
20
Kawamoto, T. (2004), ‘What Do the Purified Solow Residuals Tell Us about Japan’s Lost
Decade?’ Discussion Paper 2004-E-5, Institute for Monetary and Economic Studies, Bank of
Japan.
Kim, S.-J. (2003), ‘Macro Effects of Corporate Restructuring in Japan,’ IMF Working Paper 203.
Lincoln, E. J. (2001), Arthritic Japan: The Slow Pace of Economic Reform (Washington, DC:
Brookings Institution).
Nagahata, T. and T. Sekine (2002), ‘The Effects of Monetary Policy of Firm Investment after the
Collapse of the Asset Price Bubble: An Investigation Using Japanese Micro Data,’ Working
Paper Series, 02-3, Research and Statistics Department, Bank of Japan.
Nishimura, K., T. Nakajima, and K. Kiyota (2005), ‘Does the Natural Selection Mechanism Still
Work in Severe Recessions?’ Journal of Economic Behavior and Organization (forthcoming).
Peek, J. and E. Rosengren (2003), ‘Unnatural Selection: Perverse Incentives and the
Misallocation of Credit in Japan,’ NBER Working Paper 9643, April.
Porter, M, H. Takeuchi, and M. Sakakibara (2000), ‘Can Japan Compete?’ (Massachusetts:
Perseus).
Shinada, N. (2003), ‘Decline in Productivity in Japan and Disparities Between Firms in the
1990s: An Empirical Approach Based on Data Envelopment Analysis,’ Research Report No. 38,
Development Bank of Japan.

21
Smith, D. C (2003), ‘Loans to Japanese Borrowers,’ Journal of the Japanese and International
Economies 17, September, 283-304.
22
Table 1
Growth Accounting
1981-1990 1991-2002
1. Real GDP (percent change) 4.1 1.3
Contribution (percentage points):
2. Labor input (hours worked) 0.7 -0.7
3. Labor productivity 3.4 2.0
4. Capital deepening 2.3 1.9
5. Multifactor productivity 1.1 0.1
23
Table 2
Labor Productivity and Share of GDP by Sector
Selected industries Labor productivity
(average annual growth)
Memo:
Share of GDP
1981-1990 1991-2001 2001
1. Manufacturing 4.0 2.9 24.0
of which:
2. Chemicals 4.4 3.2 2.1
3. Transport equipment 3.8 2.9 2.4
4. Electrical machinery 11.3 10.2 6.2
5. Non-electrical machinery 5.5 -0.5 2.0
6. Metals 2.3 2.2 2.2
7. Food products -0.1 0.1 2.3
8. Construction 3.1 -1.6 7.2
9. Wholesale and retail trade 4.0 1.5 14.8
10. Miscellaneous services -0.1 0.1 21.1
11. Miscellaneous services -0.1 0.1 21.1
24
Table 3
Industry Growth
a. Chemicals Average annual % change
1981-1990 1991-2001
1. Real value added 6.3 2.1
Contribution (percentage points):
2. Labor input (hours worked) 0.2 -2.3
3. Labor productivity 6.1 4.4
4. Capital deepening 3.8 2.6
5. Multifactor productivity 2.3 1.8
b. Transport Equipment Average annual % change
1981-1990 1991-2001
1. Real value added 7.8 2.7
Contribution (percentage points):
2. Labor input (hours worked) 2.6 -2.1
3. Labor productivity 5.2 4.8
4. Capital deepening 2.8 1.6
5. Multifactor productivity 2.4 3.2
25
Table 3
Industry Growth (continued)
c. Electrical Machinery Average annual % change
1981-1990 1991-2001
1. Real value added 9.4 1.5
Contribution (percentage points):
2. Labor input (hours worked) 1.8 -3.4
3. Labor productivity 7.6 4.9
4. Capital deepening 3.3 2.2
5. Multifactor productivity 4.3 2.7
d. Precision Machinery Average annual % change
1981-1990 1991-2001
1. Real value added 6.1 1.9
Contribution (percentage points):
2. Labor input (hours worked) 3.3 -2.5
3. Labor productivity 2.8 4.4
4. Capital deepening 3.5 2.5
5. Multifactor productivity -0.7 1.9
26
Table 3
Industry Growth (continued)
e. Food Products Average annual % change
1981-1990 1991-2001
1. Real value added 2.4 -0.9
Contribution (percentage points):
2. Labor input (hours worked) 1.3 -1.8
3. Labor productivity 1.1 0.9
4. Capital deepening 1.8 1.4
5. Multifactor productivity -0.7 -0.5
f. Textiles Average annual % change
1981-1990 1991-2001
1. Real value added 3.3 -3.1
Contribution (percentage points):
2. Labor input (hours worked) -2.6 -5.2
3. Labor productivity 5.9 2.1
4. Capital deepening 3.5 2.5
5. Multifactor productivity 2.4 -0.4
27
Table 3
Industry Growth (continued)
g. Iron and Steel Average annual % change
1981-1990 1991-2001
1. Real value added 0.3 -4.9
Contribution (percentage points):
2. Labor input (hours worked) -4.1 -5.1
3. Labor productivity 4.4 0.2
4. Capital deepening 3.3 1.8
5. Multifactor productivity 1.1 -1.6
h. Construction (Civil Engineering) Average annual % change
1981-1990 1991-2001
1. Real value added 5.2 0.0
Contribution (percentage points):
2. Labor input (hours worked) 0.0 -1.3
3. Labor productivity 5.2 1.3
4. Capital deepening 1.6 0.9
5. Multifactor productivity 3.6 0.4
28
Table 3
Industry Growth (continued)
i. Construction (Other) Average annual % change
1981-1990 1991-2001
1. Real value added 3.6 -0.5
Contribution (percentage points):
2. Labor input (hours worked) -0.8 -1.4
3. Labor productivity 4.4 0.9
4. Capital deepening 1.5 0.1
5. Multifactor productivity 2.9 0.8
j. Retail Trade Average annual % change
1981-1990 1991-2001
1. Real value added 3.6 -1.5
Contribution (percentage points):
2. Labor input (hours worked) 1.3 -2.9
3. Labor productivity 2.3 1.4
4. Capital deepening 1.7 1.3
5. Multifactor productivity 0.6 0.1
29
Table 3
Industry Growth (continued)
k. Wholesale Trade Average annual % change
1981-1990 1991-2001
1. Real value added 4.7 1.2
Contribution (percentage points):
2. Labor input (hours worked) 0.6 -1.9
3. Labor productivity 4.1 3.1
4. Capital deepening 2.2 1.4
5. Multifactor productivity 1.9 1.7
l. Cargo Road Transport Average annual % change
1981-1990 1991-2001
1. Real value added 3.8 1.8
Contribution (percentage points):
2. Labor input (hours worked) 2.6 2.7
3. Labor productivity 1.2 -0.9
4. Capital deepening 0.8 -0.5
5. Multifactor productivity 0.4 -0.4
30
Table 4
Results of Decomposition
a. Chemicals Average annual % change
1981-1990 1991-2001
1. Multifactor productivity 2.8 2.2
Contribution (percentage points):
2. “Within” component 2.0 1.4
3. “Between” component 0.1 0.0
4. “Covariance” component 0.7 0.8
b. Transport Equipment Average annual % change
1981-1990 1991-2001
1. Multifactor productivity 1.8 3.9
Contribution (percentage points):
2. “Within” component 1.5 3.3
3. “Between” component 0.1 0.2
4. “Covariance” component 0.2 0.4
31
Table 4
Results of Decomposition
c. Electrical Machinery Average annual % change
1981-1990 1991-2001
1. Multifactor productivity 4.1 4.3
Contribution (percentage points):
2. “Within” component 3.5 3.7
3. “Between” component 0.1 0.1
4. “Covariance” component 0.5 0.5
d. Precision Machinery Average annual % change
1981-1990 1991-2001
1. Multifactor productivity -0.7 2.0
Contribution (percentage points):
2. “Within” component -0.6 1.6
3. “Between” component -0.2 0.0
4. “Covariance” component 0.1 0.4
32
Table 4
Results of Decomposition
e. Food Products Average annual % change
1981-1990 1991-2001
1. Multifactor productivity -0.5 -0.3
Contribution (percentage points):
2. “Within” component -0.6 -0.5
3. “Between” component 0.0 0.0
4. “Covariance” component 0.1 0.2
f. Textiles Average annual % change
1981-1990 1991-2001
1. Multifactor productivity 2.1 -0.4
Contribution (percentage points):
2. “Within” component 2.2 -0.4
3. “Between” component 0.0 0.0
4. “Covariance” component -0.1 0.0
33
Table 4
Results of Decomposition
g. Iron and Steel Average annual % change
1981-1990 1991-2001
1. Multifactor productivity 1.3 -1.8
Contribution (percentage points):
2. “Within” component 1.1 -1.7
3. “Between” component 0.1 0.1
4. “Covariance” component 0.1 -0.2
h. Construction (Civil Engineering) Average annual % change
1981-1990 1991-2001
1. Multifactor productivity 3.2 -0.4
Contribution (percentage points):
2. “Within” component 2.2 -0.2
3. “Between” component 0.3 -0.1
4. “Covariance” component 0.7 -0.1
34
Table 4
Results of Decomposition (continued)
i. Construction (Other) Average annual % change
1981-1990 1991-2001
1. Multifactor productivity 2.9 0.2
Contribution (percentage points):
2. “Within” component 2.6 0.7
3. “Between” component 0.0 -0.3
4. “Covariance” component 0.3 -0.2
j. Retail Trade Average annual % change
1981-1990 1991-2001
1. Multifactor productivity 0.3 0.1
Contribution (percentage points):
2. “Within” component 0.2 0.3
3. “Between” component 0.0 0.0
4. “Covariance” component 0.1 -0.2
35
Table 4
Results of Decomposition (continued)
k. Wholesale Trade Average annual % change
1981-1990 1991-2001
1. Multifactor productivity 1.7 1.4
Contribution (percentage points):
2. “Within” component 1.6 1.5
3. “Between” component 0.1 0.0
4. “Covariance” component 0.0 -0.1
l. Cargo Road Transport Average annual % change
1981-1990 1991-2001
1. Multifactor productivity 0.2 -0.2
Contribution (percentage points):
2. “Within” component 0.0 0.1
3. “Between” component 0.1 0.1
4. “Covariance” component 0.1 -0.4
36
Figure 1
Figure 2
37
Figure 3
Figure 4
38