Embed Size (px)
Citation preview
Zverovich, V., Mahdjoubi, L., Boguslawski, P. and Fadli, F. (2017)Analytic prioritization of indoor routes for search and rescue opera-tions in hazardous environments. Computer-Aided Civil and Infras-
tructure Engineering, 32 (9). pp. 727-747. ISSN 1093-9687 Availablefrom: http://eprints.uwe.ac.uk/30717
We recommend you cite the published version.The publisher’s URL is:http://dx.doi.org/10.1111/mice.12260
Refereed: No
This is the peer reviewed version of the following article: Zverovich, V., Mahd-joubi, L., Boguslawski, P. and Fadli, F. (2017) Analytic prioritization of in-door routes for search and rescue operations in hazardous environments. Com-puter?Aided Civil and Infrastructure Engineering, 32 (9). pp. 727?747. ISSN1093?9687 Available from: http://eprints.uwe.ac.uk/30717, which has been pub-lished in final form at http://dx.doi.org/10.1111/mice.12260. This article maybe used for non?commercial purposes in accordance with Wiley Terms and Con-ditions for Self?Archiving.
Disclaimer
UWE has obtained warranties from all depositors as to their title in the materialdeposited and as to their right to deposit such material.
UWE makes no representation or warranties of commercial utility, title, or fit-ness for a particular purpose or any other warranty, express or implied in respectof any material deposited.
UWE makes no representation that the use of the materials will not infringeany patent, copyright, trademark or other property or proprietary rights.
UWE accepts no liability for any infringement of intellectual property rightsin any material deposited but will remove such material from public view pend-ing investigation in the event of an allegation of any such infringement.
PLEASE SCROLL DOWN FOR TEXT.
Computer-Aided Civil and Infrastructure Engineering 00 (2017) 1–21
Analytic Prioritization of Indoor Routes for Searchand Rescue Operations in Hazardous Environments
V. Zverovich*, L. Mahdjoubi & P. Boguslawski
University of the West of England, Bristol, UK
&
F. Fadli
Department of Architecture and Urban Planning, Qatar University, Doha, Qatar
Abstract: Applications to prioritize indoor routes foremergency situations in a complex built facility havebeen restricted to building simulations and network ap-proaches. These types of applications often failed to ac-count for the complexity and trade-offs needed to selectthe optimal indoor path during an emergency situation.In this article, we propose a step change for finding theoptimal routes for Search And Rescue (SAR) teams in abuilding, where a multi-epicenter extreme event is occur-ring. We have developed an algorithm that is based on anovel approach integrating the Analytic Hierarchy Pro-cess (AHP), statistical characteristics, the propagation ofhazard, Duckham–Kulik’s adapted algorithm, Dijkstra’sclassical algorithm, and the binary search with three cri-teria: hazard proximity, distance/travel time, and routecomplexity. The sub-criteria for the route complexity arevalidated in the context of SAR using a real-life build-ing (Doha World Trade Centre). The important featureof the algorithm is its ability to generate an optimal routedepending on user’s needs. The findings revealed that thegenerated optimal routes are indeed the “best” trade-offamong distance/travel time, hazard proximity, and routecomplexity. The test results also demonstrated the robust-ness of the algorithm with respect to different parameters,and its insensitivity to different scenarios of uncontrolledevacuation.∗To whom correspondence should be addressed. E-mail: [email protected].
This is an open access article under the terms of the Creative Com-mons Attribution License, which permits use, distribution and repro-duction in any medium, provided the original work is properly cited.
1 INTRODUCTION
Managing efficiently disaster scenes in built facilitiesis critical for Search And Rescue (SAR) personnel toprovide a time critical response, and thus eliminate thepotential for the loss of life, injury, and damage. Prevail-ing approaches have used either heuristic/knowledgerules encapsulated in a prototype computer model orGeography Information Science based emergency man-agement systems. The major limitation of many systemsdeveloped so far is the lack of practical applicability toan emergency response that provides decision makerswith means to assess several alternatives based onmultiple, conflicting criteria (Gomes and Lins, 2002).
To deal with the complexity of variables in anemergency situation, the Analytic Hierarchy Process(AHP) has offered one of the best ways for providingconsistent comparisons and selecting the best alterna-tive among several conflicting criteria. As an approachdesigned to handle decisions with multiple attributes,the AHP has been applied in a wide range of areas.For instance, Wang et al. (2010) recently applied theAHP for developing a comprehensive evaluation indexsystem used to weight railway emergency plans. TheAHP approach can be summarized into four main stepsand the calculation procedure as follows: (1) structuringa problem into a decision hierarchy consisting of criteriaand alternatives; (2) establishing pairwise comparisonsbetween decision elements at each hierarchy level; (3)transforming comparison matrices into sets of weights;(4) aggregating the weights to rank the alternatives.
C© 2017 The Authors. Computer-Aided Civil and Infrastructure Engineering published by Wiley Periodicals, Inc. on behalf of Society forComputer-Aided Civil and Infrastructure Engineering.DOI: 10.1111/mice.12260
2 Zverovich, Mahdjoubi, Boguslawski & Fadli
Despite the potential of the AHP technique, thereis currently little research that applied this approach inthe context of emergency response. In addition, therehas been no attempt to integrate the powerful analyticapproach with 3D indoor environments. This is thecentral issue of our research.
In this article, we propose an algorithm for findingthe optimal routes for SAR teams in a building, wherea multi-epicenter extreme event is occurring. The im-portant feature of the algorithm is its ability to generatean optimal route depending on user’s needs, that is, theuser has an option to specify the preferential ranking ofthree basic criteria. The algorithm is based on a novelapproach that integrates a new version of the AHPfor multi-attribute decision making, the direct itera-tion algorithm for eigenvectors/eigenvalues, statisticalcharacteristics, the propagation of hazard, Duckham–Kulik’s adapted algorithm for simplest paths, Dijkstra’sclassical algorithm for shortest paths, and the binarysearch with three criteria: hazard proximity, distance,and route complexity. We introduce and validate sub-criteria for the route complexity, and further develophazard proximity numbers and the proximity index forlarge open spaces in a building. The algorithm is pre-sented in Section 2, and in Section 3 it is validated andtested on a realistic complex building. In Section 4, weillustrate how the distance criterion can be replaced bytravel time using Nelson–MacLennan–Pauls’ formulafor people’s indoor speed, and extend this formulafor an SAR team moving in a counter-flow. Also, ouralgorithm is compared with an existing method.
1.1 State of the art in SAR and indoor environments
The typical research in emergency response is devotedto evacuation and rescue, with a focus on indoor nav-igation and route finding. Park et al. (2009) developeda time-dependent optimal routing algorithm based ona 2D network representing the building configuration,which has been enriched by relevant information aboutthe facility. The focus of their research is on computingoptimal routes leading SAR personnel to disasterlocations, taking into account the location of evacueesand smoke density. The method requires detectingpositions of people in a building per time period. Forthis purpose, an evacuation simulation system for iden-tifying the movement patterns of people in emergencysituations was used. Even though the algorithm hadconsiderable potential, the authors concluded that themethod needs “further improvements to fully apply toreal-time evacuation systems.”
The simplest path algorithm for a road network wasproposed by Duckham and Kulik (2003). The purposeof their method is to “minimize the complexity of a
route description, based on the amount of informa-tion required to negotiate each decision point.” It isinteresting to note that, unlike shortest paths, simplestpaths are neither symmetric nor satisfy the triangleinequality. Although the simplest path algorithm wasdeveloped for road networks, one of the advantages ofthe algorithm is that any weighting function can be usedin its input as a complexity function. This property willbe used in Section 2, where a new complexity functionfor indoor navigation is developed.
Another relevant article is by Liu and Zlatanova(2011), who proposed a new door-to-door approach forfinding routes between rooms and also a detailed routein a single room. Their algorithm was tested on a 2Dfloor plan of a building with complex indoor structure.Vanclooster et al. (2014) applied Grum’s least risk pathalgorithm to an indoor space for minimizing risks ofgetting lost, and proposed several improvements toGrum’s algorithm to make it more compatible withindoor networks.
Although this article is devoted to indoor navigationof SAR teams, some important surveys in the areaof evacuation are worth mentioning. A review of 16evacuation models was given by Gwynne et al. (1999),and Kuligowski (2004) reviewed 28 egress models.Further reviews of fire and evacuation models canbe found in Friedman (1992), Olenick and Carpenter(2003), and Watts (1987).
Any algorithm for indoor navigation is always basedon a spatial model. A good example of such a model wasgiven by Kwan and Lee (2005, Figure 5). The structureof a building is represented as a logical network, wherethe nodes represent spatial objects such as rooms,corridors, and other navigable areas. The edges repre-sent navigable connections between adjacent objects.The network can be further extended to a geometricnetwork to model precise geometric properties (e.g.,distance between nodes and their locations) and pro-vide real navigation routes. Boguslawski et al. (2015)recently developed a 3D building model, which is an in-tegration of Building Information Modeling technologyand Geography Information Science analysis.
A number of works in the area of rescue operationsduring emergency response have focused on stochas-ticity aspects in different contexts. For example, Changet al. (2007) formulated the flood emergency logisticsproblem with uncertainty as two stochastic program-ming models. Aboshosha and Zell (2003) used thestochastic control theory and fuzzy inference systems toprovide rescue robots with an adaptive behavior whensearching for victims in various disasters. Barbarosogluand Arda (2004) developed a two-stage stochasticprogramming model for planning the transportation offirst-aid commodities to disaster areas. Further research
Analytic prioritization of indoor routes for search and rescue operations 3
is needed to address uncertain dynamics of extremeevents.
Another relevant area is multi-objective shortestpath (MOSP) problems. The first part of the algorithmpresented in this article consists of MOSP heuristics,which are based on binary searches. There are otherinteresting approaches, for example, an Ant ColonyOptimization (ACO) algorithm has been successfullyapplied for finding evacuation routes during a tsunami(Forcael et al., 2014). This algorithm is an ACOheuristic for the MOSP problem. Such heuristics areimportant, because standard MOSP problems are com-putationally harder than ones with a single objective.Some surveys in this area are worth mentioning. Pangili-nan and Janssens (2007) gave an overview of the MOSPproblems and a review of essential issues for their so-lution. Skriver (2000) and Ulungu and Teghem (1991)reviewed the existing literature on MOSP problems.
1.2 The AHP approach for ranking alternatives
An important integrated part of the presented algo-rithms is the AHP, which is one of the best multi-attribute rating techniques developed by Thomas Saaty(1980, 1990, 1999) for the United States government.The AHP is an eigenvalue approach designed to handledecisions with multiple attributes, and it has beenapplied in a wide range of areas. A survey of the AHP,its applications, and interesting facts were given bySaaty (1999), Zahedi (1986), and Foreman (1993). Themost recent application of the AHP was developedby Turskis et al. (2016) for selecting the foundationtype for a single-storey dwelling house. Another inter-esting application of the fuzzy AHP to tunnel healthevaluation was proposed by Zhang et al. (2014).
The first stage in the AHP is to set up a decisionhierarchy, which is called a hierarchy tree. This meansthat the decision problem is broken down into hierar-chies of its decision elements. At the root of the tree isthe most general objective of the problem, then all therelevant attributes are arranged at the first hierarchylevel. At the next level of the hierarchy tree, some ofthe attributes might be broken down into more detailand so forth. Finally, at the lowest level in the hierarchytree, the available alternatives are set out.
At the second stage, each attribute is compared inturn with every other attribute at the same level of thehierarchy. For each comparison, a decision maker hasto determine to what extent one attribute is more (orless) important than the other attribute. When makingsuch a decision, the following ratings are used (seeSaaty, 1980): 1 (equally important), 3 (weakly more im-portant), 5 (strongly more important), 7 (very stronglymore important), 9 (extremely more important). For
example, if attribute X is weakly more important thanattribute Y, then X is 3 times more important than Y.Therefore, the latter attribute is only 1/3 as importantas the former attribute, that is, 3 times less important.Ratings between the above numbers are allowed; henceone may use direct numerical inputs on the scale from1/9 (extremely less important) to 9 (extremely more im-portant). Thus, for a given hierarchy of size n, one canconstruct a reciprocal comparison n×n matrix A, whereits elements have the property Ai,j = 1/Aj,i and themain diagonal consists of 1’s. The process of pairwisecomparisons should be carried out for each hierarchy.Finally, the available alternatives are pairwisely com-pared with respect to the attributes in the levels above.
The third stage is to transform the comparisonmatrices into sets of weights representing the relativeimportance of all the attributes (or alternatives) at thesame hierarchy level. For an n×n comparison matrixA of a particular hierarchy, let λmax denote the largesteigenvalue and w be the corresponding normalizedeigenvector, that is, Aw = λmax w. The components ofthe vector w = (w1, w2, . . . , wn) are the weights of theattributes (or alternatives) of that hierarchy, so that thefirst attribute (alternative) has weight w1, the secondw2, and so on. Next, the Consistency Index (CI) of Ais calculated as follows: CI = λmax −n
n−1 . The CI is thennormalized by the Random Index (RI), which is theaverage CI over random entries of reciprocal matricesof the same order. The accurate list of RIs for n�100was given by Donegan and Dodd (1991). Thus, the Con-sistency Ratio (CR) is calculated as follows: CR = CI
RI .The comparison matrix is considered as consistent ifCR<0.05 for n = 3, CR<0.09 for n = 4, and CR<0.1 forn>4. An inconsistent matrix should be reconsidered.
The final stage of the AHP is to aggregate the weightsand compare the alternative options. To find the ag-gregate score of an alternative, all paths going from theroot of the tree to this particular alternative are firstidentified. For each path, all weights along that pathare multiplied together. Then the resulting numbersare summed for all the above paths. Thus, each of thealternatives will be given an aggregate score between0 and 1, to signify the priority of that alternative withrespect to other alternatives.
2 ALGORITHM FOR PRIORITIZATIONOF INDOOR ROUTES (PIR-ALGORITHM)
We start this section with problem definition. Supposethat there is a building, where an extreme event withmany epicenters is occurring. As defined by Zverovichet al. (2016), the location of a bomb or a terrorist isan “epicenter,” whereas for fire the “epicenters” can
4 Zverovich, Mahdjoubi, Boguslawski & Fadli
be defined as points (nodes) in the building, where thetemperature exceeds a certain threshold. Note that alarge extreme event would be typically represented byseveral epicenters, which are denoted by z1,z2, . . . ,zk.
Further, assume that an agent has to go from pointp to point q in the building. For example, using one ofthe exits as an entrance point, an SAR team must findthe “best” route to trapped people in the building, andthen find a route back to one of the exits, which mightbe different to the first route. Taking into account thatthere is hazard in the building, such routes must bereasonably safe, simple, and short/fast; they will becalled “optimal routes.” Thus, three criteria should beconsidered for a route: hazard proximity, route com-plexity, and distance. Note that the distance criterionmay be replaced by travel time if information about thedistribution of people in the building is available. Theagent must be given an option to choose a right balanceof the aforementioned criteria. For instance, the agentmight have personal protective equipment, so that thehazard proximity becomes least important; anotheruser might want to minimize the route complexity, thusmaking this criterion most important. The algorithmfor finding the optimal routes must possess the afore-mentioned properties. Moreover, it must be robust andefficient, and produce a reliable result.
In what follows, we will exploit the 3D buildingmodel recently developed by Boguslawski et al. (2015).An original BIM model was created in Autodesk Revitand exported to a surface representation stored in thegbXML format. Subsequently, a graph representationwas reconstructed based on the model geometry,topology, and semantical information. Topologicalrelationships and information about doors betweenadjacent rooms were used to generate a logical net-work. In this network, denoted by G, nodes representspaces (e.g., rooms), whereas links represent adjacencyrelationship among those spaces. Some of the links aremarked as navigable if two adjacent spaces have a doorbetween them. In addition, links between staircasenodes are considered for navigation, which automati-cally allow for navigation between the building floors.Afterwards, more detailed navigable networks aregenerated for specific spaces with a complex geometryand several doors, for example, corridors (Boguslawskiet al., 2016). The navigable networks together withnavigable links from the logical network G are used toform the unified navigable network G*, where speciallinks representing doors and staircases are introduced.A movement from one space to another can be detectedwhen one of the special links is used. In other words,nodes belonging to an individual space are linked withnodes from another space by special links. An exampleof the unified network G* will be given in Section 3.
The input of PIR-Algorithm consists of the afore-mentioned graphs G and G*, and the epicenters of anextreme event z1,z2, . . . ,zk. The input also includes thestart node p and the destination node q of the required(p,q)-route. Note that p may be the artificial nodeoutside the building connected to all exits for findinga route going from one of the exits to the specifiedlocation q. Alternatively, the node p may be one of thelocations in the building, in which case the destinationnode q is optional. If q is not specified in this case, thenby default it is one of the exits.
The optional maximal propagation coefficient ρmax
is also a part of the input, by default ρmax = 100. Thepropagation coefficient ρ represents the degree ofhazard spread through a building, and this spread isreflected in hazard proximity numbers defined in Step3(a) of PIR-algorithm. For instance, if ρ is high, thenhazard proximity numbers for nodes propagate quicklyfrom 100 (in the epicenter) to small positive numbers(far from the epicenter). This puts a strong emphasison the epicenter and the rooms in its close proximity.In contrast, if ρ is a small positive number, then thepropagation is slow, thus putting less emphasis on theepicenter and the nearby rooms. In the extreme caseρ = 0 there is no propagation of hazard, that is, allhazard proximity numbers for nodes are equal.
Finally, a user can optionally choose the preferentialranking of the three criteria: distance (D), hazard prox-imity (HP), and route complexity (RC). By default,HP>D>RC, that is, HP is the most important criterion,D is the second most important, and RC is the leastimportant. For an advanced user, who might havepersonal protective equipment and/or wish to minimizethe route complexity, seven options are available:
D>HP>RC, D>RC>HP, HP>D>RC, HP>RC>D,
RC>D>HP, RC>HP>D, D=HP=RC
In general, PIR-Algorithm has two parts. In thefirst part (Steps 1–5), a set R of feasible (p,q)-routes isgenerated. This set includes three “extreme” routes: theshortest, the safest and the simplest routes, as well asa number of routes where the aforementioned criteria(D, HP, RC) are taken into account with different de-grees of importance. It may be pointed out that the set Rtypically consists of all “reasonable” (p,q)-routes, whichis achieved by two binary searches. The second partof PIR-Algorithm (Steps 6–12) constitutes a stochasticversion of the AHP. Using statistical and quantitativecharacteristics of the routes from the set R, the AHPprioritizes the routes with respect to the specified pref-erential ranking of the criteria. Thus, the algorithm findsthe best (p,q)-route, the second best (p,q)-route, etc.
Analytic prioritization of indoor routes for search and rescue operations 5
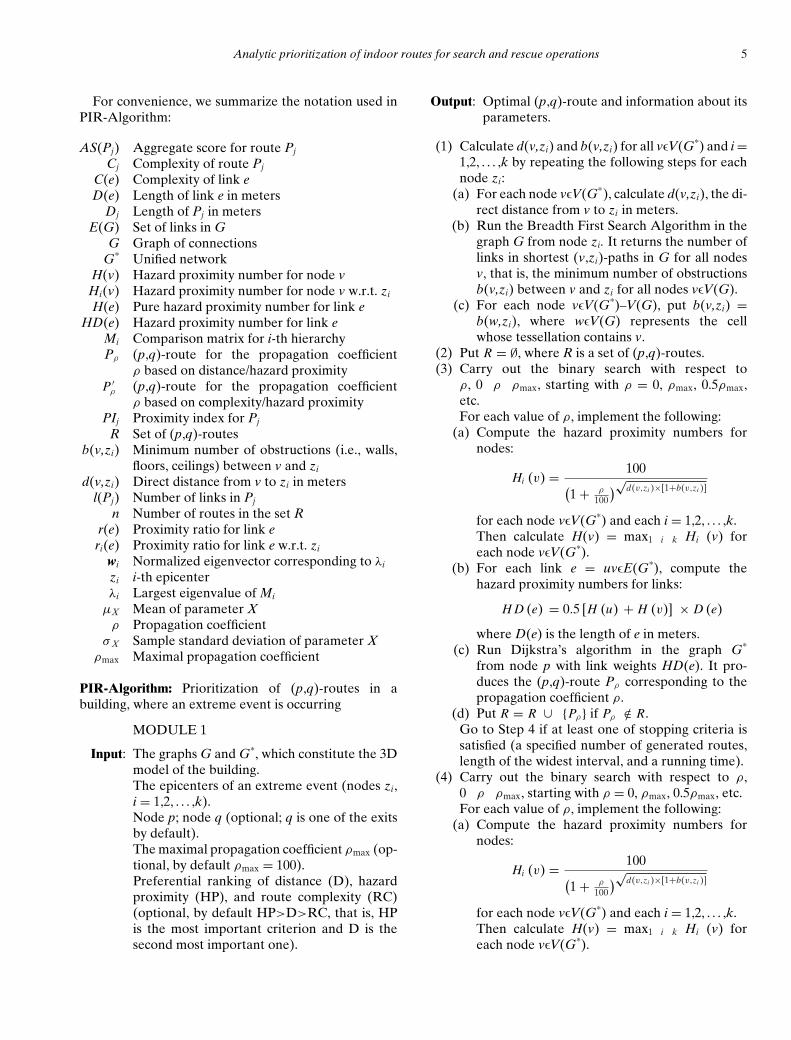
For convenience, we summarize the notation used inPIR-Algorithm:
AS(Pj) Aggregate score for route Pj
Cj Complexity of route Pj
C(e) Complexity of link eD(e) Length of link e in meters
Dj Length of Pj in metersE(G) Set of links in G
G Graph of connectionsG* Unified network
H(v) Hazard proximity number for node vHi(v) Hazard proximity number for node v w.r.t. zi
H(e) Pure hazard proximity number for link eHD(e) Hazard proximity number for link e
Mi Comparison matrix for i-th hierarchyPρ (p,q)-route for the propagation coefficient
ρ based on distance/hazard proximityP ′
ρ (p,q)-route for the propagation coefficientρ based on complexity/hazard proximity
PIj Proximity index for Pj
R Set of (p,q)-routesb(v,zi) Minimum number of obstructions (i.e., walls,
floors, ceilings) between v and zi
d(v,zi) Direct distance from v to zi in metersl(Pj) Number of links in Pj
n Number of routes in the set Rr(e) Proximity ratio for link eri(e) Proximity ratio for link e w.r.t. zi
wi Normalized eigenvector corresponding to λi
zi i-th epicenterλi Largest eigenvalue of Mi
μX Mean of parameter Xρ Propagation coefficient
σ X Sample standard deviation of parameter Xρmax Maximal propagation coefficient
PIR-Algorithm: Prioritization of (p,q)-routes in abuilding, where an extreme event is occurring
MODULE 1
Input: The graphs G and G*, which constitute the 3Dmodel of the building.The epicenters of an extreme event (nodes zi,i = 1,2, . . . ,k).Node p; node q (optional; q is one of the exitsby default).The maximal propagation coefficient ρmax (op-tional, by default ρmax = 100).Preferential ranking of distance (D), hazardproximity (HP), and route complexity (RC)(optional, by default HP>D>RC, that is, HPis the most important criterion and D is thesecond most important one).
Output: Optimal (p,q)-route and information about itsparameters.
(1) Calculate d(v,zi) and b(v,zi) for all vϵV(G*) and i =1,2, . . . ,k by repeating the following steps for eachnode zi:
(a) For each node vϵV(G*), calculate d(v,zi), the di-rect distance from v to zi in meters.
(b) Run the Breadth First Search Algorithm in thegraph G from node zi. It returns the number oflinks in shortest (v,zi)-paths in G for all nodesv, that is, the minimum number of obstructionsb(v,zi) between v and zi for all nodes vϵV(G).
(c) For each node vϵV(G*)–V(G), put b(v,zi) =b(w,zi), where wϵV(G) represents the cellwhose tessellation contains v.
(2) Put R = ∅, where R is a set of (p,q)-routes.(3) Carry out the binary search with respect to
ρ, 0�ρ�ρmax, starting with ρ = 0, ρmax, 0.5ρmax,etc.For each value of ρ, implement the following:
(a) Compute the hazard proximity numbers fornodes:
Hi (v) = 100(1 + ρ
100
)√d(v,zi )×[1+b(v,zi )]
for each node vϵV(G*) and each i = 1,2, . . . ,k.Then calculate H(v) = max1�i�k Hi (v) foreach node vϵV(G*).
(b) For each link e = uvϵE(G*), compute thehazard proximity numbers for links:
H D (e) = 0.5 [H (u) + H (v)] × D (e)
where D(e) is the length of e in meters.(c) Run Dijkstra’s algorithm in the graph G*
from node p with link weights HD(e). It pro-duces the (p,q)-route Pρ corresponding to thepropagation coefficient ρ.
(d) Put R = R ∪ {Pρ} if Pρ /∈ R.Go to Step 4 if at least one of stopping criteria issatisfied (a specified number of generated routes,length of the widest interval, and a running time).
(4) Carry out the binary search with respect to ρ,0�ρ�ρmax, starting with ρ = 0, ρmax, 0.5ρmax, etc.For each value of ρ, implement the following:
(a) Compute the hazard proximity numbers fornodes:
Hi (v) = 100(1 + ρ
100
)√d(v,zi )×[1+b(v,zi )]
for each node vϵV(G*) and each i = 1,2, . . . ,k.Then calculate H(v) = max1�i�k Hi (v) foreach node vϵV(G*).
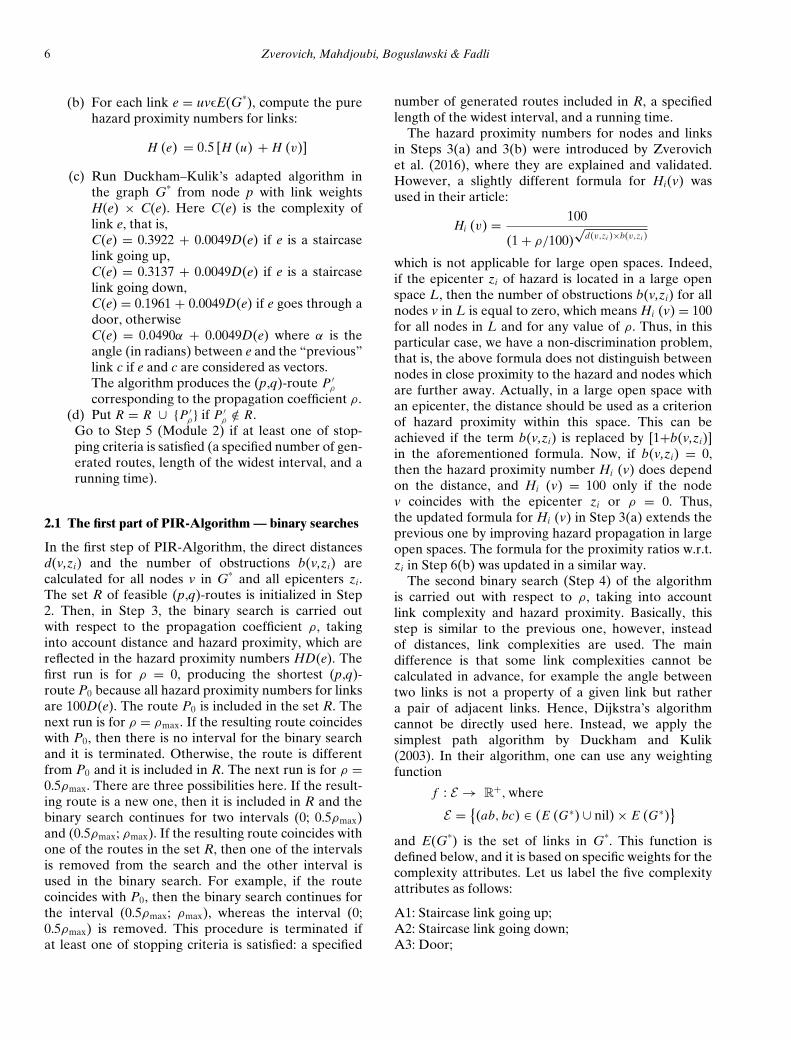
6 Zverovich, Mahdjoubi, Boguslawski & Fadli
(b) For each link e = uvϵE(G*), compute the purehazard proximity numbers for links:
H (e) = 0.5 [H (u) + H (v)]
(c) Run Duckham–Kulik’s adapted algorithm inthe graph G* from node p with link weightsH(e) × C(e). Here C(e) is the complexity oflink e, that is,C(e) = 0.3922 + 0.0049D(e) if e is a staircaselink going up,C(e) = 0.3137 + 0.0049D(e) if e is a staircaselink going down,C(e) = 0.1961 + 0.0049D(e) if e goes through adoor, otherwiseC(e) = 0.0490α + 0.0049D(e) where α is theangle (in radians) between e and the “previous”link c if e and c are considered as vectors.The algorithm produces the (p,q)-route P ′
ρ
corresponding to the propagation coefficient ρ.(d) Put R = R ∪ {P ′
ρ} if P ′ρ /∈ R.
Go to Step 5 (Module 2) if at least one of stop-ping criteria is satisfied (a specified number of gen-erated routes, length of the widest interval, and arunning time).
2.1 The first part of PIR-Algorithm — binary searches
In the first step of PIR-Algorithm, the direct distancesd(v,zi) and the number of obstructions b(v,zi) arecalculated for all nodes v in G* and all epicenters zi.The set R of feasible (p,q)-routes is initialized in Step2. Then, in Step 3, the binary search is carried outwith respect to the propagation coefficient ρ, takinginto account distance and hazard proximity, which arereflected in the hazard proximity numbers HD(e). Thefirst run is for ρ = 0, producing the shortest (p,q)-route P0 because all hazard proximity numbers for linksare 100D(e). The route P0 is included in the set R. Thenext run is for ρ = ρmax. If the resulting route coincideswith P0, then there is no interval for the binary searchand it is terminated. Otherwise, the route is differentfrom P0 and it is included in R. The next run is for ρ =0.5ρmax. There are three possibilities here. If the result-ing route is a new one, then it is included in R and thebinary search continues for two intervals (0; 0.5ρmax)and (0.5ρmax; ρmax). If the resulting route coincides withone of the routes in the set R, then one of the intervalsis removed from the search and the other interval isused in the binary search. For example, if the routecoincides with P0, then the binary search continues forthe interval (0.5ρmax; ρmax), whereas the interval (0;0.5ρmax) is removed. This procedure is terminated ifat least one of stopping criteria is satisfied: a specified
number of generated routes included in R, a specifiedlength of the widest interval, and a running time.
The hazard proximity numbers for nodes and linksin Steps 3(a) and 3(b) were introduced by Zverovichet al. (2016), where they are explained and validated.However, a slightly different formula for Hi(v) wasused in their article:
Hi (v) = 100
(1 + ρ/100)√
d(v,zi )×b(v,zi )
which is not applicable for large open spaces. Indeed,if the epicenter zi of hazard is located in a large openspace L, then the number of obstructions b(v,zi) for allnodes v in L is equal to zero, which means Hi (v) = 100for all nodes in L and for any value of ρ. Thus, in thisparticular case, we have a non-discrimination problem,that is, the above formula does not distinguish betweennodes in close proximity to the hazard and nodes whichare further away. Actually, in a large open space withan epicenter, the distance should be used as a criterionof hazard proximity within this space. This can beachieved if the term b(v,zi) is replaced by [1+b(v,zi)]in the aforementioned formula. Now, if b(v,zi) = 0,then the hazard proximity number Hi (v) does dependon the distance, and Hi (v) = 100 only if the nodev coincides with the epicenter zi or ρ = 0. Thus,the updated formula for Hi (v) in Step 3(a) extends theprevious one by improving hazard propagation in largeopen spaces. The formula for the proximity ratios w.r.t.zi in Step 6(b) was updated in a similar way.
The second binary search (Step 4) of the algorithmis carried out with respect to ρ, taking into accountlink complexity and hazard proximity. Basically, thisstep is similar to the previous one, however, insteadof distances, link complexities are used. The maindifference is that some link complexities cannot becalculated in advance, for example the angle betweentwo links is not a property of a given link but rathera pair of adjacent links. Hence, Dijkstra’s algorithmcannot be directly used here. Instead, we apply thesimplest path algorithm by Duckham and Kulik(2003). In their algorithm, one can use any weightingfunction
f : E → R+, where
E = {(ab, bc) ∈ (E (G∗) ∪ nil) × E (G∗)
}and E(G*) is the set of links in G*. This function isdefined below, and it is based on specific weights for thecomplexity attributes. Let us label the five complexityattributes as follows:
A1: Staircase link going up;A2: Staircase link going down;A3: Door;
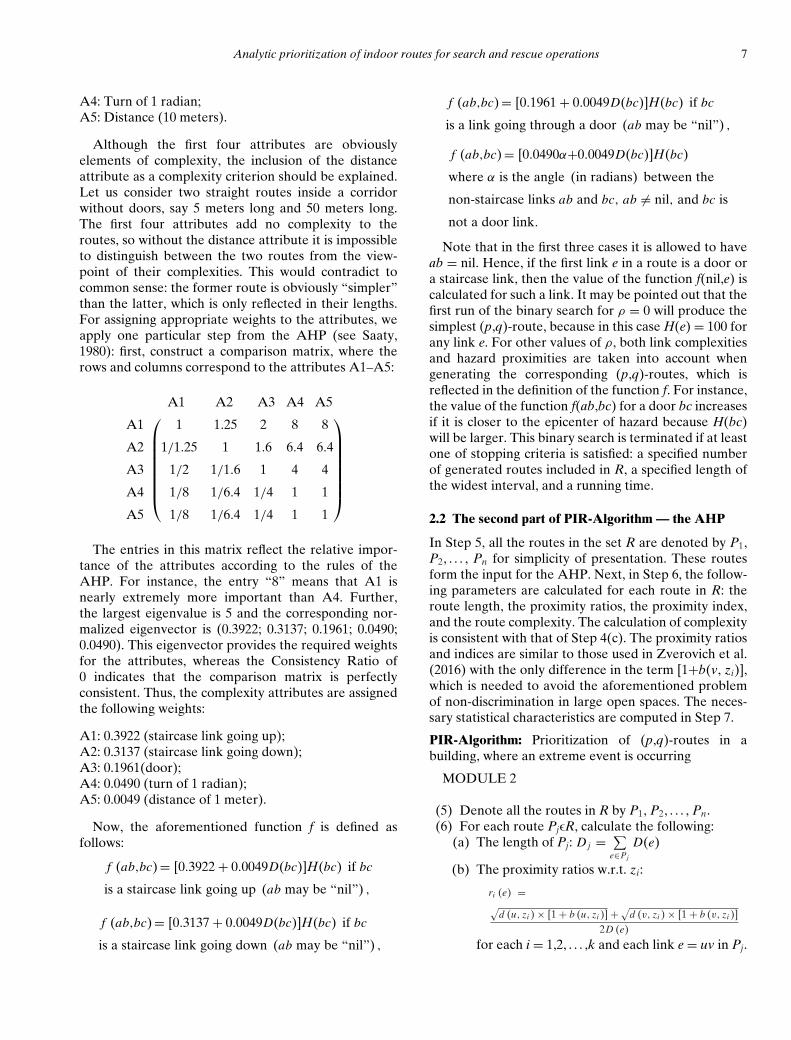
Analytic prioritization of indoor routes for search and rescue operations 7
A4: Turn of 1 radian;A5: Distance (10 meters).
Although the first four attributes are obviouslyelements of complexity, the inclusion of the distanceattribute as a complexity criterion should be explained.Let us consider two straight routes inside a corridorwithout doors, say 5 meters long and 50 meters long.The first four attributes add no complexity to theroutes, so without the distance attribute it is impossibleto distinguish between the two routes from the view-point of their complexities. This would contradict tocommon sense: the former route is obviously “simpler”than the latter, which is only reflected in their lengths.For assigning appropriate weights to the attributes, weapply one particular step from the AHP (see Saaty,1980): first, construct a comparison matrix, where therows and columns correspond to the attributes A1–A5:
A1
A2
A3
A4
A5
A1 A2 A3 A4 A5⎛⎜⎜⎜⎜⎜⎜⎜⎝
1 1.25 2 8 8
1/1.25 1 1.6 6.4 6.4
1/2 1/1.6 1 4 4
1/8 1/6.4 1/4 1 1
1/8 1/6.4 1/4 1 1
⎞⎟⎟⎟⎟⎟⎟⎟⎠
The entries in this matrix reflect the relative impor-tance of the attributes according to the rules of theAHP. For instance, the entry “8” means that A1 isnearly extremely more important than A4. Further,the largest eigenvalue is 5 and the corresponding nor-malized eigenvector is (0.3922; 0.3137; 0.1961; 0.0490;0.0490). This eigenvector provides the required weightsfor the attributes, whereas the Consistency Ratio of0 indicates that the comparison matrix is perfectlyconsistent. Thus, the complexity attributes are assignedthe following weights:
A1: 0.3922 (staircase link going up);A2: 0.3137 (staircase link going down);A3: 0.1961(door);A4: 0.0490 (turn of 1 radian);A5: 0.0049 (distance of 1 meter).
Now, the aforementioned function f is defined asfollows:
f (ab,bc) = [0.3922 + 0.0049D(bc)]H(bc) if bc
is a staircase link going up (ab may be “nil”) ,
f (ab,bc) = [0.3137 + 0.0049D(bc)]H(bc) if bc
is a staircase link going down (ab may be “nil”) ,
f (ab,bc) = [0.1961 + 0.0049D(bc)]H(bc) if bc
is a link going through a door (ab may be “nil”) ,
f (ab,bc) = [0.0490α+0.0049D(bc)]H(bc)
where α is the angle (in radians) between the
non-staircase links ab and bc, ab = nil, and bc is
not a door link.
Note that in the first three cases it is allowed to haveab = nil. Hence, if the first link e in a route is a door ora staircase link, then the value of the function f(nil,e) iscalculated for such a link. It may be pointed out that thefirst run of the binary search for ρ = 0 will produce thesimplest (p,q)-route, because in this case H(e) = 100 forany link e. For other values of ρ, both link complexitiesand hazard proximities are taken into account whengenerating the corresponding (p,q)-routes, which isreflected in the definition of the function f. For instance,the value of the function f(ab,bc) for a door bc increasesif it is closer to the epicenter of hazard because H(bc)will be larger. This binary search is terminated if at leastone of stopping criteria is satisfied: a specified numberof generated routes included in R, a specified length ofthe widest interval, and a running time.
2.2 The second part of PIR-Algorithm — the AHP
In Step 5, all the routes in the set R are denoted by P1,P2, . . . , Pn for simplicity of presentation. These routesform the input for the AHP. Next, in Step 6, the follow-ing parameters are calculated for each route in R: theroute length, the proximity ratios, the proximity index,and the route complexity. The calculation of complexityis consistent with that of Step 4(c). The proximity ratiosand indices are similar to those used in Zverovich et al.(2016) with the only difference in the term [1+b(v, zi)],which is needed to avoid the aforementioned problemof non-discrimination in large open spaces. The neces-sary statistical characteristics are computed in Step 7.
PIR-Algorithm: Prioritization of (p,q)-routes in abuilding, where an extreme event is occurring
MODULE 2
(5) Denote all the routes in R by P1, P2, . . . , Pn.(6) For each route PjϵR, calculate the following:
(a) The length of Pj: D j = ∑e∈Pj
D(e)
(b) The proximity ratios w.r.t. zi:
ri (e) =√d (u, zi ) × [1 + b (u, zi )] + √
d (v, zi ) × [1 + b (v, zi )]2D (e)
for each i = 1,2, . . . ,k and each link e = uv in Pj.
8 Zverovich, Mahdjoubi, Boguslawski & Fadli
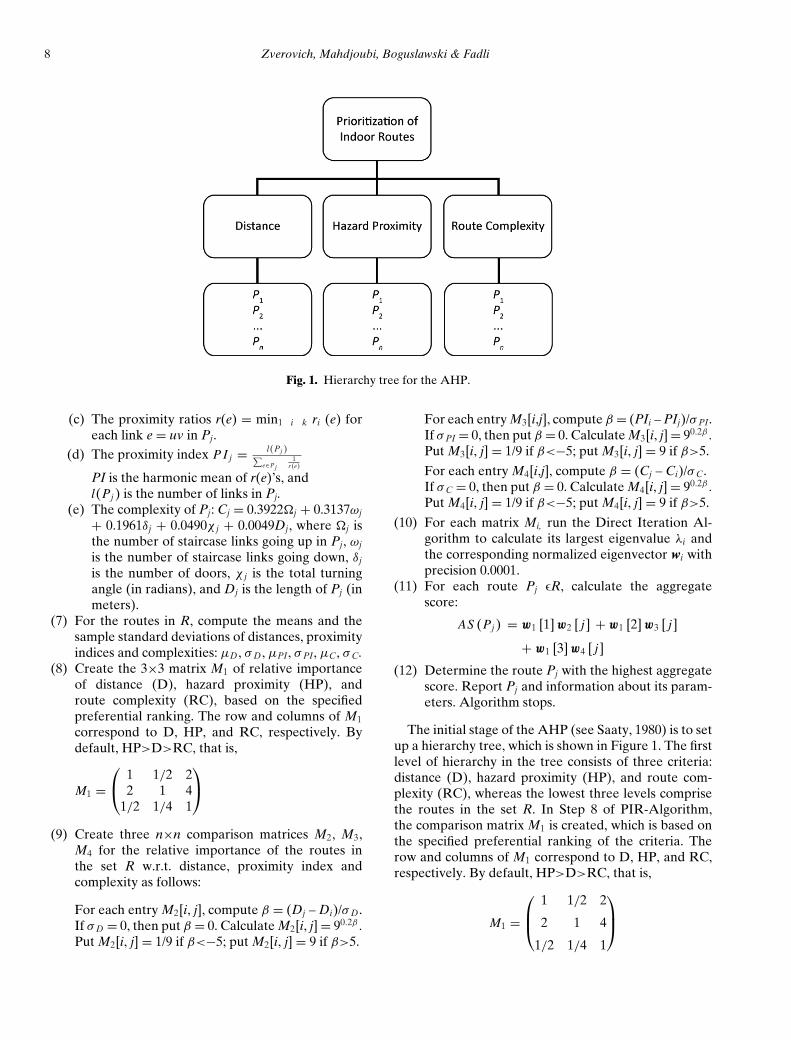
Fig. 1. Hierarchy tree for the AHP.
(c) The proximity ratios r(e) = min1�i�k ri (e) foreach link e = uv in Pj.
(d) The proximity index P I j = l(Pj )∑e∈Pj
1r(e)
PI is the harmonic mean of r(e)’s, andl(Pj ) is the number of links in Pj.
(e) The complexity of Pj: Cj = 0.3922�j + 0.3137ωj
+ 0.1961δj + 0.0490χ j + 0.0049Dj, where �j isthe number of staircase links going up in Pj, ωj
is the number of staircase links going down, δj
is the number of doors, χ j is the total turningangle (in radians), and Dj is the length of Pj (inmeters).
(7) For the routes in R, compute the means and thesample standard deviations of distances, proximityindices and complexities: μD, σ D, μPI, σ PI, μC, σ C.
(8) Create the 3×3 matrix M1 of relative importanceof distance (D), hazard proximity (HP), androute complexity (RC), based on the specifiedpreferential ranking. The row and columns of M1
correspond to D, HP, and RC, respectively. Bydefault, HP>D>RC, that is,
M1 =⎛⎝ 1 1/2 2
2 1 41/2 1/4 1
⎞⎠
(9) Create three n×n comparison matrices M2, M3,M4 for the relative importance of the routes inthe set R w.r.t. distance, proximity index andcomplexity as follows:
For each entry M2[i, j], compute β = (Dj – Di)/σ D.If σ D = 0, then put β = 0. Calculate M2[i, j] = 90.2β.
Put M2[i, j] = 1/9 if β<−5; put M2[i, j] = 9 if β>5.
For each entry M3[i,j], compute β = (PIi – PIj)/σ PI.If σ PI = 0, then put β = 0. Calculate M3[i, j] = 90.2β.
Put M3[i, j] = 1/9 if β<−5; put M3[i, j] = 9 if β>5.
For each entry M4[i,j], compute β = (Cj – Ci)/σ C.If σ C = 0, then put β = 0. Calculate M4[i, j] = 90.2β.
Put M4[i, j] = 1/9 if β<−5; put M4[i, j] = 9 if β>5.
(10) For each matrix Mi, run the Direct Iteration Al-gorithm to calculate its largest eigenvalue λi andthe corresponding normalized eigenvector wi withprecision 0.0001.
(11) For each route Pj ϵR, calculate the aggregatescore:
AS (Pj ) = w1 [1] w2 [ j] + w1 [2] w3 [ j]
+ w1 [3] w4 [ j]
(12) Determine the route Pj with the highest aggregatescore. Report Pj and information about its param-eters. Algorithm stops.
The initial stage of the AHP (see Saaty, 1980) is to setup a hierarchy tree, which is shown in Figure 1. The firstlevel of hierarchy in the tree consists of three criteria:distance (D), hazard proximity (HP), and route com-plexity (RC), whereas the lowest three levels comprisethe routes in the set R. In Step 8 of PIR-Algorithm,the comparison matrix M1 is created, which is based onthe specified preferential ranking of the criteria. Therow and columns of M1 correspond to D, HP, and RC,respectively. By default, HP>D>RC, that is,
M1 =
⎛⎜⎝
1 1/2 2
2 1 4
1/2 1/4 1
⎞⎟⎠
Analytic prioritization of indoor routes for search and rescue operations 9
In general, there are 7 possibilities for thepreferential ranking: D>HP>RC, D>RC>HP,HP>D>RC, HP>RC>D, RC>D>HP, RC>HP>D,and D=HP=RC. For example, if D>HP>RC, then
M1 =
⎛⎜⎝
1 2 4
1/2 1 2
1/4 1/2 1
⎞⎟⎠ ;
if D=HP=RC, then M1 consists of 1’s. Notice that thematrix M1 is always perfectly consistent.
Three n×n comparison matrices M2, M3, and M4
are constructed in Step 9. They represent the relativeimportance of the routes in the set R w.r.t. distance,proximity index and complexity, respectively, and theconstruction of the matrices is based on the correspond-ing parameters and standard deviations. For instance,the (i, j)-element of the matrix M2 is calculated as fol-lows: we first compute β = (Dj – Di)/σ D, where Dj andDi are the lengths of the routes Pj and Pi in meters; ifσ D = 0, then we put β = 0. Next, M2[i, j] = 1/9 if β< −5,M2[i, j] = 9 if β>5, and M2[i,j] = 90.2β otherwise. Thus,the (i, j)-element of the matrix M2 represents therelative importance of the routes Pi and Pj in terms ofstandard deviations between their lengths. For example,if the difference in lengths is 2.5 standard deviations,then one route is weakly more important than theother, which will be reflected by the entry “3” in thecomparison matrix. It may be pointed out that differentfunctions for constructing the above matrices have beentested, and it turned out that the best one is the expo-nential function 90.2β. Also, because of the way the ma-trices M2, M3, and M4 are constructed, the correspond-ing Consistency Indices and Consistency Ratios arealways very small, or equal to zero. Hence, the matricesare very consistent and there is no need to adjust them.
In Step 10, the standard Direct Iteration Algorithmis used to calculate the largest eigenvalue λi for eachmatrix Mi and the corresponding normalized eigenvec-tor wi with precision 0.0001. For each route Pj ϵR, theaggregate score is computed in Step 11 as follows:
AS (Pj ) = w1 [1] w2 [ j] + w1 [2] w3 [ j] + w1 [3] w4 [ j]
Finally, in Step 12, the route Pj with the highestaggregate score is determined and reported, togetherwith the information about the parameters of this route.
3 TESTING PIR-ALGORITHM
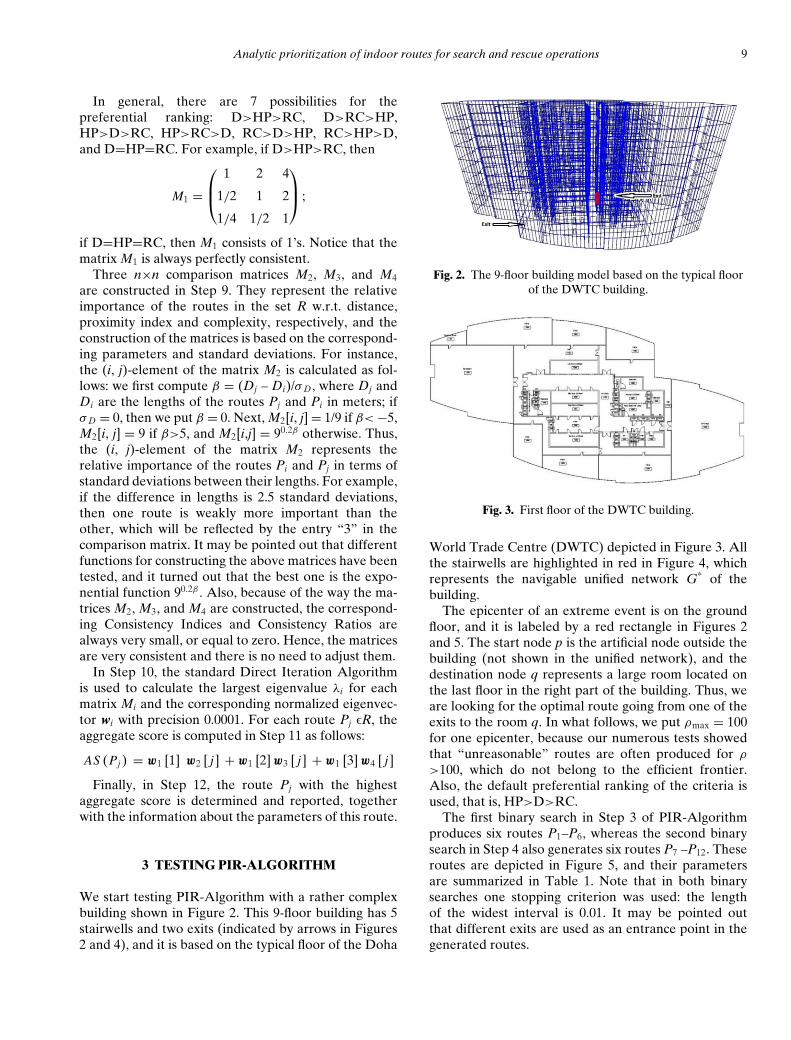
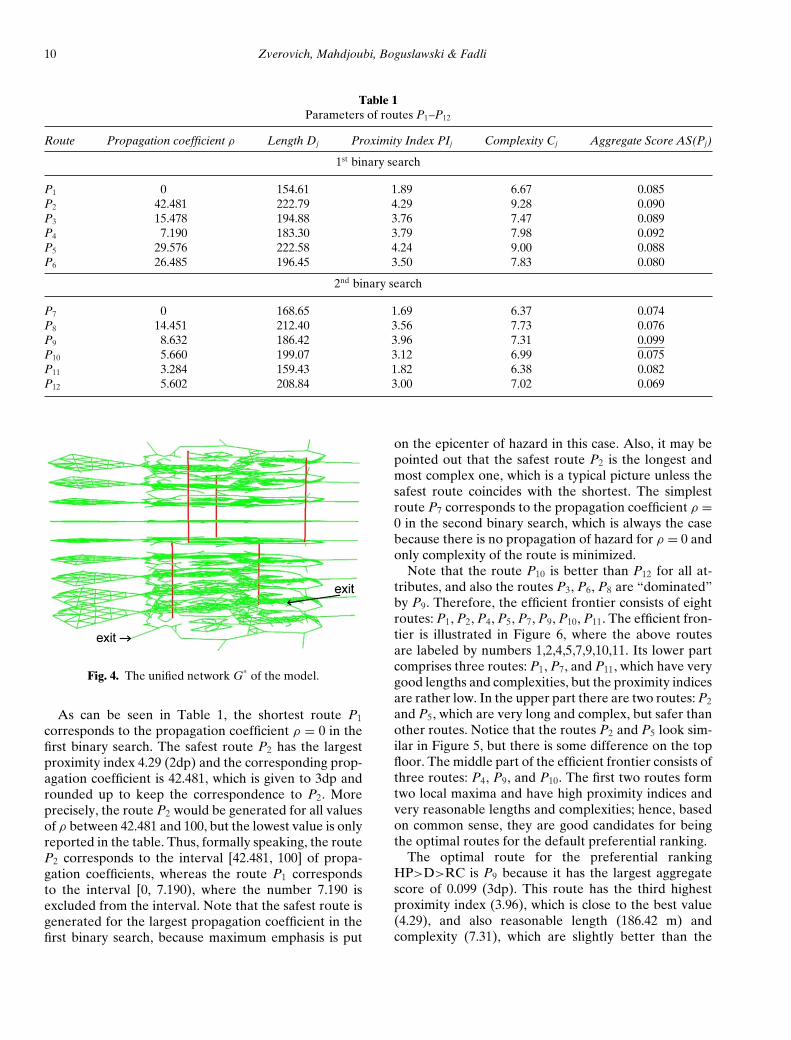
We start testing PIR-Algorithm with a rather complexbuilding shown in Figure 2. This 9-floor building has 5stairwells and two exits (indicated by arrows in Figures2 and 4), and it is based on the typical floor of the Doha
Fig. 2. The 9-floor building model based on the typical floorof the DWTC building.
Fig. 3. First floor of the DWTC building.
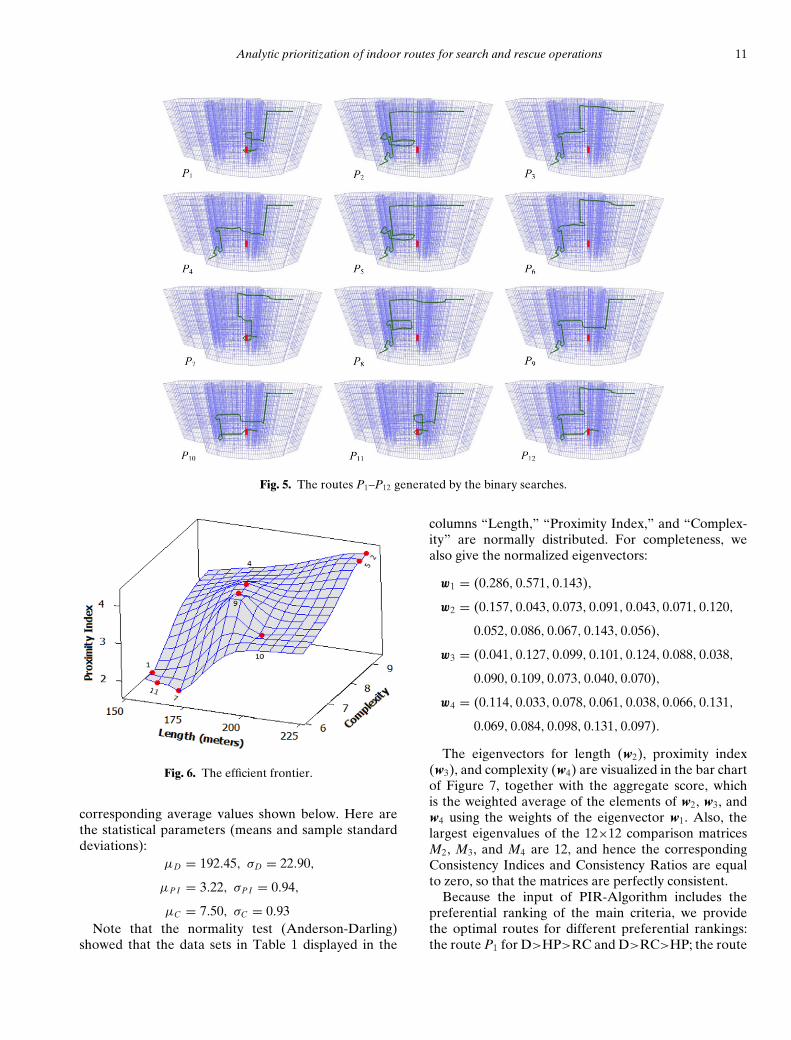
World Trade Centre (DWTC) depicted in Figure 3. Allthe stairwells are highlighted in red in Figure 4, whichrepresents the navigable unified network G* of thebuilding.
The epicenter of an extreme event is on the groundfloor, and it is labeled by a red rectangle in Figures 2and 5. The start node p is the artificial node outside thebuilding (not shown in the unified network), and thedestination node q represents a large room located onthe last floor in the right part of the building. Thus, weare looking for the optimal route going from one of theexits to the room q. In what follows, we put ρmax = 100for one epicenter, because our numerous tests showedthat “unreasonable” routes are often produced for ρ
>100, which do not belong to the efficient frontier.Also, the default preferential ranking of the criteria isused, that is, HP>D>RC.
The first binary search in Step 3 of PIR-Algorithmproduces six routes P1–P6, whereas the second binarysearch in Step 4 also generates six routes P7 –P12. Theseroutes are depicted in Figure 5, and their parametersare summarized in Table 1. Note that in both binarysearches one stopping criterion was used: the lengthof the widest interval is 0.01. It may be pointed outthat different exits are used as an entrance point in thegenerated routes.
10 Zverovich, Mahdjoubi, Boguslawski & Fadli
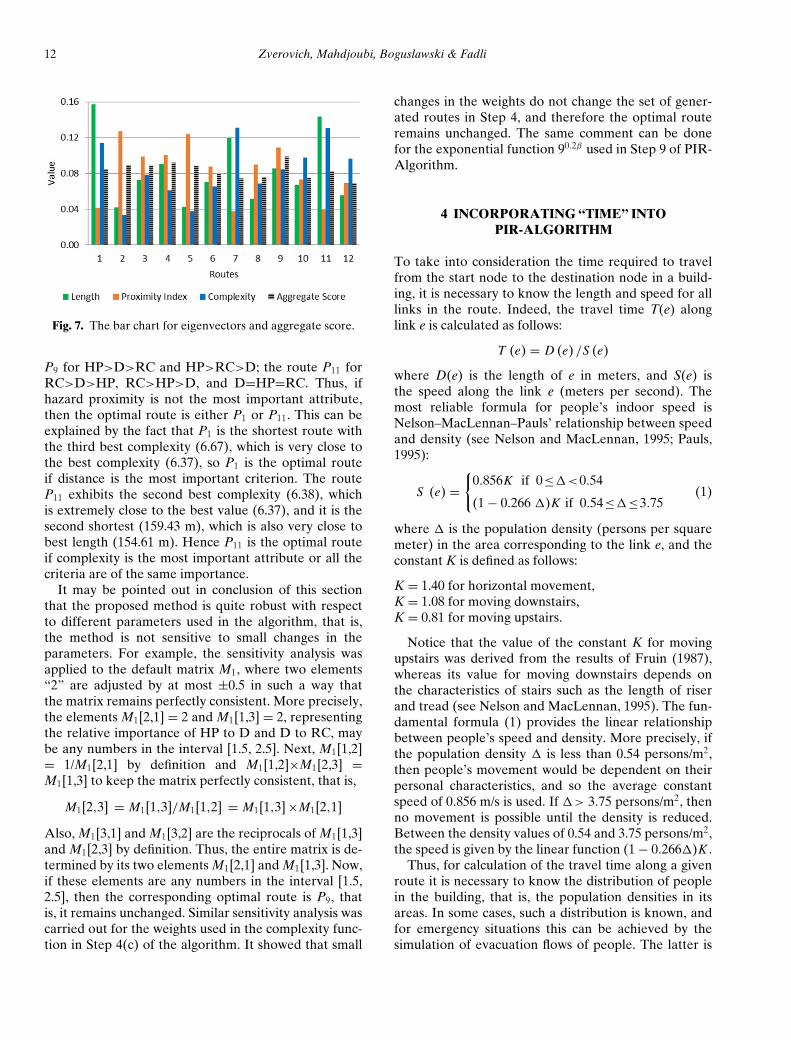
Table 1Parameters of routes P1–P12
Route Propagation coefficient ρ Length Dj Proximity Index PIj Complexity Cj Aggregate Score AS(Pj)
1st binary search
P1 0 154.61 1.89 6.67 0.085P2 42.481 222.79 4.29 9.28 0.090P3 15.478 194.88 3.76 7.47 0.089P4 7.190 183.30 3.79 7.98 0.092P5 29.576 222.58 4.24 9.00 0.088P6 26.485 196.45 3.50 7.83 0.080
2nd binary search
P7 0 168.65 1.69 6.37 0.074P8 14.451 212.40 3.56 7.73 0.076P9 8.632 186.42 3.96 7.31 0.099P10 5.660 199.07 3.12 6.99 0.075P11 3.284 159.43 1.82 6.38 0.082P12 5.602 208.84 3.00 7.02 0.069
Fig. 4. The unified network G* of the model.
As can be seen in Table 1, the shortest route P1
corresponds to the propagation coefficient ρ = 0 in thefirst binary search. The safest route P2 has the largestproximity index 4.29 (2dp) and the corresponding prop-agation coefficient is 42.481, which is given to 3dp androunded up to keep the correspondence to P2. Moreprecisely, the route P2 would be generated for all valuesof ρ between 42.481 and 100, but the lowest value is onlyreported in the table. Thus, formally speaking, the routeP2 corresponds to the interval [42.481, 100] of propa-gation coefficients, whereas the route P1 correspondsto the interval [0, 7.190), where the number 7.190 isexcluded from the interval. Note that the safest route isgenerated for the largest propagation coefficient in thefirst binary search, because maximum emphasis is put
on the epicenter of hazard in this case. Also, it may bepointed out that the safest route P2 is the longest andmost complex one, which is a typical picture unless thesafest route coincides with the shortest. The simplestroute P7 corresponds to the propagation coefficient ρ =0 in the second binary search, which is always the casebecause there is no propagation of hazard for ρ = 0 andonly complexity of the route is minimized.
Note that the route P10 is better than P12 for all at-tributes, and also the routes P3, P6, P8 are “dominated”by P9. Therefore, the efficient frontier consists of eightroutes: P1, P2, P4, P5, P7, P9, P10, P11. The efficient fron-tier is illustrated in Figure 6, where the above routesare labeled by numbers 1,2,4,5,7,9,10,11. Its lower partcomprises three routes: P1, P7, and P11, which have verygood lengths and complexities, but the proximity indicesare rather low. In the upper part there are two routes: P2
and P5, which are very long and complex, but safer thanother routes. Notice that the routes P2 and P5 look sim-ilar in Figure 5, but there is some difference on the topfloor. The middle part of the efficient frontier consists ofthree routes: P4, P9, and P10. The first two routes formtwo local maxima and have high proximity indices andvery reasonable lengths and complexities; hence, basedon common sense, they are good candidates for beingthe optimal routes for the default preferential ranking.
The optimal route for the preferential rankingHP>D>RC is P9 because it has the largest aggregatescore of 0.099 (3dp). This route has the third highestproximity index (3.96), which is close to the best value(4.29), and also reasonable length (186.42 m) andcomplexity (7.31), which are slightly better than the
Analytic prioritization of indoor routes for search and rescue operations 11
Fig. 5. The routes P1–P12 generated by the binary searches.
Fig. 6. The efficient frontier.
corresponding average values shown below. Here arethe statistical parameters (means and sample standarddeviations):
μD = 192.45, σD = 22.90,
μP I = 3.22, σP I = 0.94,
μC = 7.50, σC = 0.93Note that the normality test (Anderson-Darling)
showed that the data sets in Table 1 displayed in the
columns “Length,” “Proximity Index,” and “Complex-ity” are normally distributed. For completeness, wealso give the normalized eigenvectors:
w1 = (0.286, 0.571, 0.143),
w2 = (0.157, 0.043, 0.073, 0.091, 0.043, 0.071, 0.120,
0.052, 0.086, 0.067, 0.143, 0.056),
w3 = (0.041, 0.127, 0.099, 0.101, 0.124, 0.088, 0.038,
0.090, 0.109, 0.073, 0.040, 0.070),
w4 = (0.114, 0.033, 0.078, 0.061, 0.038, 0.066, 0.131,
0.069, 0.084, 0.098, 0.131, 0.097).
The eigenvectors for length (w2), proximity index(w3), and complexity (w4) are visualized in the bar chartof Figure 7, together with the aggregate score, whichis the weighted average of the elements of w2, w3, andw4 using the weights of the eigenvector w1. Also, thelargest eigenvalues of the 12×12 comparison matricesM2, M3, and M4 are 12, and hence the correspondingConsistency Indices and Consistency Ratios are equalto zero, so that the matrices are perfectly consistent.
Because the input of PIR-Algorithm includes thepreferential ranking of the main criteria, we providethe optimal routes for different preferential rankings:the route P1 for D>HP>RC and D>RC>HP; the route
12 Zverovich, Mahdjoubi, Boguslawski & Fadli
Fig. 7. The bar chart for eigenvectors and aggregate score.
P9 for HP>D>RC and HP>RC>D; the route P11 forRC>D>HP, RC>HP>D, and D=HP=RC. Thus, ifhazard proximity is not the most important attribute,then the optimal route is either P1 or P11. This can beexplained by the fact that P1 is the shortest route withthe third best complexity (6.67), which is very close tothe best complexity (6.37), so P1 is the optimal routeif distance is the most important criterion. The routeP11 exhibits the second best complexity (6.38), whichis extremely close to the best value (6.37), and it is thesecond shortest (159.43 m), which is also very close tobest length (154.61 m). Hence P11 is the optimal routeif complexity is the most important attribute or all thecriteria are of the same importance.
It may be pointed out in conclusion of this sectionthat the proposed method is quite robust with respectto different parameters used in the algorithm, that is,the method is not sensitive to small changes in theparameters. For example, the sensitivity analysis wasapplied to the default matrix M1, where two elements“2” are adjusted by at most ±0.5 in such a way thatthe matrix remains perfectly consistent. More precisely,the elements M1[2,1] = 2 and M1[1,3] = 2, representingthe relative importance of HP to D and D to RC, maybe any numbers in the interval [1.5, 2.5]. Next, M1[1,2]= 1/M1[2,1] by definition and M1[1,2]×M1[2,3] =M1[1,3] to keep the matrix perfectly consistent, that is,
M1[2,3] = M1[1,3]/M1[1,2] = M1[1,3] ×M1[2,1]
Also, M1[3,1] and M1[3,2] are the reciprocals of M1[1,3]and M1[2,3] by definition. Thus, the entire matrix is de-termined by its two elements M1[2,1] and M1[1,3]. Now,if these elements are any numbers in the interval [1.5,2.5], then the corresponding optimal route is P9, thatis, it remains unchanged. Similar sensitivity analysis wascarried out for the weights used in the complexity func-tion in Step 4(c) of the algorithm. It showed that small
changes in the weights do not change the set of gener-ated routes in Step 4, and therefore the optimal routeremains unchanged. The same comment can be donefor the exponential function 90.2β used in Step 9 of PIR-Algorithm.
4 INCORPORATING “TIME” INTOPIR-ALGORITHM
To take into consideration the time required to travelfrom the start node to the destination node in a build-ing, it is necessary to know the length and speed for alllinks in the route. Indeed, the travel time T(e) alonglink e is calculated as follows:
T (e) = D (e) /S (e)
where D(e) is the length of e in meters, and S(e) isthe speed along the link e (meters per second). Themost reliable formula for people’s indoor speed isNelson–MacLennan–Pauls’ relationship between speedand density (see Nelson and MacLennan, 1995; Pauls,1995):
S (e) ={
0.856K if 0≤�<0.54
(1 − 0.266 �)K if 0.54≤�≤3.75(1)
where � is the population density (persons per squaremeter) in the area corresponding to the link e, and theconstant K is defined as follows:
K = 1.40 for horizontal movement,K = 1.08 for moving downstairs,K = 0.81 for moving upstairs.
Notice that the value of the constant K for movingupstairs was derived from the results of Fruin (1987),whereas its value for moving downstairs depends onthe characteristics of stairs such as the length of riserand tread (see Nelson and MacLennan, 1995). The fun-damental formula (1) provides the linear relationshipbetween people’s speed and density. More precisely, ifthe population density � is less than 0.54 persons/m2,then people’s movement would be dependent on theirpersonal characteristics, and so the average constantspeed of 0.856 m/s is used. If �> 3.75 persons/m2, thenno movement is possible until the density is reduced.Between the density values of 0.54 and 3.75 persons/m2,the speed is given by the linear function (1 − 0.266�)K .
Thus, for calculation of the travel time along a givenroute it is necessary to know the distribution of peoplein the building, that is, the population densities in itsareas. In some cases, such a distribution is known, andfor emergency situations this can be achieved by thesimulation of evacuation flows of people. The latter is
Analytic prioritization of indoor routes for search and rescue operations 13
out of scope of this article; however, there are softwarepackages for modeling the distribution of people in abuilding. For example, Kisko and Francis (1985) pro-posed the EVACNET+ software application for evacu-ation scenarios planning. Other alternative solutions areavailable as well: Sun and Wu (2014) recently developedan advanced configurable crowd model for differentbehaviors and scenarios, and implemented it for thesimulation of evacuation in a building. Also, Shahabiet al. (2015) proposed an efficient strategy for theshortest path problem with uncertain travel cost, whichmight be useful when dealing with uncertain travel timefunction.
Therefore, in the modified version of PIR-Algorithmpresented below, we assume that the population densi-ties are given for all cells in the building. Because eachcell is represented by a node in the unified network G*,the densities are associated with nodes in the set V(G*).In the new Step 0, we first calculate the density for thelink uv, that is, the average density for two areas associ-ated with the nodes u and v. Then the speed S(e) alongthe link e is computed using formula (1). Here we as-sume that the agent is moving together with the flow ofpeople. In emergency situations, this typically happenswhen moving downstairs. If the agent is moving in acounter-flow, for example, upstairs, then one should useformula (2), which will be discussed later. Finally, thetravel time T(e) along link e is calculated in Step 0(c).
PIR-Algorithm2 (with Time): Prioritization of (p,q)-routes in a building with an extreme event
Input: . . .
Preferential ranking of travel time (TT), haz-ard proximity (HP), and route complexity (RC)(optional, by default HP>TT>RC).The population density �(v) (persons/m2) forthe area corresponding to node vϵV(G*).
(0) For each link e = uvϵE(G*), compute the follow-ing:
(a) The population density for the area corre-sponding to e: �(e) = 0.5[�(u) + �(v)].
(b) The speed S(e) along the link e using formula(1), or (2) for counter-flow movement.
(c) The travel time T(e) along link e: T(e) =D(e)/S(e).. . .
(3)(b) For each link e = uvϵE(G*), compute the hazardproximity numbers for links:
H D (e) = 0.5 [H (u) + H (v)] × T (e)
where T(e) is the travel time along e in seconds.. . .
(6) For each route PjϵR, calculate the following:(a) The length D j = ∑
e∈Pj
D(e) and the travel time
Tj = ∑e∈Pj
T (e) .
(b) The proximity ratios w.r.t. zi:
ri (e) =√d (u, zi ) × [1 + b (u, zi )] + √
d (v, zi ) × [1 + b (v, zi )]2T (e)
for each i = 1,2, . . . ,k and each link e = uv in Pj.. . .
(7) For the routes in R, compute the means and thesample standard deviations of travel times, prox-imity indices, and complexities: μT, σ T, μPI, σ PI,μC, σ C.. . .
(9) Create three n×n comparison matrices M2, M3, M4
for the relative importance of the routes in the setR w.r.t. travel time, proximity index, and complex-ity as follows:For each entry M2[i, j], compute β = (Tj – Ti)/σ T.If σ T = 0, then put β = 0. Calculate M2[i, j] = 90.2β.
Put M2[i,j] = 1/9 if β< −5; put M2[i,j] = 9 if β>5.. . .
Further, in Step 3(b), the formula for the hazardproximity numbers is updated by using travel timeinstead of link length. Thus, if there is no hazardpropagation, that is, ρ = 0, then the fastest route will begenerated in the first binary search instead of the short-est one. In the modified Step 6, in addition to the routelength, we calculate the travel time for each route in theset R. Also, the formula for proximity ratios is updatedwith travel time T(e), because longer travel time for alink should decrease the proximity ratio for this linkand the proximity index for the route, thus making itworse. Next, in Step 7, the statistical parameters arenow calculated for travel times, and the comparisonmatrix M2 in Step 9 represents the relative importanceof routes in the set R with respect to travel time.
4.1 Testing PIR-Algorithm2
Before we start testing PIR-Algorithm2, let us applythe original PIR-Algorithm to the scenario described inSection 3 with the start and destination nodes swapped,that is, the start node is the large room in the rightpart of the last floor and the destination node is theartificial node outside the building. Note that there is no
14 Zverovich, Mahdjoubi, Boguslawski & Fadli
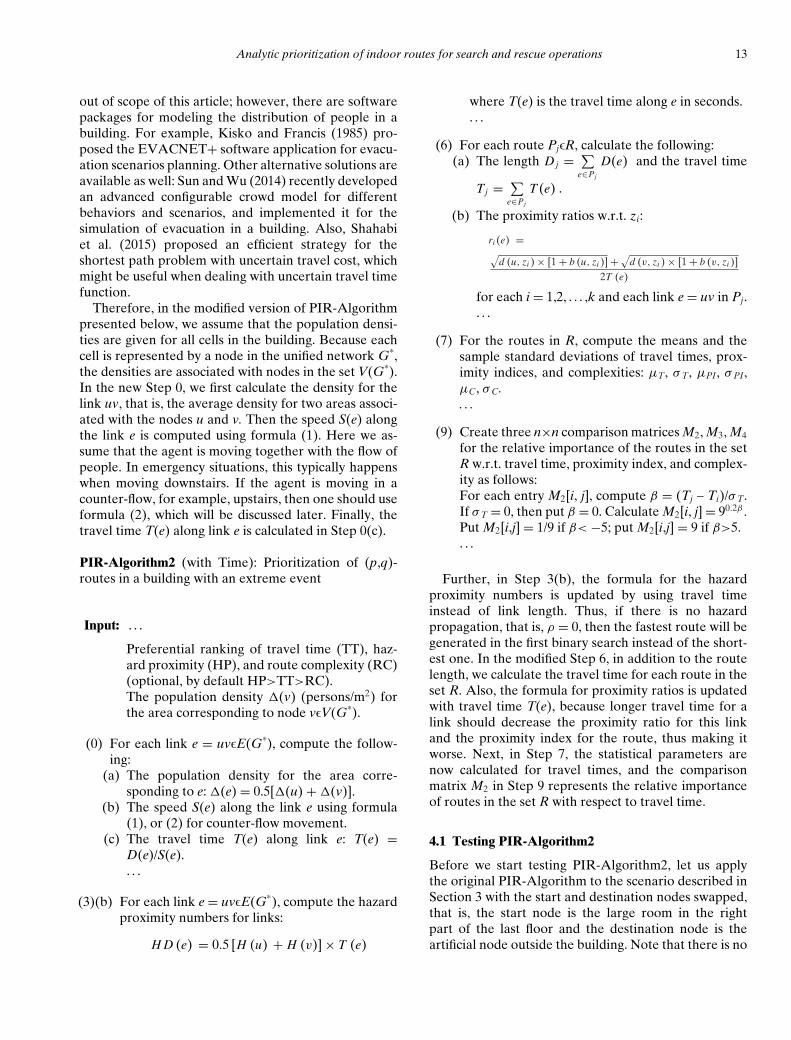
Table 2Parameters of routes X1–X11 for moving downstairs
Route Propagation coefficient ρ Length Dj Proximity Index PIj Complexity Cj Aggregate Score AS(Xj)
1st binary search
X1 0 154.61 1.89 6.03 0.0908X2 42.481 222.79 4.29 8.56 0.0903X3 15.478 194.88 3.76 6.91 0.0900X4 7.190 183.30 3.79 7.35 0.0942X5 29.576 222.58 4.24 8.28 0.0893X6 26.485 196.45 3.50 7.32 0.0803
2nd binary search
X7 0 157.66 1.79 5.68 0.0904X8 30.018 207.35 4.02 7.25 0.0909X9 10.625 185.73 3.98 6.71 0.1022X10 5.878 198.38 3.12 6.36 0.0776X11 29.236 184.44 4.01 6.69 0.1040
symmetry in moving downstairs and upstairs becausethe complexity of the former is lower. The result issummarized in Table 2. The first binary search producesthe same routes as in Table 1, because it is independentof complexity, but the complexity figures are lowerthan the corresponding numbers in Table 1. The secondbinary search generates five routes, which are basicallysimilar to the routes in the second half of Table 1. Theoptimal route is X11, which is similar to the optimalroute P9 for moving upstairs, depicted in Figure 5.
Now, let us consider the following four typicalscenarios:
Scenario 1: There are no people in the building, thatis, the population densities for all nodes are equalto 0.
Scenario 2: The initial stage of uncontrolled evacuation,when people have just left their offices. Thus, � = 0for any office, � = 1 for all staircases and landings, and� = 0.5 for all other spaces (halls, corridors, etc.).
Scenario 3: The middle stage of uncontrolled evacua-tion: � = 3 for all staircases and landings, � = 2 inthe areas on the ground floor between staircases andentrances to the building, � = 2 in the areas on Floor4 where people switch staircases, � = 0 for all otherspaces.
Scenario 4: The final stage of uncontrolled evacuation:� = 3 for staircases and landings between the groundfloor and Floor 4, � = 2 in the areas on the groundfloor between staircases and entrances to the building,� = 0 for all other spaces.
In the first scenario, we assume that there are nopeople inside the building, for example, during week-end or night. Notice that this scenario also covers the
sparse distribution of people (�<0.54) when an agentis moving together with people’s flow, because in thiscase the speed given by formula (1) is a constant andhence the travel time for a given link or route is fixed.Scenario 2 describes an initial stage of evacuation,when all offices are empty, the crowd condition inthe staircases is moderate, and other spaces have theminimum crowd condition. Scenario 3 is for a middlestage of evacuation, when all staircases experience thecrush crowd condition, and the medium densities are onthe ground floor in the specified areas and on Floor 4 inthe areas between staircases. This scenario also coversthe situation when there are some queues near theentrances to the staircases on some floors, because thegenerated routes will remain unchanged. The final stageof evacuation is given in Scenario 4, where the staircasesbetween the ground floor and Floor 4 have the crushcrowd condition and the medium densities are on theground floor between staircases and entrances to thebuilding.
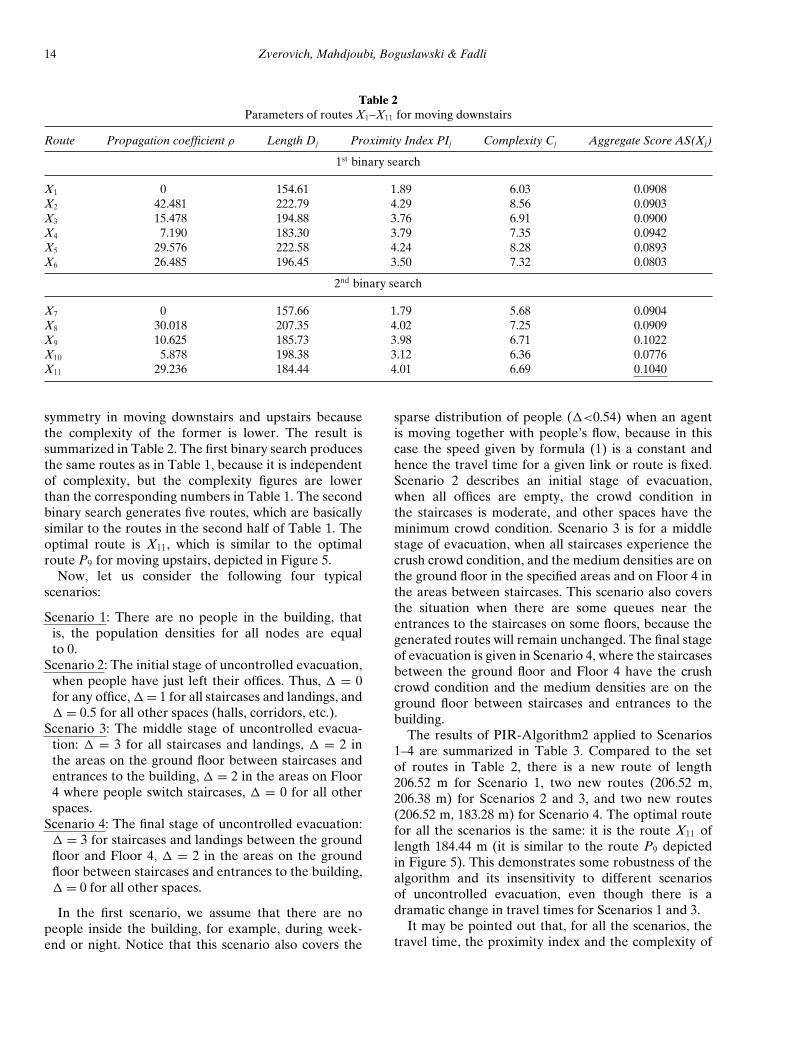
The results of PIR-Algorithm2 applied to Scenarios1–4 are summarized in Table 3. Compared to the setof routes in Table 2, there is a new route of length206.52 m for Scenario 1, two new routes (206.52 m,206.38 m) for Scenarios 2 and 3, and two new routes(206.52 m, 183.28 m) for Scenario 4. The optimal routefor all the scenarios is the same: it is the route X11 oflength 184.44 m (it is similar to the route P9 depictedin Figure 5). This demonstrates some robustness of thealgorithm and its insensitivity to different scenariosof uncontrolled evacuation, even though there is adramatic change in travel times for Scenarios 1 and 3.
It may be pointed out that, for all the scenarios, thetravel time, the proximity index and the complexity of
Analytic prioritization of indoor routes for search and rescue operations 15
Tab
le3
Res
ults
ofP
IR-A
lgor
ithm
2fo
rSc
enar
ios
1–4
(mov
ing
dow
nsta
irs)
Scen
ario
1Sc
enar
io2
Scen
ario
3Sc
enar
io4
Len
gth
Tim
eP
IC
AS
Len
gth
Tim
eP
IC
AS
Len
gth
Tim
eP
IC
AS
Len
gth
Tim
eP
IC
AS
154.
6115
31.
986.
030.
0908
154.
6117
11.
806.
030.
0915
154.
6152
50.
626.
030.
0927
154.
6133
80.
746.
030.
0849
222.
7921
04.
558.
560.
0909
222.
7922
74.
198.
560.
0919
222.
7961
71.
528.
560.
0932
222.
7940
02.
098.
560.
0847
206.
5219
63.
957.
690.
0813
206.
5221
43.
637.
690.
0820
206.
5259
21.
297.
690.
0825
206.
5238
61.
777.
690.
0739
183.
3017
73.
967.
350.
0932
183.
3019
53.
617.
350.
0933
206.
3859
21.
297.
650.
0827
183.
3036
71.
737.
350.
0820
194.
8818
63.
936.
910.
0892
206.
3821
43.
637.
650.
0822
183.
3056
91.
257.
350.
0886
183.
2836
71.
787.
430.
0843
222.
5821
04.
498.
280.
0899
222.
5822
74.
148.
280.
0909
222.
5861
71.
508.
280.
0921
194.
8837
71.
746.
910.
0800
157.
6615
51.
875.
680.
0904
157.
6617
31.
705.
680.
0911
157.
6653
00.
585.
680.
0919
222.
5840
02.
068.
280.
0838
207.
3519
74.
247.
250.
0909
207.
3521
53.
897.
250.
0916
207.
3559
41.
397.
250.
0921
157.
6634
10.
705.
680.
0846
185.
7317
94.
166.
710.
1012
185.
7319
73.
806.
710.
1013
185.
7357
21.
326.
710.
0963
207.
3538
71.
917.
250.
0825
198.
3818
93.
386.
360.
0795
198.
3820
73.
166.
360.
0814
198.
3858
11.
246.
360.
0903
185.
7336
91.
836.
710.
0895
184.
4417
84.
196.
690.
1028
184.
4419
63.
826.
690.
1028
184.
4457
01.
326.
690.
0976
198.
3837
81.
656.
360.
0793
184.
4436
81.
836.
690.
0905 the optimal route X11 are better than the corresponding
mean values. The only other route possessing thisproperty is the route X9 of length 185.73 m, which isvery similar to X11. As can be seen in Table 3, the routeX9 is the second best route in all the scenarios. Thethird best route is of length 183.30 m for Scenarios 1 and2; it is the route P4 shown in Figure 5. Also, the thirdbest routes for Scenarios 3 and 4 are of length 222.79m and 154.61 m, respectively. The former is the safestavailable route P2 and the latter is the shortest/quickestroute P1, both are depicted in Figure 5.
In the previous test, we assumed that an agent ismoving together with the flow of people. However, anSAR team or a single rescuer can overtake people’sflow and move with a higher speed than one given byformula (1). Let us now consider the situation when anagent is moving with speed increased by 25%, that is,the new speed is 1.25 S(e), where S(e) is calculated ac-cording to (1). The results of this test are very similar tothe previous one. For all the scenarios, exactly the sameroutes are generated as in Table 3. The travel times forthe optimal route (184.44 m) are, of course, different:142 s, 156 s, 456 s, 294 s for Scenarios 1–4, respectively.
4.2 Moving upstairs in a counter-flow
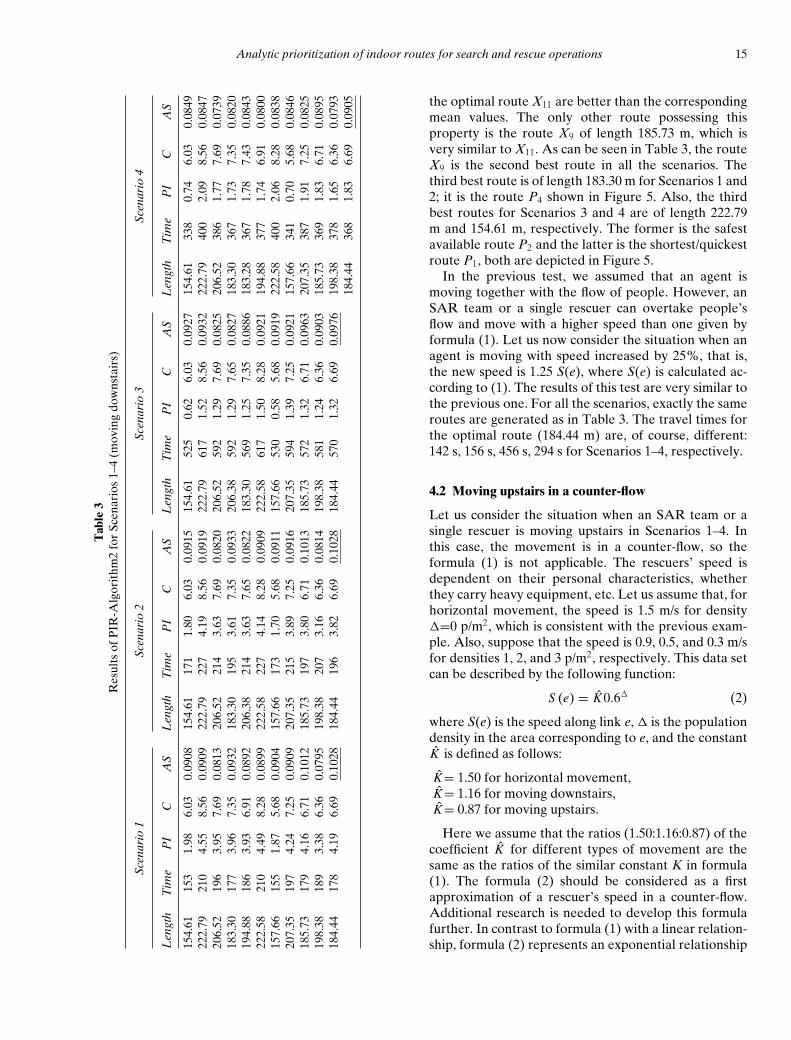
Let us consider the situation when an SAR team or asingle rescuer is moving upstairs in Scenarios 1–4. Inthis case, the movement is in a counter-flow, so theformula (1) is not applicable. The rescuers’ speed isdependent on their personal characteristics, whetherthey carry heavy equipment, etc. Let us assume that, forhorizontal movement, the speed is 1.5 m/s for density�=0 p/m2, which is consistent with the previous exam-ple. Also, suppose that the speed is 0.9, 0.5, and 0.3 m/sfor densities 1, 2, and 3 p/m2, respectively. This data setcan be described by the following function:
S (e) = K 0.6� (2)
where S(e) is the speed along link e, � is the populationdensity in the area corresponding to e, and the constantK is defined as follows:
K= 1.50 for horizontal movement,K= 1.16 for moving downstairs,K= 0.87 for moving upstairs.
Here we assume that the ratios (1.50:1.16:0.87) of thecoefficient K for different types of movement are thesame as the ratios of the similar constant K in formula(1). The formula (2) should be considered as a firstapproximation of a rescuer’s speed in a counter-flow.Additional research is needed to develop this formulafurther. In contrast to formula (1) with a linear relation-ship, formula (2) represents an exponential relationship
16 Zverovich, Mahdjoubi, Boguslawski & Fadli
Fig. 8. Graphical representation of formula (2).
between density and speed in a counter-flow. Thegraphical illustration of formula (2) is given in Figure 8.
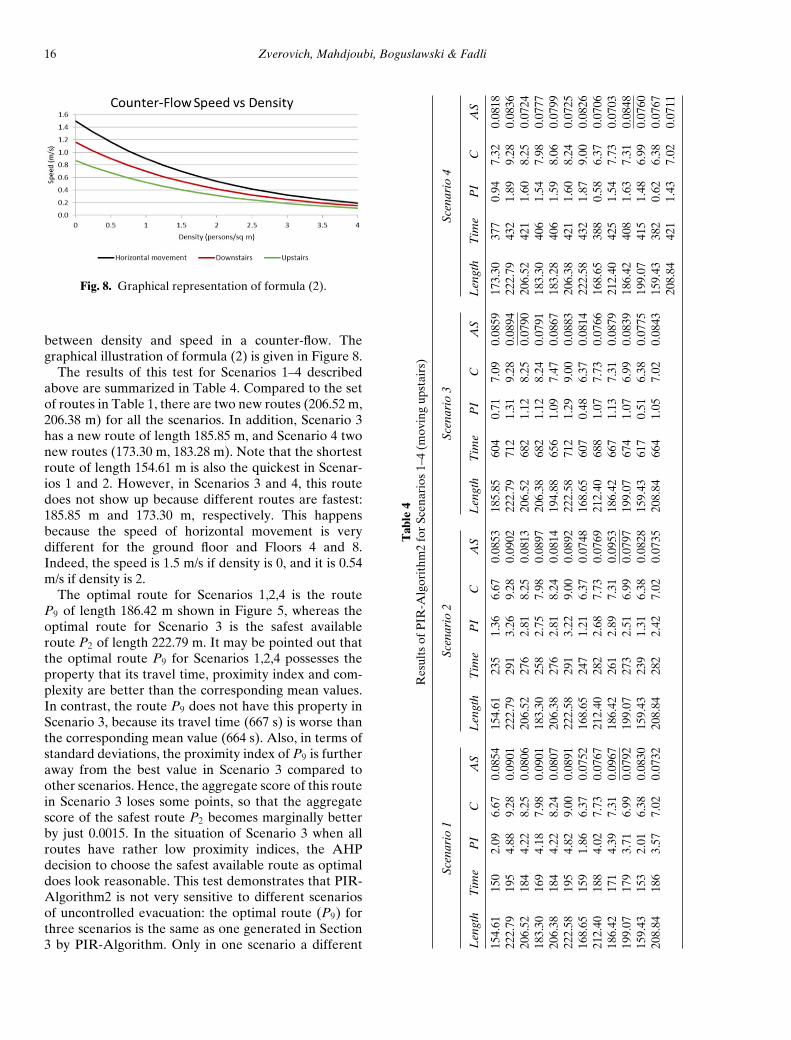
The results of this test for Scenarios 1–4 describedabove are summarized in Table 4. Compared to the setof routes in Table 1, there are two new routes (206.52 m,206.38 m) for all the scenarios. In addition, Scenario 3has a new route of length 185.85 m, and Scenario 4 twonew routes (173.30 m, 183.28 m). Note that the shortestroute of length 154.61 m is also the quickest in Scenar-ios 1 and 2. However, in Scenarios 3 and 4, this routedoes not show up because different routes are fastest:185.85 m and 173.30 m, respectively. This happensbecause the speed of horizontal movement is verydifferent for the ground floor and Floors 4 and 8.Indeed, the speed is 1.5 m/s if density is 0, and it is 0.54m/s if density is 2.
The optimal route for Scenarios 1,2,4 is the routeP9 of length 186.42 m shown in Figure 5, whereas theoptimal route for Scenario 3 is the safest availableroute P2 of length 222.79 m. It may be pointed out thatthe optimal route P9 for Scenarios 1,2,4 possesses theproperty that its travel time, proximity index and com-plexity are better than the corresponding mean values.In contrast, the route P9 does not have this property inScenario 3, because its travel time (667 s) is worse thanthe corresponding mean value (664 s). Also, in terms ofstandard deviations, the proximity index of P9 is furtheraway from the best value in Scenario 3 compared toother scenarios. Hence, the aggregate score of this routein Scenario 3 loses some points, so that the aggregatescore of the safest route P2 becomes marginally betterby just 0.0015. In the situation of Scenario 3 when allroutes have rather low proximity indices, the AHPdecision to choose the safest available route as optimaldoes look reasonable. This test demonstrates that PIR-Algorithm2 is not very sensitive to different scenariosof uncontrolled evacuation: the optimal route (P9) forthree scenarios is the same as one generated in Section3 by PIR-Algorithm. Only in one scenario a different
Tab
le4
Res
ults
ofP
IR-A
lgor
ithm
2fo
rSc
enar
ios
1–4
(mov
ing
upst
airs
)
Scen
ario
1Sc
enar
io2
Scen
ario
3Sc
enar
io4
Len
gth
Tim
eP
IC
AS
Len
gth
Tim
eP
IC
AS
Len
gth
Tim
eP
IC
AS
Len
gth
Tim
eP
IC
AS
154.
6115
02.
096.
670.
0854
154.
6123
51.
366.
670.
0853
185.
8560
40.
717.
090.
0859
173.
3037
70.
947.
320.
0818
222.
7919
54.
889.
280.
0901
222.
7929
13.
269.
280.
0902
222.
7971
21.
319.
280.
0894
222.
7943
21.
899.
280.
0836
206.
5218
44.
228.
250.
0806
206.
5227
62.
818.
250.
0813
206.
5268
21.
128.
250.
0790
206.
5242
11.
608.
250.
0724
183.
3016
94.
187.
980.
0901
183.
3025
82.
757.
980.
0897
206.
3868
21.
128.
240.
0791
183.
3040
61.
547.
980.
0777
206.
3818
44.
228.
240.
0807
206.
3827
62.
818.
240.
0814
194.
8865
61.
097.
470.
0867
183.
2840
61.
598.
060.
0799
222.
5819
54.
829.
000.
0891
222.
5829
13.
229.
000.
0892
222.
5871
21.
299.
000.
0883
206.
3842
11.
608.
240.
0725
168.
6515
91.
866.
370.
0752
168.
6524
71.
216.
370.
0748
168.
6560
70.
486.
370.
0814
222.
5843
21.
879.
000.
0826
212.
4018
84.
027.
730.
0767
212.
4028
22.
687.
730.
0769
212.
4068
81.
077.
730.
0766
168.
6538
80.
586.
370.
0706
186.
4217
14.
397.
310.
0967
186.
4226
12.
897.
310.
0953
186.
4266
71.
137.
310.
0879
212.
4042
51.
547.
730.
0703
199.
0717
93.
716.
990.
0792
199.
0727
32.
516.
990.
0797
199.
0767
41.
076.
990.
0839
186.
4240
81.
637.
310.
0848
159.
4315
32.
016.
380.
0830
159.
4323
91.
316.
380.
0828
159.
4361
70.
516.
380.
0775
199.
0741
51.
486.
990.
0760
208.
8418
63.
577.
020.
0732
208.
8428
22.
427.
020.
0735
208.
8466
41.
057.
020.
0843
159.
4338
20.
626.
380.
0767
208.
8442
11.
437.
020.
0711
Analytic prioritization of indoor routes for search and rescue operations 17
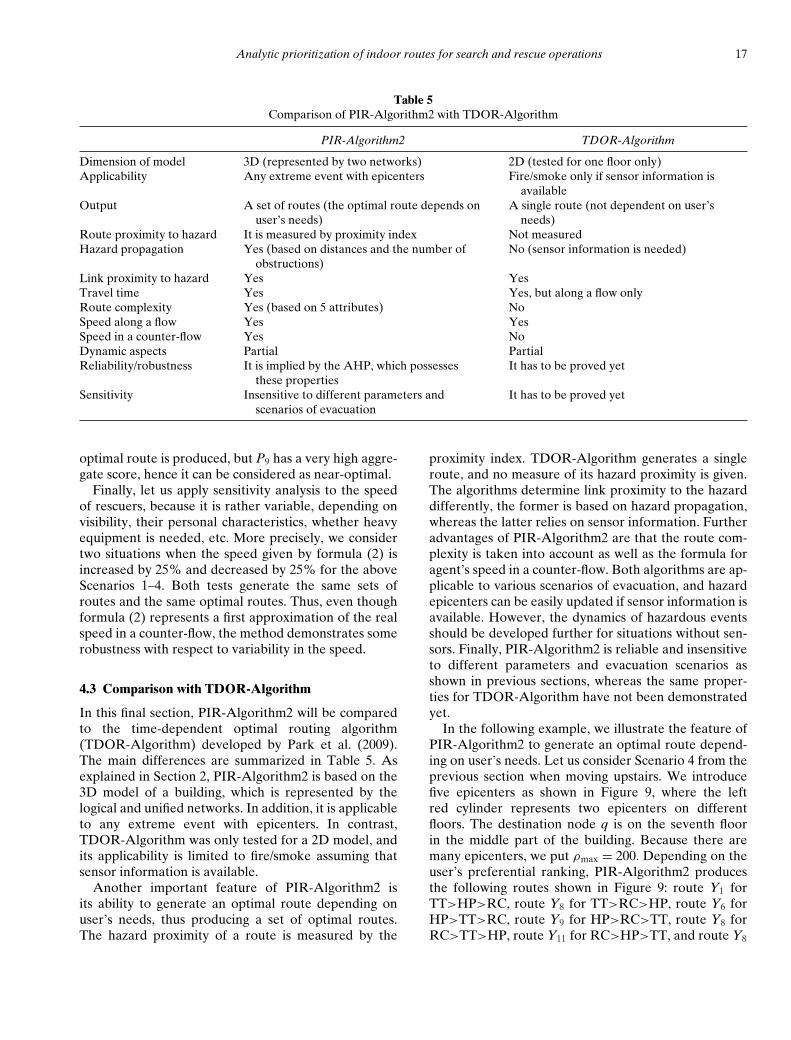
Table 5Comparison of PIR-Algorithm2 with TDOR-Algorithm
PIR-Algorithm2 TDOR-Algorithm
Dimension of model 3D (represented by two networks) 2D (tested for one floor only)Applicability Any extreme event with epicenters Fire/smoke only if sensor information is
availableOutput A set of routes (the optimal route depends on
user’s needs)A single route (not dependent on user’s
needs)Route proximity to hazard It is measured by proximity index Not measuredHazard propagation Yes (based on distances and the number of
obstructions)No (sensor information is needed)
Link proximity to hazard Yes YesTravel time Yes Yes, but along a flow onlyRoute complexity Yes (based on 5 attributes) NoSpeed along a flow Yes YesSpeed in a counter-flow Yes NoDynamic aspects Partial PartialReliability/robustness It is implied by the AHP, which possesses
these propertiesIt has to be proved yet
Sensitivity Insensitive to different parameters andscenarios of evacuation
It has to be proved yet
optimal route is produced, but P9 has a very high aggre-gate score, hence it can be considered as near-optimal.
Finally, let us apply sensitivity analysis to the speedof rescuers, because it is rather variable, depending onvisibility, their personal characteristics, whether heavyequipment is needed, etc. More precisely, we considertwo situations when the speed given by formula (2) isincreased by 25% and decreased by 25% for the aboveScenarios 1–4. Both tests generate the same sets ofroutes and the same optimal routes. Thus, even thoughformula (2) represents a first approximation of the realspeed in a counter-flow, the method demonstrates somerobustness with respect to variability in the speed.
4.3 Comparison with TDOR-Algorithm
In this final section, PIR-Algorithm2 will be comparedto the time-dependent optimal routing algorithm(TDOR-Algorithm) developed by Park et al. (2009).The main differences are summarized in Table 5. Asexplained in Section 2, PIR-Algorithm2 is based on the3D model of a building, which is represented by thelogical and unified networks. In addition, it is applicableto any extreme event with epicenters. In contrast,TDOR-Algorithm was only tested for a 2D model, andits applicability is limited to fire/smoke assuming thatsensor information is available.
Another important feature of PIR-Algorithm2 isits ability to generate an optimal route depending onuser’s needs, thus producing a set of optimal routes.The hazard proximity of a route is measured by the
proximity index. TDOR-Algorithm generates a singleroute, and no measure of its hazard proximity is given.The algorithms determine link proximity to the hazarddifferently, the former is based on hazard propagation,whereas the latter relies on sensor information. Furtheradvantages of PIR-Algorithm2 are that the route com-plexity is taken into account as well as the formula foragent’s speed in a counter-flow. Both algorithms are ap-plicable to various scenarios of evacuation, and hazardepicenters can be easily updated if sensor information isavailable. However, the dynamics of hazardous eventsshould be developed further for situations without sen-sors. Finally, PIR-Algorithm2 is reliable and insensitiveto different parameters and evacuation scenarios asshown in previous sections, whereas the same proper-ties for TDOR-Algorithm have not been demonstratedyet.
In the following example, we illustrate the feature ofPIR-Algorithm2 to generate an optimal route depend-ing on user’s needs. Let us consider Scenario 4 from theprevious section when moving upstairs. We introducefive epicenters as shown in Figure 9, where the leftred cylinder represents two epicenters on differentfloors. The destination node q is on the seventh floorin the middle part of the building. Because there aremany epicenters, we put ρmax = 200. Depending on theuser’s preferential ranking, PIR-Algorithm2 producesthe following routes shown in Figure 9: route Y1 forTT>HP>RC, route Y8 for TT>RC>HP, route Y6 forHP>TT>RC, route Y9 for HP>RC>TT, route Y8 forRC>TT>HP, route Y11 for RC>HP>TT, and route Y8
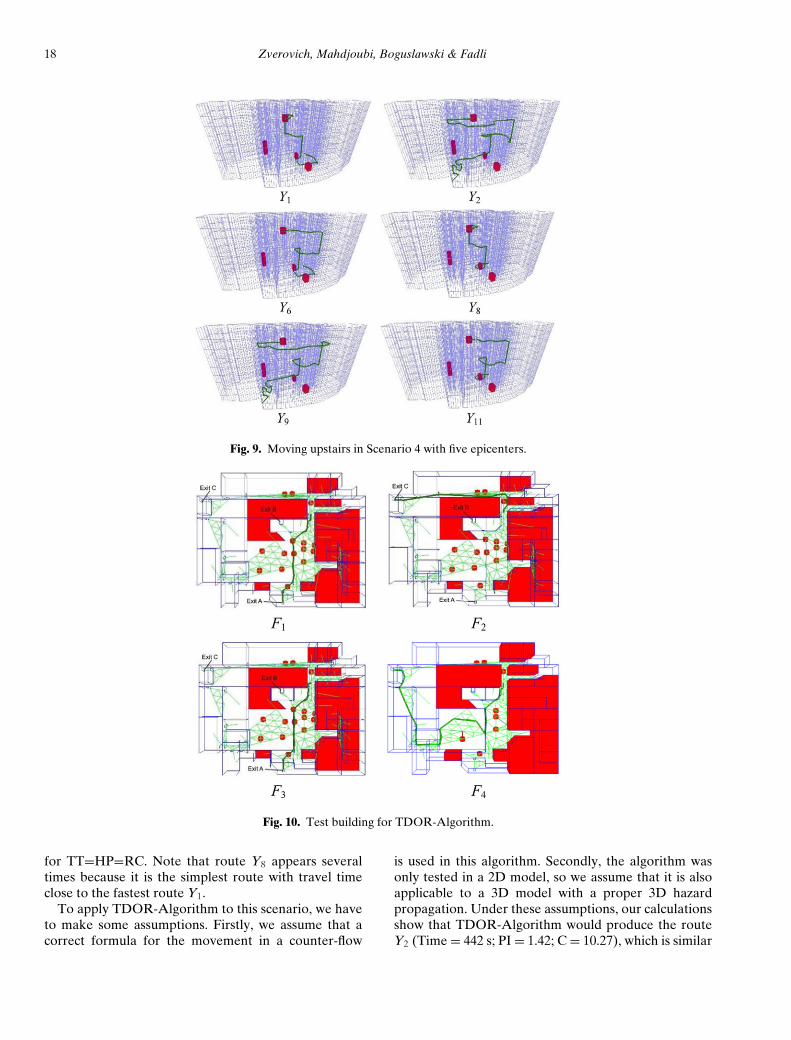
18 Zverovich, Mahdjoubi, Boguslawski & Fadli
Fig. 9. Moving upstairs in Scenario 4 with five epicenters.
Fig. 10. Test building for TDOR-Algorithm.
for TT=HP=RC. Note that route Y8 appears severaltimes because it is the simplest route with travel timeclose to the fastest route Y1.
To apply TDOR-Algorithm to this scenario, we haveto make some assumptions. Firstly, we assume that acorrect formula for the movement in a counter-flow
is used in this algorithm. Secondly, the algorithm wasonly tested in a 2D model, so we assume that it is alsoapplicable to a 3D model with a proper 3D hazardpropagation. Under these assumptions, our calculationsshow that TDOR-Algorithm would produce the routeY2 (Time = 442 s; PI = 1.42; C = 10.27), which is similar
Analytic prioritization of indoor routes for search and rescue operations 19
to the route Y9 (Time = 443 s; PI = 1.43; C = 9.28),generated by PIR-Algorithm2 with input HP>RC>TT.Note that travel times and proximity indices of theseroutes are very similar, however the complexity of thelatter route is better. Thus, PIR-Algorithm2 producesa set of optimal routes depending on user’s needs,whereas TDOR-Algorithm only generates a singleroute. In addition, PIR-Algorithm2 takes into accountroute complexity and calculates the proximity index,which is important in deciding how dangerous theroute is.
Let us now consider the test building used for TDOR-Algorithm, which is shown in Figure 10. This is a 2Dmodel of the Student Hall at the University of Seoulwith three exits A, B, and C. In this scenario, the res-cuers should find the optimal route from one of the exitsto the place located in the corridor on the right side ofexit B. However, the rescuers can only use exits A andC. The hazard is represented by smoke, detected by sen-sors, and its epicenters are marked by red circles. If allnodes in a room are epicenters, then the entire room iscolored in red. Under this scenario, TDOR-Algorithmgenerates the single route F2 shown in Figure 10. If thetravel time is the most important criterion, for example,there is protective equipment, then the optimal routeproduced by PIR-Algorithm2 is the route F1 depicted inFigure 10. This situation corresponds to the user’s inputTT>RC>HP or TT>HP>RC. However, if the hazardproximity is the most important attribute (HP>RC>TTor HP>TT>RC), then the optimal route is F2, whichagrees with TDOR-Algorithm. In the situation whenthe route complexity is most important, or the threecriteria are equally important, the optimal route is F3.It may be pointed out that with fewer epicenters andwhen the hazard proximity is most important, anotherrather unexpected optimal route F4 is generated; itis shown in Figure 10. This can be explained by thefact that all other routes go through epicenters or areextremely close to epicenters. The limitations of thisscenario are that it is a simple 2D model, where thereare relatively few possible routes from the exits to thedestination. Nevertheless, it is still possible to see thateven in this simple scenario PIR-Algorithm2 is able toproduce the optimal route depending on user’s needs.
5 CONCLUSIONS
In this article, we presented a step change for findingthe optimal routes for SAR teams in a building, wherean extreme event is occurring. We proposed an algo-rithm that is based on the new stochastic version of theAHP with three criteria: distance, hazard proximity,and route complexity. Another algorithm incorporates
the travel time instead of the distance criteria, thus tak-ing into account more realistic information about thedistribution of people in the building. For calculationof travel times, we used Nelson–MacLennan–Pauls’formula for people’s indoor speed, and extended thisformula for an SAR team moving in a counter-flow.Five attributes for route complexity were introducedand validated: going upstairs, going downstairs, doors,turning angles, and distance. Also, hazard proximitynumbers and the proximity index were further devel-oped for large open indoor spaces and for travel times.
The algorithms were thoroughly tested on the real-istic complex building, which is based on the typicalfloor of the Doha World Trade Centre. The generatedoptimal routes are indeed the “best” trade-off amongdistance/travel time, hazard proximity, and route com-plexity, as discussed in Sections 3 and 4. The test resultsalso demonstrated the robustness of the algorithms withrespect to different parameters, and their insensitivityto different scenarios of uncontrolled evacuation.
The dynamic character of hazardous events ispartially taken into consideration in the presentedalgorithms, mainly because beside the optimal routethey produce the safest available route assuming thatthe hazard propagates evenly. In the future work,we will consider the dynamics of the situation morecarefully, which is particularly important if the hazarddevelops rapidly and unevenly. Although the algorithmtakes into account the agent’s speed along people’s flowand in a counter-flow, it should be further developedby including human factors and behavioral issues. Inparticular, the evacuation scenarios for uncontrolledevacuation can be simulated with behavioral aspects.
The information about construction materials willalso be taken into account for a more accurate prop-agation of hazard and for finding alternative routes incase of direct hazard or non-availability of a safe route,that is, when walls or partitions may be drilled to obtainaccess to adjacent rooms/corridors. In this context,it would be interesting to develop an Ant ColonyOptimization algorithm, which has been successfullyapplied for finding evacuation routes during a tsunami(Forcael et al., 2014).
ACKNOWLEDGMENTS
This research/publication was made possible by a Na-tional Priority Research Program NPRP award [NPRP-06-1208-2-492] from the Qatar National ResearchFund, a member of The Qatar Foundation. The state-ments made herein are solely the responsibility of theauthors.
20 Zverovich, Mahdjoubi, Boguslawski & Fadli
REFERENCES
Aboshosha, A. & Zell, A. (2003), Adaptation of rescue robotbehaviour in unknown terrains based on stochastic andfuzzy logic approaches, in Intelligent Robots and Systems,Proceedings of the 2003 IEEE/RSJ International Confer-ence, Vol. 3, 2859–64.
Barbarosoglu, G. & Arda, Y. (2004), A two-stage stochasticprogramming framework for transportation planning in dis-aster response, Journal of the Operational Research Society,55(1), 43–53.
Boguslawski, P., Mahdjoubi, L., Zverovich, V., Barki, H. &Fadli, F. (2015), BIM-GIS modelling in support of emer-gency response applications, in L. Mahdjoubi, C. Breb-bia, and R. Laing (eds.), Building Information Modelling(BIM) in Design, Construction and Operations, Vol. 149,WIT Press, Southampton, UK, 381–92.
Boguslawski, P., Mahdjoubi, L., Zverovich, V. & Fadli, F.(2016), Automated construction of variable density nav-igable networks in a 3D indoor environment for emer-gency response, Automation in Construction, 72(2), 115–28.
Chang, M. S., Tseng, Y. L. & Chen, J. W. (2007), A scenarioplanning approach for the flood emergency logistics prepa-ration problem under uncertainty, Transportation ResearchPart E: Logistics and Transportation Review, 43(6), 737–54.
Donegan, H. A. & Dodd, F. J. (1991), A note on Saaty’srandom indexes, Mathematical and Computer Modelling,15(10), 135–37.
Duckham, M. & Kulik, L. (2003), “Simplest” paths: auto-mated route selection for navigation, in W. Kuhn, M. F.Worboys, and S. Timpf (eds.), Spatial Information Theory:Foundations of Geographic Information Science, Springer,Berlin, pp. 169–85.
Forcael, E., Gonzalez, V., Orozco, F., Vargas, S., Pantoja, A.& Moscoso, P. (2014), Ant colony optimization model fortsunamis evacuation routes, Computer-Aided Civil and In-frastructure Engineering, 29(10), 723–37.
Foreman, E. H. (1993), Facts and fictions about the analytichierarchy process, Mathematical and Computer Modelling,17(4-5), 19–26.
Friedman, R. (1992), An international survey of computermodels for fire and smoke, Journal of Fire Protection En-gineering, 4, 81–92.
Fruin, J. J. (1987), Pedestrian planning and design, Eleva-tor World Inc. (Educational Services Division), Alabama,LIB.CON 70-159312.
Gomes, E. G. & Lins, M. P. E. (2002), Integrating geograph-ical information systems and multi-criteria methods: a casestudy, Annals of Operations Research, 116, 243–69.
Gwynne, S., Galea, E. R., Lawrence, P. J., Owen, M. & Fi-lippidis, L. (1999), A review of the methodologies used inthe computer simulation of evacuation from the built envi-ronment, Building and Environment, 34, 741–49.
Kisko, T. & Francis, R. (1985), EVACNET+: a computer pro-gram to determine optimal building evacuation plans, FireSafety Journal, 9(2), 211–20.
Kuligowski, E. D. (2004), Review of 28 egress models, in R.D. Peacock and E. D. Kuligowski (eds.), Proceedings ofthe Workshop on Building Occupant Movement during FireEmergencies, National Institute of Standards and Technol-ogy, Gaithersburg, MD, June 10–11, 2004, 68–90.
Kwan, M.-P. & Lee, J. (2005), Emergency response after 9/11:the potential of real-time 3D GIS for quick emergency re-
sponse in micro-spatial environments, Computers, Environ-ment & Urban Systems, 29, 93–113.
Liu, L. & Zlatanova, S. (2011), A ‘door-to-door’ path-findingapproach for indoor navigation, in Gi4DM 2011: GeoInfor-mation for Disaster Management, Antalya, Turkey: Inter-national Society for Photogrammetry and Remote Sensing(ISPRS).
Nelson, H. E. & MacLennan, H. A. (1995), Emergency move-ment, in P. J. DiNenno (ed.), The SFPE Handbook of FireProtection Engineering, National Fire Protection Associa-tion, Quincy, MA, 3.286–3.295.
Olenick, S. M. & Carpenter, D. J. (2003), Updated inter-national survey of computer models for fire and smoke,Journal of Fire Protection Engineering, 13, 87–110.
Pangilinan, J. M. A. & Janssens, G. (2007), Evolutionary algo-rithms for the multi-objective shortest path problem, Inter-national Journal of Applied Science, Engineering and Tech-nology, 4(1), 205–10.
Park, I., Jang, G., Park, S. & Lee, J. (2009), Time-dependentoptimal routing in micro-scale emergency situation, in TheTenth International Conference on Mobile Data Manage-ment: Systems, Services and Middleware, Taipei, Taiwan,714–19.
Pauls, J. (1995), Movement of people, in P. J. DiNenno (ed.),The SFPE Handbook of Fire Protection Engineering, Na-tional Fire Protection Association, Quincy, MA, 3.263–3.285.
Saaty T. L. (1980), The Analytic Hierarchy Process: Planning,Priority Setting, Resource Allocation, McGraw-Hill, NewYork.
Saaty T. L. (1990), Multicriteria Decision Making: The Ana-lytic Hierarchy Process, RWS Publications, Pittsburgh, PA.
Saaty T. L. (1999), Decision Making for Leaders: The AnalyticHierarchy Process for Decision in a Complex World, RWSPublications, Pittsburgh, PA.
Shahabi, M., Unnikrishnan, A. & Boyles, S. D. (2015), Ro-bust optimization strategy for the shortest path problemunder uncertain link travel cost distribution, Computer-Aided Civil and Infrastructure Engineering, 30(6), 433–48.
Skriver, A. J. (2000), A classification of bicriterion shortestpath (BSP) algorithms, Asia Pacific Journal of OperationalResearch, 17(2), 199–212.
Sun, Q. & Wu, S. (2014), A configurable agent-based crowdmodel with generic behaviour effect representation mech-anism, Computer-Aided Civil and Infrastructure Engineer-ing, 29(7), 531–45.
Turskis, Z., Daniunas, A., Zavadskas, E. K. & Medzvieckas, J.(2016), Multicriteria evaluation of building foundation al-ternatives, Computer-Aided Civil and Infrastructure Engi-neering, 31, 717–29.
Ulungu, E. L. & Teghem, J. (1991), Multi-objective shortestpath problem: a survey, in Proceedings of the InternationalWorkshop on Multicriteria Decision Making: Methods–Algorithms–Applications, Liblice, Czechoslovakia, 176–88.
Vanclooster, A., Maeyer, P., Fack, V. & Weghe, N. V. (2014),Calculating least risk paths in 3D indoor space, in U.Isikdag (ed.), Innovations in 3D Geo-Information Sciences,Springer International Publishing, Switzerland, pp. 13–31.
Wang, Y., Zhang, C., Zhu, L. & Sun, Q. (2010), Applicationof AHP in the evaluation of railway emergency plans, Net-working, Sensing and Control (ICNSC), International Con-ference, April 10–12, 2010, 564–69.

Analytic prioritization of indoor routes for search and rescue operations 21
Watts, J. M. (1987), Computer models for evacuation analysis,Fire Safety Journal, 12, 237–45.
Zahedi F. (1986), The analytic hierarchy process - a survey ofthe method and its applications, Interfaces, 16, 96–108.
Zhang, W., Sun, K., Lei, C., Zhang, Y., Li, H. & SpencerJr., B. F. (2014), Fuzzy analytic hierarchy process syntheticevaluation models for the health monitoring of shield tun-
nels, Computer-Aided Civil and Infrastructure Engineering,29(9), 676–88.
Zverovich, V., Mahdjoubi, L., Boguslawski, P., Fadli, F.& Barki, H. (2016), Emergency response in complexbuildings: automated selection of safest and balancedroutes, Computer-Aided Civil and Infrastructure Engineer-ing, 31(8), 617–32.