Corporate PresentationNovember 2011
2
This document does not constitute or form part of and should not
be construed as, an offer to sell or issue or the solicitation of an offer to buy or acquire securities of EVRAZ Group S.A. (EVRAZ) or any of its subsidiaries in any jurisdiction or an inducement to enter into investment activity. No part of this document, nor the fact of its distribution, should form the basis of, or be relied on in connection with, any contract or commitment or investment decision whatsoever. No representation, warranty or undertaking, express or implied, is made as to, and no reliance should be placed on, the fairness, accuracy, completeness or correctness of the information or the opinions contained herein. None of EVRAZ or any of its affiliates, advisors or representatives shall have any liability whatsoever (in negligence or otherwise) for any loss howsoever arising from any use of this document or its contents or otherwise arising in connection with
the document.
This document contains “forward-looking statements”, which include all statements other than statements of historical facts, including, without limitation, any statements preceded by, followed by or that include the words “targets”, “believes”, “expects”, “aims”, “intends”, “will”, “may”, “anticipates”, “would”, “could”
or similar expressions or the negative thereof. Such forward-looking statements involve known and unknown risks, uncertainties and other important factors beyond EVRAZ’s
control that could cause the actual results, performance or achievements of EVRAZ to be materially different from future results, performance or achievements expressed or implied by such forward-looking, including, among others, the achievement of anticipated levels of profitability, growth, cost and synergy of recent acquisitions, the impact of competitive pricing, the ability to obtain necessary regulatory approvals and licenses, the impact of developments in the Russian economic, political and legal environment, volatility in stock markets or in the price of our shares or GDRs, financial risk management and the impact of general business and global economic conditions.
Such forward-looking statements are based on numerous assumptions regarding EVRAZ’s
present and future business strategies and the environment in which EVRAZ Group S.A. will operate in the future. By their nature, forward-looking statements involve risks and uncertainties because they relate to events and depend on circumstances that may or may not occur in the future. These forward-looking statements speak only as at the date as of which they are made, and EVRAZ expressly disclaims any obligation or undertaking to disseminate any updates or revisions to any forward-looking statements contained herein to reflect any change in EVRAZ’s
expectations with regard thereto or any change in events, conditions or circumstances on which any such statements
are based.
Neither EVRAZ, nor any of its agents, employees or advisors intends or has any duty or obligation to supplement, amend, update or revise any of the forward-looking statements contained in this document.
The information contained in this document is provided as at the
date of this document and is subject to change without notice.
Disclaimer
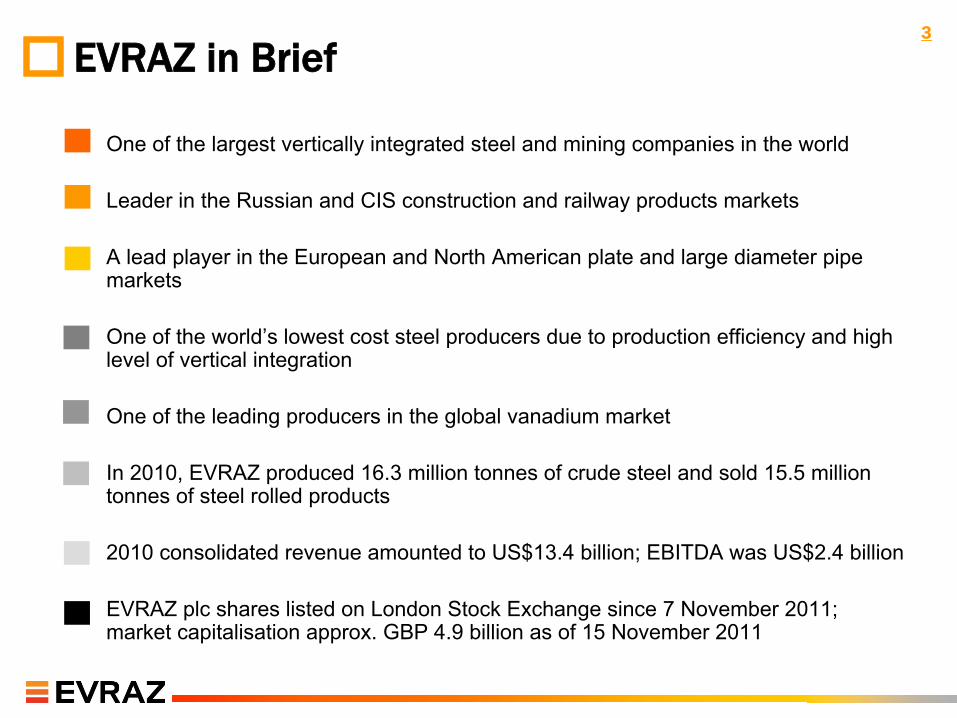
EVRAZ in Brief
◦
One of the largest vertically integrated steel and mining companies in the world
◦
Leader in the Russian and CIS construction and railway products markets
◦
A lead player in the European and North American plate and large
diameter pipe markets
◦
One of the world’s lowest cost steel producers due to production efficiency and high level of vertical integration
◦
One of the leading producers in the global vanadium market
◦
In 2010, EVRAZ produced 16.3 million tonnes of crude steel and sold 15.5 million tonnes of steel rolled products
◦
2010 consolidated revenue amounted to US$13.4 billion; EBITDA was US$2.4 billion
◦
EVRAZ plc shares listed on London Stock Exchange since 7 November 2011; market capitalisation approx. GBP 4.9 billion as of 15 November 2011
3
◦
#15 steel producer by volume globally and #1 in Russia
◦
Low cost operations driven by vertically integrated business model
◦
Exposure to growing construction and infrastructure markets globally
◦
Strong position in growing Russian market
◦
Successful track record of strategic acquisitions
◦
Multiple opportunities to drive growth
◦
Focus on HSE
Investment
Highlights4
North America
South America Africa
Europe
Russia/CIS
Asia
6,420402
4,208
1,054
410
110
110
2,607
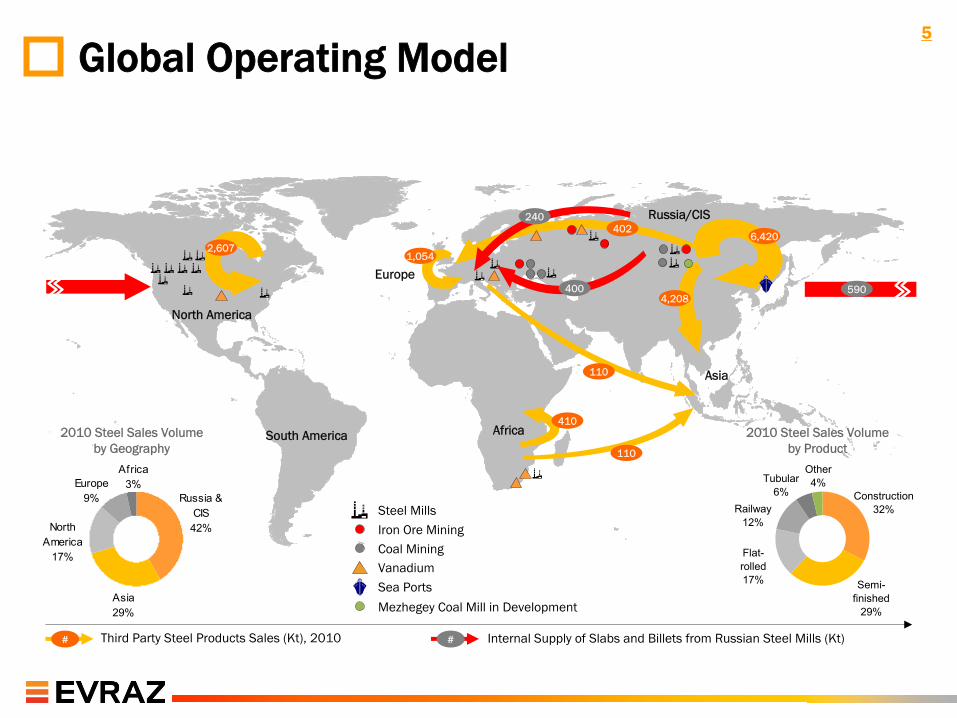
Sea PortsVanadiumCoal MiningIron Ore MiningSteel Mills
Mezhegey
Coal Mill in Development
Global Operating Model
240
400
Third Party Steel Products Sales (Kt), 2010# Internal Supply of Slabs and Billets from Russian Steel Mills (Kt)#
590
Russia & CIS42%
Africa3%
Asia29%
North America
17%
Europe9%
2010 Steel Sales Volume
by Geography
Tubular6%
Other4%
Semi-finished
29%
Flat-rolled17%
Railway12%
Construction32%
2010 Steel Sales Volume
by Product
5
6
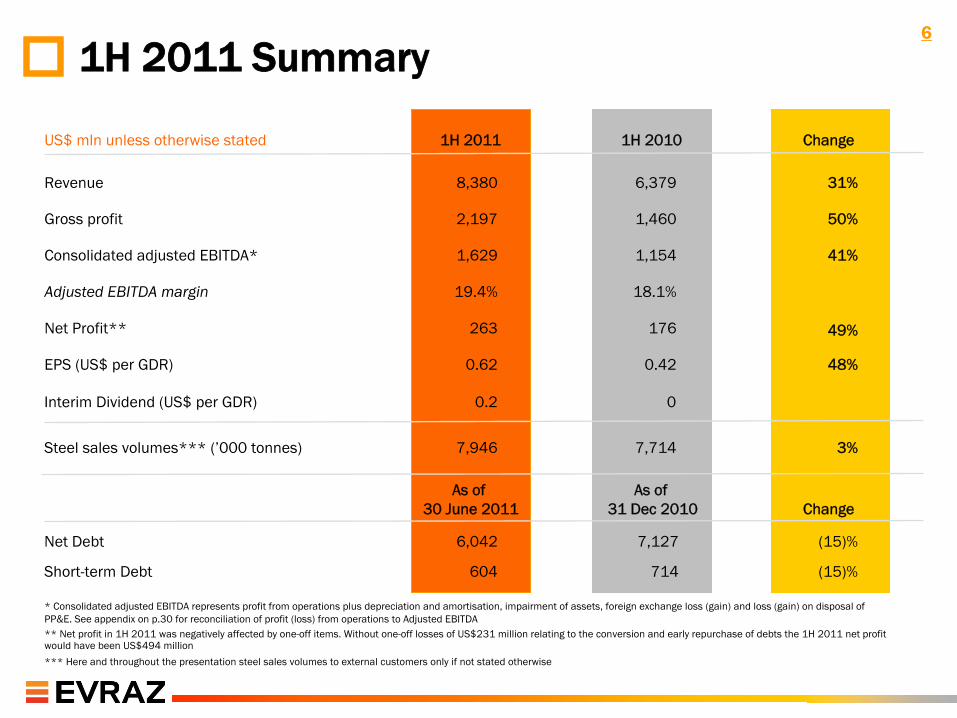
* Consolidated adjusted EBITDA represents profit from operations
plus depreciation and amortisation, impairment of assets, foreign exchange loss (gain) and loss (gain) on disposal of PP&E. See appendix on p.30 for reconciliation of profit (loss) from operations to Adjusted EBITDA** Net profit in 1H 2011 was negatively affected by one-off items. Without one-off losses of US$231 million relating to the conversion and early repurchase of debts the 1H 2011 net profit would have been US$494 million
*** Here and throughout the presentation steel sales volumes to external customers only if not stated otherwise
Revenue 8,380 6,379 31%
Gross profit 2,197 1,460 50%
1,154 41%Consolidated adjusted EBITDA* 1,629
Adjusted EBITDA margin 19.4% 18.1%
0.42EPS (US$ per GDR) 0.62
1H 2011 1H 2010US$ mln
unless otherwise stated Change
1H 2011 Summary
176Net Profit** 263
Steel sales volumes*** (’000 tonnes) 7,946 7,714 3%
49%
48%
Interim Dividend (US$ per GDR)
Short-term Debt 604
Net Debt 6,042 7,127
714
(15)%
(15)%
0.2 0
As of 30 June 2011
As of 31 Dec 2010 Change
7
803 744
39096255
(3)
83
62
(157)(156)-300
0
300
600
900
1,200
1,500
1,800
1H 2010 1H 2011
Steel Mining Vanadium Other operations Unallocated & Eliminations
5,7967,492
1,120
2,040
290
320414
482
(1,241) (1,954)-2,000
0
2,000
4,000
6,000
8,000
10,000
12,000
1H 2010 1H 2011
Steel Mining Vanadium Other operations Eliminations
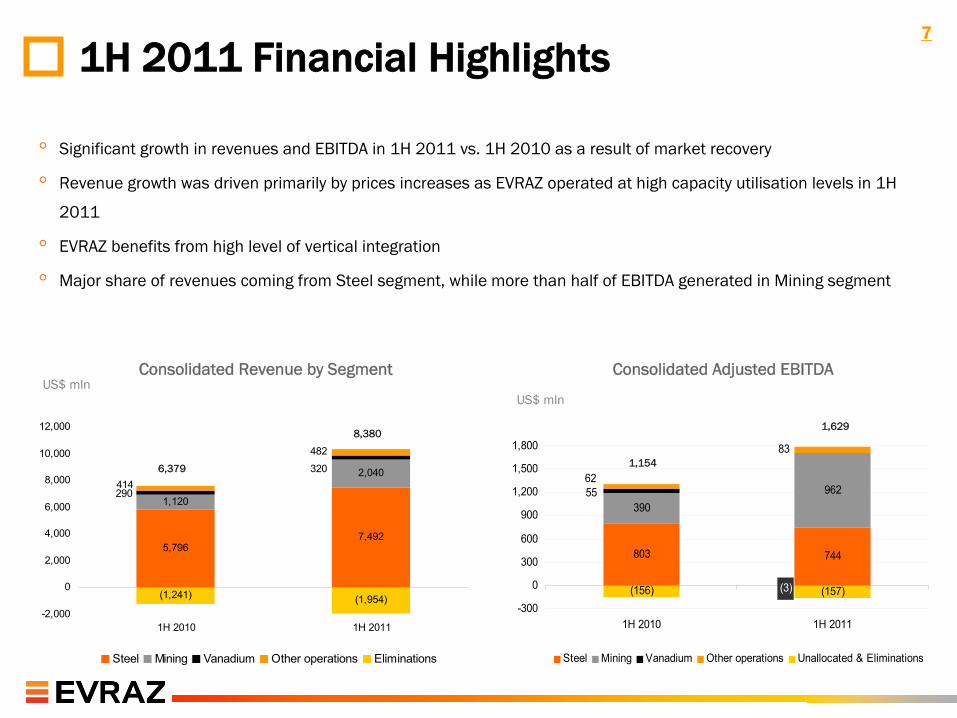
1H 2011 Financial Highlights
Consolidated Revenue by
Segment
US$ mln
Consolidated Adjusted
EBITDA
6,379
8,380
1,154
1,629
US$ mln
◦
Significant growth in revenues and EBITDA in 1H 2011 vs. 1H 2010
as a result of market recovery
◦
Revenue growth was driven primarily by prices increases as EVRAZ
operated at high capacity utilisation
levels in 1H
2011
◦
EVRAZ benefits from high level of vertical integration
◦
Major share of revenues coming from Steel segment, while more than half of EBITDA generated in Mining segment
8
Cost Leadership
◦
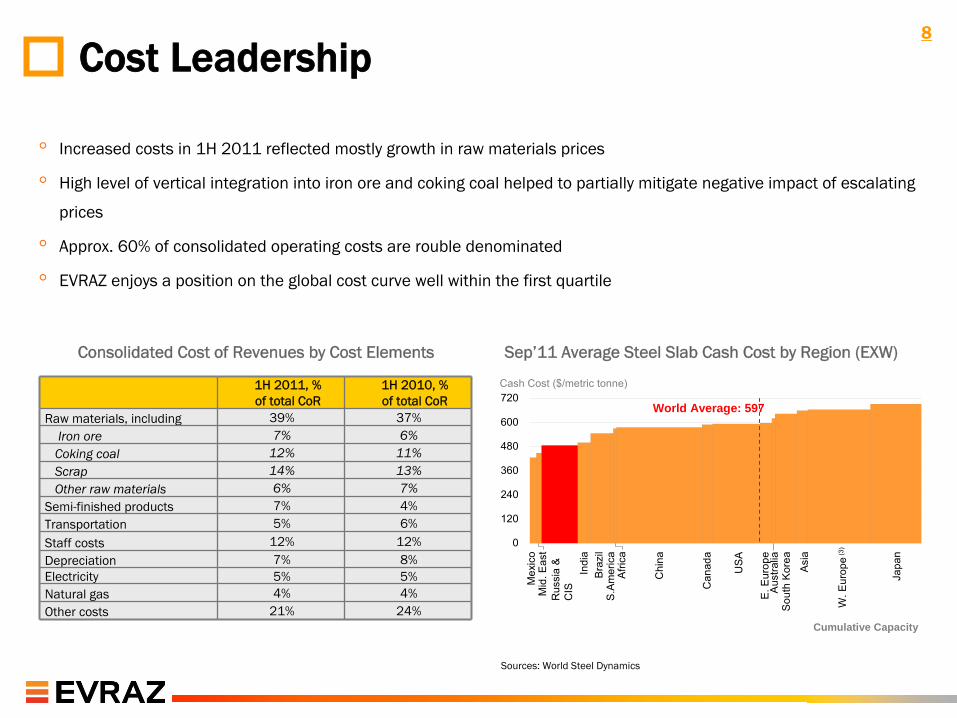
Increased costs in 1H 2011 reflected mostly growth in raw materials prices
◦
High level of vertical integration into iron ore and coking coal
helped to partially mitigate negative impact of escalating
prices
◦
Approx. 60% of consolidated operating costs are rouble
denominated
◦
EVRAZ enjoys a position on the global cost curve well within the
first quartile
Sources: World Steel Dynamics
Sep’11 Average Steel Slab Cash Cost by Region (EXW)
Cash Cost ($/metric tonne)
0
120
240
360
480
600
720World Average: 597
Cumulative Capacity
Mid
. Eas
tM
exic
o
Rus
sia
&
CIS
Indi
aB
razi
l
Can
ada
US
A
E. E
urop
eA
ustra
liaS
outh
Kor
ea
Asi
a
W. E
urop
e(3
)
Japa
n
Consolidated Cost of Revenues by Cost Elements
1H 2011, % of total CoR
1H 2010, % of total CoR
Raw
materials, including 39% 37%Iron
ore 7% 6%Coking
coal 12% 11%Scrap 14% 13%Other
raw
materials 6% 7%Semi-finished
products 7% 4%Transportation 5% 6%
Staff
costs 12% 12%Depreciation 7% 8%Electricity 5% 5%Natural
gas 4% 4%Other
costs 21% 24%S
.Am
eric
aA
frica
Chi
na
6.27.9 8.6
0
5
10
15
2009 2010 2011(f)
3226
13
0
20
40
2009 2010 2011(f)
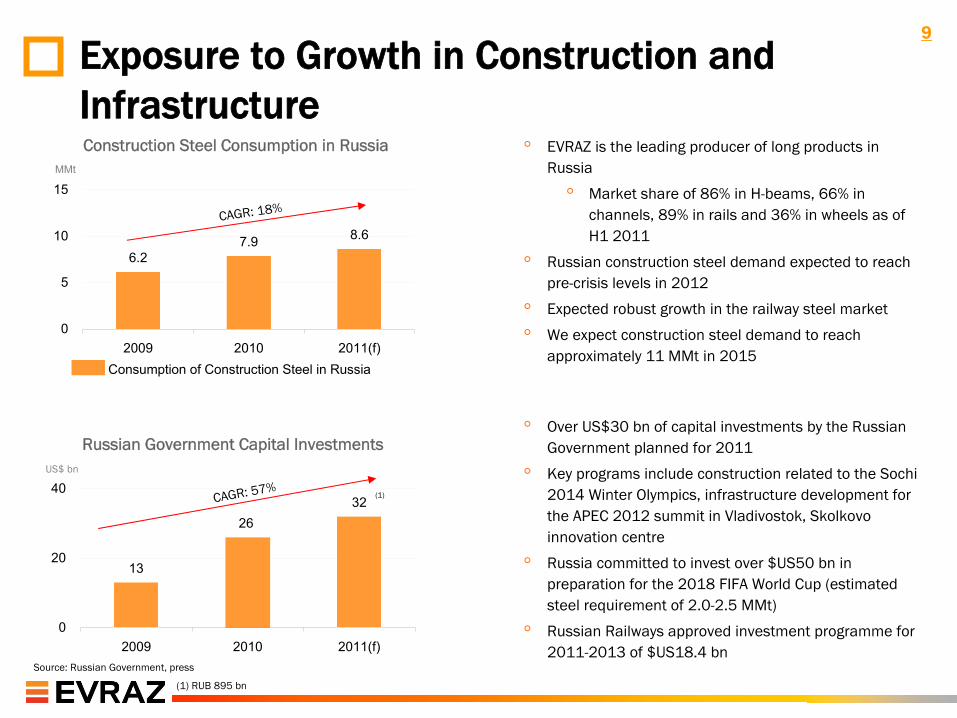
Construction Steel Consumption in RussiaMMt
Consumption of Construction Steel in Russia
Russian Government Capital InvestmentsUS$ bn
(1) RUB 895 bn
◦
EVRAZ is the leading producer of long products in Russia
◦
Market share of 86% in H-beams, 66% in channels, 89% in rails and 36% in wheels as of H1 2011
◦
Russian construction steel demand expected to reach pre-crisis levels in 2012
◦
Expected robust growth in the railway steel market
◦
We expect construction steel demand to reach approximately 11 MMt
in 2015
◦
Over US$30 bn
of capital investments by the Russian Government planned for 2011
◦
Key programs include construction related to the Sochi 2014 Winter Olympics, infrastructure development for the APEC 2012 summit in Vladivostok, Skolkovo
innovation centre
◦
Russia committed to invest over $US50 bn
in preparation for the 2018 FIFA World Cup (estimated steel requirement of 2.0-2.5 MMt)
◦
Russian Railways approved investment programme for 2011-2013 of $US18.4 bn
CAGR: 18%
CAGR: 57%(1)
Exposure to Growth in Construction and Infrastructure
Source: Russian Government, press
9
10
FCF Generation
◦
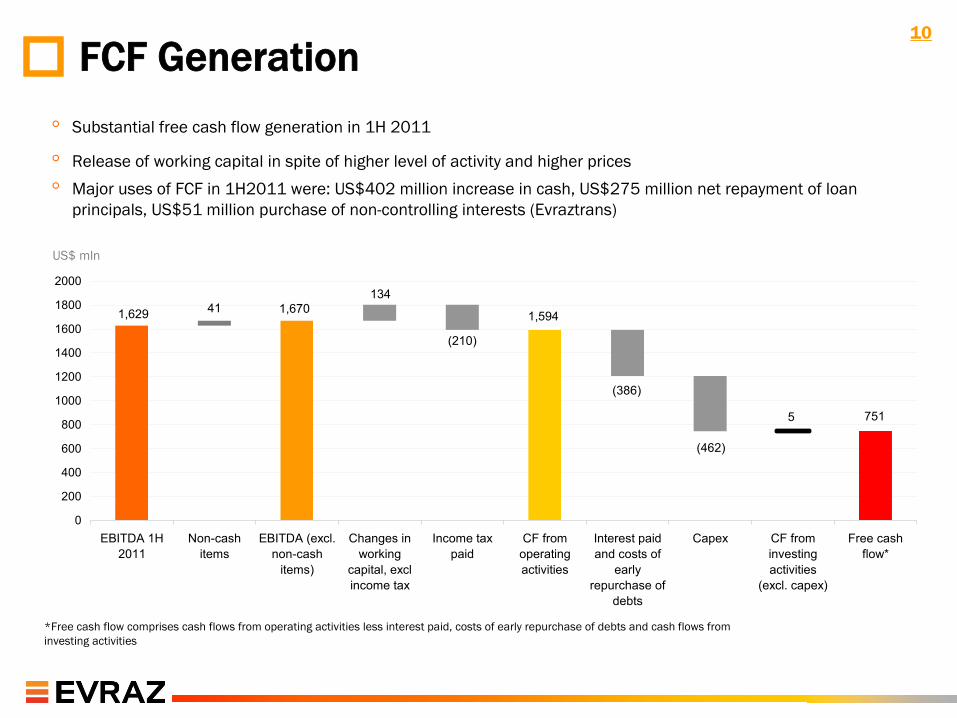
Substantial free cash flow generation in 1H 2011
◦
Release of working capital in spite of higher level of activity and higher prices
◦
Major uses of FCF in 1H2011 were: US$402 million increase in cash, US$275 million net repayment of loan principals, US$51 million purchase of non-controlling interests (Evraztrans)
*Free cash flow comprises cash flows from operating activities less interest paid, costs of early repurchase of debts and cash flows from investing activities
US$ mln
1,6701,629 41
(210)
1,594
(386)
(462)
5 751
134
0
200
400
600
800
1000
1200
1400
1600
1800
2000
EBITDA 1H2011
Non-cashitems
EBITDA (excl.non-cash
items)
Changes inworking
capital, exclincome tax
Income taxpaid
CF fromoperatingactivities
Interest paidand costs of
earlyrepurchase of
debts
Capex CF frominvestingactivities
(excl. capex)
Free cashflow*
11
◦
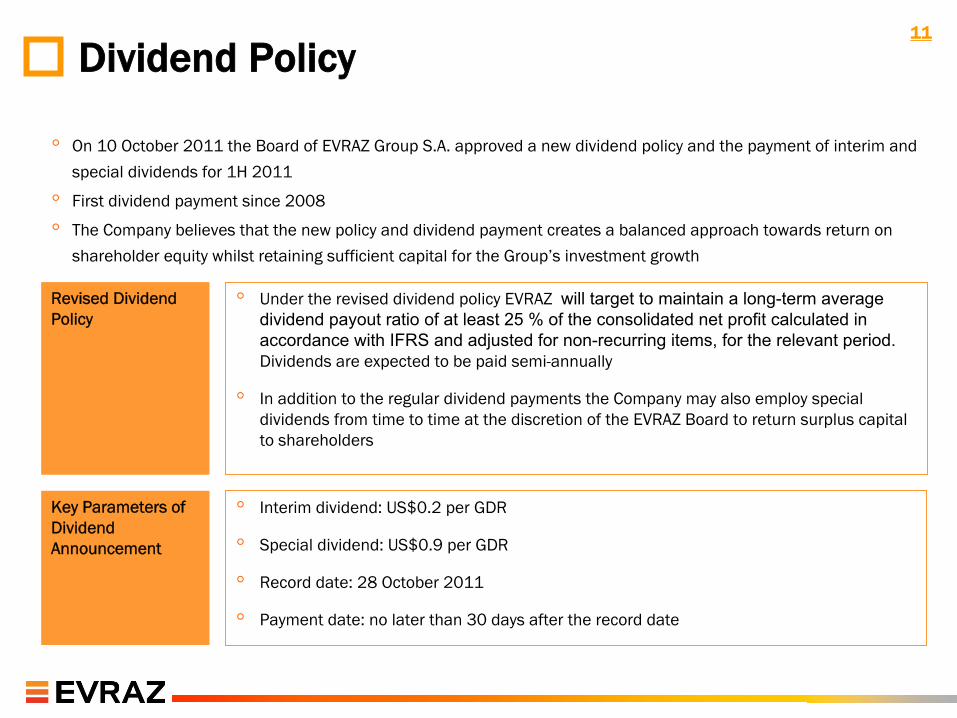
On 10 October 2011 the Board of EVRAZ Group S.A. approved a new dividend policy and the payment of interim and
special dividends for 1H 2011
◦
First dividend payment since 2008
◦
The Company believes that the new policy and dividend payment creates a balanced approach towards return on
shareholder equity whilst retaining sufficient capital for the Group’s investment growth
Dividend Policy
◦
Under the revised dividend policy EVRAZ will
target
to maintain
a long-term
average
dividend
payout
ratio
of at
least
25 %
of the
consolidated
net
profit
calculated
in
accordance
with
IFRS and
adjusted
for non-recurring
items, for the
relevant
period. Dividends are expected to be paid semi-annually
◦
In addition to the regular dividend payments the Company may also employ special dividends from time to time at the discretion of the EVRAZ Board
to return surplus capital to shareholders
Revised Dividend Policy
◦
Interim dividend: US$0.2 per GDR
◦
Special dividend: US$0.9 per GDR
◦
Record date: 28 October 2011
◦
Payment date: no later than 30 days after the record date
Key Parameters of Dividend Announcement
12
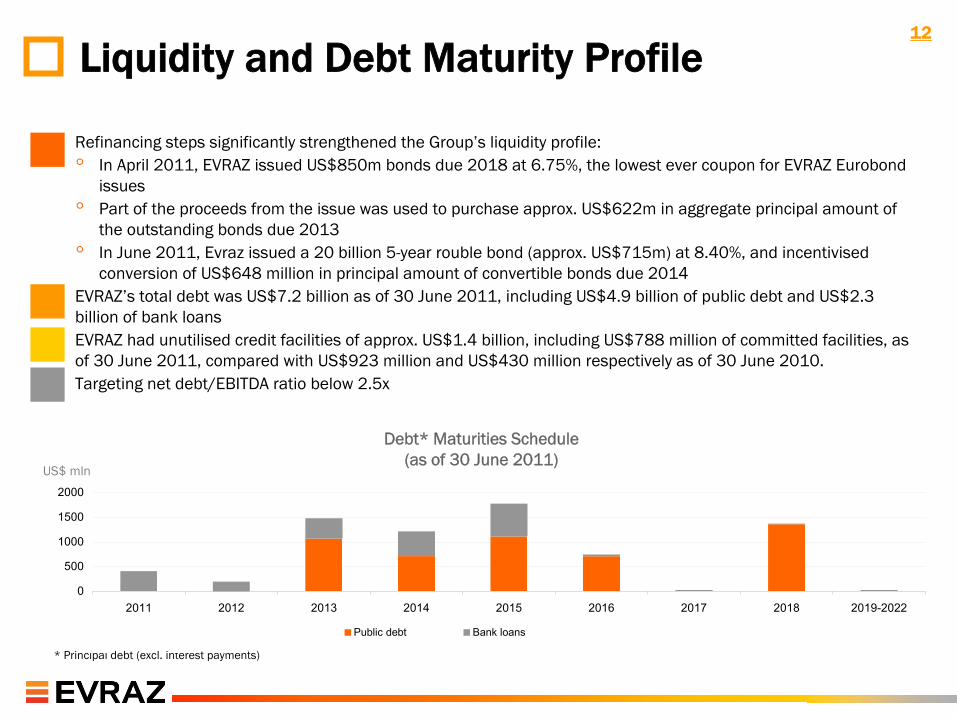
Liquidity and Debt Maturity Profile
Debt* Maturities Schedule (as of 30 June 2011)
Debt* Maturities Schedule (as of 30 June 2011)
* Principal debt (excl. interest payments)
US$ mln
◦
Refinancing steps significantly strengthened the Group’s liquidity profile: ◦
In April 2011, EVRAZ issued US$850m bonds due 2018 at 6.75%, the
lowest ever coupon for EVRAZ Eurobond issues
◦
Part of the proceeds from the issue was used to purchase approx.
US$622m in aggregate principal amount of the outstanding bonds due 2013
◦
In June 2011, Evraz issued a 20
billion 5-year rouble
bond (approx. US$715m) at 8.40%, and incentivised
conversion of US$648 million in principal amount of convertible bonds due 2014
◦
EVRAZ’s
total debt was US$7.2 billion as of 30 June 2011, including US$4.9 billion of public debt and US$2.3 billion of bank loans
◦
EVRAZ had unutilised
credit facilities of approx. US$1.4 billion, including US$788 million of committed facilities, as of 30 June 2011, compared with US$923 million and US$430 million
respectively as of 30 June 2010.◦
Targeting net debt/EBITDA ratio below 2.5x
0
500
1000
1500
2000
2011 2012 2013 2014 2015 2016 2017 2018 2019-2022
Public debt Bank loans
13
1,6291,1961,154
769468
19%17%18%15%
10%
0
500
1,000
1,500
2,000
1H2009 2H2009 1H2010 2H2010 1H20110%
5%
10%
15%
20%
EBITDA and EBITDA Margin PerformanceUS$ MM
EBITDA
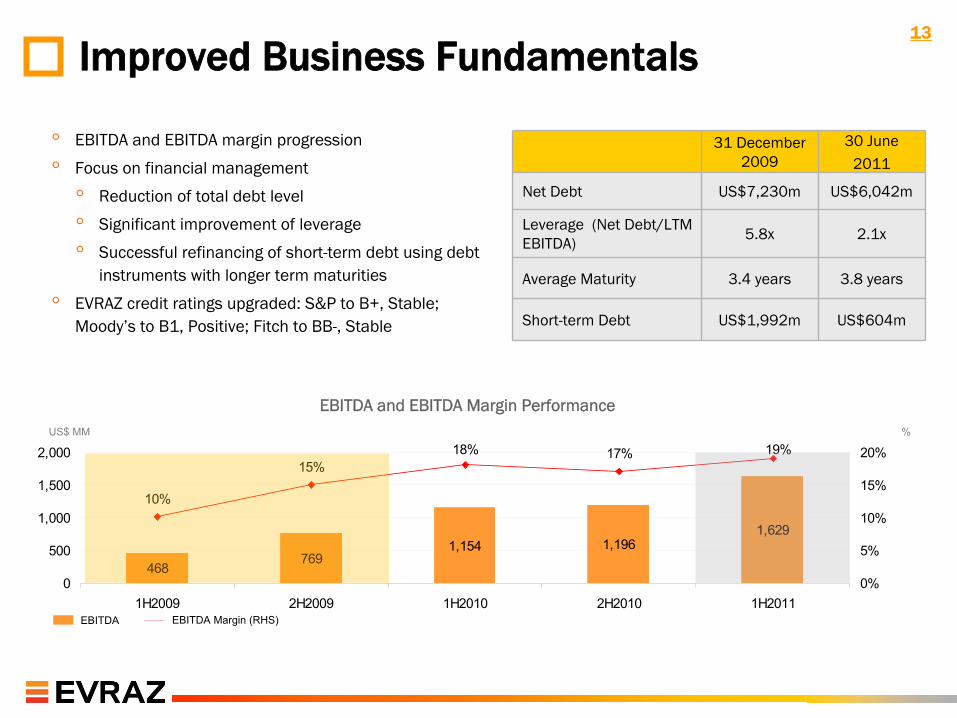
Improved Business Fundamentals
EBITDA Margin (RHS)
%
31 December 2009
30 June 2011
Net Debt US$7,230m US$6,042m
Leverage (Net Debt/LTM EBITDA)
5.8x 2.1x
Average Maturity 3.4 years 3.8 years
Short-term Debt US$1,992m US$604m
◦
EBITDA and EBITDA margin progression
◦
Focus on financial management
◦
Reduction of total debt level
◦
Significant improvement of leverage
◦
Successful refinancing of short-term debt using debt instruments with longer term maturities
◦
EVRAZ credit ratings upgraded: S&P to B+, Stable; Moody’s to B1, Positive; Fitch to BB-, Stable
14
53%68%
47%32%
0
1,000
2,000
3,000
4,000
5,000
6,000
1H 2010 1H 2011
Domestic Export
2,260 1,838
2,100 2,378
785 813387 512
0
1,000
2,000
3,000
4,000
5,000
6,000
1H 2010 1H 2011
Semi-finished Construction Railway Other
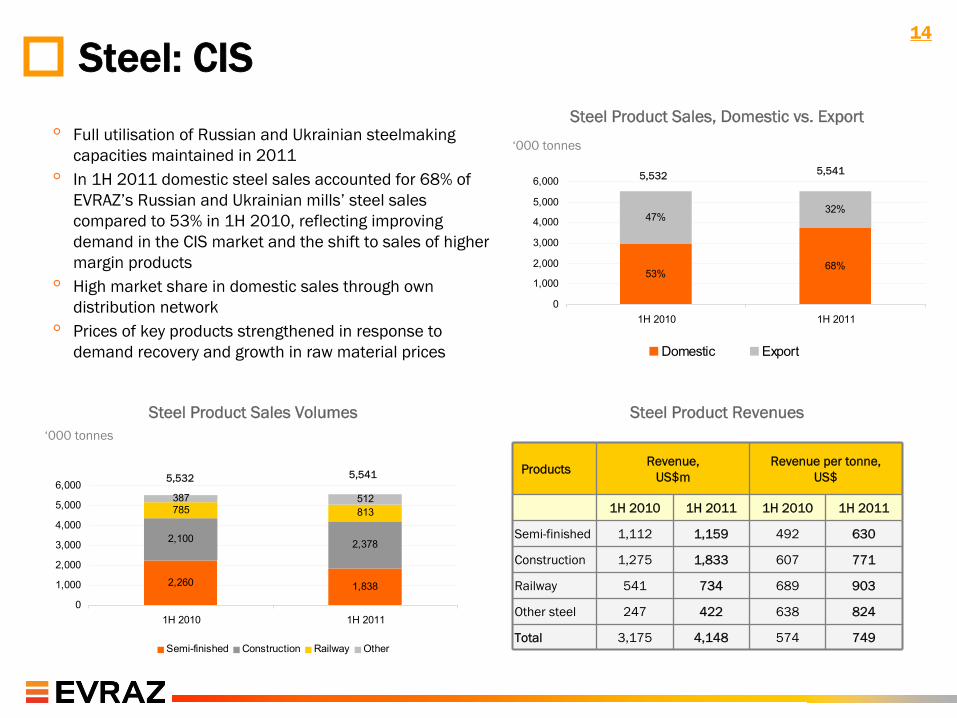
Steel: CIS
Steel Product RevenuesSteel Product Sales Volumes
5,532 5,541
‘000 tonnes
5,532 5,541
Steel Product Sales, Domestic vs. Export
ProductsRevenue,
US$mRevenue
per
tonne,
US$
1H 2010 1H 2011 1H 2010 1H 2011
Semi-finished 1,112 1,159 492 630
Construction 1,275 1,833 607 771
Railway 541 734 689 903
Other
steel 247 422 638 824
Total 3,175 4,148 574 749
‘000 tonnes◦
Full utilisation
of Russian and Ukrainian steelmaking capacities maintained in 2011
◦
In 1H 2011 domestic steel sales accounted for 68% of EVRAZ’s
Russian and Ukrainian mills’
steel sales compared to 53% in 1H 2010, reflecting improving demand in the CIS market and the shift to sales of higher margin products
◦
High market share in domestic sales through own distribution network
◦
Prices of key products strengthened in response to demand recovery and growth in raw material prices
15
197 165
181 242
462 511
436 403
0
200
400
600
800
1,000
1,200
1,400
1H 2010 1H 2011
Construction & other steel Railway Flat-rolled Tubular
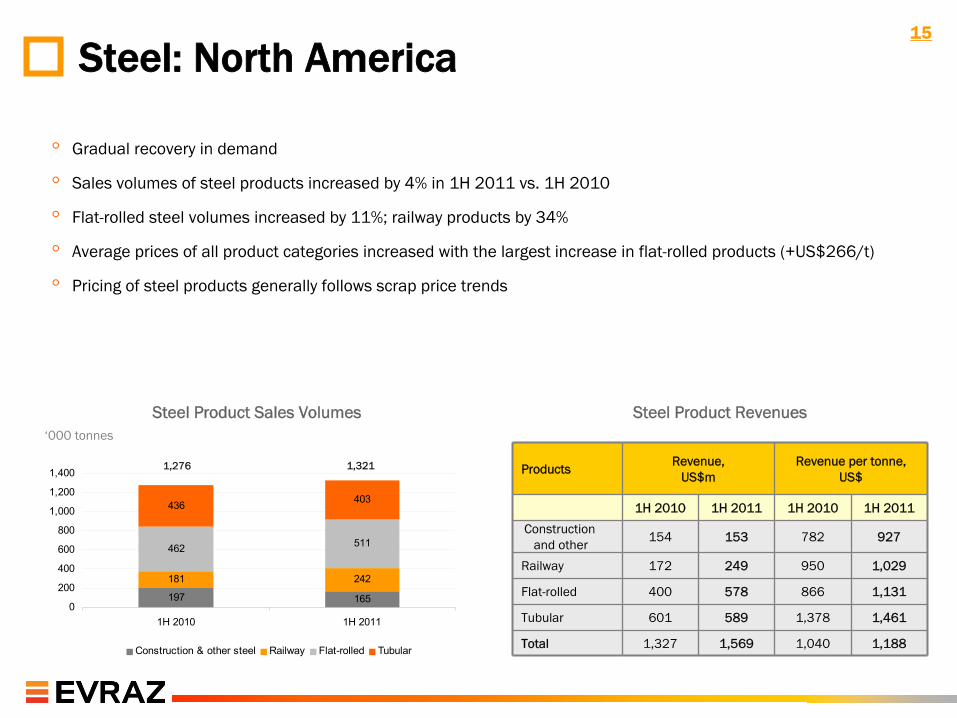
Steel: North America
1,276 1,321 ProductsRevenue,
US$mRevenue
per
tonne,
US$
1H 2010 1H 2011 1H 2010 1H 2011
Construction
and other
154 153 782 927
Railway 172 249 950 1,029
Flat-rolled 400 578 866 1,131
Tubular 601 589 1,378 1,461
Total 1,327 1,569 1,040 1,188
Steel Product RevenuesSteel Product Sales Volumes‘000 tonnes
◦
Gradual recovery in demand
◦
Sales volumes of steel products increased by 4% in 1H 2011 vs. 1H 2010
◦
Flat-rolled steel volumes increased by 11%; railway products by 34%
◦
Average prices of all product categories increased with the largest increase in flat-rolled products (+US$266/t)
◦
Pricing of steel products generally follows scrap price trends
16
511631
92
109
0100200300400500600700800
1H 2010 1H 2011
Flat-rolled Other
97 108
183
52
195
10
-50
100150200250300350400
1H 2010 1H 2011
Construction Flat-rolled Other
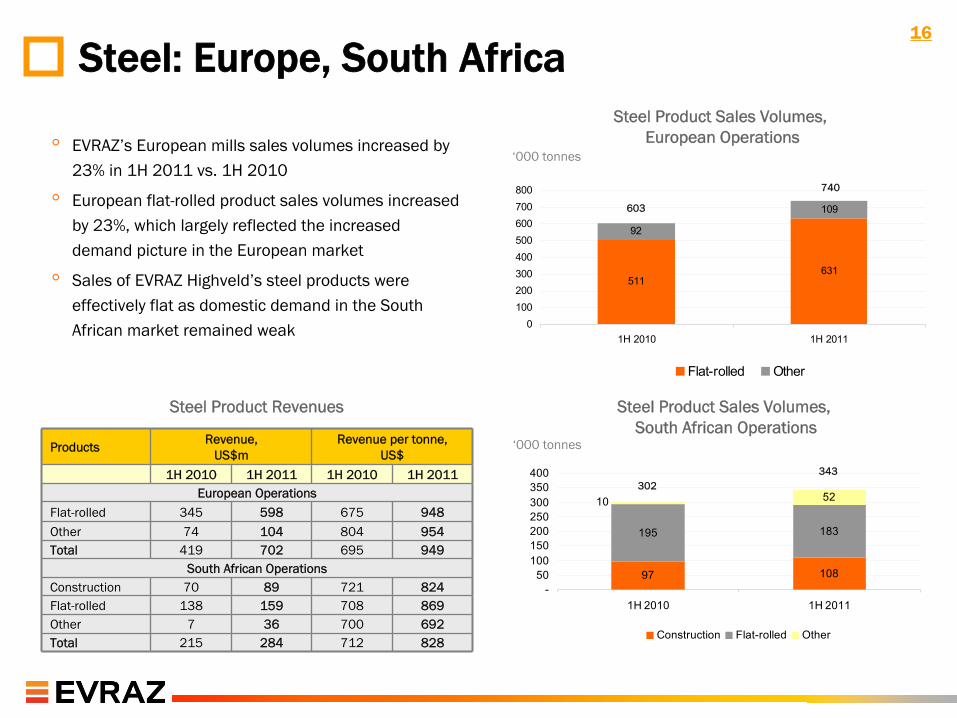
Steel: Europe, South Africa
‘000 tonnes
‘000 tonnes
603
740
302343
ProductsRevenue,
US$mRevenue
per
tonne,
US$
1H 2010 1H 2011 1H 2010 1H 2011European
OperationsFlat-rolled 345 598 675 948Other 74 104 804 954Total 419 702 695 949
South
African
OperationsConstruction 70 89 721 824Flat-rolled 138 159 708 869Other 7 36 700 692Total 215 284 712 828
Steel Product Sales Volumes, South African Operations
Steel Product Revenues
Steel Product Sales Volumes, European Operations◦
EVRAZ’s
European mills sales volumes increased by 23% in 1H 2011 vs. 1H 2010
◦
European flat-rolled product sales volumes increased by 23%, which largely reflected the increased demand picture in the European market
◦
Sales of EVRAZ Highveld’s steel products were effectively flat as domestic demand in the South African market remained weak
4,053 3,850
3,2993,4992,4042,5062,191
4,0213,402
3,642
5,288
4,2184,795
3,501 3,229
0
3,000
6,000
8,859
10,397 10,6359,981
10,455
8,8099,955 9,608
10,191 10,355
0
4,000
8,000
12,000
H1 2009 H2 2009 H1 2010 H2 2010 H1 2011
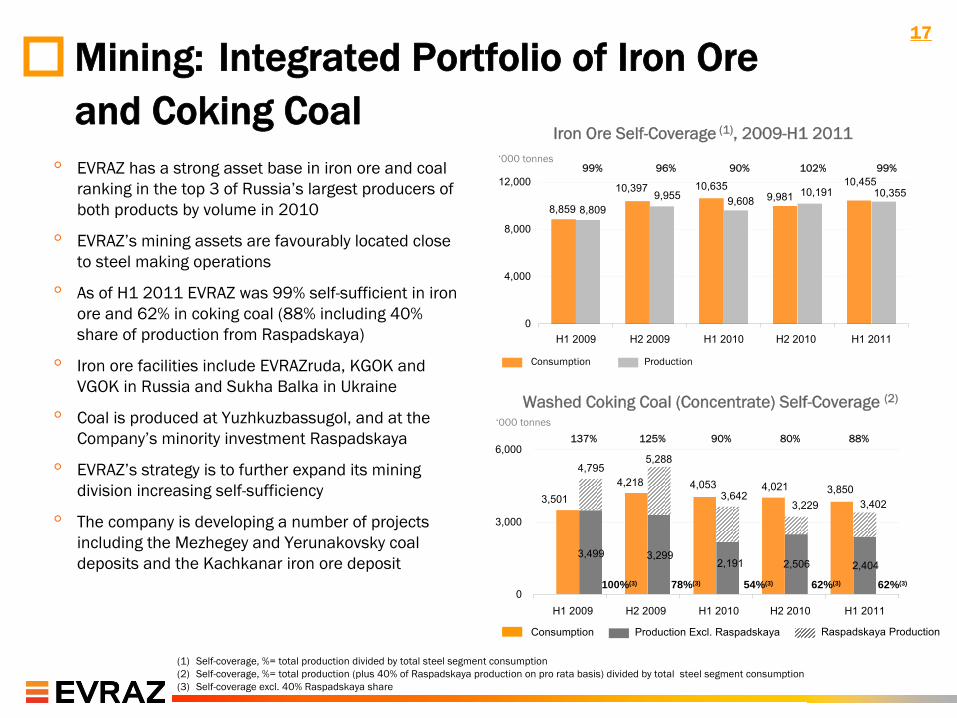
Washed Coking Coal (Concentrate) Self-Coverage (2)Washed Coking Coal (Concentrate) Self-Coverage (2)
99% 96% 90% 102% 99%
(1
)
Self-coverage, %= total production divided by total steel segment consumption(2
)
Self-coverage, %= total production (plus 40% of Raspadskaya production on pro rata basis) divided by total steel segment consumption(3
)
Self-coverage excl. 40% Raspadskaya share
◦
EVRAZ has a strong asset base in iron ore and coal ranking in the top 3 of Russia’s largest producers of both products by volume in 2010
◦
EVRAZ’s mining assets are favourably located close to steel making operations
◦
As of H1 2011 EVRAZ was 99% self-sufficient in iron ore and 62% in coking coal (88% including 40% share of production from Raspadskaya)
◦
Iron ore facilities include EVRAZruda, KGOK and VGOK in Russia and Sukha Balka in Ukraine
◦
Coal is produced at Yuzhkuzbassugol, and at the Company’s minority investment Raspadskaya
◦
EVRAZ’s strategy is to further expand its mining division increasing self-sufficiency
◦
The company is developing a number of projects including the Mezhegey and Yerunakovsky coal deposits and the Kachkanar iron ore deposit
‘000 tonnes
Iron Ore Self-Coverage
(1), 2009-H1 2011Iron Ore Self-Coverage
(1), 2009-H1 2011
Consumption Production
‘000 tonnes
Consumption Production Excl. Raspadskaya Raspadskaya Production
137% 125% 90% 80% 88%
78%(3)100%(3) 54%(3) 62%(3) 62%(3)
H1 2009 H2 2009 H1 2010 H2 2010 H1 2011
Mining:
Integrated Portfolio of Iron Ore and Coking Coal
17
646 609730
3Q 2010 2Q 2011 3Q 2011
1,229 1,299 1,351
3Q 2010 2Q 2011 3Q 2011
448 550 517
3Q 2010 2Q 2011 3Q 2011
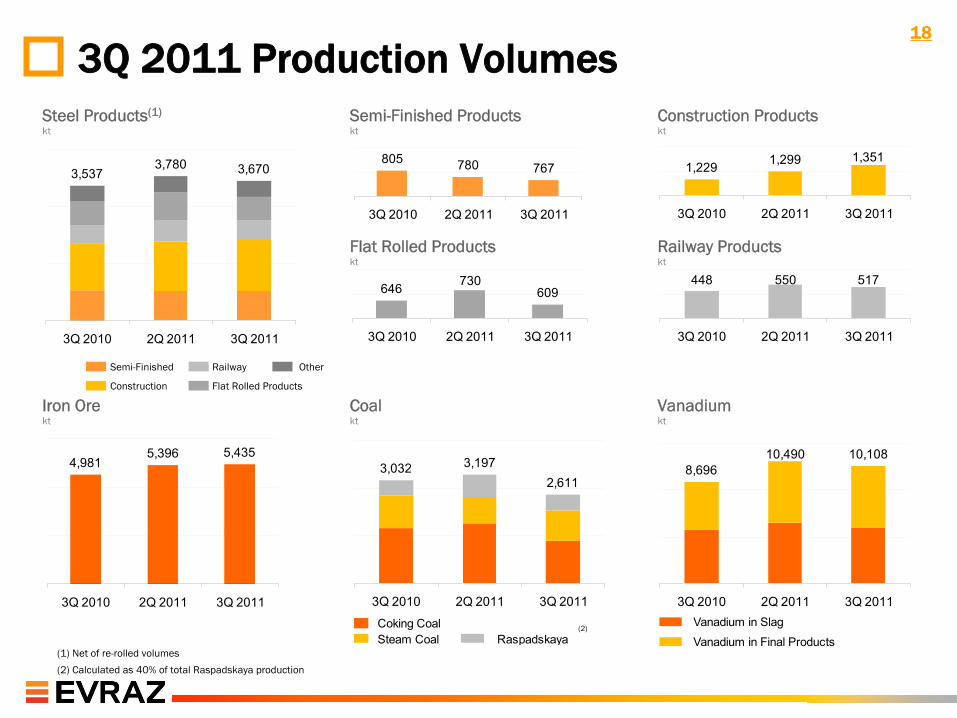
Steel Products(1)
kt
Railway
Construction
Semi-Finished
Flat Rolled Products
Other
Semi-Finished Productskt
Construction Productskt
Iron Orekt
Coalkt
Vanadiumkt
Flat Rolled Productskt
Railway Productskt
3,5373,780 3,670
3Q 2010 2Q 2011 3Q 2011
805 780 767
3Q 2010 2Q 2011 3Q 2011
(1) Net of re-rolled volumes
(2) Calculated as 40% of total Raspadskaya production
3Q 2011 Production Volumes
4,9815,396 5,435
3Q 2010 2Q 2011 3Q 2011
3,032 3,1972,611
3Q 2010 2Q 2011 3Q 2011
Coking CoalSteam Coal Raspadskaya
8,69610,490 10,108
3Q 2010 2Q 2011 3Q 2011Vanadium in Slag
Vanadium in Final Products(2)
18
19
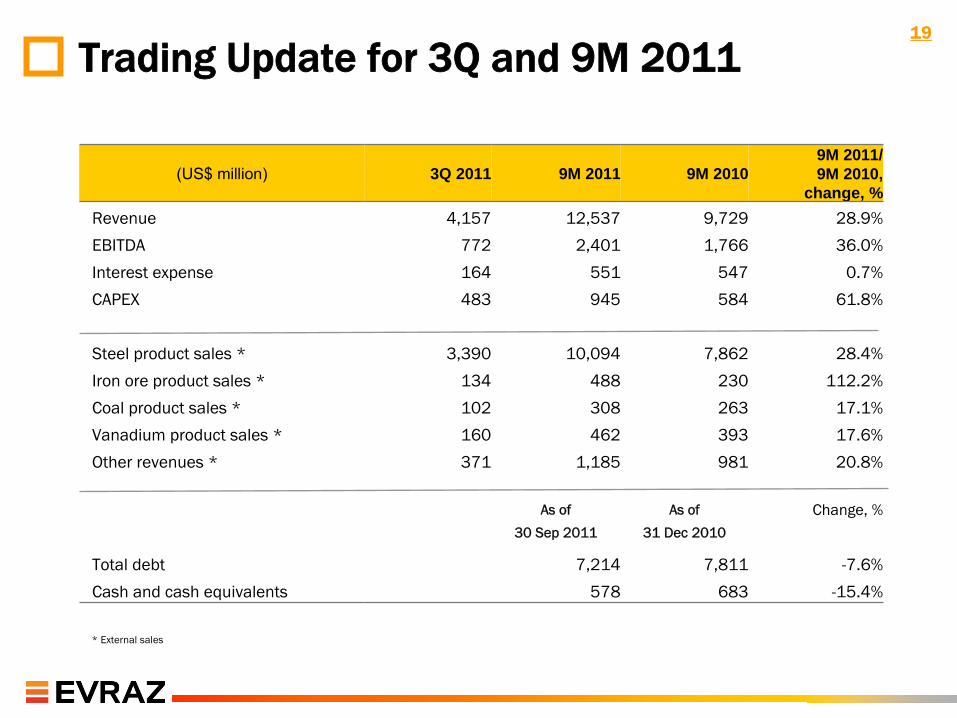
Trading Update for 3Q and 9M 2011
(US$ million) 3Q 2011 9M 2011 9M 20109M 2011/9M 2010,
change, %Revenue 4,157 12,537 9,729 28.9%
EBITDA 772 2,401 1,766 36.0%
Interest
expense 164 551 547 0.7%
CAPEX 483 945 584 61.8%
Steel
product
sales
* 3,390 10,094 7,862 28.4%
Iron
ore
product
sales
* 134 488 230 112.2%
Coal
product
sales
* 102 308 263 17.1%
Vanadium
product
sales
* 160 462 393 17.6%
Other
revenues
* 371 1,185 981 20.8%
As of
30 Sep 2011
As of
31 Dec 2010
Change, %
Total
debt 7,214 7,811 -7.6%
Cash
and
cash
equivalents 578 683 -15.4%
* External sales
20
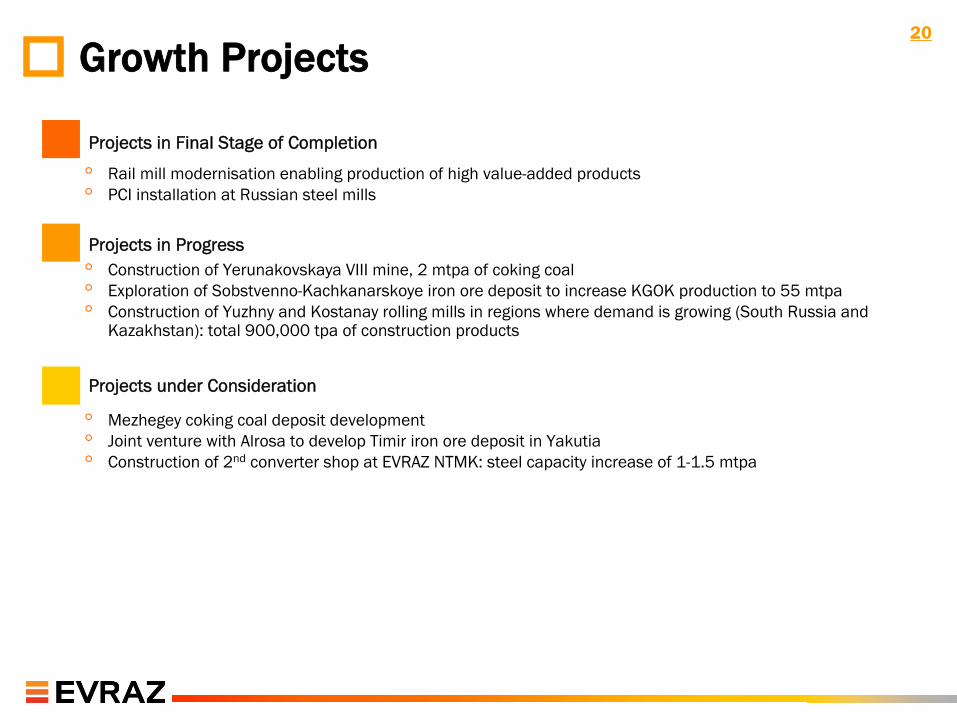
Growth Projects
Projects under Consideration
Projects in Progress
◦
Mezhegey
coking coal deposit development◦
Joint venture with Alrosa
to develop Timir
iron ore deposit in Yakutia◦
Construction of 2nd
converter shop at EVRAZ NTMK: steel capacity increase of 1-1.5
mtpa
◦
Construction of Yerunakovskaya
VIII mine, 2 mtpa
of coking coal◦
Exploration of Sobstvenno-Kachkanarskoye
iron ore deposit to increase KGOK production to 55 mtpa◦
Construction of Yuzhny
and Kostanay
rolling mills in regions where demand is growing (South Russia and Kazakhstan): total 900,000 tpa
of construction products
Projects in Final Stage of Completion
◦
Rail mill modernisation
enabling production of high value-added products◦
PCI installation at Russian steel mills
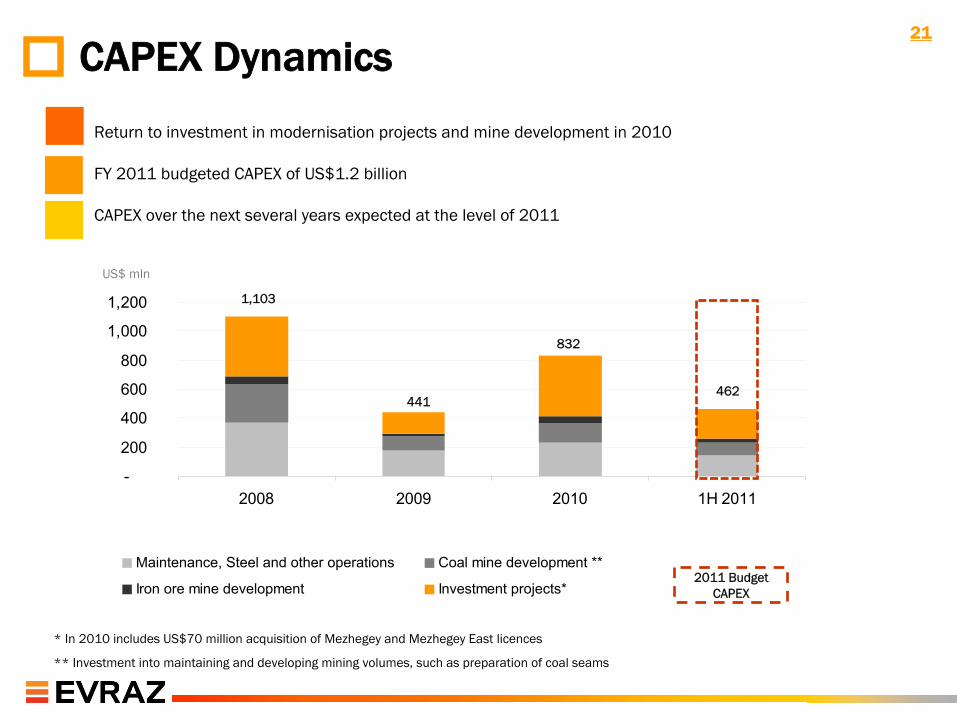
-
200
400
600
800
1,000
1,200
2008 2009 2010 1H 2011
Maintenance, Steel and other operations Coal mine development **
Iron ore mine development Investment projects*
21
CAPEX Dynamics
1,103
441
832
462
◦
Return to investment in modernisation projects and mine development in 2010
◦
FY 2011 budgeted CAPEX of US$1.2 billion
◦
CAPEX over the next several years expected at the level of
2011
* In 2010 includes US$70 million acquisition of Mezhegey
and Mezhegey
East licences
** Investment into maintaining and developing mining volumes, such as preparation of coal seams
US$ mln
2011 Budget CAPEX
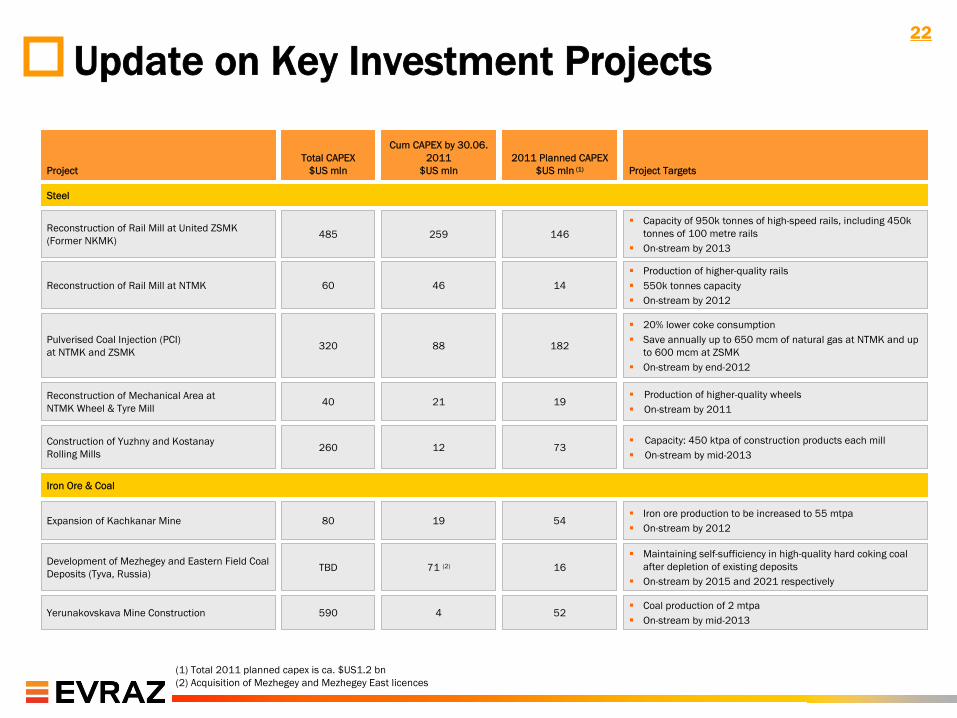
(1) Total 2011 planned capex is ca. $US1.2 bn
(2) Acquisition of Mezhegey and Mezhegey East licences
Iron Ore & Coal
Steel
Yerunakovskava Mine Construction 590 4 52
Coal production of 2 mtpa
On-stream by mid-2013
Development of Mezhegey and Eastern Field Coal Deposits (Tyva, Russia)
Maintaining self-sufficiency in high-quality hard coking coal after depletion of existing deposits
On-stream by 2015 and 2021 respectively
Construction of Yuzhny and Kostanay Rolling Mills
Capacity: 450 ktpa of construction products each mill
On-stream by mid-2013
ProjectTotal CAPEX
$US mln
Cum CAPEX by 30.06. 2011
$US
mln2011 Planned CAPEX
$US
mln
(1) Project Targets
Reconstruction of Rail Mill at United ZSMK (Former NKMK)
Capacity of 950k tonnes of high-speed rails, including 450k tonnes of 100 metre rails
On-stream by 2013
Reconstruction of Rail Mill at NTMK
Production of higher-quality rails
550k tonnes capacity
On-stream by 2012
Pulverised Coal Injection (PCI) at NTMK
and ZSMK
20% lower coke consumption
Save annually up to 650 mcm of natural gas at NTMK and up to 600 mcm at ZSMK
On-stream by end-2012
Reconstruction of Mechanical Area at NTMK Wheel & Tyre Mill
Production of higher-quality wheels
On-stream by 2011
Expansion of Kachkanar Mine
TBD 71 (2) 16
260 12 73
485 259 146
60 46 14
320 88 182
40 21 19
80 19 54
Iron ore production to be increased to 55 mtpa
On-stream by 2012
Update on Key Investment Projects22
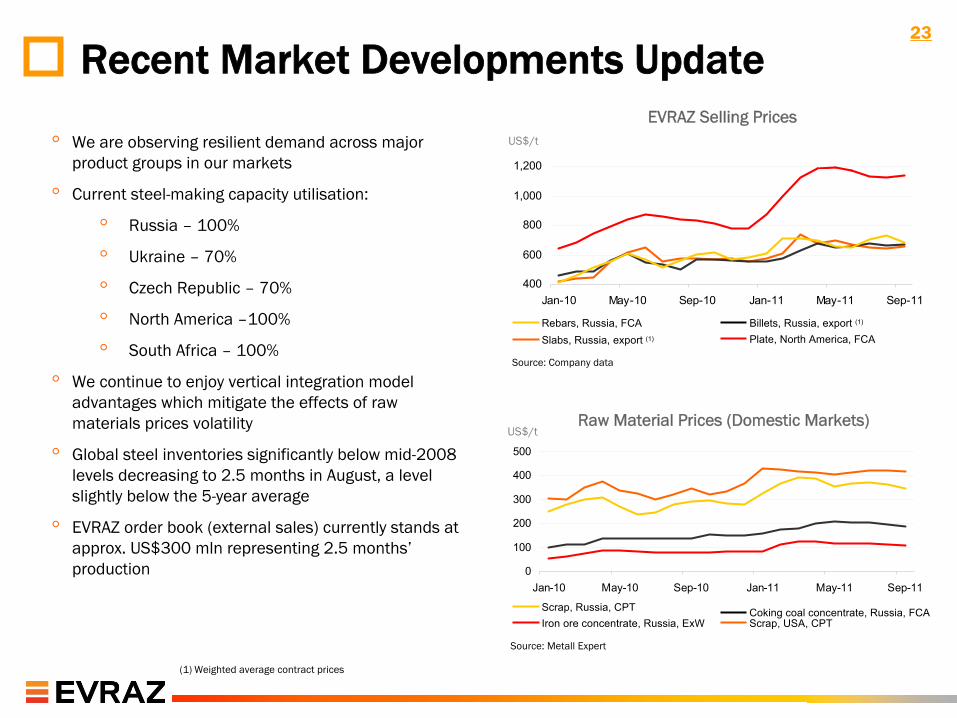
0
100
200
300
400
500
Jan-10 May-10 Sep-10 Jan-11 May-11 Sep-11
◦
We are observing resilient demand across major product groups in our markets
◦
Current steel-making capacity utilisation:
◦
Russia –
100%
◦
Ukraine –
70%
◦
Czech Republic –
70%
◦
North America –100%
◦
South Africa –
100%
◦
We continue to enjoy vertical integration model advantages which mitigate the effects of raw materials prices volatility
◦
Global steel inventories significantly below mid-2008 levels decreasing to 2.5 months in August, a level slightly below the 5-year average
◦
EVRAZ order book (external sales) currently stands at approx. US$300 mln
representing 2.5 months’
production
EVRAZ Selling PricesUS$/t
Raw Material Prices (Domestic Markets)Raw Material Prices (Domestic Markets)US$/t
400
600
800
1,000
1,200
Jan-10 May-10 Sep-10 Jan-11 May-11 Sep-11
Source: Company data
Source: Metall
Expert
Recent Market Developments Update
Scrap, Russia, CPTScrap, USA, CPTIron ore concentrate, Russia, ExWCoking coal concentrate, Russia, FCA
Slabs, Russia, export (1)
Billets, Russia, export (1)Rebars, Russia, FCAPlate, North America, FCA
(1)
Weighted average contract prices
23
24
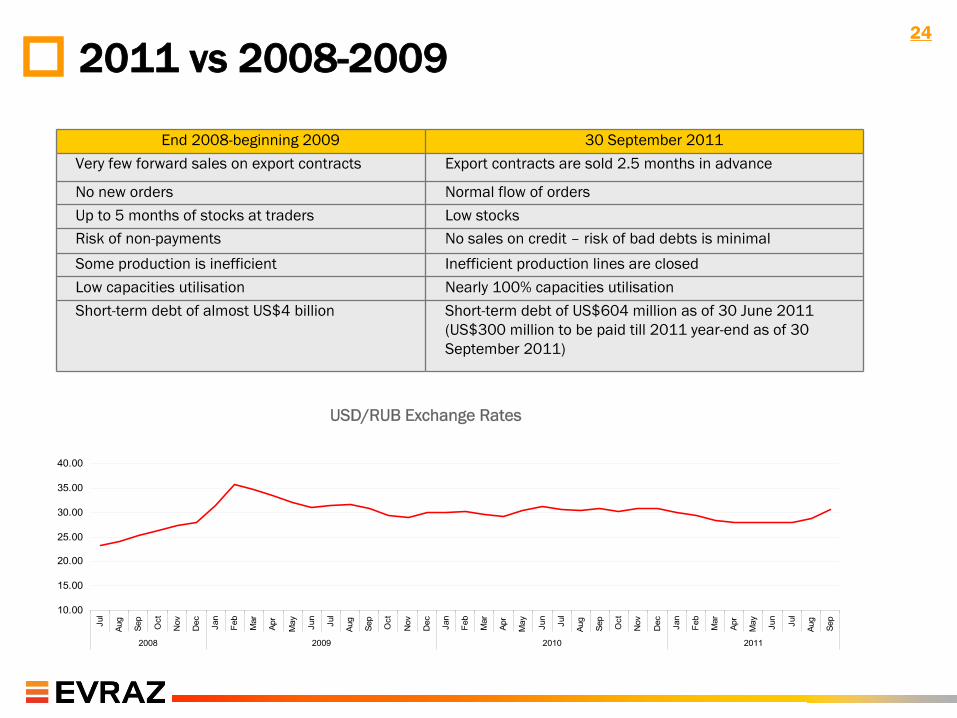
2011 vs
2008-2009
End 2008-beginning 2009 30 September 2011
Very few forward sales on export contracts Export contracts are sold 2.5 months in advance
No new orders Normal flow of orders
Up to 5 months of stocks at traders Low stocksRisk of non-payments No sales on credit –
risk of bad debts is minimal
Some production is inefficient Inefficient production lines are closed
Low capacities utilisation Nearly 100% capacities utilisation
Short-term debt of almost US$4 billion Short-term debt of US$604 million as of 30 June 2011 (US$300 million to be paid till 2011 year-end as of 30 September 2011)
10.00
15.00
20.00
25.00
30.00
35.00
40.00
Jul
Aug
Sep
Oct
Nov
Dec Jan
Feb
Mar
Apr
May Jun
Jul
Aug
Sep
Oct
Nov
Dec Jan
Feb
Mar
Apr
May Jun
Jul
Aug
Sep
Oct
Nov
Dec Jan
Feb
Mar
Apr
May Jun
Jul
Aug
Sep
2008 2009 2010 2011
USD/RUB Exchange RatesUSD/RUB Exchange Rates
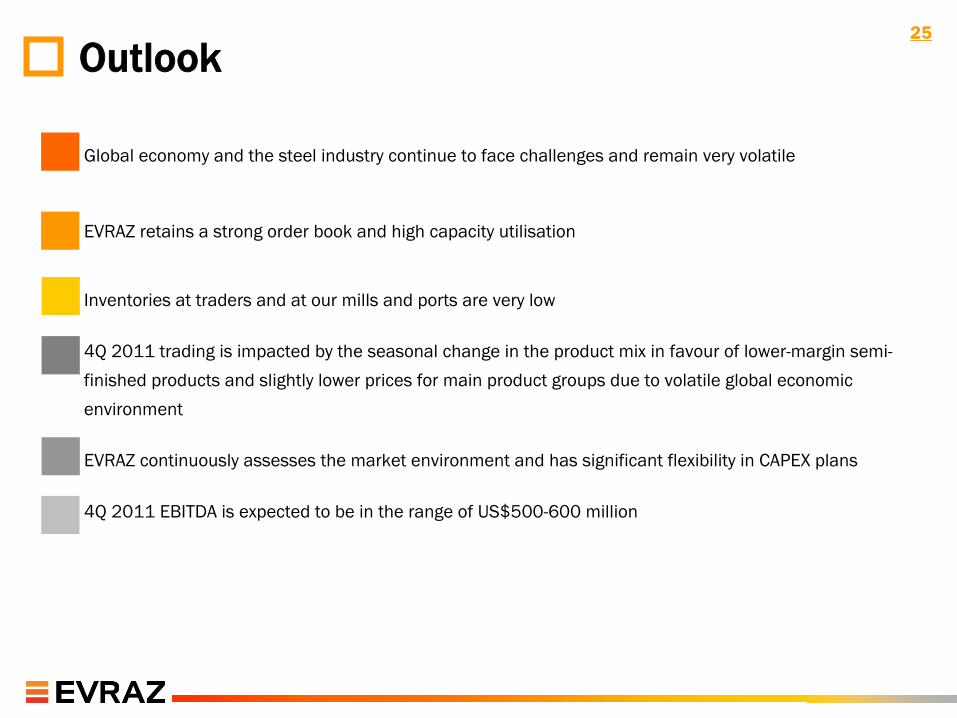
25
Outlook
Global economy and the steel industry continue to face challenges and remain very volatile
EVRAZ
retains
a strong
order
book
and
high
capacity
utilisation
Inventories at traders and at our mills and ports are very low
4Q 2011 trading is impacted by the seasonal change in the product mix in favour
of lower-margin semi-
finished products and slightly lower prices for main product groups due to volatile global economic
environment
EVRAZ continuously assesses the market environment and has significant flexibility in CAPEX plans
4Q 2011 EBITDA is expected to be in the range of US$500-600 million
26
Summary
Strong 1H 2011 results reflecting the recovery of steel and raw material markets
Obtaining benefits from enhanced raw material prices due to the Group’s high level of vertical
integration
Improved liquidity position and reduced debt level following continuous refinancing in 1H2011
Renewed investment into enhancing the mining base, production modernisation
and product quality will
enable to achieve
positive results in 2012 and beyond
No significant deterioration of the market at the moment
Company now on sound footing to achieve further growth and is well prepared to efficiently operate
even in the prolonged period of market uncertainty
Recommended