© K.Cuthbertson and D.Nitzsche
LECTURE
RISK GRADES™ : J.P Morgan
Version 1/9/2001
FINANCIAL ENGINEERING:DERIVATIVES AND RISK MANAGEMENT(J. Wiley, 2001)
K. Cuthbertson and D. Nitzsche
© K.Cuthbertson and D.Nitzsche
Data on Returns and Volatility
RiskGrades™ (J.P. Morgan)
Risk Grades for Various Portfolios
Topics

© K.Cuthbertson and D.Nitzsche
Data on Returns and Volatility

© K.Cuthbertson and D.Nitzsche
HOW RISKY ARE STOCKS?
US - STOCK RETURNS: LONG TERM (1929-54)
June 22nd, 1929 $10,000
Sept 3rd, 1929 $12,417 (+25%)
Oct 29th, 1929 $ 7,495
July 1932 $ 1,342 (-86%)
1954 $10,000

© K.Cuthbertson and D.Nitzsche
Jan 1973 $10,000
Dec 1974 $ 6,600 (-34%)
1983 $10,000
US - STOCK RETURNS: LONG TERM (1973-83)

© K.Cuthbertson and D.Nitzsche
Jan 1988 $10,000
Dec 1989 $18,342
July 1992 $ 6,708 (-33%)
Jan 2000 <$10,000
JAPAN - STOCK RETURNS: (1988-2000)

© K.Cuthbertson and D.Nitzsche
Mean S.D.
Large US stocks 1.029 5.7%
(per month) (per month)
Normality
Only 1% of the time should monthly stock return fall below
1.029 - 2.33(5.7%) = -12.25%
1929-97 = 828 months
How many returns more negative than -12.25%?
Normality = 8.3 Actual = 16 !
Never, trust the ‘normal’ !
US STOCKS: SHORT TERM (Monthly 1926-97)

© K.Cuthbertson and D.Nitzsche
RiskGrades™ (J.P. Morgan)
© K.Cuthbertson and D.Nitzsche
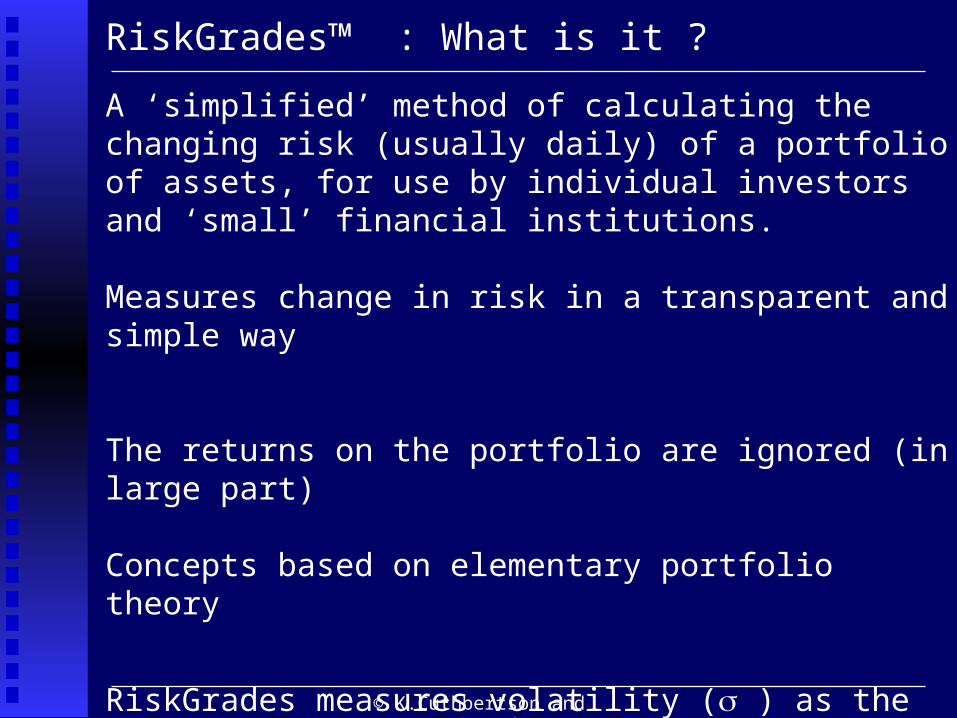
A ‘simplified’ method of calculating the changing risk (usually daily) of a portfolio of assets, for use by individual investors and ‘small’ financial institutions.
Measures change in risk in a transparent and simple way
The returns on the portfolio are ignored (in large part)
Concepts based on elementary portfolio theory
RiskGrades measures volatility ( ) as the S.D. of a portfolio of assets. is usually measured as an EWMA of past squared (daily) returns ( rt = ln(Pt/Pt-1) ) - using = 0.97 and about 150 days/values for r t
RiskGrades™ : What is it ?

© K.Cuthbertson and D.Nitzsche
1) “Portfolio Risk Grade” Risk of portfolio (relative to 20% risk of a ‘world’ benchmark)
2) Undiversified Risk Grade ~ worse case outcome
3) Diversification Benefit = (2) - (1)
4) Marginal Risk Impact = increase in risk as you add (or subtract) one or more assets from your portfolio
Statistics Used

© K.Cuthbertson and D.Nitzsche
i is the DAILY standard deviationbase is fixed at 20% per annum(=av. for international stocks)
Hence RG is just a “scaled” standard deviation
e.g. If RG = 100% then asset has 20% p.a. ‘absolute’ risk
e.g. If RG1 = 100 and RG2 = 400 then asset-2 currently has 4 times the risk of asset-1
10020.0252
100252
xixbasei
iRG
RiskGrades™ (single asset)
© K.Cuthbertson and D.Nitzsche
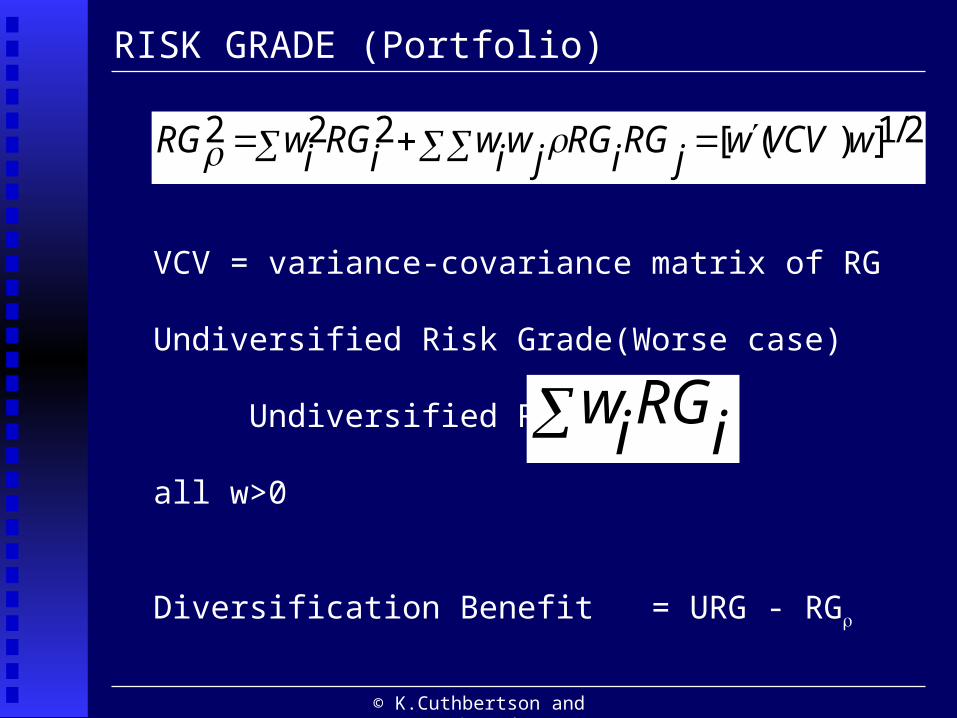
VCV = variance-covariance matrix of RG
Undiversified Risk Grade(Worse case)
Undiversified RG =
all w>0
Diversification Benefit = URG - RG
iRGiw
2/1])([222 wVCVwjRGiRGjwiwiRGiwRG
RISK GRADE (Portfolio)

© K.Cuthbertson and D.Nitzsche
$RI = RGp(n) - RGp
(n-j)
= risk grade whole portfolio – risk grade excluding one (or more) assets
Funds released are held in cash (zero risk/correlation)
%Percent Risk Impact of omitted asset – j
% RI =
Can RI ever increase as you ‘drop’ an asset ?
100)(
$ xnpRG
RI 100$ xportfoliowholeofRiskGrade
jassetofimpactRisk
$ RISK IMPACT of omitted asset (= j)
© K.Cuthbertson and D.Nitzsche
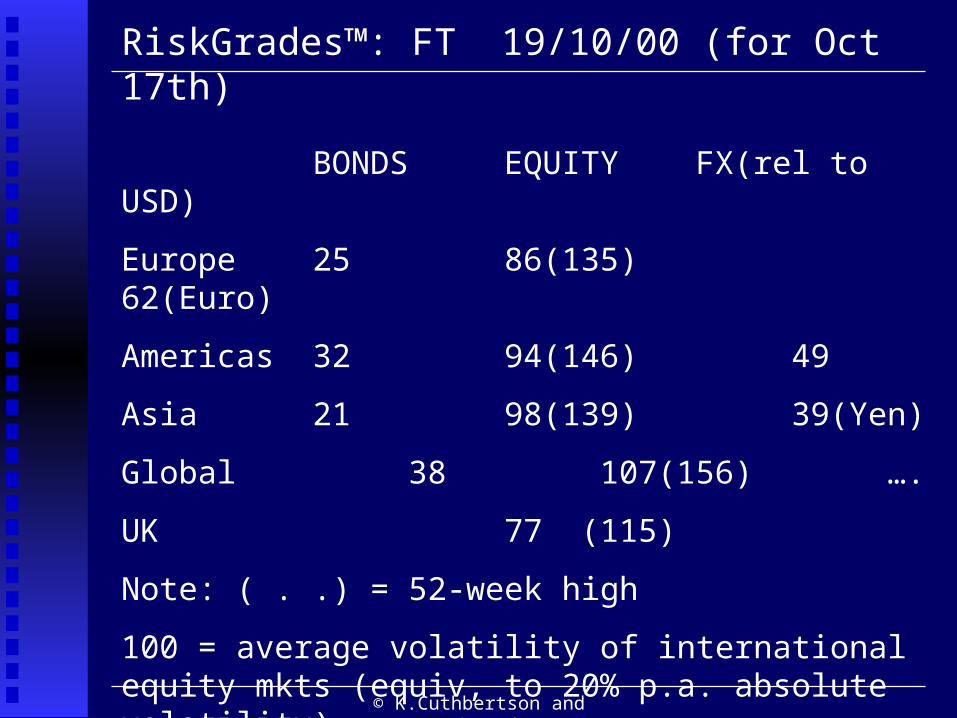
RiskGrades™: FT 19/10/00 (for Oct 17th)
BONDS EQUITY FX(rel to USD)
Europe 25 86(135) 62(Euro)
Americas 32 94(146) 49
Asia 21 98(139) 39(Yen)
Global 38 107(156) ….
UK 77 (115)
Note: ( . .) = 52-week high
100 = average volatility of international equity mkts (equiv, to 20% p.a. absolute volatility).

© K.Cuthbertson and D.Nitzsche
An Example ($10,000 in each of 2 assets)
Weights Risk Grade %R.I.
Coca-Cola ½ 188 28
Cisco ½ 179 25
Portfolio 125
Diversification 58.5
The Risk Grade for various stock indices are now published daily in the Financial Times.
Risk Measures

© K.Cuthbertson and D.Nitzsche
1) Cola’s RG is ‘9’ more than Cisco’s RG - what does this mean?
2) What is the ‘Undiversified RG’ and the ‘Diversification (RG) effect ?
Class Exercise: Interpretation of the Figures
© K.Cuthbertson and D.Nitzsche
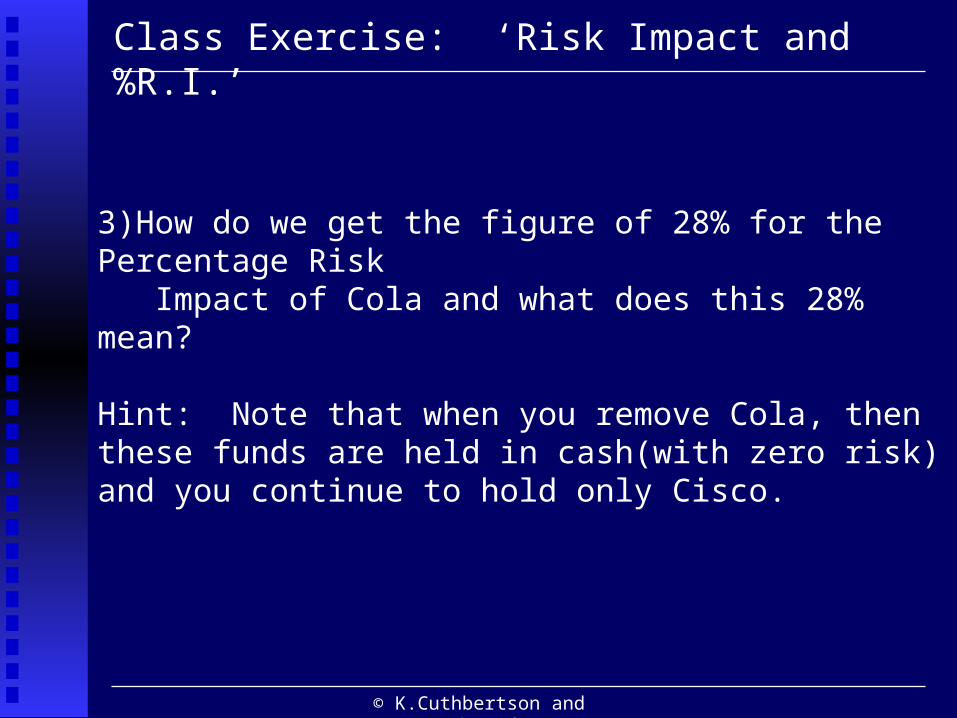
3)How do we get the figure of 28% for the Percentage Risk Impact of Cola and what does this 28% mean?
Hint: Note that when you remove Cola, then these funds are held in cash(with zero risk) and you continue to hold only Cisco.
Class Exercise: ‘Risk Impact and %R.I.’

© K.Cuthbertson and D.Nitzsche
Pt = DPV (yt C, M, n)
Use historic(daily) yt to calculate ‘simulated’ Pt .(n, C and M are ‘fixed’ by the bond you hold)
Capital gain = ln(Pt/Pt-1)
“Return” = CG + yt/252
Calculate S.D. of ‘Return’(I.e EWMA using 150 days past data)
Illustrative RG for Government Bonds (different maturities)
RG (¼, ½, 1, 10, 30yr) = 1, 2, 3, 26, 43 respectivelyWhat does RG=43 for 30 year bond mean? What is it so much larger than RG=3 for 1-yr bond?
RiskGrades for Bonds

© K.Cuthbertson and D.Nitzsche
Black-Scholes Formula
Ct = BS(St, rt, , T, Div)
Use historic values of 1st , 2 variables. Construct artificial data series for Ct (with , T, Div fixed):
“Return” = ln(Ct/Ct+1)
Calculate S.D. of Return
Are there any dangers in this method ?Can it be applied to all options ?
Risk Grade for Bonds
© K.Cuthbertson and D.Nitzsche
Risk Grades for Various Portfolios

© K.Cuthbertson and D.Nitzsche
Price/Value R. Grade R. Impact %
Cisco 107.125 179 71
Call 18.125 665 29
Div.Ben 22
Portfolio 125.25 227
What is the ‘undiversified RG’ and why is the ‘Div Benefit’ rather low at ‘22’?Intuitively, why is the RG of the call relatively high at ‘665’?(Hint: assume it’s ‘delta’ is say 0.5) - tricky!
Portfolio = 1 share Cisco +1 At-the-money call on Cisco
© K.Cuthbertson and D.Nitzsche
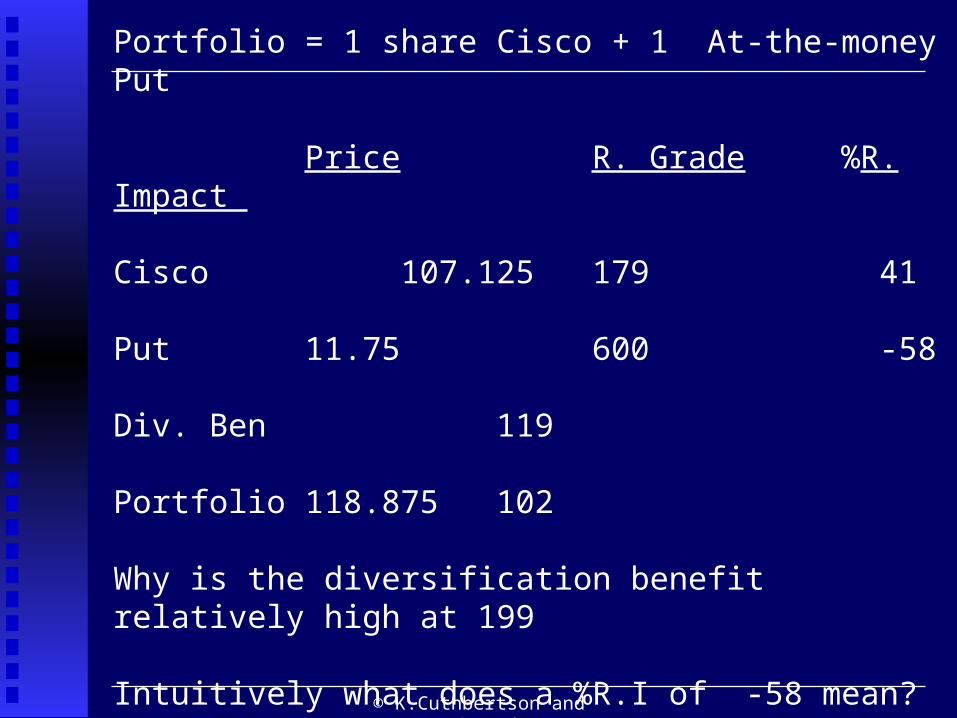
Price R. Grade %R. Impact
Cisco 107.125 179 41
Put 11.75 600 -58
Div. Ben 119
Portfolio 118.875 102
Why is the diversification benefit relatively high at 199
Intuitively what does a %R.I of -58 mean?
Portfolio = 1 share Cisco + 1 At-the-money Put

© K.Cuthbertson and D.Nitzsche
a) $10,000 in Cola - all own fundsb) $10,000 in Cola, $5000 borrowed funds(ignore interest cost)
a) $’s Risk Grade %R.I.Cola 10,000 188 100Cash 0 0 :Div. Benefit 0 : :‘Portfolio’ 10,000 188 :
b) $’s Risk Grade %R.I.Cola 10,000 188 100Cash -5,000 0 0Div. Benefit : 0 :‘Portfolio’ 5,000 376 :
Intuitively, why has RG of ‘portfolio’ increased to 376. Is there an obvious formula in this simple case?
RiskGrades with purchases ‘on margin’(=Leverage)
© K.Cuthbertson and D.Nitzsche
Intuitively, why is RG=376 relatively high?
Intuitively, why is there a ‘R.I.’ for ‘cash’ whereas there wasno such effect for purchases ‘on margin’ ?
RiskGrades with purchases financed from ‘short sales’

© K.Cuthbertson and D.Nitzsche
a) $10,000 in Cola - all own fundsb) $10,000 in Cola using $5000 funds obtained from short selling Cisco (ignore any ‘haircuts’)
a) $’s Risk Grade %R.I.Cola 10,000 188 100Cash 0 : :Div. Benefit 0 : :‘Portfolio’ 10,000 188 :
b) $’s Risk Grade %R.I.Cola 10,000 188 58Cash -5,000 179 12Div. Benefit : 127 :‘Portfolio’ 5,000 376 :
RiskGrades: purchases financed from ‘short sales’

© K.Cuthbertson and D.Nitzsche
END OF LECTURE

© K.Cuthbertson and D.Nitzsche
1) RG (Cola) – RG(Cisco) = 188-179 = 9 [i.e. Cola is 1.8%p.a. (= 9 x 20%/100) more volatile than Cisco in absolute terms].
2) Undiversified RG = (½)(188)+(½)179 = 183.5
Hence: Diversification effect = 183.5-125 = 58.5
3)Risk Impact of Cola(extreme case of only 2 assets)
%RI(Cola)=
Note that ‘179’ is Cisco’s risk grade.Note (½) in Cisco and ½ is held in cash (with zero risk).
%28)100(125
5.35100125
)2/02/179(125 x
Interpretation of Figures (see above slides)

© K.Cuthbertson and D.Nitzsche
Removing Cola from the portfolio would reduce RG by 35.5 which is equivalent to 7% of the annual S.D. (= 35.5 x 0.20)
Removing Cola from the portfolio would reduce the risk grade in percentage terms by 28% (I.e. compared with the RG of the initial 2-asset portfolio)
This 28% reduction in risk is primarily due to the fact that in the initial 2-asset portfolio you hold 2 x $10,000 in risky assets
while after removing Cola
you only hold $10,000 in risky assets (The other $10,000 is held in cash).
Interpretation of ‘Risk Impact’

© K.Cuthbertson and D.Nitzsche
END OF SLIDES
Recommended