Presentation to Fixed Income Investors
Bank Austria
Vienna, May 2016

2
Agenda
Overview Bank Austria
Profit & Loss
Liquidity & Funding
Funding Strategy & Position
Balance Sheet & Capital Ratios
Business Model & Strategy
Transactions
Annex
Cover Pool

Bank Austria – at a glance
Bank Austria Highlights as of 31 March 2016
Member of UniCredit since2005
Leading corporate bankand one of the largest retailbanks in Austria
~ 6,800 FTE and about 190branches in Austria withfurther reduction envisaged
Management1) of the leadingbanking network in CEE in13 countries
~ 28,000 FTE and about1,300 branches in full CEEsubsidiaries2)
Solid capital base (11.2%CET1 Ratio)
Stable liquidity with aperfect balance betweencustomer loans and directfunding
1) According to the “Strategic Plan of UniCredit” published on 11 Nov. 2015, CEE business to be transferred under the management of UniCredit SpA by end of 2016;2) plus a further ~ 19,000 FTE and ~ 1,000 branches in Turkey (the 41%-stake now being consolidated at equity); 3) Capital ratios based on all risks; Basel 3 (transitional) and IFRSs;end of period; 4) As of February 2016
03/16 12/15
Total Assets 197.8 193.6
Customer Loans 117.1 116.4
Direct Funding 142.6 139.1
Equity 15.7 15.4
In € bn
1Q16 1Q15
Operating income 1,369 1,387
Operating costs -755 -753
LLP -144 -210
Net profit 59 199
In € mn
RoE after tax 1.7%
Cost / income ratio 55.1%
CET1 capital ratio3) 11.2%
Total capital ratio3) 15.1%
Non-performing exposureratio
3.7%
Coverage ratio 57.5%
Cost of risk 49bp
3
S&P BBB A-2
Moody’s Baa2 P-2
Fitch BBB+ F2
Market share loans /deposits Austria4) 14.6 % / 14.3 %
Market share loans /deposits CEE4) 5.8% / 5.4%

4
Business Model and Market Position in Bank Austria‘sHome Market
Bank Austria is one of the strongest banks in Austria:
CIB = Corporate & Investment Banking
CIB
Leading corporate bank in
the country (7 of 10 large
corporates are clients)
Focus on
- Multinational corporates
- International and
institutional Real Estate
customers requiring
investment banking
solutions and capital
markets-related products
- Financial Institutions
Clients have access to the
largest banking network in
CEE as well as to UniCredit
branches in major financial
centers worldwide
Commercial Banking
The division covers
- Retail customers
- Corporate customers
- Real Estate
- Public Sector (excluding
Republic of Austria)
Broad coverage through a
network of approx. 190
branches, offering its
customers a complete
range of high-quality
products
12% market share in loans
to individual customers
Strong market position in
all corporate segments
Private Banking
26% of Austrian High Net
Worth Individuals are
customers of BA
Clients benefit from the
combination of local
understanding and
international capabilities
Tailored financial services
to High Net Worth
Individuals and foundations
Successful client
approach through BA‘s PB
Division and Schoellerbank

5
Bank Austria‘s Market Shares1) in the Domestic Customer Business(as of February 2016)
1) UniCredit Bank Austria AG2) Pioneer Investments Austria + Bank Austria real estate funds Source: Monthly Report Austrian National Bank (OeNB); VÖIG
Funds2)
Loans total
Retail Loans
Corporate Loans
Public Sector Loans
Deposits total
Retail Deposits
Corporate Deposits
Public Sector Deposits
Very efficient network structure to cover the important size of customer sharewith only 5% of all bank branches in Austria
16.5%
16.6%
22.6%
26.0%
14.3%
10.2%
14.6%
12.2%
12.5%

Austrian economic growth YoY in % Austrian inflation rate YoY in %
Economic Conditions in Austria
Source: Statistik Austria, Bank Austria Economics & Market Analysis Austria
forecast
6
Employment and unemployment rate
1.52.2
3.2
0.5
1.9
3.3
2.4
2.0
1.7
0.9
1.4
1.9
0.0
0.5
1.0
1.5
2.0
2.5
3.0
3.5
4.0
2006 2007 2008 2009 2010 2011 2012 2013 2014 2015 2016 2017
3.43.6
1.5
-3.8
1.9
2.8
0.8
0.30.4
0.9
1.5 1.5
-4.0
-3.5
-3.0
-2.5
-2.0
-1.5
-1.0
-0.5
0.0
0.5
1.0
1.5
2.0
2.5
3.0
3.5
4.0
2006 2007 2008 2009 2010 2011 2012 2013 2014 2015 2016 2017
forecast
The Austrian economy started 2016 with growth of 0.6% qoq
respectively 1.3% yoy. So, economic growth in the first quarter of
2016 exceeded the 0.9% recorded in 2015.
Domestic demand, first and foremost private consumption following
the tax reform, will keep the Austrian economy moving in the
coming quarters as well. We still anticipate economic growth of
1.5% in 2016.
The low oil prices still curb the inflationary trend in Austria, while the
economy still lacks the impetus for an improvement on the labor
market. Since the labor supply will continue to grow, we still foresee
an increase in the unemployment rate up to even 6% on average
for 2016.3000
3100
3200
3300
3400
3500
0
1
2
3
4
5
6
7
2010 2011 2012 2013 2014 2015 2016
Employment excl. persons drawing maternity benefits, militaryservice and training (1000s, SA) - RSUnemployment rate (%, SA) - LS
7
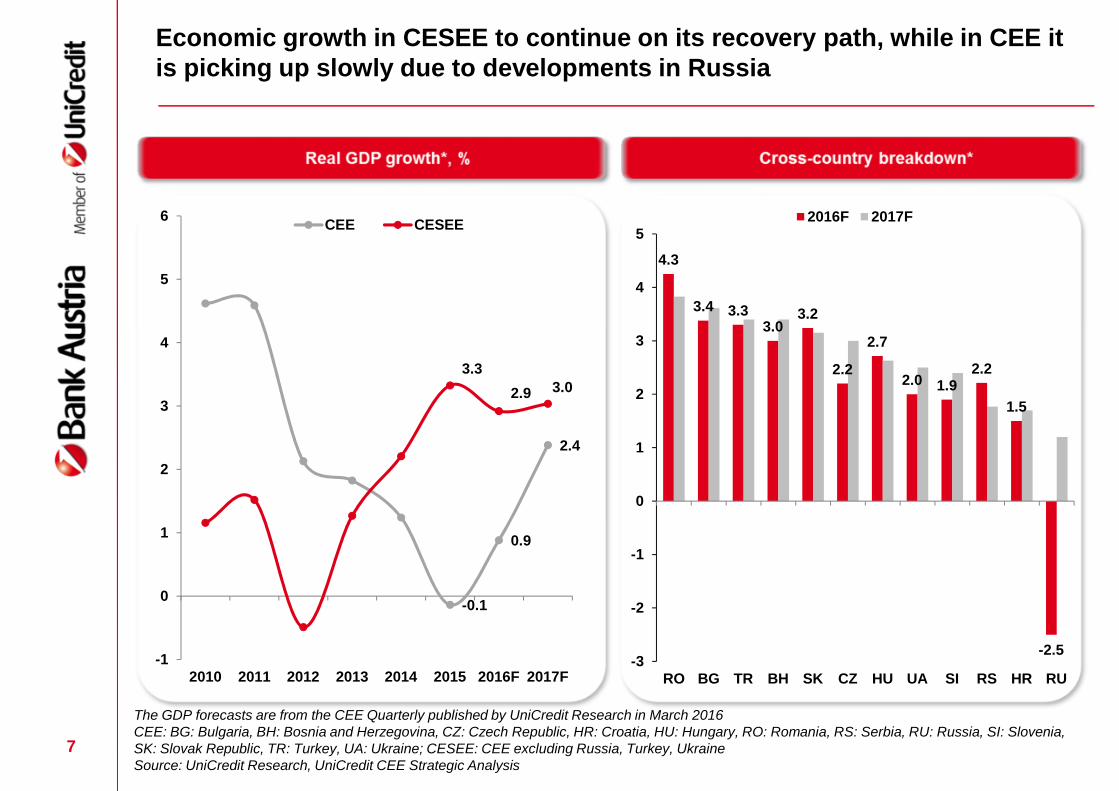
Economic growth in CESEE to continue on its recovery path, while in CEE itis picking up slowly due to developments in Russia
The GDP forecasts are from the CEE Quarterly published by UniCredit Research in March 2016CEE: BG: Bulgaria, BH: Bosnia and Herzegovina, CZ: Czech Republic, HR: Croatia, HU: Hungary, RO: Romania, RS: Serbia, RU: Russia, SI: Slovenia,SK: Slovak Republic, TR: Turkey, UA: Ukraine; CESEE: CEE excluding Russia, Turkey, UkraineSource: UniCredit Research, UniCredit CEE Strategic Analysis
-0.1
0.9
2.4
3.3
2.9 3.0
-1
0
1
2
3
4
5
6
2010 2011 2012 2013 2014 2015 2016F 2017F
CEE CESEE
4.3
3.4 3.33.0
3.2
2.2
2.7
2.0 1.92.2
1.5
-2.5-3
-2
-1
0
1
2
3
4
5
RO BG TR BH SK CZ HU UA SI RS HR RU
2016F 2017F

8
The Leading Network in Central & Eastern EuropeBroad presence of Bank Austria in CEE Region
The leading player in CEE: # 1 by assets, branches and net profit
~ € 61 bn Direct funding *)
~ 1,300 branches**) and ~ 28,000 FTE **)
Within top 5 in 10 Countries
*) excl. Turkey (consolidated at equity), Ukraine (held for sale)
**) excl. ~1,000 branches and ~19,000 FTE of Turkish Joint Venture
RankingMarket
Share
Total
Assets
(€ mn)
Customer
Loans
(€ mn)
Primary
Funds
(€ mn)
Branches
Russia 9 2% 19,401 10,689 14,281 102
Czech Republic 4 10% 23,142 13,601 16,166 184
Slovakia 5 8% - - - -
Croatia 1 27% 14,190 9,485 9,880 134
Bulgaria 1 20% 9,633 5,219 6,832 184
Romania 5 8% 7,548 4,957 4,112 183
Hungary 2 8% 7,593 3,444 4,427 56
Ukraine ("held for sale") 7 3% - - - 239
Slovenia 4 7% 2,735 1,800 1,908 28
Bosnia & Herzegovina 1 24% 2,926 1,840 2,097 118
Serbia 3 10% 2,569 1,566 1,284 71
CEE Division (excl. Turkey) 95,696 58,045 61,089 1,301
at equity consolidated
Turkey 5 10% 30,119 20,963 19,362 1,038
CEE Division (incl. Turkey) 125,815 79,008 80,451 2,339
Rep. Offices: Macedonia, Montenegro, Belarus (Representative Office of UniCredit Russia)
Note: Data as of 31 March 2016, ranking and market share as of Dec 2015 (except Czechia, Slovenia - as of Sep 2015)
Since 1 Dec. 2013, foreign branch of UniCredit Bank Czech Republic and Slovakia
Due to "held for sale" status, data related to Ukraine is included only in the calculation for number
of branches.
Turkey consolidated at equity as from 2014
1)
3)
2)
2)
3)
2)
1)
2)

9
Turkey and Ukraine shown separately as
Yapi Kredi (Turkish Joint-Venture) consolidated at equity since 2014
Ukrsotsbank (Ukraine) reclassified to “Held for Sale”
CEE Division1) – incl. Details on Turkey and Ukraine(as of 31 March 2016)
1) excl. Poland (under direct management of UniCredit)2) Primary funds (= Direct Funding) = Deposits from Customers + Debt Securities in Issue
11.8% 5.8%
10.1% 5.4%
Market Share CEE Division – Customer Loans
Market Share CEE Division – Customer Deposits
Excl. Russia Incl. Russia
Excl. Russia Incl. Russia
(€ mn)
Loans to Customers 58,045 20,963 1,277
Primary Funds2) 61,089 19,362 835
CEE(excl. TR, UA)
Turkey(at 40.9%)
Ukraine

Branch concept with extended opening hours
(9 a.m. to 6 p.m.), advanced design and new
service model
Advisory services intensified
Services provided by a team and highly
specialised experts via video conference
Online branch with more than 100 employees
for SmartBanking (extended opening hours from
8 a.m. to 8 p.m.) delivers a bank branch to
every customer’s home and smartphone
About 1,000 advisory talks via video
telephony per month
State-of-the-art online shop which delivers all
relevant products on a 24/7 basis
SmartBankingTransformation based on new business model is making rapid progress
10

11
Rating Overview
1) Subordinated (Lower Tier II)2) Securities issued before 31 Dec. 2001 which benefit from a secondary liability by the City of Vienna (grandfathered debt) are also rated as shown
above by Standard & Poor´s, while by Moody´s the corresponding senior securities are rated A3 and the subordinated ones are rated Baa3
1) 1) 1)
2)
(as of 11 May 2016)
Long-Term Short-Term Subordinated Long-Term Short-Term Subordinated Long-Term Short-Term Subordinated
Baa2 P-2 Ba2 BBB A-2 BB+ BBB+ F2 -
Stable Negative Negative
Baa1 P-2 Ba1 BBB- A-3 BB BBB+ F2 BBB
Stable Stable Negative
Public Sector
Covered Bond
Mortgage Covered
BondAaa - -
Aaa - -
UniCredit S.p.A.
Moody's S&P Fitch
Bank Austria

12
Agenda
Overview Bank Austria
Profit & Loss
Liquidity & Funding
Funding Strategy & Position
Balance Sheet & Capital Ratios
Business Model & Strategy
Transactions
Annex
Cover Pool

P&L of Bank Austria – 1Q16Sound operating performance due to improvements in LLPs, net profitimpacted by restructuring costs and higher systemic charges
Note: Non-operating items include provisions for risks and charges, systemic charges, profit from investments and integration costs
13
Operating income down -1% y/y, mainly due to lower trading income (impacted by Credit Value Adjustments/CVA)
Costs flat vs. 1Q15, improvement especially in payroll costs, following strict cost management
Net write-downs of loans significantly below y/y, with very favorable development in Austria and improvements in CEE
Non-operating items include mainly systemic charges (€ -172 mn - o/w Austria € -86 mn, CEE € -86 mn – and up by € -66 mn y/y)
and restructuring costs (€ -206 mn: driven by an amendment to the Austrian social security law, leading to a higher provisioning need
relating to the transfer of pension obligations to the state system)
Other positions include the income tax of € -58 mn, mainly relating to CEE
Group net profit at € 59 mn down y/y impacted by restructuring costs and higher systemic charges
1-3/ 1-3/(€ mn) 2016 2015
Operating Income 1,369 1,387 -1.3% 1,369 1,568 1,387 -12.7% -1.3%
Operating Costs -755 -753 0.2% -755 -798 -753 -5.4% 0.2%
Operating Profit 615 634 -3.0% 615 771 634 -20.2% -3.0%
Net Write-Downs of Loans -144 -210 -31.4% -144 -251 -210 -42.7% -31.4%
Net Operating Profit 471 424 11.0% 471 520 424 -9.4% 11.0%
Non-Operating Items -354 -112 >100.0% -354 110 -112 >-100.0% >100.0%
Profit Before Tax 117 313 -62.5% 117 630 313 -81.4% -62.5%
P/L discontinued operations 12 -60 >-100.0% 12 -145 -60 >-100.0% >-100.0%
Other positions -71 -54 30.9% -71 175 -54 >-100.0% 30.9%
Group Net Profit 59 199 -70.5% 59 659 199 -91.1% -70.5%
Cost / Income Ratio (in %) 55.1% 54.3% 80 bp 55.1% 50.9% 54.3% 423 bp 80 bp
y/y 1Q16 4Q15 1Q15 q/q y/y

14
Net Operating Profit Composition(€ mn)
-753 -798 -755
-210-251
-144
1Q16
471
1,369
4Q15
520
1,568
1Q15
424
1,387
Net Operating Profit1Q16 higher y/y due to improvements in LLP
LLP
Costs
Operating income
1,369
1-3/2015
424
-210
-753
1,387
+11%
1-3/2016
471
-144
-755
CEE
Austria
23%
77%
*) without Corporate Center Austria and CEE Subholding Functions
Share of Divisions *) –Net Operating Profit by region (%)
NOP up y/y (+11%)
Reduction of revenues y/y due to lower net trading
income both in Austria and CEE (partly due to negative
CVA and FVA impact in 1Q16)
Costs flat y/y – in Austria lower payroll costs, offset by
a one-off increase in other administrative costs
LLP lower y/y, with very favorable development in
Austria and overall improvement in CEE

15
Cost of Risk (in basis points)Net Write-Downs of Loans (in mn €)
175266
140
1Q16
144
4
4Q15
251
-15
1Q15
210
34
175
-19
6
86
49
97
0
6
CEE
CIB
CommercialBanking
BA Group
1-3/2016FY15
Loan Loss Provisions and Cost of RiskGeneral favorable development in LLPs and Cost of Risk
-31%
1-3/2016
144
4
140
1-3/2015
210
34
175
AustriaCEE
LLPs (-31%) and Cost of risk (BA Group at 49 bps vs. FY15 with 86 bps) lower y/y due to:
Continuing favourable development in Austria in Retail & Corporates, as well as in CIB.
Overall improvement by € -31 mn vs. 1Q15 (with Cost of Risk in Austria at only 2 bps)
CEE: Overall improvement y/y of LLPs (€ -35 mn)

16
Net NPE 1)
(in bn €)% of Net NPE
on Total Net Loans 1)
% Coverage Ratio onNPE 1)
1) on-balance clients (non-banks) only
Asset QualityAsset Quality Ratios improving further in 1Q16
In 1Q16 a further
reduction of Gross Non
Performing Exposure in
Austria as well as in most
CEE countries (except
Russia) led to a decrease
of Net Non Performing
Exposure (Austria: € -85
mn, CEE: € -137 mn)
causing shrinking NPE
Ratios and improving
Coverage Ratios in
Austria and CEE
In CEE, and in particular in
Russia a remarkable
improvement of the
Coverage Ratio was
achieved (CEE 54.6%,
Russia 54.8%)
High quality of loan
portfolio in Austria
5.2
1Q16
4.3
1Q15
4.5
4Q15
-16%
1Q15
4.4%
-70bp
1Q16
3.9%
4Q15
3.7%56.3%
1Q15
54.7%
+279bp
4Q15
57.5%
1Q16
-14%
1Q164Q15
1.11.2
1Q15
1.3
-31bp
1Q15
2.2%
1Q16
1.8%2.0%
4Q15
-1bp
4Q15
62.8%
1Q16
64.1%
1Q15
64.2%
-17%
1Q16
3.2
4Q15
3.4
1Q15
3.95.9%
-108bp
5.6%
1Q164Q15
6.6%
1Q15
53.4%
1Q15
+423bp
1Q16
54.6%
4Q15
50.4%
BA Group
Austria
BA GroupBA Group
AustriaAustria
CEE CEECEE

CEE Division increases profit before tax by 12% (at constant rates)Strong start of the year in most countries
Profit before tax up by 12%
y/y (at constant rates) due toincrease in revenues in 1Q16and lower level of provisions inmost of the countries vs.
previous year
Stable development throughgood regional diversification
Russia: profitability negativelyimpacted by increase in loan
loss provisions in a currentlydifficult environment
Turkey resilient due to
significant business growth
In South East Europe strongoperating performance esp. in
Serbia, Romania and Bulgaria,but Croatia down y/y due tonegative trading result (CVA)
Strong development in CentralEurope, with exceptionalperformance in Hungary(higher revenues, lower bank
levy) and solid 1Q16 in CZ/SK(however lower vs. anexceptional 1Q15)
Cost/income ratio of CEEDivision at excellent 39.5%
Romania 23
Serbia 20
Bosnia 14
CE 112
CZ/SK 62
Hungary 45
Slovenia 4
Croatia 37
Bulgaria 52
SEE 147
Turkey 72
Russia 55
CEE 343
17
1)
5%
8%
12%
-19%
23%
-10%
10%
25%
10%
-20%
142%
-15%
-42%
1)
Profit before tax 1-3 2016in EUR mn - change y/y in % (at constant exchange rates)
1) Turkey consolidated at equity, therefore incl. in CEE total with net profit of € 72 mn. The proportionate profit before taxamounts to € 93 mn.

18
Agenda
Overview Bank Austria
Profit & Loss
Liquidity & Funding
Funding Strategy & Position
Balance Sheet & Capital Ratios
Business Model & Strategy
Transactions
Annex
Cover Pool

Other Assets
OtherFinancial Assets
Loans andreceivableswith customers
Loansand receivableswith banks
Assets
197,827 (100%)
10,790 (5%)
36,105 (18%)
117,064 (59%)
33,868 (17%)
Equity
Other Liabilities
Debt securitiesin issue
Deposits fromcustomers
Deposits frombanks
Liabilities
197,827 (100%)
15,655 (8%)
16,677 (8%)
28,307 (14%)
113,822 (58%)
23,366 (12%)
Balance Sheet structure (as of 31 March 2016)
Balance Sheet (€ mn) Change vs. 31 December 2015
+2.2%
03/16
198
12/15
194
Balance sheet Loans to customers
+0.6%
03/16
117
12/15
116
Deposits fromcustomers
Securitiesin issue
+3.1%
03/16
114
12/15
110
-1.7%
03/16
28
12/15
29
(€ bn)
+1.7%
03/16
16
12/15
15
4bp
03/16
5.8%
12/15
5.8%
Shareholders’equity
Leverage ratio Balance sheet development + 2% q/q, driven in particular by
higher deposit volumes
Solid equity base of € 15.7 bn (up vs. YE15 by + 2%)
Leverage Ratio at strong 5.8%
19
1) Ukrsotsbank in “held for sale” (Other Assets/Other Liabilities)
1)
1)

20
Loans to Customers1) (€ mn)
58,163
0%
1Q16
117,064
59,019
58,045
4Q15
116,402
59,050
57,353
3Q15
116,530
58,438
58,092
2Q15
117,233
58,164
59,069
1Q15
117,505
59,342
+1%
Loan and Deposit VolumesStrong increase in deposits y/y, very good Loans/Direct Funding Ratio
2Q15
107,965
55,158
52,807
1Q15
106,118
54,344
51,773
56,458
54,571
3Q15
111,030
54,557
55,780
+3%7%
1Q16
113,822
55,470
58,352
4Q15
110,337
Deposits from Customers1) (€ mn)
Austria
CEE
82%83%83%85%86%
Loans/Direct Funding Ratio2)
1) All figures recast and excl. Turkey and Ukraine; 2) Loans / (deposits + securities in issue + financial liabilities at fair value)
Loans to customers q/q stable in Austria and slightly up in CEE (strong performance in CZ/SK). Y/y, improvement in
Austria (in particular CIB and Corporates); growth in CEE overcompensated by Ruble depreciation
Deposits from customers +3% q/q, overall positive trend in both Austria (in particular Corporates and PB) and CEE
(almost all countries). Strong growth of 7% y/y, driven both by Austria and all CEE countries
Overall excellent funding base, Loans/Direct Funding Ratio at very good 82%
Austria
CEE

21
Customers loans / Direct Funding (€ bn) 1)
Volumes in CEEGood business development, impact from currency movements
Loans/Direct Funding: Within CEE, ratio significantly improved y/y
to 95%
Regional Breakdown: well-balanced distribution of volumes, with
Russia, Czechia/Slovakia and Croatia as largest banks. In a
proportionate view, equity-consolidated Turkey would be the largest
CEE bank (loans 21 bn, direct funding 19 bn)
Direct funding (€ bn) – March ‘16 1)
Customer loans (€ bn) – March ‘16
Regional Breakdown
1) Deposits + securities in issue + financial liabilities at fair value
1Q16
61.158.0
4Q15
58.757.4
1Q15
54.659.3
Direct FundingCustomer loans
Romania 5
Croatia 9
Bulgaria 5
Hungary 3
CZ/SK 14
Russia 11
o/w
CEE 58
Romania 4
Croatia 10
Bulgaria 7
Hungary 4
CZ/SK 16
Russia 14
o/w
CEE 61
Regional Breakdown
95%98%109%
Loans/Direct Funding Ratio CEE
Operational risk
CVA charge
Market risk
1Q16 B3
128.9
113.3
10.5
0.44.7
2015
128.3
113.2
10.7
4.0
2014
130.4
113.0
12.1
4.6
Credit risk
0.60.4
Risk-Weighted Assets (€ bn)
10.3% 11.0% 11.2%CET1
Tier 1
1Q16B3 phase-in
15.1%
11.2%
2015
14.9%
11.0%
2014
13.4%
10.3%
Capital Ratios
CET1
Additional
Tier 1
1Q16B3 phase-in
19.5
14.4
0.0
2015
19.1
14.2
0.0
2014
17.5
13.5
0.0
Regulatory Capital (€ bn)
Total CAR
Total Capital Total RWA
1) Starting with 2014, figures in accordance with Basel 3/CRR and since 3Q14 based on IFRS; transitional adjustments (phase-in) only relevant for capital, not for RWA
1)1)
1)
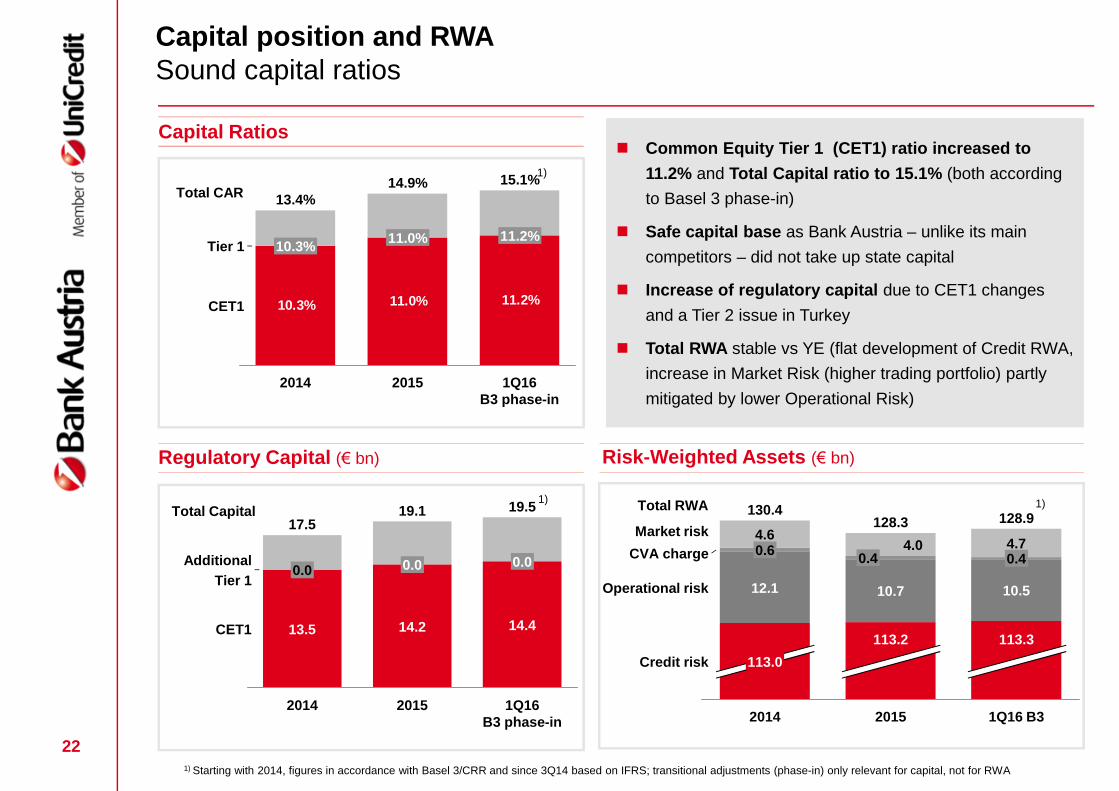
Capital position and RWASound capital ratios
22
Common Equity Tier 1 (CET1) ratio increased to
11.2% and Total Capital ratio to 15.1% (both according
to Basel 3 phase-in)
Safe capital base as Bank Austria – unlike its main
competitors – did not take up state capital
Increase of regulatory capital due to CET1 changes
and a Tier 2 issue in Turkey
Total RWA stable vs YE (flat development of Credit RWA,
increase in Market Risk (higher trading portfolio) partly
mitigated by lower Operational Risk)

23
Agenda
Overview Bank Austria
Profit & Loss
Liquidity & Funding
Funding Strategy & Position
Balance Sheet & Capital Ratios
Business Model & Strategy
Transactions
Annex
Cover Pool

24
Bank Austria Acts as Regional Liquidity Center for Austria / CEEand is a Strategic Issuing Platform for UniCredit Group
UniCredit S.p.A. – Holding
Bank capital
OBG (coveredbonds)
Registered sec./Schuldschein-darlehen (SSD)
Senior benchmark
Private placement
Retail issues
Mortgage- andPublic SectorPfandbriefe
Senior benchmark
Registered sec.(SSD, NSV*))covered / senior
Private placements
Retail Issues
Certificates
Mortgage- and PublicSector Pfandbriefe
Senior benchmark
Housing-bank-bonds(Wohnbaubank-anleihen)
Registered sec. (SSD,NSV*)) covered/senior
Private placements
Retail issues
UniCredit S.p.A
(Baa1/BBB-/BBB+)
RLC Germany RLC Poland
Retail issues
Bearer bonds
Own Issue Programs
Presence on the local and global markets
During the liquidity crisis no state aid needed
Coordination of the global market presence through UniCredit Holding
RLC Austria/CEE
Long-Term Ratings by (Moody’s/S&P/Fitch) as of 11 May 2016 *) Namensschuldverschreibungen
RLC Italy
UniCredit Bank AG
(Baa1/BBB/A-)
Bank Pekao SA
(A2/BBB+/A-)
UniCredit Bank
Austria AG
(Baa2/BBB/BBB+)

25
Self-funding of Business Growth of Bank Austria Group
Business Growth of BA Group to be self-funded by a well-balanced mix of customer deposits
and market issuances
Well-diversified funding base due to BA’s commercial banking model. Priority is on growth of local funding
sources out of customer business with a variety of products (sight, savings, term deposits) as well as medium- and
long-term placements of own issues
The self-funding strategy of Bank Austria was demonstrated by returning to the capital markets: from 2010 focus
was given to issuance of benchmark-sized Pfandbriefe and since 2013 also on Senior Unsecured Benchmarks
The strict principle of self-sufficient funding of Bank Austria
• ensures that the proceeds are used primarily for business development of entities of Bank Austria Group
• enables Bank Austria to calculate its own funding costs according to its own risk profile
Same Principles apply for the CEE banks of BA Group
Also in CEE the business model as commercial bank with its priority on growth of local funding sources from
customer business leads to a well-diversified funding base
Self-sufficiency target is applied in CEE as a business principle of UniCredit Group and is also strongly favored
by regulators, e.g. introduction of ”Loans to Local Stable Funding Ratio - LLSFR” by Austrian National Bank (OeNB)
Through its know-how and international business relationships BA actively supports the development of
local capital markets, especially in local currency, e.g. local Covered Bond issuance in Czech Republic, first SME
Covered Bond in Turkey and Senior Unsecured issues in Russia, Turkey and Romania

26
Liquidity and Funding Management within BA Group based onclear and strict Risk Management Principles
Clear Rules and Principles in Bank Austria for the Management of Liquidity and Funding
Liquidity strategy
Bank Austria acting as an independent Regional Liquidity Center (RLC) within UniCredit Group - in line with the
self-funding principle of the new Group Strategy
Bank Austria manages the liquidity development in Austria and CEE
Clear operative rules
Active liquidity and funding management by defining short-term and structural liquidity and funding limits for all
banking subsidiaries of BA Group
In addition to the Austrian regulator’s principles, BA strictly monitors the balanced intra-group funding flows
within BA Group
All international and national legal / regulatory constraints have to be followed on single bank level
Bank Austria establishes a separate Funding and Liquidity Plan for Austria and its CEE subsidiaries as part of
the Funding and Liquidity Plan of UniCredit Group

27(1) Sum of net liquidity inflow + counterbalancing capacity
BA RLC 3 month available liquidity position (1) (2)
Structural liquidity ratio (1Y)
(3) Calculated as ratio between liabilities (cumulative sum above one year) and assets (cumulative sum above one year)
(2) Assuming no roll-over of current outstanding wholesale debt
BA Group-wide Liquidity Position (steered centrally by ALM BA)
0
10,000
20,000
30,000
40,000
50,000
60,000
70,0003
1/1
2/1
0
31
/03
/11
30
/06
/11
30
/09
/11
31
/12
/11
31
/03
/12
30
/06
/12
30
/09
/12
31
/12
/12
31
/03
/13
30
/06
/13
30
/09
/13
31
/12
/13
31
/03
/14
30
/06
/14
30
/09
/14
31
/12
/14
31
/03
/15
30
/06
/15
30
/09
/15
31
/12
/15
31
/03
/16
0.880.890.900.910.920.930.940.950.960.970.980.991.001.011.021.031.041.051.061.071.081.091.101.11
Oct
-10
De
c-10
Feb
-11
Ap
r-1
1
Jun
-11
Au
g-1
1
Oct
-11
De
c-11
Feb
-12
Ap
r-1
2
Jun
-12
Au
g-1
2
Oct
-12
De
c-12
Feb
-13
Ap
r-1
3
Jun
-13
Au
g-1
3
Oct
-13
De
c-13
Feb
-14
Ap
r-1
4
Jun
-14
Au
g-1
4
Oct
-14
De
c-14
Feb
-15
Ap
r-1
5
Jun
-15
Au
g-1
5
Oct
-15
De
c-15
Feb
-16
Ap
r-1
6
1Y Liquidity Ratio 1Y Limit
Positive primary GAP
Cash horizon constantly above 3M, above the
Group target
Sound counterbalancing capacity (approx. € 34bn
on 3m bucket), increased by € 4.0 bn year on year
Liquidity Coverage Ratio as of 30th March 2016
was still at safe level of 132% for BA AG and 190% for
BA Group.
Structural liquidity ratio3) well above limits.
Internal rule of 0.90 for maturities above 1y
Level as of April 2016: 1.06
Structural Liquidity remains at comfortable levels
despite lower FP execution due to DeLorean.
Ratio level points to 100% NSFR fulfillment.
Further improvement of L/D Ratio in 1Q16.
28
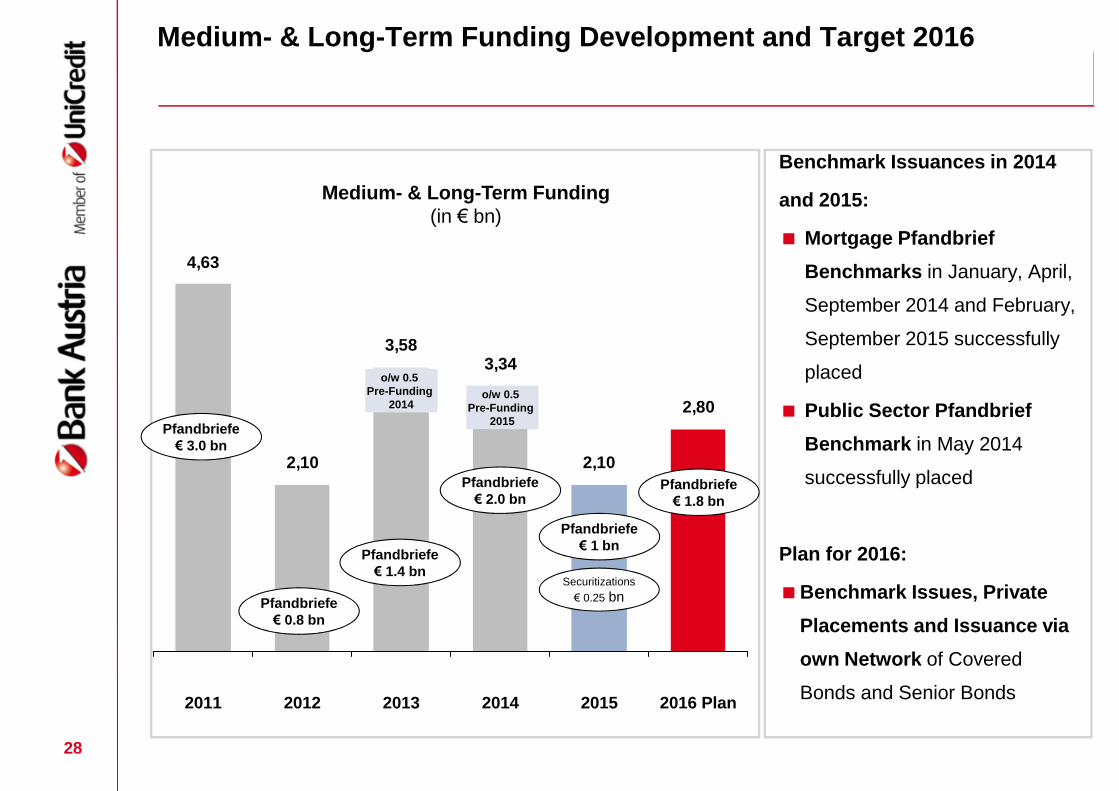
Medium- & Long-Term Funding Development and Target 2016
Medium- & Long-Term Funding(in € bn)
4,63
2,10
3,583,34
2,10
2,80
2015 2016 Plan
o/w 0.5Pre-Funding
2015
2014
o/w 0.5Pre-Funding
2014
201320122011
Pfandbriefe€ 3.0 bn
Pfandbriefe€ 0.8 bn
Pfandbriefe€ 1 bn
Pfandbriefe€ 1.4 bn
Pfandbriefe€ 2.0 bn
Pfandbriefe€ 1.8 bn
Securitizations
€ 0.25 bn
Benchmark Issuances in 2014
and 2015:
Mortgage Pfandbrief
Benchmarks in January, April,
September 2014 and February,
September 2015 successfully
placed
Public Sector Pfandbrief
Benchmark in May 2014
successfully placed
Plan for 2016:
Benchmark Issues, Private
Placements and Issuance via
own Network of Covered
Bonds and Senior Bonds
29
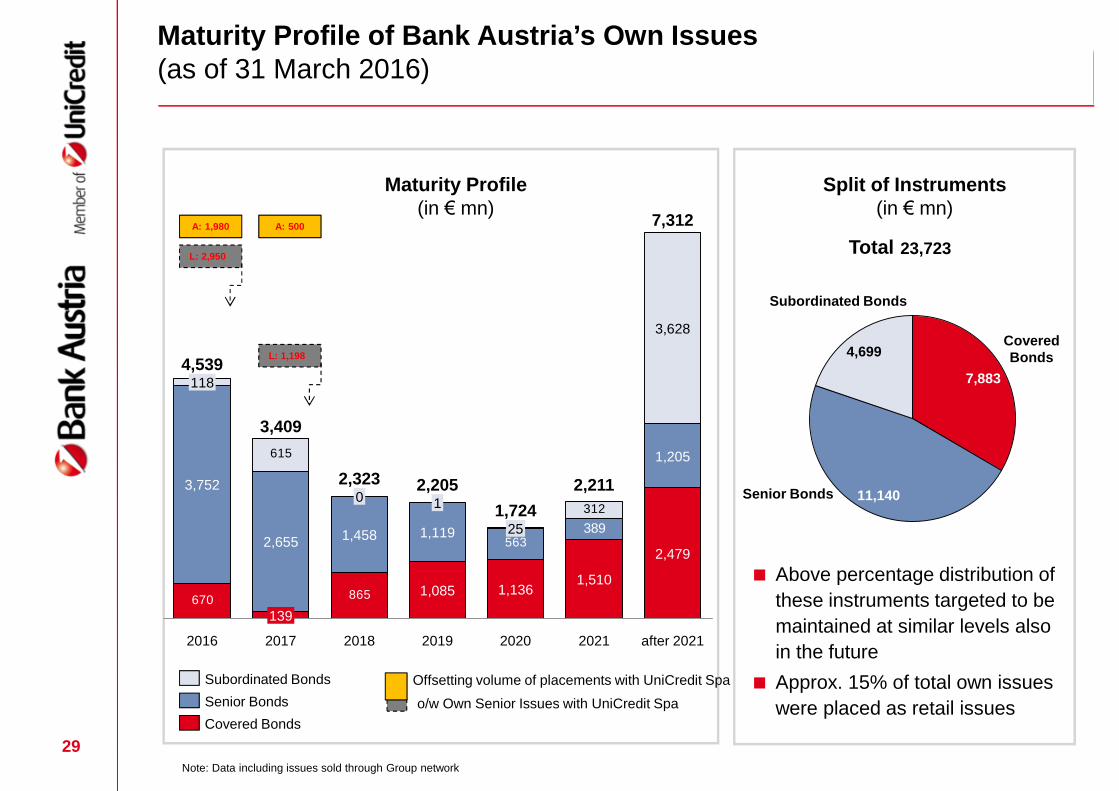
Maturity Profile(in € mn)
Split of Instruments(in € mn)
4,699
11,140
7,883
Subordinated Bonds
Senior Bonds
CoveredBonds
Maturity Profile of Bank Austria’s Own Issues(as of 31 March 2016)
Note: Data including issues sold through Group network
Above percentage distribution of
these instruments targeted to be
maintained at similar levels also
in the future
Approx. 15% of total own issues
were placed as retail issues
865670
389563
312
615
7,312
2,479
1,205
3,628
2021
2,211
1,510
2020
1,724
1,136
25
2019
2,205
1,085
1,119
1
2018
2,323
1,458
0
2017
3,409
139
2,655
2016
4,539
3,752
118
after 2021
Covered Bonds
Senior Bonds
Subordinated Bonds
23,723TotalL: 2,950
L: 1,198
A: 1,980 A: 500
Offsetting volume of placements with UniCredit Spa
o/w Own Senior Issues with UniCredit Spa

30
Agenda
Overview Bank Austria
Profit & Loss
Liquidity & Funding
Funding Strategy & Position
Balance Sheet & Capital Ratios
Business Model & Strategy
Transactions
Annex
Cover Pool

31
Overview of Pfandbrief Benchmark Issues 2015
In February, successful issue of a 10-year Mortgage Pfandbrief Benchmark
Insurance companies
Central Banks/Official Institutions
4%
Funds
18%
Banks
30%
48%
OthersSwitzerland
UK
France
Asia
Austria
6%Germany
25%
52%
Bank AustriaMortgage Pfandbrief
0.75% 25/02/2025 € 500 mn Feb. 2015 MS + 3bps
3%
5%
3% 6%
1%
27%
32%
40%
Insurance companies
Funds
Central Banks
Banks
In September, successful issue of a 7-year Mortgage Pfandbrief Benchmark
Bank AustriaMortgage Pfandbrief
0.75% 08/09/2022 € 500 mn Sept 2015 MS + 5bps
BeNeLux 7%
2%Iberia / Italy 4%
3%
UK / Ireland FranceOther
5%CH / Lichtenstein
4%
Austria
35%
Germany36%
Nordic Region4%

32
Overview of Pfandbrief Benchmark Issues 2014 1/2
In January, successful issue of a 10-year Mortgage Pfandbrief Benchmark
9%
6%
30%55%
Insurance companies
Central Banks
Funds
Banks
In April, successful issue of a long 5-year Mortgage Pfandbrief Benchmark
Insurance companies
Central Banks5%
Funds
12%
Banks
31%
52%
2%
Others
2%
Switzerland
3%
Italy
6%UK
France
Asia
9%
Austria
10%
Germany
21%
47%
Bank AustriaMortgage Pfandbrief
2.375% 22/01/2024 € 500 mn Jan. 2014 MS + 35bps
Bank AustriaMortgage Pfandbrief
1.25% 14/10/2019 € 500 mn April 2014 MS + 23bps
Benelux 11%
3%Italy 2%
2%
SpainAsiaSwitzerland
10%Nordics
6%
Austria
12%
Germany54%

In May, successful issue of a 7-year Public Sector Pfandbrief Benchmark
Corporates
37%
Funds46%
3%
Insurance companies
4%
Central Banks 10%
Banks
UK
1%3%
Nordics/Benelux
3%
Others
3%
Italy
2%
France
Germany
71%
4%
Austria 10%
Switzerland
3%Asia
Bank AustriaPublic SectorPfandbrief
1.375% 26/05/2021 € 500 mn May 2014 MS + 25bps
In September, successful issue of long 5-year Mortgage Pfandbrief Benchmark
Banks62%
Insurance companies6%
Central Banks
4%
Funds 28%
UK/Ireland
7%Benelux
7%
6%Italy
4%
Nordics
Switzerland
3%Middle East
4%
Austria
France
2%
7%
Germany
56%
Others
4%
Bank AustriaMortgage Pfandbrief
0.5% 16/01/2020 € 500 mn Sept. 2014 MS + 7bps
33
Overview of Pfandbrief Benchmark Issues 2014 2/2

34
Overview of Pfandbrief Benchmark Issues prior to 2014
Bank AustriaPublic Sector Pfandbrief
2.375% € 750 mn June 2010 Mid-Swap +45
24/02/2021 € 1 bn Feb. 2011 Mid-Swap +69
04/11/2016 € 500 mn Nov 2011
15/06/2015
4.125%
2.875% Mid-Swap +85
2.625% 25/04/2019 € 500 mn Apr 2012 Mid-Swap +88
Bank AustriaPublic Sector Pfandbrief
Bank AustriaPublic Sector Pfandbrief
Bank AustriaPublic Sector Pfandbrief
Bank AustriaMortgage Pfandbrief
1.25% € 500 mn July 2013 Mid-Swap +2630/07/2018
Bank AustriaMortgage Pfandbrief /First Tap
1.25% €200 mn Sept. 2013 Mid-Swap +1030/07/2018
Bank AustriaPublic Sector Pfandbrief
1.875% € 500 mn Oct 2013 Mid-Swap +2529/10/2020

Stable performance of all BA Covered Benchmark Bonds issued so far
35
Bank Austria Covered Bond Spread Comparison
Source: Bloomberg Mid ASW-Spread
36
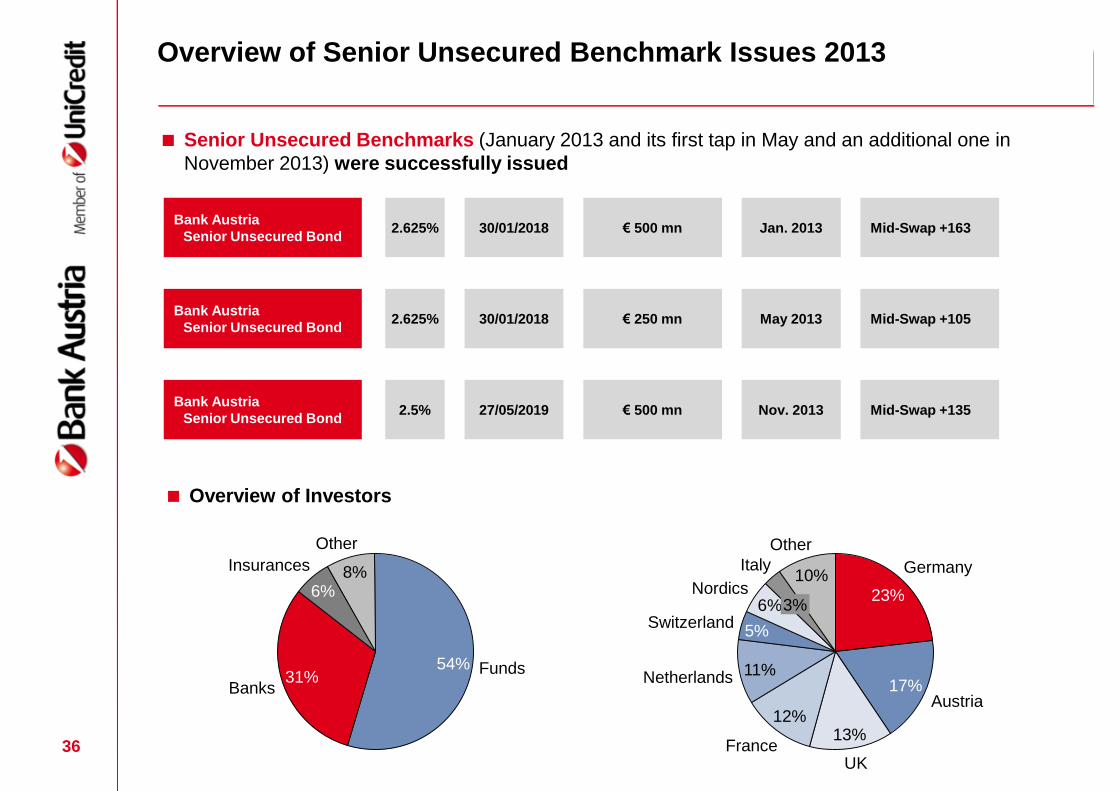
Overview of Senior Unsecured Benchmark Issues 2013
Senior Unsecured Benchmarks (January 2013 and its first tap in May and an additional one inNovember 2013) were successfully issued
Bank AustriaSenior Unsecured Bond
2.625% € 500 mn Jan. 2013 Mid-Swap +16330/01/2018
Bank AustriaSenior Unsecured Bond
2.625% € 250 mn May 2013 Mid-Swap +10530/01/2018
Overview of Investors
6%
Other
10%Italy
3%Nordics
Switzerland5%
Netherlands 11%
France
12%
UK
13%
Austria17%
Germany
23%
Bank AustriaSenior Unsecured Bond
2.5% € 500 mn Nov. 2013 Mid-Swap +13527/05/2019
Other
6%8%Insurances
Banks31%
Funds54%
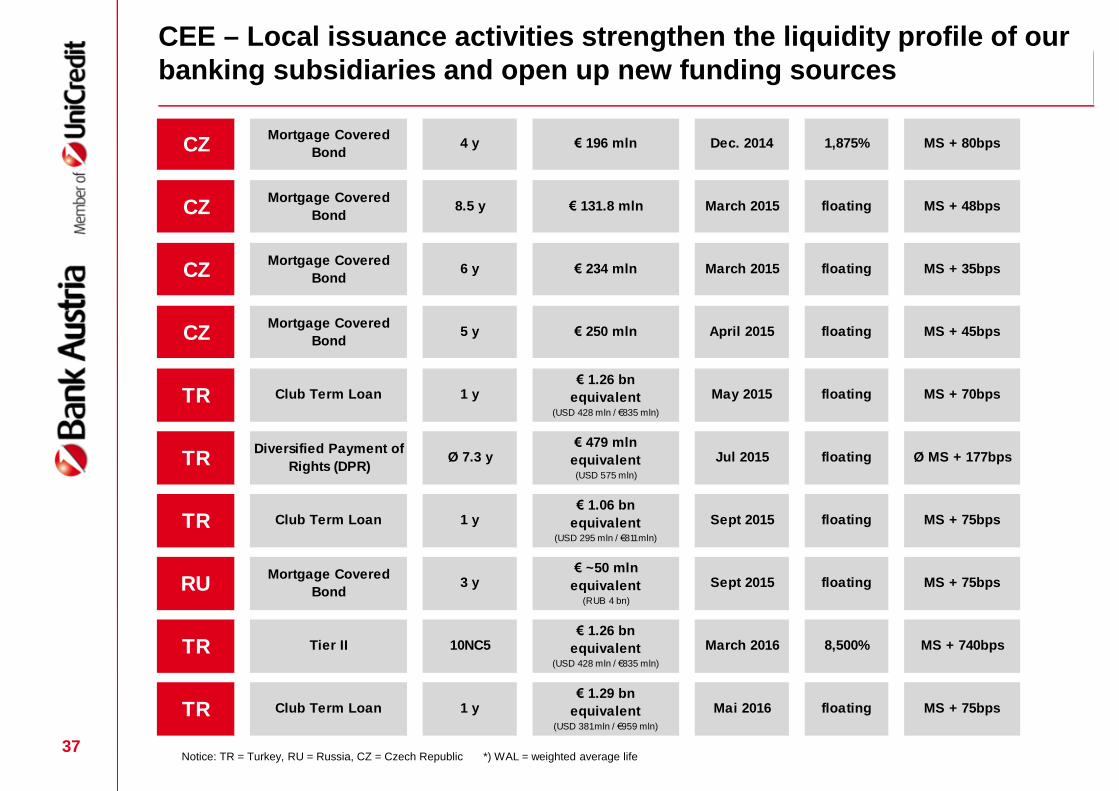
CZMortgage Covered
Bond4 y € 196 mln Dec. 2014 1,875% MS + 80bps
CZMortgage Covered
Bond8.5 y € 131.8 mln March 2015 floating MS + 48bps
CZMortgage Covered
Bond6 y € 234 mln March 2015 floating MS + 35bps
CZMortgage Covered
Bond5 y € 250 mln April 2015 floating MS + 45bps
TR Club Term Loan 1 y€ 1.26 bn
equivalent(USD 428 mln / €835 mln)
May 2015 floating MS + 70bps
TRDiversified Payment of
Rights (DPR)Ø 7.3 y
€ 479 mln
equivalent(USD 575 mln)
Jul 2015 floating Ø MS + 177bps
TR Club Term Loan 1 y€ 1.06 bn
equivalent(USD 295 mln / €811mln)
Sept 2015 floating MS + 75bps
RUMortgage Covered
Bond3 y
€ ~50 mln
equivalent(RUB 4 bn)
Sept 2015 floating MS + 75bps
TR Tier II 10NC5€ 1.26 bn
equivalent(USD 428 mln / €835 mln)
March 2016 8,500% MS + 740bps
TR Club Term Loan 1 y€ 1.29 bn
equivalent(USD 381mln / €959 mln)
Mai 2016 floating MS + 75bps
37
CEE – Local issuance activities strengthen the liquidity profile of ourbanking subsidiaries and open up new funding sources
Notice: TR = Turkey, RU = Russia, CZ = Czech Republic *) WAL = weighted average life

38
Agenda
Overview Bank Austria
Profit & Loss
Liquidity & Funding
Funding Strategy & Position
Balance Sheet & Capital Ratios
Business Model & Strategy
Transactions
Annex
Cover Pool

39
Executive Summary Bank AustriaPublic Sector Cover Pool
Aaa Rating by Moody‘s
ECBC Covered Bond Label has been granted to the Public Sector Cover Pool of Bank Austria
Cover Pool Volume as of 31 December 2015 amounts to EUR 6,941 mn
Average volume of loans is approx. € 1.81 mn
Average seasoning is 5.9 years

Parameters of Issues:
Total Number 36
Average Maturity (in years) 4.6
Average Volume (in EUR) 127,212,656
Parameters of Cover Pool
Weighted Average Life (in years incl. Amortization) 6.4
Contracted Weighted Average Life (in years) 8.7
Average Seasoning (in years) 5.9
Total Number of Loans 3,841
Total Number of Debtors 1,425
Total Number of Guarantors 284
Average Volume of Loans (in EUR) 1,806,979
Stake of 10 Biggest Loans 30.4%
Stake of 10 Biggest Guarantors 31.6%
Stake of Bullet Loans 61.1%
Stake of Fixed Interest Loans 34.4%
Amount of Loans 90 Days Overdue 0
Average Interest Rate 1.4%
40
Public SectorParameters of Cover Pool and Issues
Total Value of the Cover Pool as of 31 December 2015 in EUR equivalent: 6,941 mn
• thereof in EUR: 3,424 mn
• thereof in CHF: 1,768 mn
• thereof public sector bonds in EUR equivalent: 1,749 mn
Moody’s Rating: Aaa
Nominal / Present Value Over-Collateralization*): 51.6% / 39.8%
Total Value of Sold Covered Bonds as of 31 December 2015 in EUR: 4,580 mn
*) Austrian Mortgage Banking Act requires a nominal over-collateralisation of 2%. The basis for its calculation is a cover pool valuereduced by legally defined haircuts. Taking these haircuts into consideration, the cover pool value amounts to EUR 6,514 mn, thus theovercollateralization is 42.3%.Additionally, in its Articles of Association, UniCredit Bank Austria commits itself to an over-collateralisation on a present value basis.
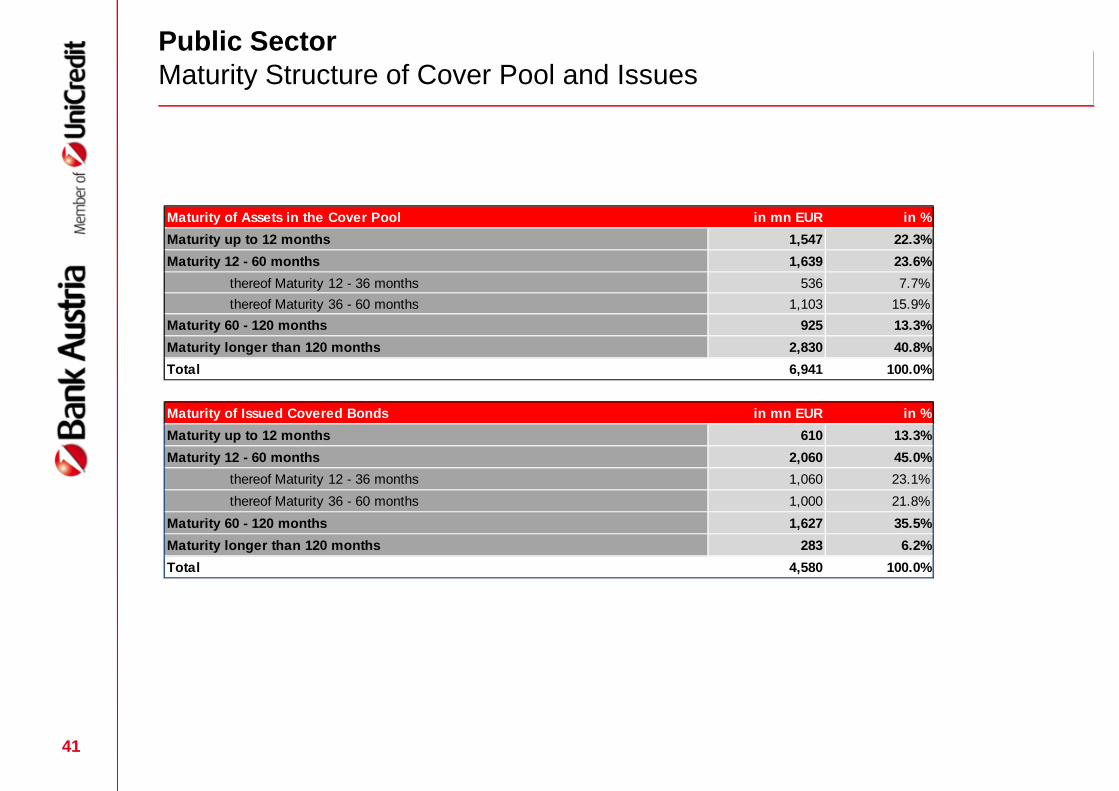
Maturity of Assets in the Cover Pool in mn EUR in %
Maturity up to 12 months 1,547 22.3%
Maturity 12 - 60 months 1,639 23.6%
thereof Maturity 12 - 36 months 536 7.7%
thereof Maturity 36 - 60 months 1,103 15.9%
Maturity 60 - 120 months 925 13.3%
Maturity longer than 120 months 2,830 40.8%
Total 6,941 100.0%
Maturity of Issued Covered Bonds in mn EUR in %
Maturity up to 12 months 610 13.3%
Maturity 12 - 60 months 2,060 45.0%
thereof Maturity 12 - 36 months 1,060 23.1%
thereof Maturity 36 - 60 months 1,000 21.8%
Maturity 60 - 120 months 1,627 35.5%
Maturity longer than 120 months 283 6.2%
Total 4,580 100.0%
41
Public SectorMaturity Structure of Cover Pool and Issues

42
Public SectorRegional Breakdown of Assets*) in Austria
*) Considering Guarantors
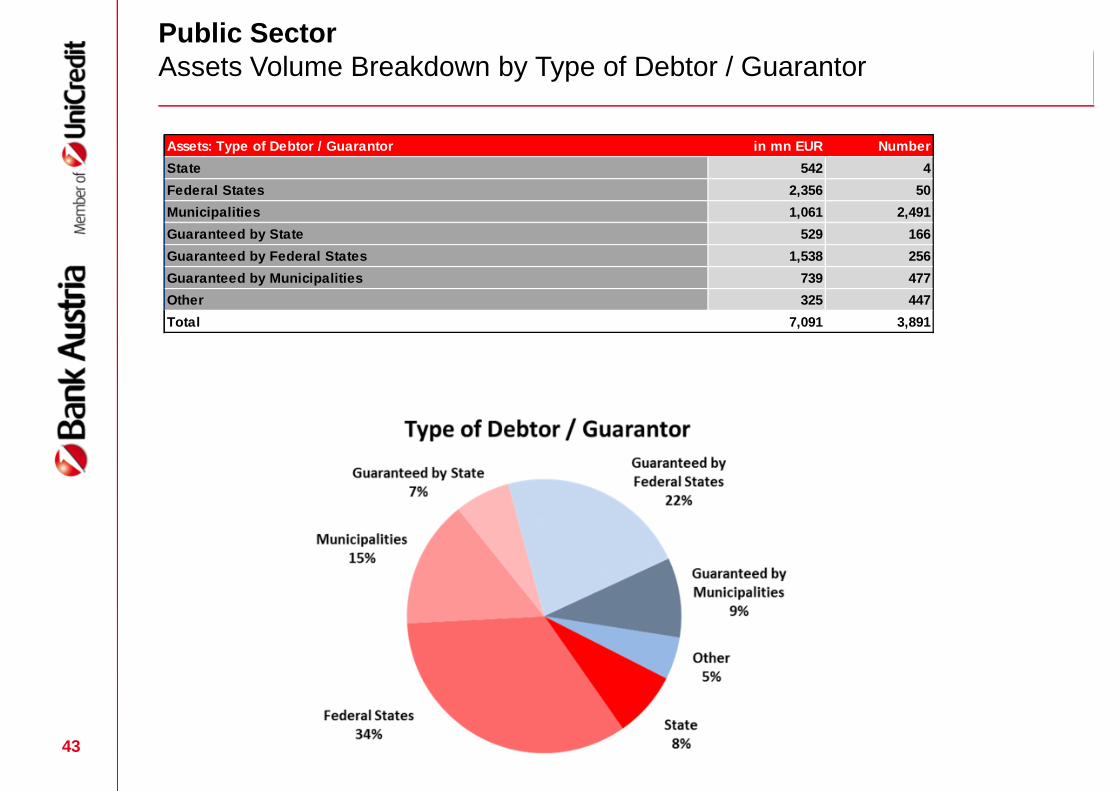
Assets: Type of Debtor / Guarantor in mn EUR Number
State 541 4
Federal States 2,352 51
Municipalities 1,045 2,457
Guaranteed by State 454 161
Guaranteed by Federal States 1,549 254
Guaranteed by Municipalities 652 464
Other 347 450
Total 6,941 3,841
Assets: Type of Debtor / Guarantor in mn EUR Number
State 542 4
Federal States 2,356 50
Municipalities 1,061 2,491
Guaranteed by State 529 166
Guaranteed by Federal States 1,538 256
Guaranteed by Municipalities 739 477
Other 325 447
Total 7,091 3,891
43
Public SectorAssets Volume Breakdown by Type of Debtor / Guarantor

Volume Breakdown by Size of Assets in mn EUR Number
below 300,000 263 2,353
thereof under 100,000 54 1,221
thereof 100,000 - 300,000 209 1,132
300,000 - 5,000,000 1,415 1,398
thereof 300,000 - 500,000 175 489
thereof 500,000 - 1,000,000 306 435
thereof 1,000,000 - 5,000,000 934 474
above 5,000,000 5,263 140
Total 6,941 3,891
44
Public SectorVolume Breakdown by Size of Assets

45
Executive SummaryBank Austria Mortgage Cover Pool
Aaa Rating by Moody‘s
Bank Austria decided to streamline its Mortgage Cover Pool targeting a simple and transparent
pool composition:
focus on Austrian mortgages only
change to whole loan reporting instead of collateral volume
Benefit:
pure Austrian risk offer to our investor base
no blending of risk, diversification to be decided by investor
simple pricing logic
ECBC Covered Bond Label has been granted to the BA Mortgage Cover Pool

Parameters of Issues:
Total Number 104
Average Maturity (in years) 5.6
Average Volume (in EUR) 48,428,588
Parameters of Cover Pool
Weighted Average Life (in years incl. Amortization) 9.4
Contracted Weighted Average Life (in years) 14.0
Average Seasoning (in years) 6.1
Total Number of Loans 27,983
Total Number of Debtors 26,198
Total Number of Mortgages 27,983
Average Volume of Loans (in EUR) 330,328
Stake of 10 Biggest Loans 13.4%
Stake of 10 Biggest Debtors 16.9%
Stake of Bullet Loans 37.2%
Stake of Fixed Interest Loans 16.8%
Amount of Loans 90 Days Overdue 0
Average Interest Rate 1.4%
46
Mortgage Cover PoolParameters of the Cover Pool and Issues
Total Value of the Cover Pool as of 31 December 2015 in EUR equivalent: 9,372 mn
• thereof in EUR: 7,578 mn
• thereof in CHF: 1,666 mn
• thereof substitute cover in EUR: 128 mn
Moody’s Rating: Aaa
Nominal / Present Value Over-Collateralisation*): 86.1% / 90.4%
Total Value of Issued Mortgage Pfandbriefe as of 31 December 2015 in EUR: 5,037 mn
Total Value of Sold Mortgage Pfandbriefe as of 31 December 2015 in EUR: 4,437 mn
*) Austrian Mortgage Banking Act requires a nominal over-collateralization of 2%. The basis for its calculation is a cover pool value reduced bylegally defined haircuts. Taking these haircuts into consideration, the cover pool value amounts to EUR 6,176 mn, thus the overcollateralizationis 22.6%. Additionally, in its Articles of Association, UniCredit Bank Austria commits itself to an over-collateralization on a present value basis.
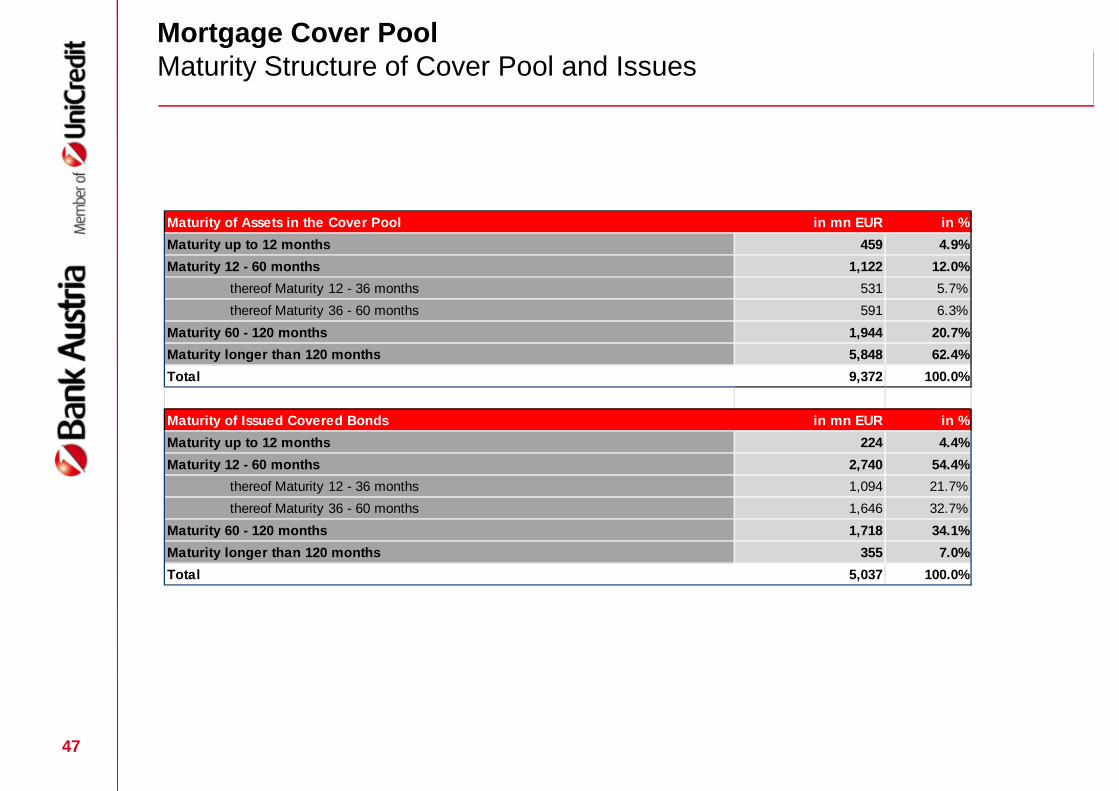
Maturity of Assets in the Cover Pool in mn EUR in %
Maturity up to 12 months 459 4.9%
Maturity 12 - 60 months 1,122 12.0%
thereof Maturity 12 - 36 months 531 5.7%
thereof Maturity 36 - 60 months 591 6.3%
Maturity 60 - 120 months 1,944 20.7%
Maturity longer than 120 months 5,848 62.4%
Total 9,372 100.0%
Maturity of Issued Covered Bonds in mn EUR in %
Maturity up to 12 months 224 4.4%
Maturity 12 - 60 months 2,740 54.4%
thereof Maturity 12 - 36 months 1,094 21.7%
thereof Maturity 36 - 60 months 1,646 32.7%
Maturity 60 - 120 months 1,718 34.1%
Maturity longer than 120 months 355 7.0%
Total 5,037 100.0%
47
Mortgage Cover PoolMaturity Structure of Cover Pool and Issues

Volume Breakdown by Size of Loans in mn EUR Number
below 300,000 3,039 24,295
thereof under 100,000 566 10,206
thereof 100,000 - 300,000 2,473 14,089
300,000 - 5,000,000 2,733 3,516
thereof 300,000 - 500,000 761 2,081
thereof 500,000 - 1,000,000 504 728
thereof 1,000,000 - 5,000,000 1,468 707
above 5,000,000 3,599 172
Total 9,372 27,983
48
Mortgage Cover PoolAssets Volume Breakdown

49
Mortgage Cover PoolRegional Breakdown *) of Mortgages in Austria
*) Without substitute cover (consists of bonds)

Mortgages Breakdown by Type of Use in mn EUR Number
Residential 3,867 24,190
Residential subsidized 1,690 1,963
Residential used for business purposes 547 1,069
Commercial 3,140 761
thereof Office 1,314 141
thereof Trade 988 70
thereof Tourism 189 109
thereof Agriculture 18 87
thereof mixed Use / Others 632 354
Total 9,244 27,983
50
Mortgage Cover PoolBreakdown*) by Type of Use
*) Without substitute cover (consists of bonds)

51
Mortgage Cover PoolBreakdown*) by Type of Use
Bank Austria’s Mortgage Cover Pool Value accounts for € 9,244 mn as of 31 December 2015
(without substitute cover)
All mortgages in cover pool are located in Austria
The main concentration is in the City of Vienna 41.3% and the state of Lower Austria 25.0%
Breakdown of cover pool by type of use:
66.0% residential real estate (thereof 18.3% subsidized)
34.0% commercial real estate, divides as follows:
Office 14.2%
Trade 10.7%
Tourism 2.1%
Other / Mixed use 7.0%
*) all percent Values are respective cover pool value without substitute cover
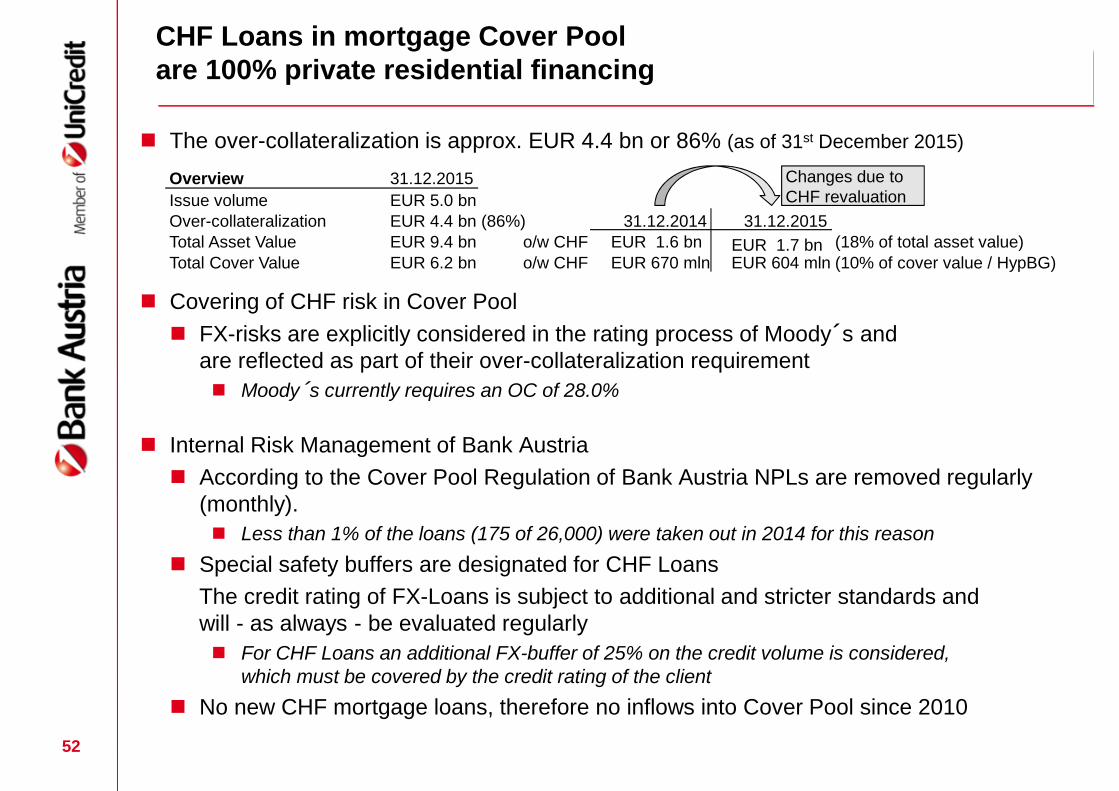
The over-collateralization is approx. EUR 4.4 bn or 86% (as of 31st December 2015)
Covering of CHF risk in Cover Pool
FX-risks are explicitly considered in the rating process of Moody´s andare reflected as part of their over-collateralization requirement
Moody´s currently requires an OC of 28.0%
Internal Risk Management of Bank Austria
According to the Cover Pool Regulation of Bank Austria NPLs are removed regularly(monthly).
Less than 1% of the loans (175 of 26,000) were taken out in 2014 for this reason
Special safety buffers are designated for CHF Loans
The credit rating of FX-Loans is subject to additional and stricter standards andwill - as always - be evaluated regularly
For CHF Loans an additional FX-buffer of 25% on the credit volume is considered,which must be covered by the credit rating of the client
No new CHF mortgage loans, therefore no inflows into Cover Pool since 2010
52
CHF Loans in mortgage Cover Poolare 100% private residential financing
Changes due toCHF revaluation
Overview 31.12.2015
Issue volume EUR 5.0 bnOver-collateralization EUR 4.4 bn 31.12.2014 31.12.2015Total Asset Value EUR 9.4 bn o/w CHF EUR 1.6 bn EUR 1.7 bn (18% of total asset value)Total Cover Value EUR 6.2 bn o/w CHF EUR 670 mln EUR 604 mln (10% of cover value / HypBG)
(86%)

53
Bank Austria’s Whole Loan ApproachWhole Loan Approach and its Benefits for Investors
Scenario II = Approach of Bank Austria = Whole Loan Approach
Loan Volume
&
Value to cover issuedPfandbriefe
Scenario I: Split Loan Approach = Minimum Approach
Loan Volumesplit
Value of Mortgage
&
€ 100 € 100 = €60 + €40 € 60
€ 100 € 100 € 100
For optimization of its collateral value
loans are split into 2 parts:
1) included in cover pool and
2) not included in cover pool
The whole loan – and not only its legally
assigned value – is included in the cover
pool to collateralize BA‘s issued
Mortgage Pfandbriefe.
Thus, investors benefit from
collateralization above legal
requirement in BA‘s cover pool.
€60 = MaximumPfandbriefvolume issuedaccording toHypBG
€40 =Additional Poolvolume
Value of Mortgage
Not inCoverPool
Loan inCoverPool
Value to cover issuedPfandbriefe
Loan inCoverPool
According to the Austrian Mortgage Banking Act (HypBG), the maximum coverage volume of ”Beleihungswert” is 60%(maximum current outstanding of the loan)
€60 = MaximumPfandbriefvolume issuedaccording toHypBG

54
Agenda
Overview Bank Austria
Profit & Loss
Liquidity & Funding
Funding Strategy & Position
Balance Sheet & Capital Ratios
Business Model & Strategy
Transactions
Annex
Cover Pool

55
Agenda
Annex
Bank Austria within UniCredit Group
Legal Situation – Austrian Covered Bonds
Real Estate Market Austria

56
UniCredit at a glanceA clear international profile based on a strong European identity
1) Source: UniCredit analysis on Sodali Shareholders' ID. All data based on ordinary shares as at 28 February 20152) As of 10 May 20163) As of 31 March 2016
Strong local roots in 17 countries
~ 124,500 employees
~ 6,800 branches
Over 30.5 mn customers in Europe
One of the most important banks in Europe with
total assets of ~ € 900 bn
One of the 30 Global Systemically Important
Banks (“G-SIBs”) worldwide
Market capitalization of ~ € 17.9 bn 2)
Common Equity Tier 1 (CET1) Ratio at 10.85%
under Basel 3 fully loaded 3)
Main shareholders:
Stable shareholders, e.g. Foundations
Institutional investors
Retail investors
Shareholder Structure1)UniCredit Highlights
Retail,miscellaneous
and unidentifiedInvestors
StableShareholders
33% InstitutionalShareholders
26%
41%

57
Role of Bank Austria within UniCredit
Within UniCredit, Bank Austria is the
Central hub for the CEE Region(except Poland) and the
Responsible unit for the Austrianmarket
Bank Austria benefits from being part ofUniCredit:
Strong market presence in 17European countries
Access to a worldwide network
Leveraging on the know-how of theGroup‘s product factories
Bank Austria as UniCredit‘s centralhub for the CEE Region1):
Holding for banks in 13 CEEcountries with a population ofapprox. 300 mn
Managing a network of about1,300 branches and 28,000FTE2) in CEE3)
Development of retail andcorporate business in the region
Liquidity management for theCEE subsidiaries
Management of credit andmarket risk
Responsibility for HRdevelopment
1) According to the “Strategic Plan of UniCredit” published on 11 Nov. 2015, CEE business to be transferred under the management of UniCreditSpA by end of 2016; 2) FTE = Full-time equivalent; 3) excl. a further 1,000 branches and ~19,000 FTE of the Turkish Joint Venture

58
Agenda
Annex
Bank Austria within UniCredit Group
Legal Situation – Austrian Covered Bonds
Real Estate Market Austria
59
Austrian Real Estate MarketOverview
The Austrian real estate market has the well-earned reputation as a relatively stable
market. IPD/MSCI annually analyses an Austrian portfolio consisting of office, retail,
residential, logistics and other properties. In 2015 as a whole, the total return of this
portfolio amounted to 5.9%. Over the last ten years annual average total return was
calculated as 5.7% and even in the crisis years 2008/2009 total return amounted to
around 4%.
In 2015 investment in commercial real estate in Austria reached a new record volume
of up to EUR 3.8bn depending on the source. With ultra-low or even negative interest
rates demand for real estate will stay strong, although it is somewhat hampered by
scarce supply of core property and high prices.
Residential real estate prices in Vienna have risen considerably over the last ten years.
Nevertheless, price increases slowed down last year, while prices in the rest of Austria
accelerated.

60
Austrian Real Estate MarketPrices for residential real estate
Source: OeNB, TU Wien, Institut für Stadt- und Regionalforschung
The strong increase of real estate prices in Vienna has moderated
considerably over the last quarters.
Prices in Austria excl. Vienna, which showed a more moderate development
over the last ten years, recently accelerated.
0
50
100
150
200
250
2000 2001 2002 2003 2004 2005 2006 2007 2008 2009 2010 2011 2012 2013 2014 2015
Residential propertyPrice index 2000 = 100
Vienna Austria without Vienna

61
Austrian Real Estate MarketIPD
Source: IPD/MSCI
Austria’s real estate market scores through relatively high stability, which is
confirmed by calculations done by IPD/MSCI.
-2.0
-1.0
0.0
1.0
2.0
3.0
4.0
5.0
6.0
7.0
8.0
2005 2006 2007 2008 2009 2010 2011 2012 2013 2014 2015
IPD - Total Return of Austrian Porfolio
Income return Capital growth Total return

62
Agenda
Annex
Bank Austria within UniCredit Group
Legal Situation – Austrian Covered Bonds
Real Estate Market Austria

63
Austrian Legal FrameworkMortgage and Public Sector Pfandbriefe
Austrian Covered Bonds
Pfandbriefe
Pfandbriefgesetz(Pfandbrief Law 1938)
Hypothekenbankgesetz(Mortgage Banking Act 1899)
FundierteSchuldverschreibungen
Law of 1905
Bank Austria
Remark:Austrian ‘Mortgage Pfandbriefe‘ also follow the same legal regulation as ‘Public Sector Pfandbriefe‘
64 * if included in the Articles of Association of the respective credit institution
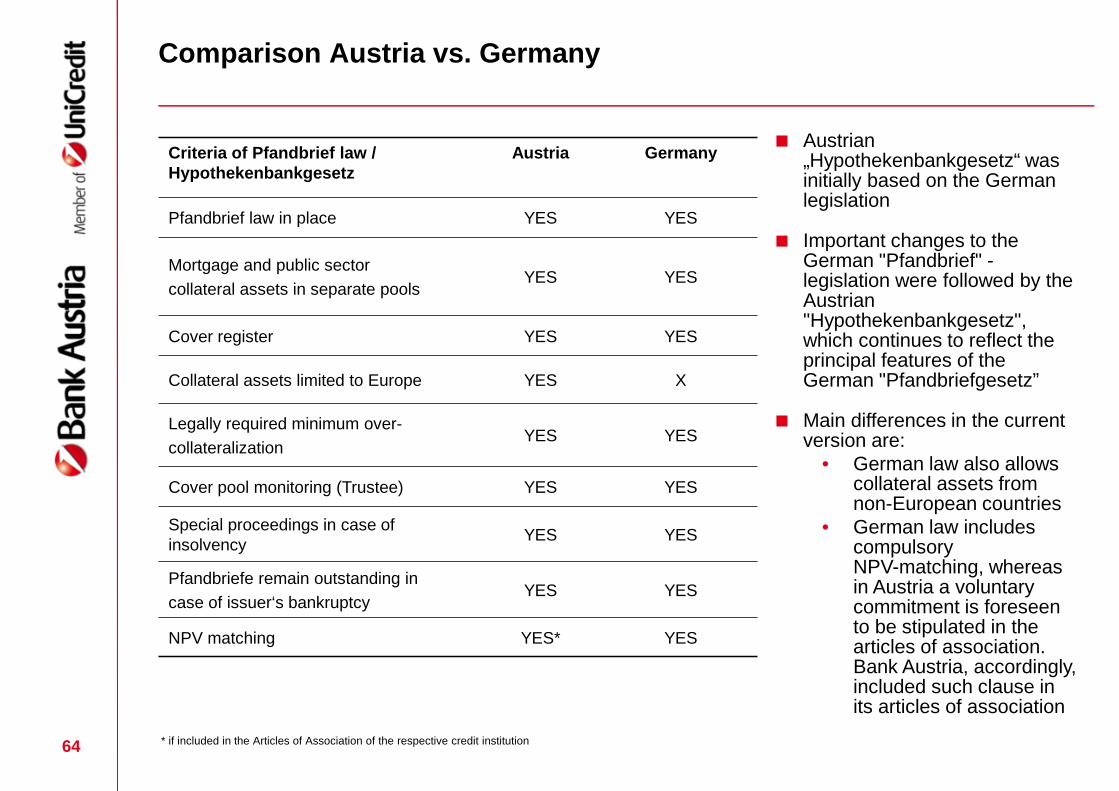
Austrian„Hypothekenbankgesetz“ wasinitially based on the Germanlegislation
Important changes to theGerman "Pfandbrief" -legislation were followed by theAustrian"Hypothekenbankgesetz",which continues to reflect theprincipal features of theGerman "Pfandbriefgesetz”
Main differences in the currentversion are:
• German law also allowscollateral assets fromnon-European countries
• German law includescompulsoryNPV-matching, whereasin Austria a voluntarycommitment is foreseento be stipulated in thearticles of association.Bank Austria, accordingly,included such clause inits articles of association
Comparison Austria vs. Germany
Criteria of Pfandbrief law /Hypothekenbankgesetz
Austria Germany
Pfandbrief law in place YES YES
Mortgage and public sector
collateral assets in separate poolsYES YES
Cover register YES YES
Collateral assets limited to Europe YES X
Legally required minimum over-
collateralizationYES YES
Cover pool monitoring (Trustee) YES YES
Special proceedings in case ofinsolvency
YES YES
Pfandbriefe remain outstanding in
case of issuer‘s bankruptcyYES YES
NPV matching YES* YES

65
Your Contacts
CFO FinanceUniCredit Bank Austria AG
Martin KlauzerHead of FinanceTel. +43 (0) 50505 [email protected]
Thomas Ruzek
Head of Strategic Funding
Tel. +43 (0) 50505 82560
Gabriele WiebogenHead of Long Term FundingTel. +43 (0) 50505 [email protected]
Werner Leitner
Head of Cover Pool Management
Tel. +43 (0) 50505 82647
CFO Planning & Controlling Austria
UniCredit Bank Austria AG
Günther StromengerHead of Corporate RelationsTel. +43 (0) 50505 [email protected]
Impressum
UniCredit Bank Austria AGCFO FinanceA-1010 Vienna, Schottengasse 6-8
66
This publication is presented to you by:UniCredit Bank Austria AGJulius Tandler-Platz 3A-1090 Wien
The information in this publication is based on carefully selected sources believed to be reliable. However we do not make any representation as to its accuracy or completeness. Any opinions herein reflect our judgement at the date hereof andare subject to change without notice. Any investments presented in this report may be unsuitable for the investor depending on his or her specific investment objectives and financial position. Any reports provided herein are provided for generalinformation purposes only and cannot substitute the obtaining of independent financial advice. Private investors should obtain the advice of their banker/broker about any investments concerned prior to making them. Nothing in this publication isintended to create contractual obligations. Corporate & Investment Banking of UniCredit Group consists of UniCredit Bank AG, Munich, UniCredit Bank Austria AG, Vienna, UniCredit S.p.A., Rome and other members of the UniCredit Group.UniCredit Bank AG is regulated by the German Financial Supervisory Authority (BaFin), UniCredit Bank Austria AG is regulated by the Austrian Financial Market Authority (FMA) and UniCredit S.p.A. is regulated by both the Banca d'Italia and theCommissione Nazionale per le Società e la Borsa (CONSOB).
Note to UK Residents:In the United Kingdom, this publication is being communicated on a confidential basis only to clients of Corporate & Investment Banking of UniCredit Goup (acting through UniCredit Bank AG, London Branch) who (i) have professional experiencein matters relating to investments being investment professionals as defined in Article 19(5) of the Financial Services and Markets Act 2000 (Financial Promotion) Order 2005 (“FPO”); and/or (ii) are falling within Article 49(2) (a) – (d) (“high networth companies, unincorporated associations etc.”) of the FPO (or, to the extent that this publication relates to an unregulated collective scheme, to professional investors as defined in Article 14(5) of the Financial Services and Markets Act 2000(Promotion of Collective Investment Schemes) (Exemptions) Order 2001 and/or (iii) to whom it may be lawful to communicate it, other than private investors (all such persons being referred to as “Relevant Persons”). This publication is onlydirected at Relevant Persons and any investment or investment activity to which this publication relates is only available to Relevant Persons or will be engaged in only with Relevant Persons. Solicitations resulting from this publication will only beresponded to if the person concerned is a Relevant Person. Other persons should not rely or act upon this publication or any of its contents.The information provided herein (including any report set out herein) does not constitute a solicitation to buy or an offer to sell any securities. The information in this publication is based on carefully selected sources believed to be reliable but wedo not make any representation as to its accuracy or completeness. Any opinions herein reflect our judgement at the date hereof and are subject to change without notice.We and/or any other entity of Corporate & Investment Banking of UniCredit Group may from time to time with respect to securities mentioned in this publication (i) take a long or short position and buy or sell such securities; (ii) act as investmentbankers and/or commercial bankers for issuers of such securities; (iii) be represented on the board of any issuers of such securities; (iv) engage in “market making” of such securities; (v) have a consulting relationship with any issuer. Anyinvestments discussed or recommended in any report provided herein may be unsuitable for investors depending on their specific investment objectives and financial position. Any information provided herein is provided for general informationpurposes only and cannot substitute the obtaining of independent financial advice.UniCredit Bank AG, London Branch is regulated by the Financial Services Authority for the conduct of business in the UK as well as by BaFIN, Germany.Notwithstanding the above, if this publication relates to securities subject to the Prospectus Directive (2005) it is sent to you on the basis that you are a Qualified Investor for the purposes of the directive or any relevant implementing legislation of aEuropean Economic Area (“EEA”) Member State which has implemented the Prospectus Directive and it must not be given to any person who is not a Qualified Investor. By being in receipt of this publication you undertake that you will only offer orsell the securities described in this publication in circumstances which do not require the production of a prospectus under Article 3 of the Prospectus Directive or any relevant implementing legislation of an EEA Member State which hasimplemented the Prospectus Directive.
Note to US Residents:The information provided herein or contained in any report provided herein is intended solely for institutional clients of Corporate & Investment Banking of UniCredit Group acting through UniCredit Bank AG, New York Branch and UniCredit CapitalMarkets, Inc. (together “UniCredit”) in the United States, and may not be used or relied upon by any other person for any purpose. It does not constitute a solicitation to buy or an offer to sell any securities under the Securities Act of 1933, asamended, or under any other US federal or state securities laws, rules or regulations. Investments in securities discussed herein may be unsuitable for investors, depending on their specific investment objectives, risk tolerance and financialposition.In jurisdictions where UniCredit is not registered or licensed to trade in securities, commodities or other financial products, any transaction may be effected only in accordance with applicable laws and legislation, which may vary from jurisdiction tojurisdiction and may require that a transaction be made in accordance with applicable exemptions from registration or licensing requirements.All information contained herein is based on carefully selected sources believed to be reliable, but UniCredit makes no representations as to its accuracy or completeness. Any opinions contained herein reflect UniCredit's judgement as of theoriginal date of publication, without regard to the date on which you may receive such information, and are subject to change without notice.UniCredit may have issued other reports that are inconsistent with, and reach different conclusions from, the information presented in any report provided herein. Those reports reflect the different assumptions, views and analytical methods of theanalysts who prepared them. Past performance should not be taken as an indication or guarantee of further performance, and no representation or warranty, express or implied, is made regarding future performance.UniCredit and/or any other entity of Corporate & Investment Banking of UniCredit Group may from time to time, with respect to any securities discussed herein: (i) take a long or short position and buy or sell such securities; (ii) act as investmentand/or commercial bankers for issuers of such securities; (iii) be represented on the board of such issuers; (iv) engage in “market-making” of such securities; and (v) act as a paid consultant or adviser to any issuer.The information contained in any report provided herein may include forward-looking statements within the meaning of US federal securities laws that are subject to risks and uncertainties. Factors that could cause a company's actual results andfinancial condition to differ from its expectations include, without limitation: Political uncertainty, changes in economic conditions that adversely affect the level of demand for the company‘s products or services, changes in foreign exchangemarkets, changes in international and domestic financial markets, competitive environments and other factors relating to the foregoing. All forward-looking statements contained in this report are qualified in their entirety by this cautionarystatement.
This product is offered by UniCredit Bank Austria AG who is solely responsible for the Product and its performance and/or effectiveness. UEFA and its affiliates, member associations and sponsors (excluding UniCredit and UniCredit Bank AustriaAG) do not endorse, approve or recommend the Product and accept no liability or responsibility whatsoever in relation thereto.
UniCredit Bank Austria AG, Viennaas of 12 May 2016
Disclaimer
Recommended