Design Tradeoffs for SSD Performance
Ted WobberPrincipal ResearcherMicrosoft Research, Silicon Valley
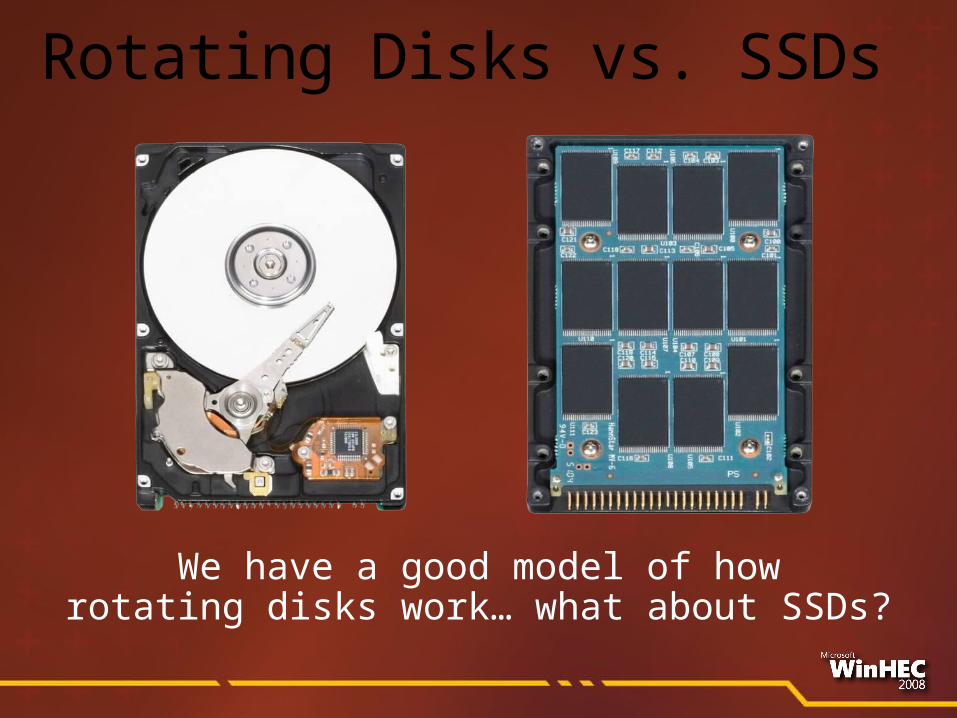
Rotating Disks vs. SSDs
We have a good model of howrotating disks work… what about SSDs?
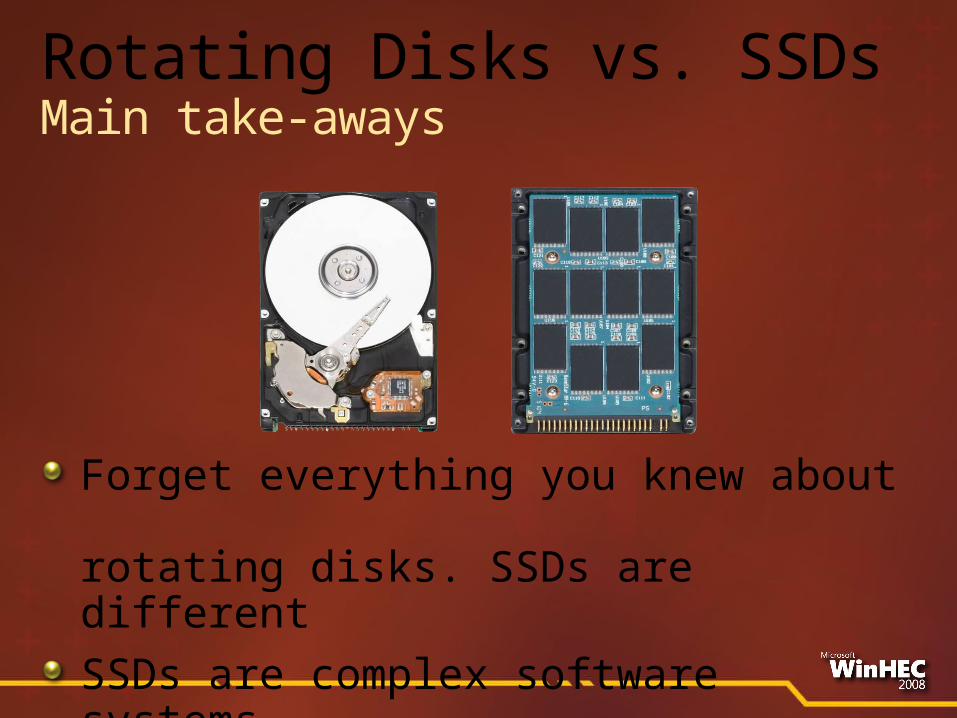
Rotating Disks vs. SSDsMain take-aways
Forget everything you knew about rotating disks. SSDs are differentSSDs are complex software systemsOne size doesn’t fit all

A Brief Introduction
Microsoft Research – a focus on ideas and understanding
Will SSDs Fix All Our Storage Problems?
Performance surprises?
Excellent read latency; sequential bandwidthLower $/IOPS/GBImproved power consumptionNo moving partsForm factor, noise, …
Performance/Surprises
Latency/bandwidth“How fast can I read or write?”Surprise: Random writes can be slow
Persistence“How soon must I replace this device?”Surprise: Flash blocks wear out
What’s in This Talk
IntroductionBackground on NAND flash, SSDsPoints of comparison with rotating disks
Write-in-place vs. write-loggingMoving parts vs. parallelismFailure modes
Conclusion
What’s *NOT* in This Talk
WindowsAnalysis of specific SSDsCostPower savings
Full Disclosure
“Black box” study based on the properties of NAND flashA trace-based simulation of an “idealized” SSDWorkloads
TPC-CExchangePostmarkIOzone
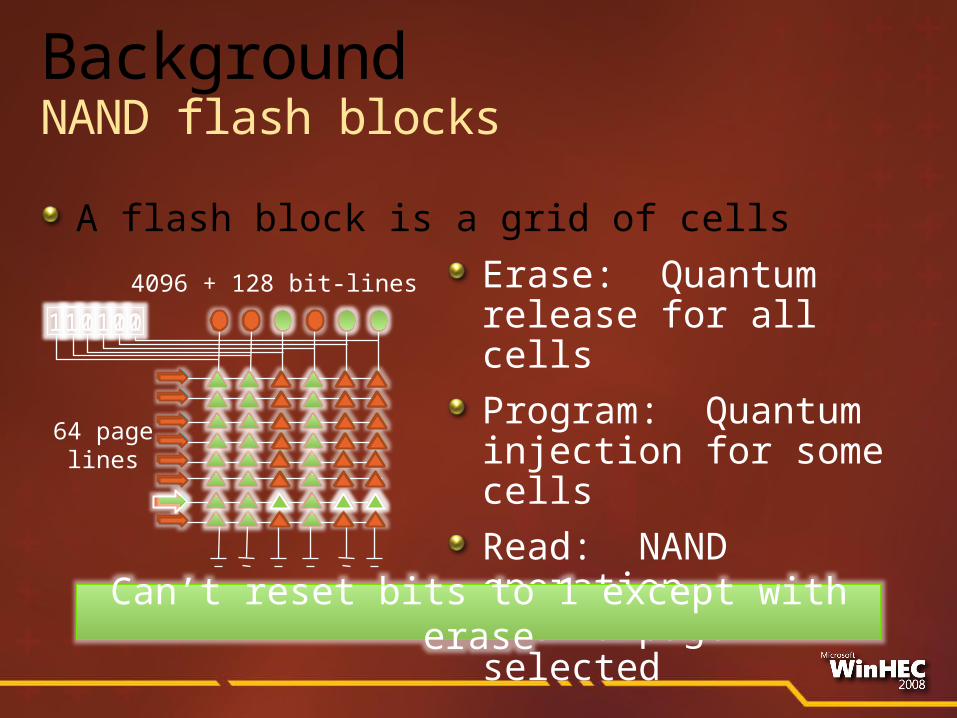
BackgroundNAND flash blocks
A flash block is a grid of cells
4096 + 128 bit-lines
64 pagelines
Erase: Quantum release for all cells
Program: Quantuminjection for some cells
Read: NAND operationwith a page selected
Can’t reset bits to 1 except with erase
110100111111
REG
PLANE 0
PLANE 1
PLANE 2
PLANE 3
DIE 0
REG
REG
REG
BLOCK
PLANE
SERIAL OUT
REG
PLANE 0
PLANE 1
PLANE 2
PLANE 3
DIE 1
REG
REG
REG
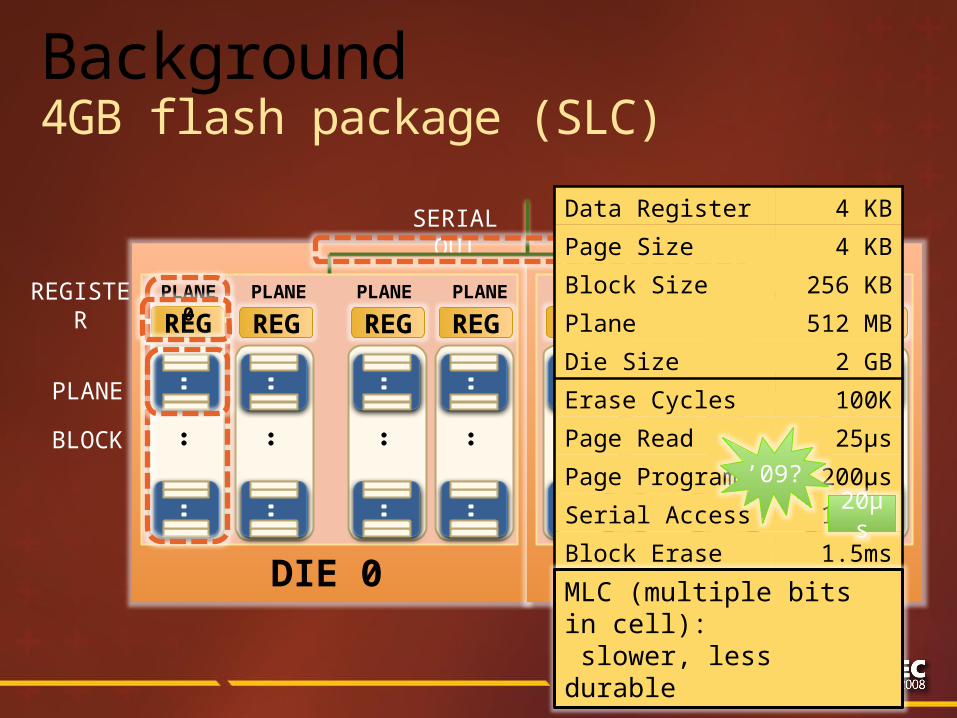
Data Register 4 KB
Page Size 4 KB
Block Size 256 KB
Plane 512 MB
Die Size 2 GB
Erase Cycles 100K
Page Read 25μs
Page Program 200μs
Serial Access 100μs
Block Erase 1.5ms
Background4GB flash package (SLC)
REGISTER
MLC (multiple bits in cell): slower, less durable
’09?20μ
s
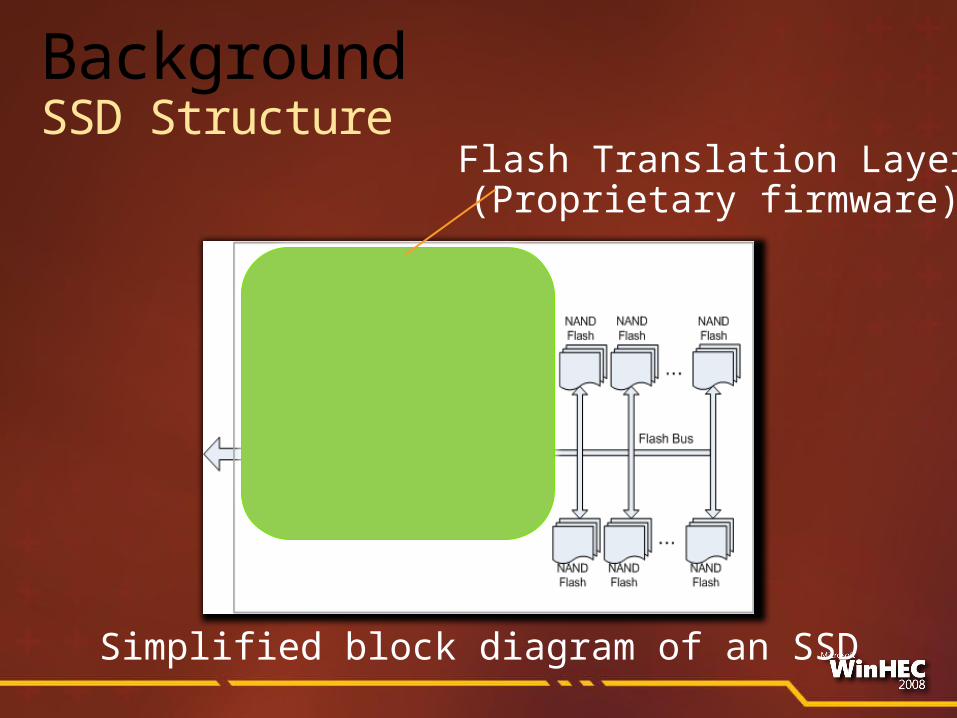
Simplified block diagram of an SSD
Flash Translation Layer(Proprietary firmware)
BackgroundSSD Structure
Write-in-place vs. Logging
(What latency can I expect?)
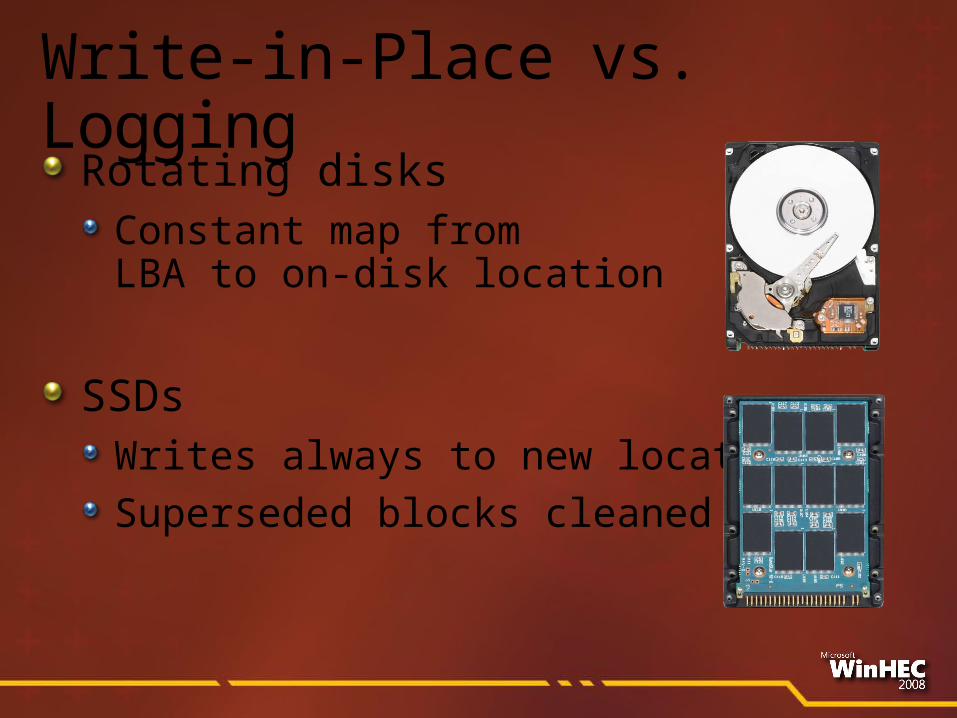
Write-in-Place vs. Logging
Rotating disksConstant map fromLBA to on-disk location
SSDsWrites always to new locationsSuperseded blocks cleaned later
P
P0
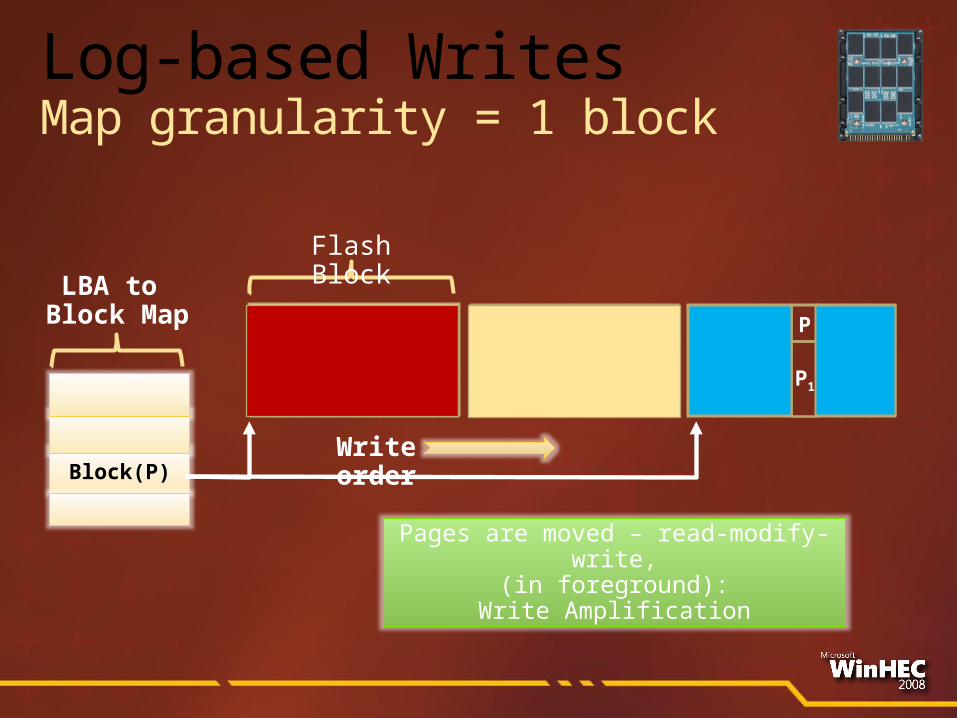
Block(P)Write order
LBA to Block Map
Flash Block
P
P1
Log-based WritesMap granularity = 1 block
Pages are moved – read-modify-write,
(in foreground):Write Amplification
P Q
P0 Q0
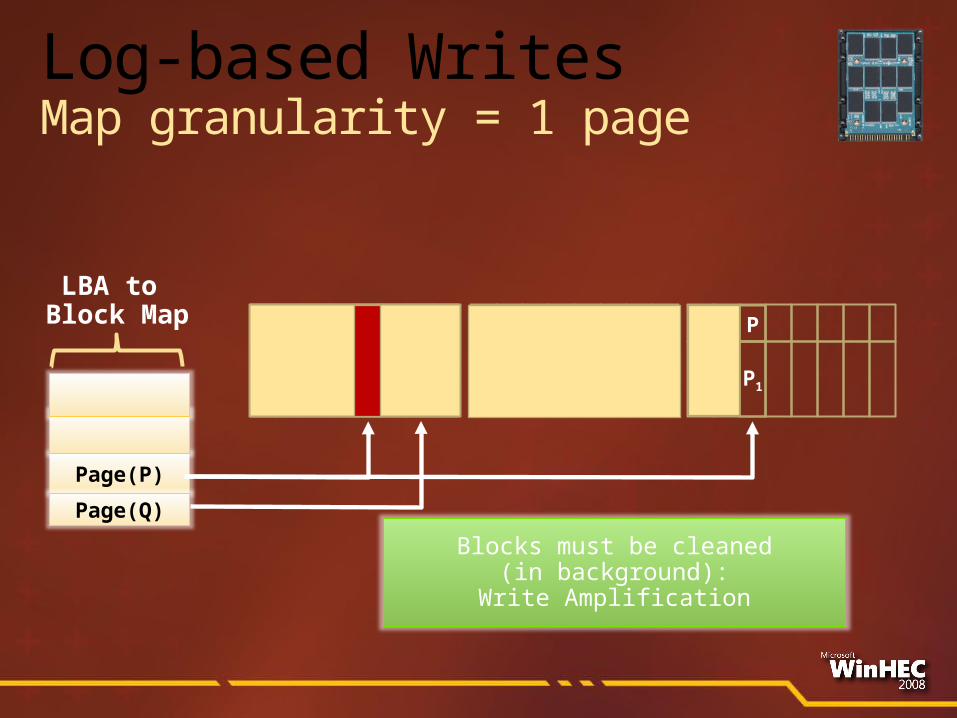
Page(P)
Page(Q)
LBA to Block Map P
P1
Log-based WritesMap granularity = 1 page
Blocks must be cleaned(in background):
Write Amplification
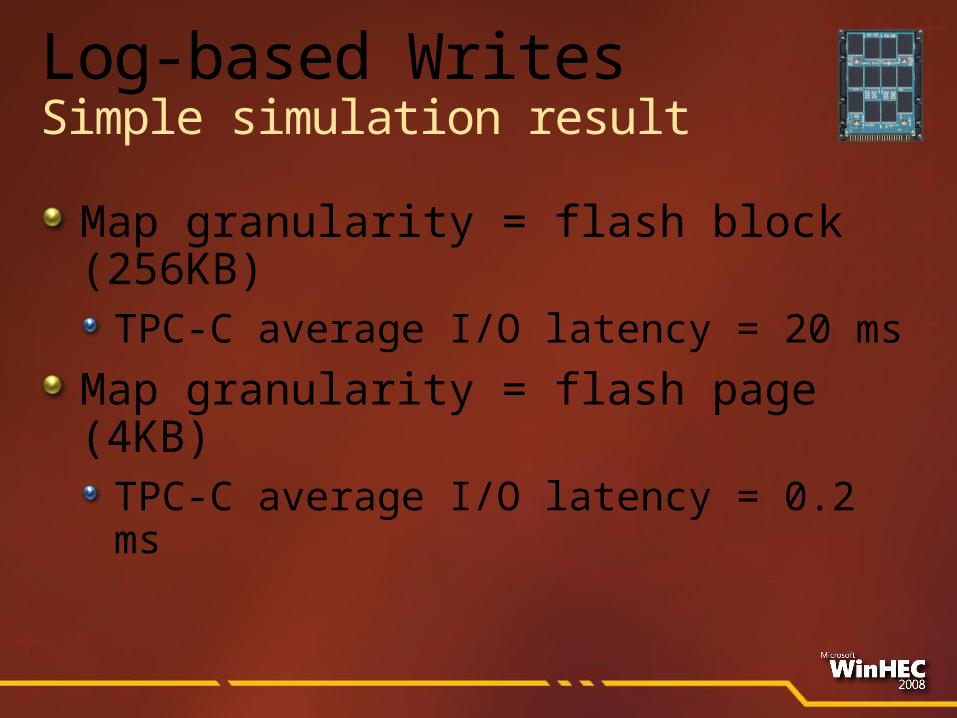
Log-based WritesSimple simulation result
Map granularity = flash block (256KB)
TPC-C average I/O latency = 20 ms
Map granularity = flash page (4KB)TPC-C average I/O latency = 0.2 ms
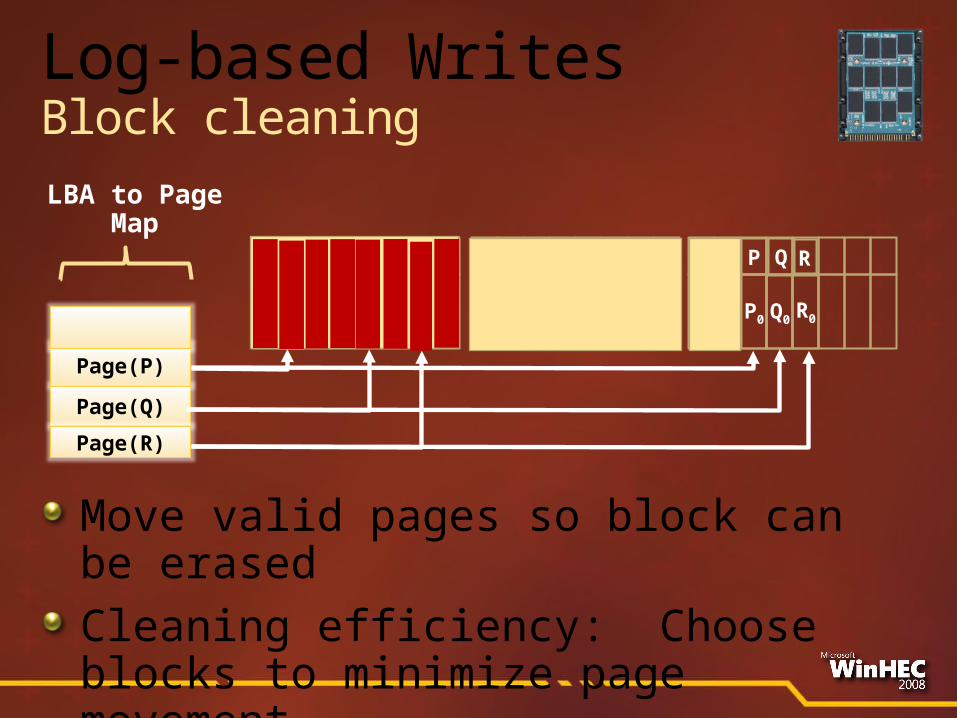
P Q R
Q0
Page(Q)
Page(R)
Page(P)
LBA to Page Map
P
P0
Log-based WritesBlock cleaning
Move valid pages so block can be erasedCleaning efficiency: Choose blocks to minimize page movement
R0P0
Q R
Q0
R0
Over-provisioningPutting off the work
Keep extra (unadvertised) blocksReduces “pressure” for cleaningImproves foreground latencyReduces write-amplification due to cleaning
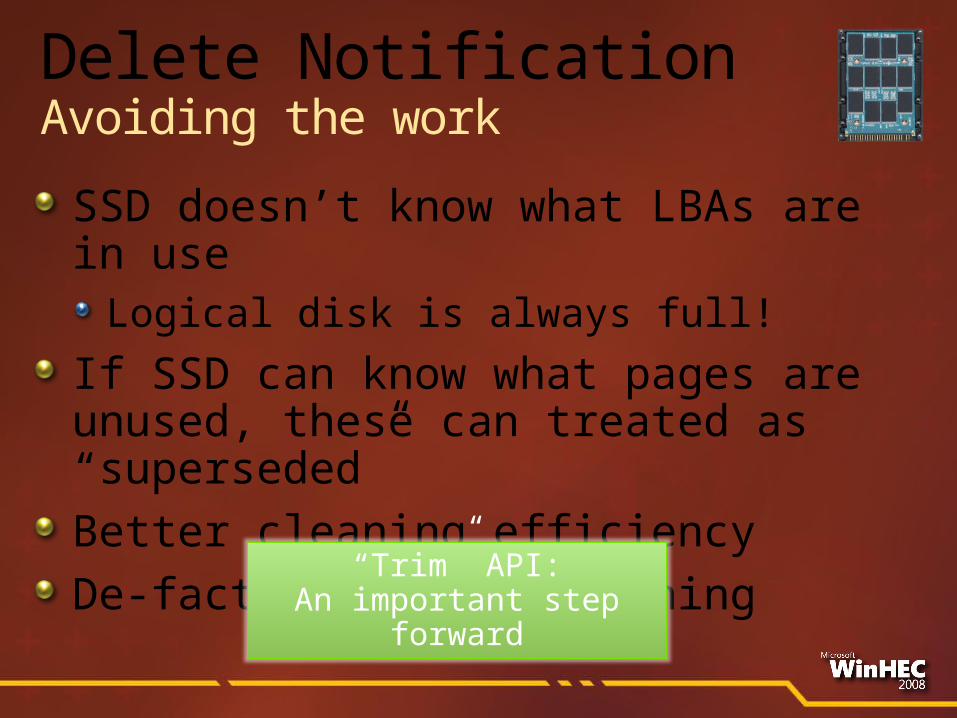
SSD doesn’t know what LBAs are in use
Logical disk is always full!
If SSD can know what pages are unused, these can treated as “superseded”Better cleaning efficiencyDe-facto over-provisioning
Delete NotificationAvoiding the work
“Trim” API:An important step
forward
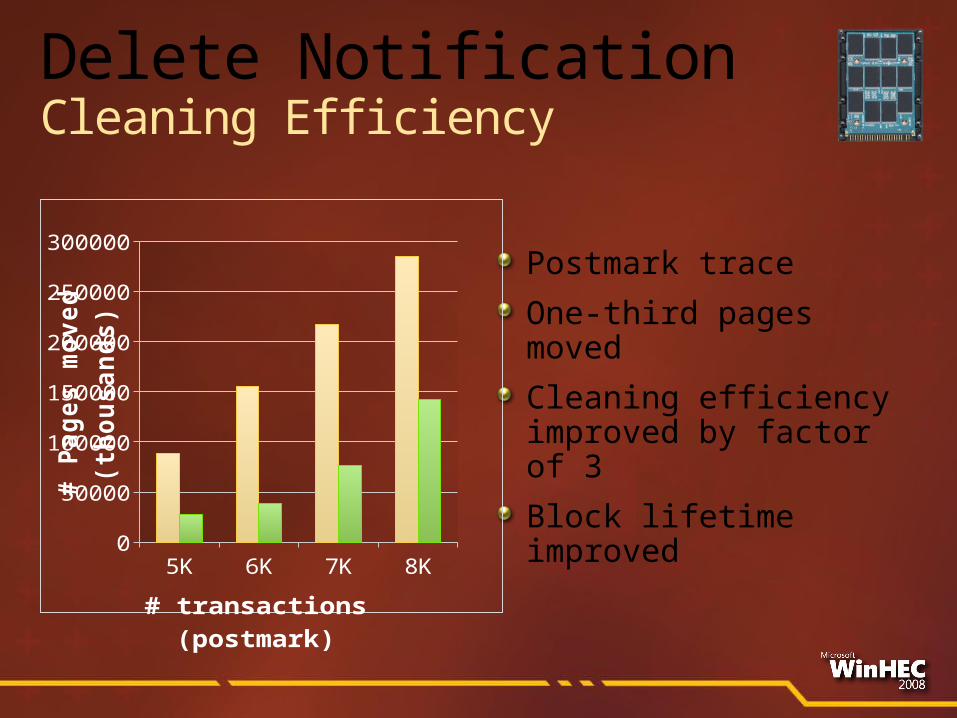
Postmark trace
One-third pages moved
Cleaning efficiency improved by factor of 3
Block lifetime improved
5K 6K 7K 8K0
50000
100000
150000
200000
250000
300000without free info with free info
# transactions (postmark)
# P
ag
es m
oved
(t-
ho
usan
ds)
Delete NotificationCleaning Efficiency
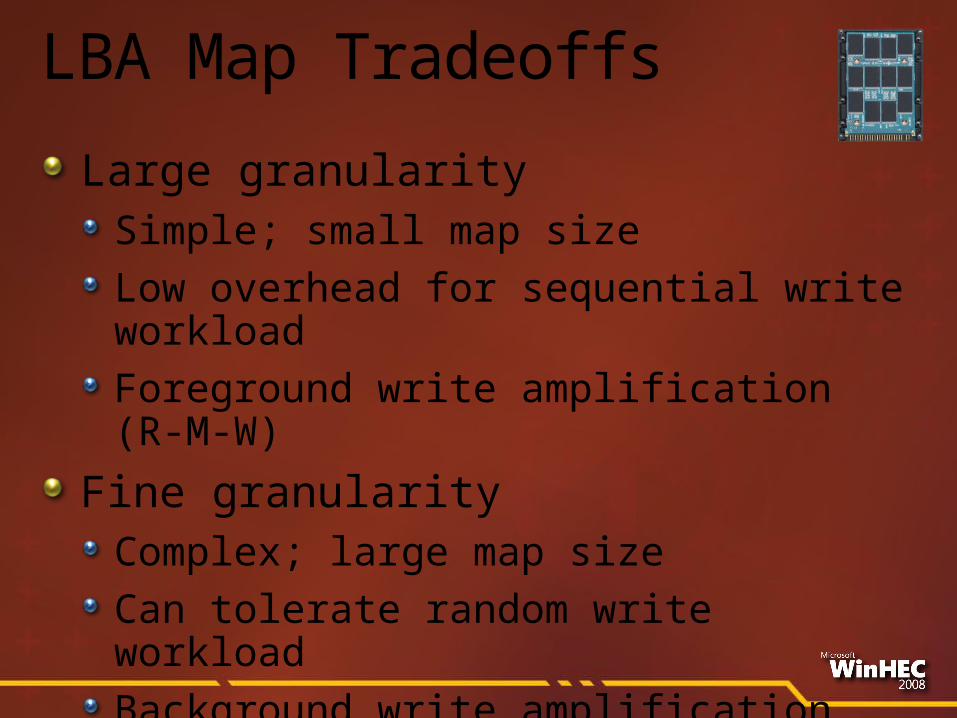
LBA Map Tradeoffs
Large granularitySimple; small map sizeLow overhead for sequential write workloadForeground write amplification (R-M-W)
Fine granularityComplex; large map sizeCan tolerate random write workload Background write amplification (cleaning)
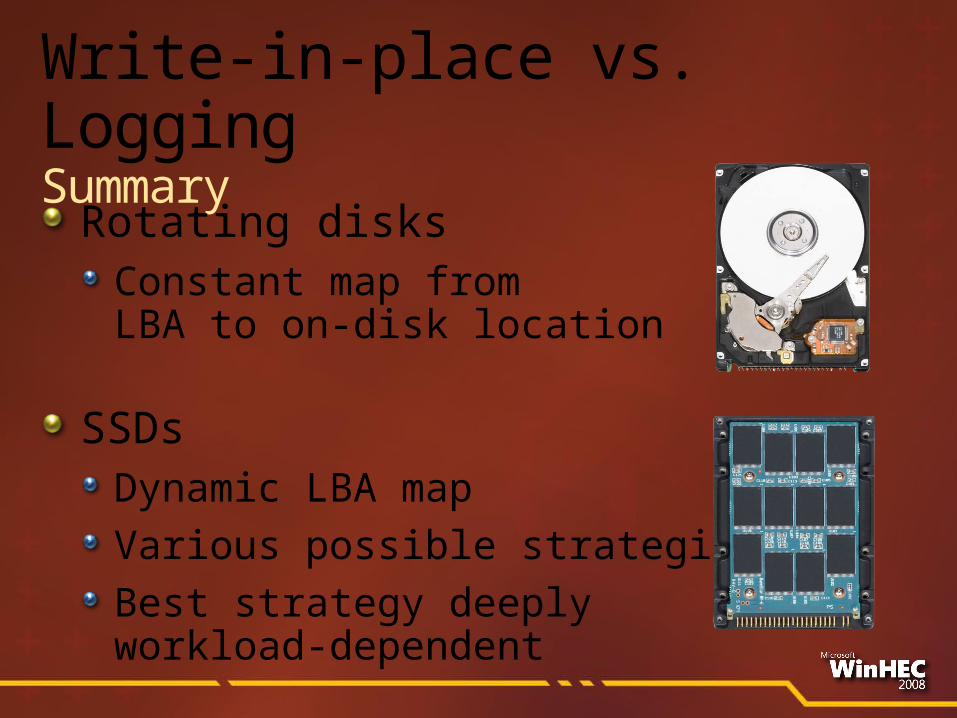
Write-in-place vs. LoggingSummary
Rotating disksConstant map fromLBA to on-disk location
SSDsDynamic LBA mapVarious possible strategiesBest strategy deeply workload-dependent
Moving Parts vs. Parallelism
(How many IOPS can I get?)
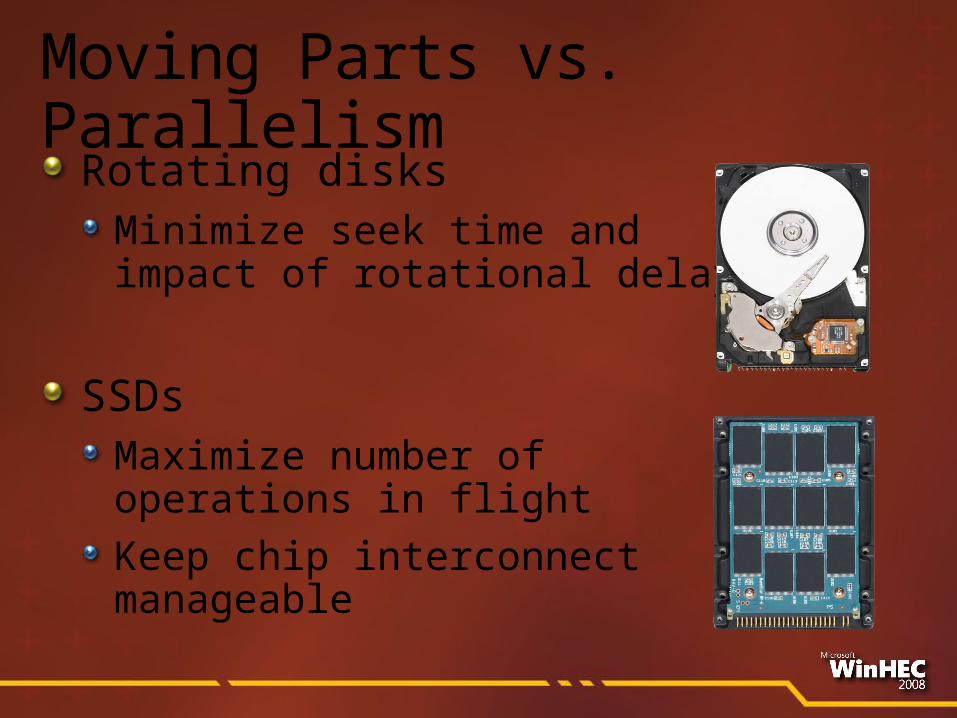
Moving Parts vs. Parallelism
Rotating disksMinimize seek time andimpact of rotational delay
SSDsMaximize number ofoperations in flightKeep chip interconnect manageable
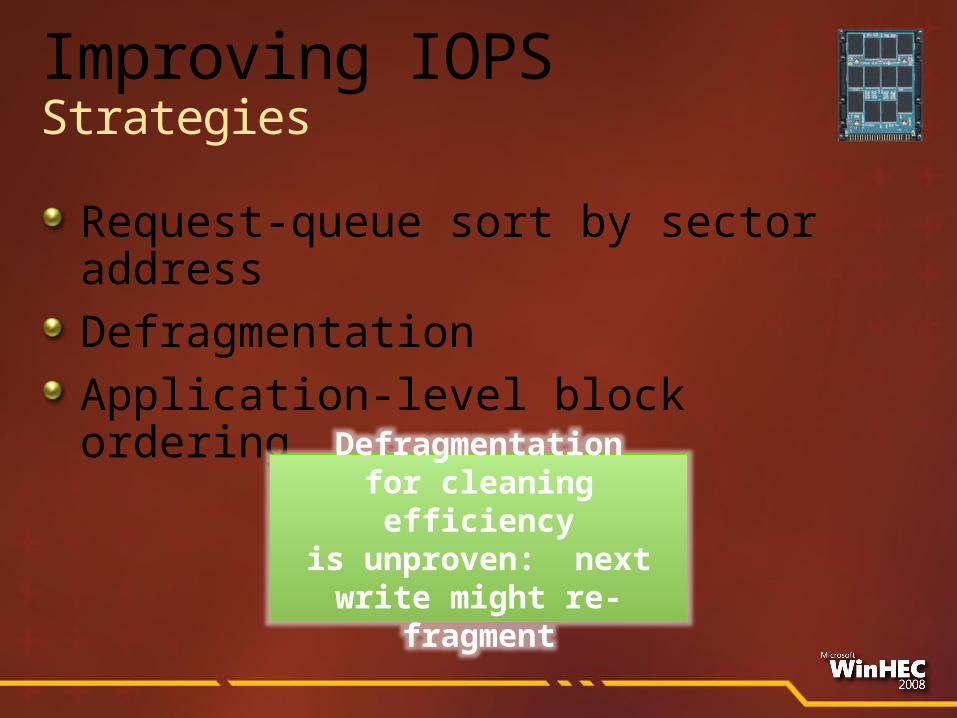
Improving IOPSStrategies
Request-queue sort by sector addressDefragmentationApplication-level block ordering
One request at a time
per disk headNull seek time
Defragmentationfor cleaning efficiency
is unproven: next write might re-
fragment
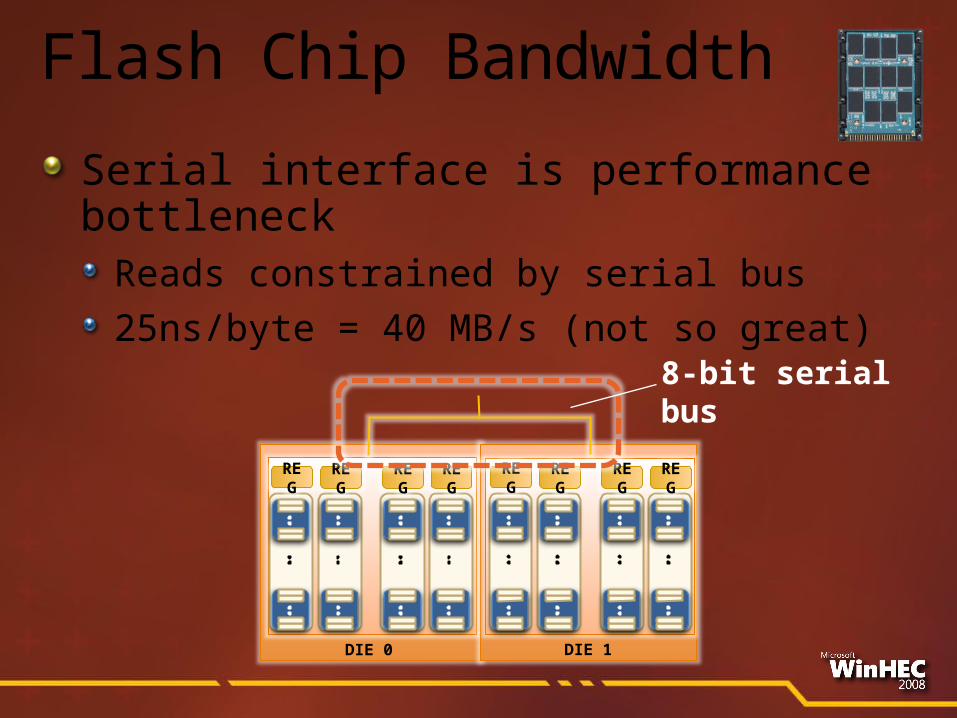
Flash Chip Bandwidth
Serial interface is performance bottleneck
Reads constrained by serial bus
25ns/byte = 40 MB/s (not so great)8-bit serial bus
REG
DIE 0
REG
REG
REG
REG
DIE 1
REG
REG
REG
SSD ParallelismStrategies
StripingMultiple “channels” to hostBackground cleaningOperation interleavingGanging of flash chips
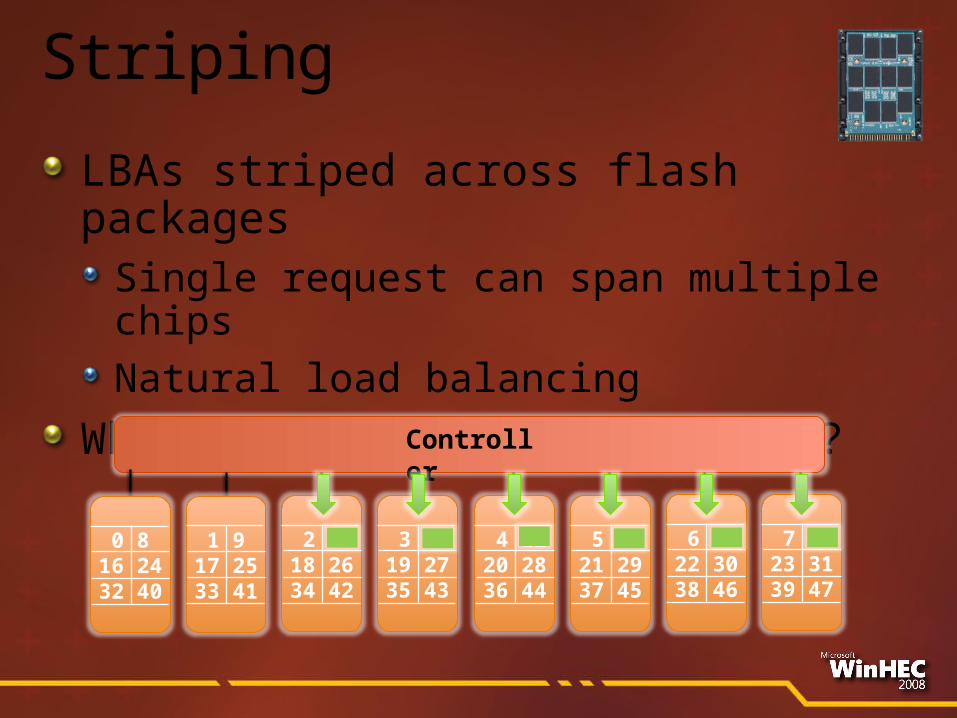
Striping
LBAs striped across flash packagesSingle request can span multiple chipsNatural load balancing
What’s the right stripe size?
Controller
0 816 24 32 40
1 917 25 33 41
2 1018 26 34 42
3 1119 27 35 43
4 1220 28 36 44
5 1321 29 37 45
6 1422 30 38 46
7 1523 31 39 47
Operations in Parallel
SSDs are akin to RAID controllersMultiple onboard parallel elements
Multiple request streams are needed to achieve maximal bandwidthCleaning on inactive flash elements
Non-trivial scheduling issuesMuch like “Log-Structured File System”, but at a lower level of the storage stack
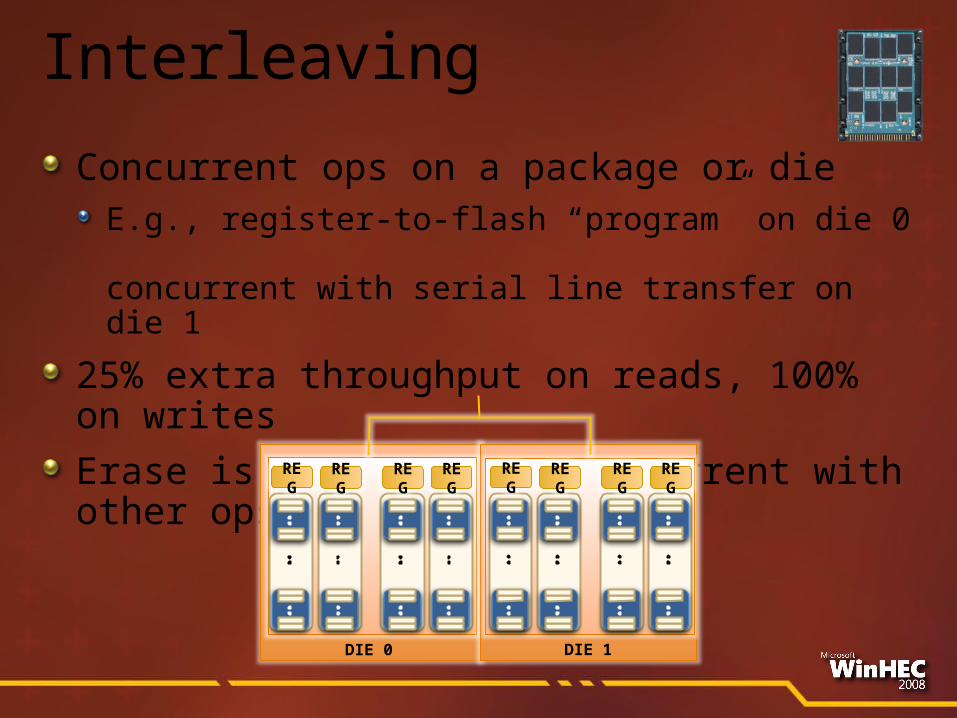
Interleaving
Concurrent ops on a package or dieE.g., register-to-flash “program” on die 0 concurrent with serial line transfer on die 1
25% extra throughput on reads, 100% on writes
Erase is slow, can be concurrent with other ops R
EG
DIE 0
REG
REG
REG
REG
DIE 1
REG
REG
REG
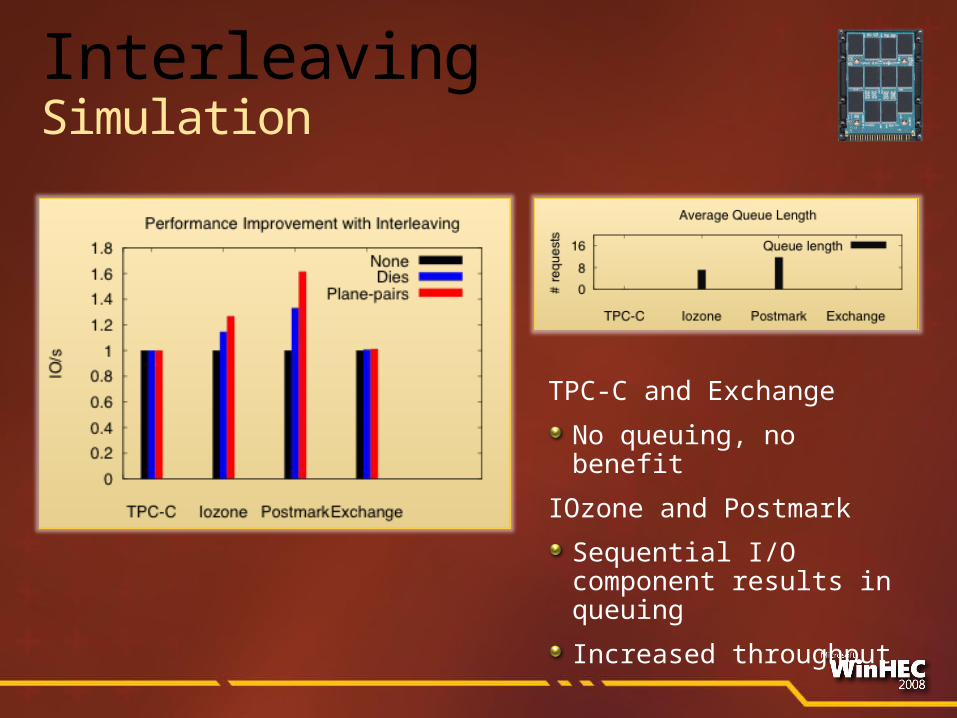
InterleavingSimulation
TPC-C and Exchange
No queuing, no benefit
IOzone and Postmark
Sequential I/O component results in queuing
Increased throughput
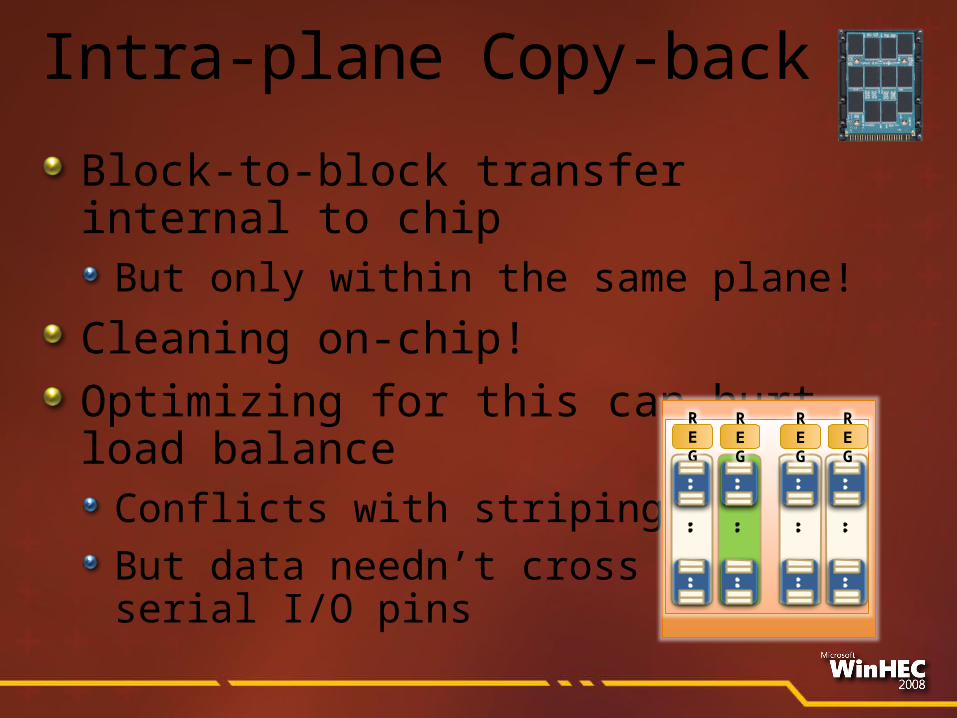
Intra-plane Copy-back
Block-to-block transfer internal to chip
But only within the same plane!
Cleaning on-chip!Optimizing for this can hurt load balance
Conflicts with stripingBut data needn’t crossserial I/O pins
REG
REG
REG
REG
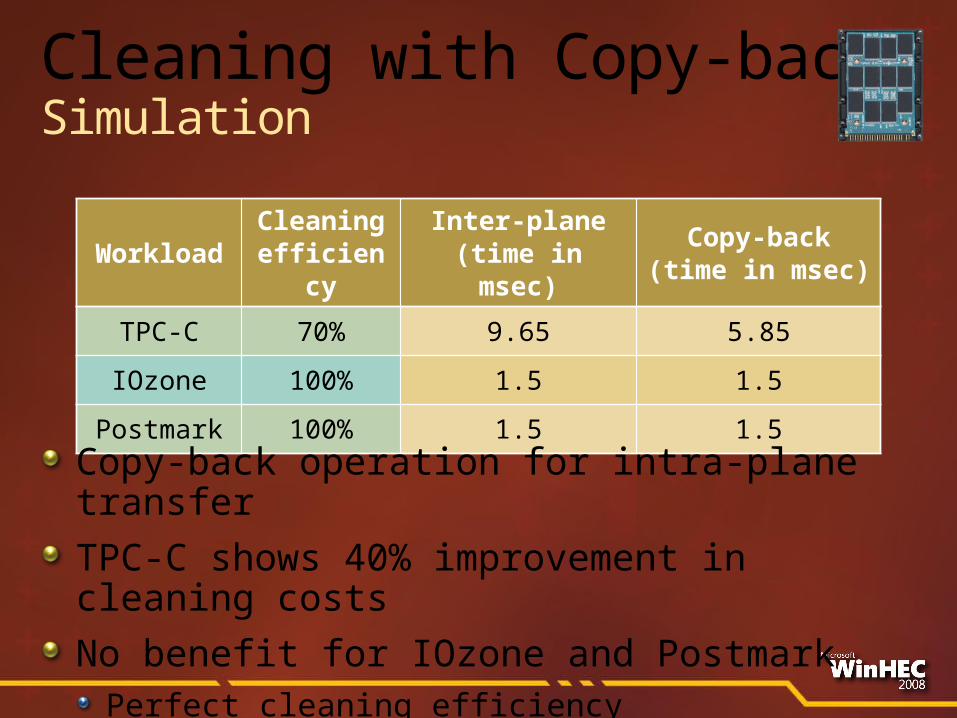
WorkloadCleaning efficienc
y
Inter-plane(time in msec)
Copy-back(time in msec)
TPC-C 70% 9.65 5.85
IOzone 100% 1.5 1.5
Postmark 100% 1.5 1.5
Cleaning with Copy-backSimulation
Copy-back operation for intra-plane transfer
TPC-C shows 40% improvement in cleaning costs
No benefit for IOzone and PostmarkPerfect cleaning efficiency
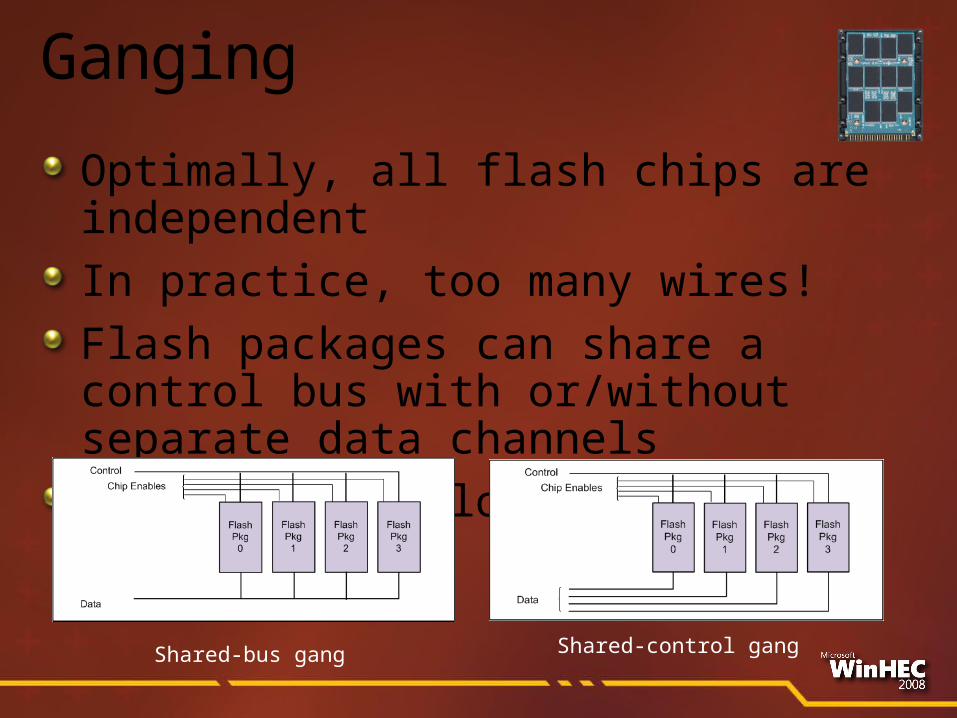
Ganging
Optimally, all flash chips are independentIn practice, too many wires!Flash packages can share a control bus with or/without separate data channelsOperations in lock-step or coordinated
Shared-bus gang Shared-control gang
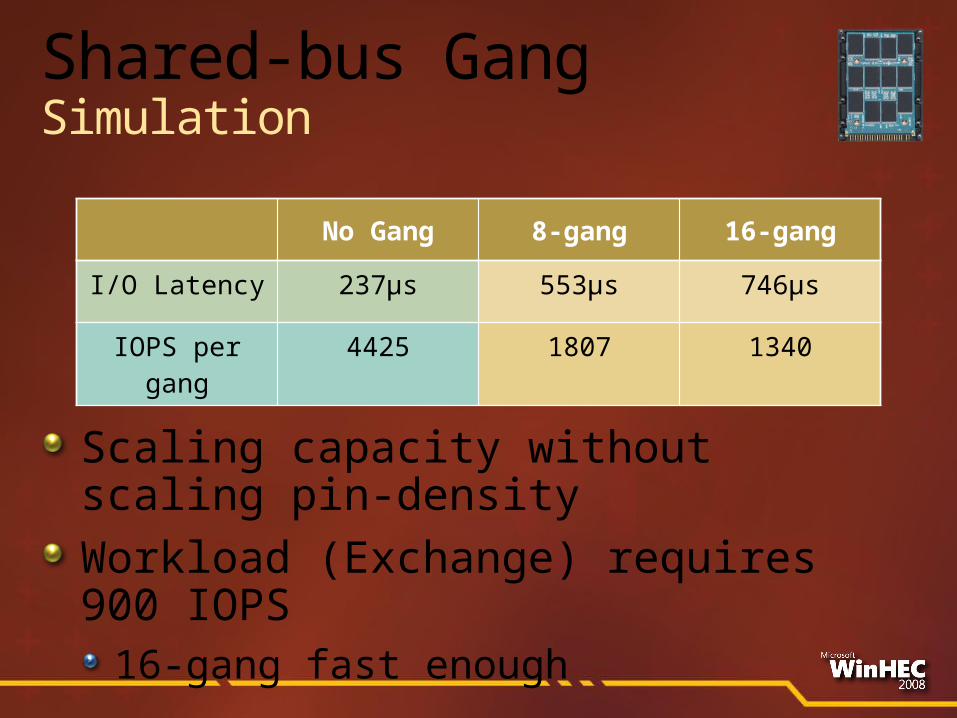
Shared-bus GangSimulation
Scaling capacity without scaling pin-densityWorkload (Exchange) requires 900 IOPS
16-gang fast enough
No Gang 8-gang 16-gang
I/O Latency 237μs 553μs 746μs
IOPS per gang
4425 1807 1340
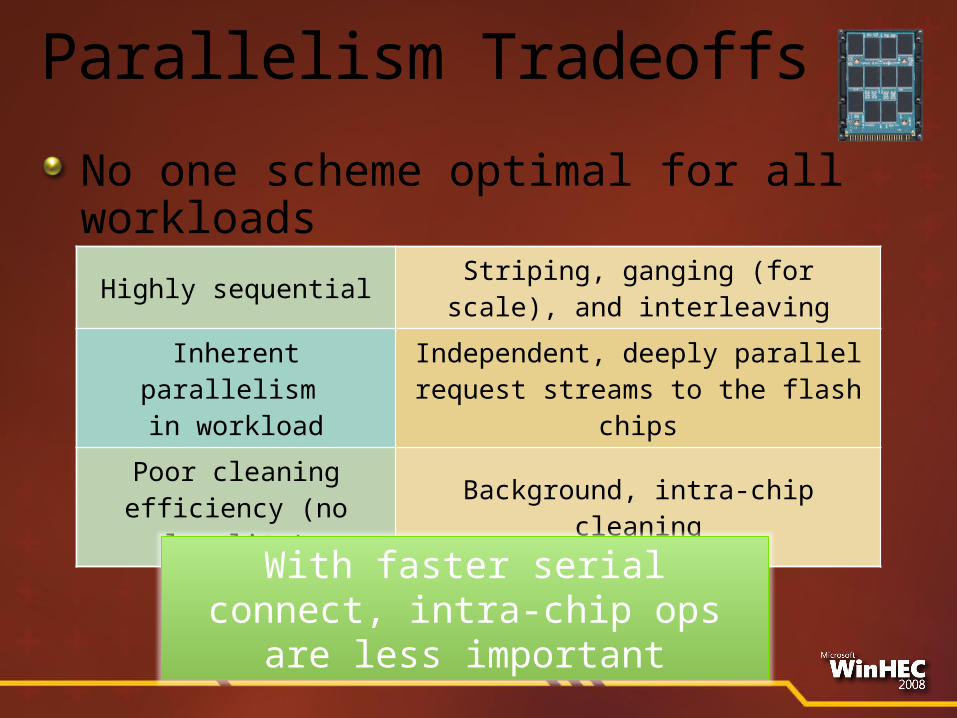
Parallelism Tradeoffs
No one scheme optimal for all workloads
Highly sequential Striping, ganging (for scale), and interleaving
Inherent parallelism in workload
Independent, deeply parallel request streams to the flash chips
Poor cleaning efficiency (no locality)
Background, intra-chip cleaning
With faster serial connect, intra-chip ops are less
important
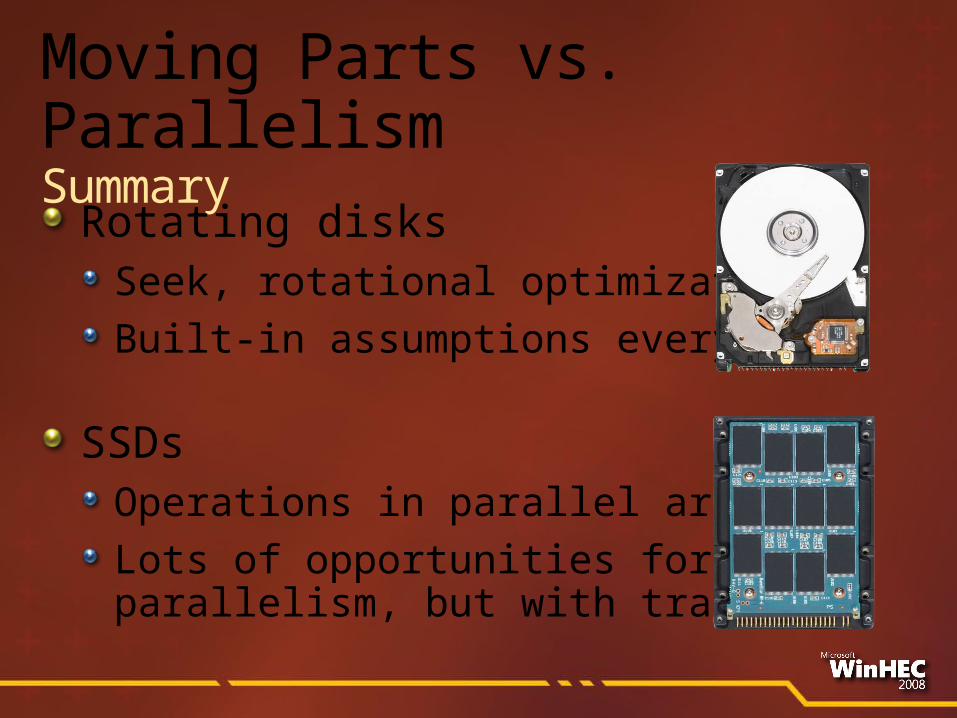
Moving Parts vs. ParallelismSummary
Rotating disksSeek, rotational optimizationBuilt-in assumptions everywhere
SSDsOperations in parallel are keyLots of opportunities forparallelism, but with tradeoffs
Failure Modes(When will it wear out?)
Failure ModesRotating disks
Media imperfections, loose particles, vibration
Latent sector errors [Bairavasundaram 07]E.g., with uncorrectable ECC
Frequency of affected disks increases linearly with time
Most affected disks (80%) have < 50 errors
Temporal and spatial locality
Correlation with recovered errors
Disk scrubbing helps
Failure ModesSSDs
Types of NAND flash errors (mostly when erases > wear limit)
Write errors: Probability varies with # of erasures
Read disturb: Increases with # of reads
Data retention errors: Charge leaks over time
Little spatial or temporal locality(within equally worn blocks)
Better ECC can help
Errors increase with wear: Need wear-leveling
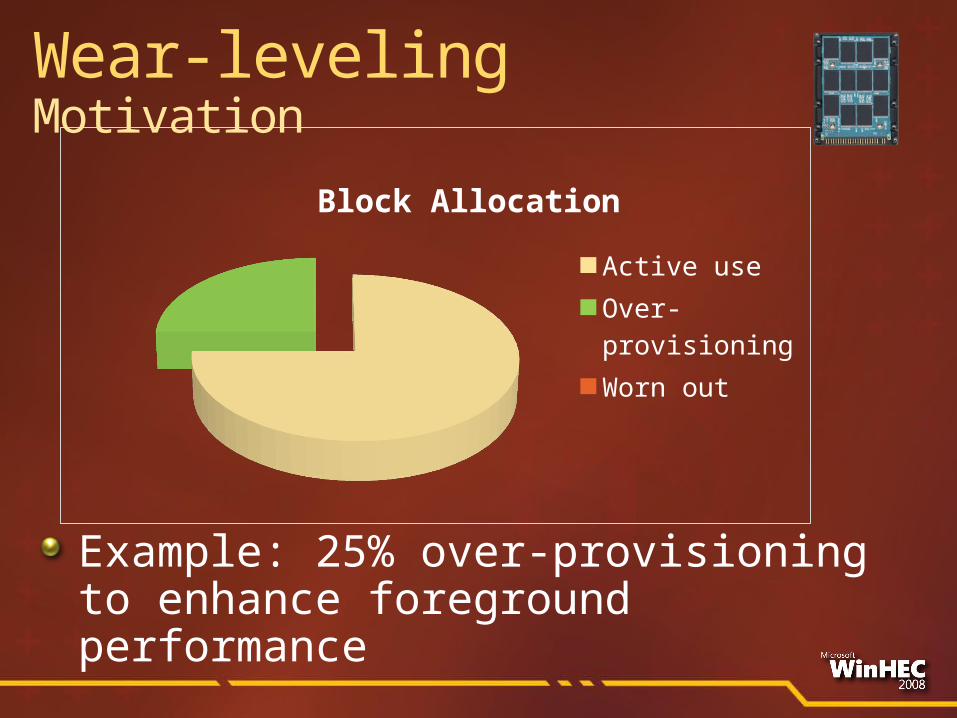
Block Allocation
Active useOver-provision-ingWorn out
Example: 25% over-provisioning to enhance foreground performance
Wear-levelingMotivation
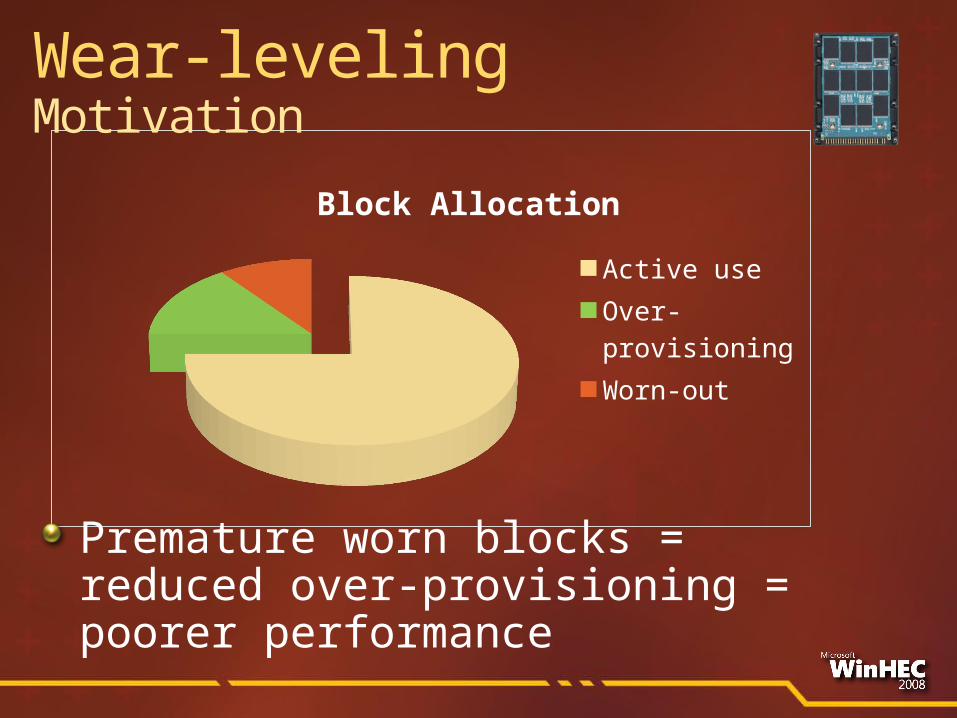
Block Allocation
Active useOver-provision-ingWorn-out
Premature worn blocks = reduced over-provisioning = poorer performance
Wear-levelingMotivation

Block Allocation
Active useOver-provision-ingWorn-out
Over-provisioning budget consumed : writes no longer possible!Must ensure even wear
Wear-levelingMotivation
P0Q0 R0
Q R
Q0 R0
Q R
Block A
Cold content
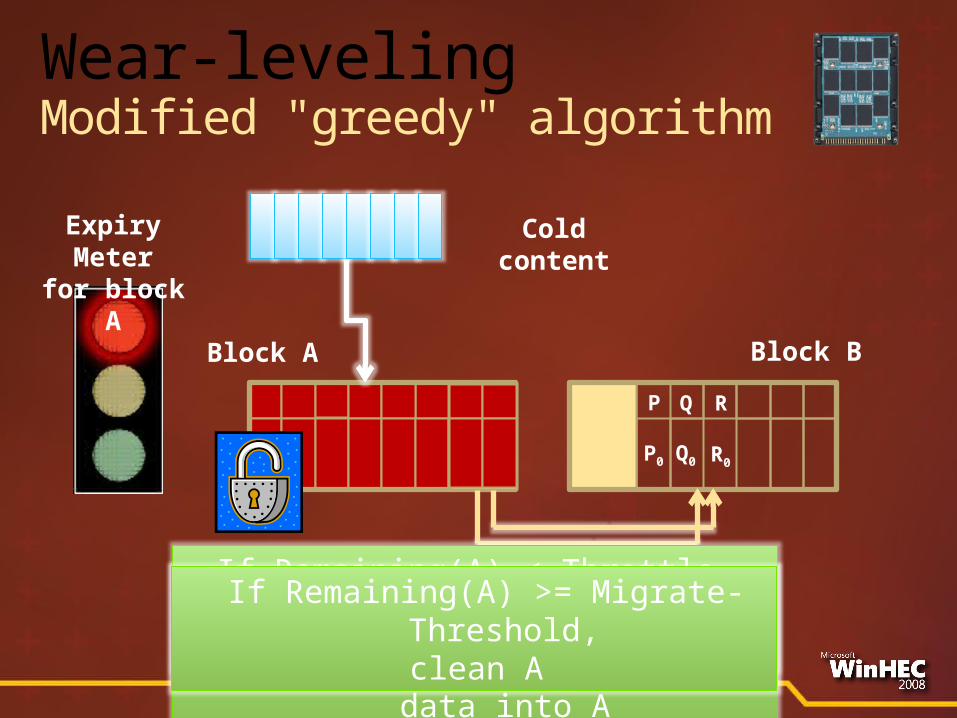
If Remaining(A) < Migrate-Threshold,
clean A, but migrate cold data into A
If Remaining(A) < Throttle-Threshold, reduce probability of cleaning A
Expiry Meter
for block A
P
Block B
If Remaining(A) >= Migrate-Threshold,clean A
Wear-levelingModified "greedy" algorithm
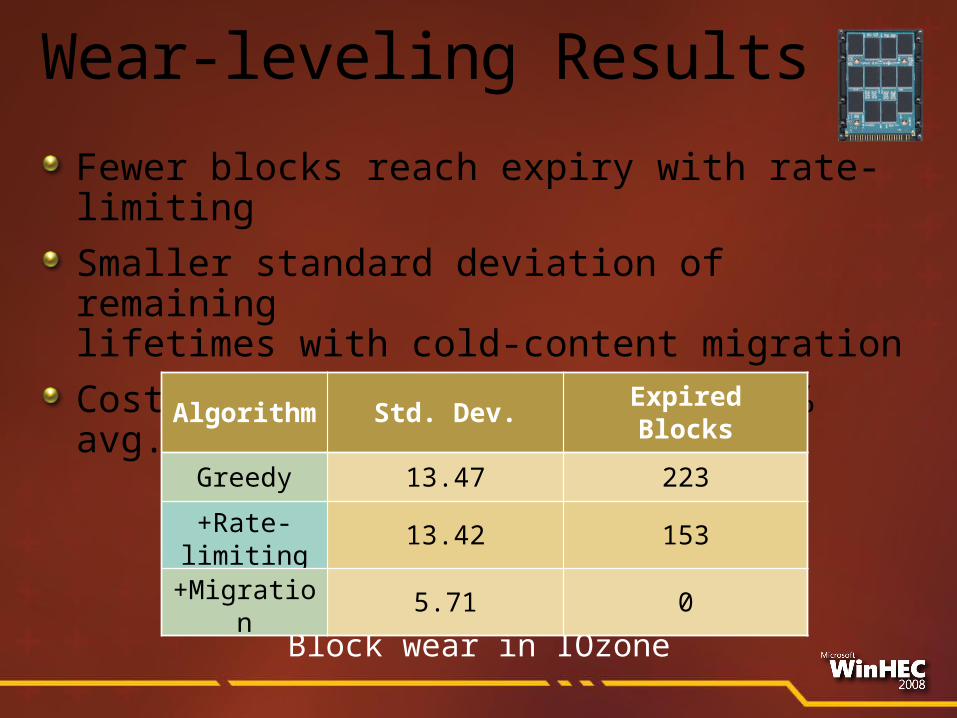
Wear-leveling Results
Fewer blocks reach expiry with rate-limiting
Smaller standard deviation of remaining lifetimes with cold-content migration
Cost to migrating cold pages (~5% avg. latency)
Block wear in IOzone
Algorithm Std. Dev. Expired
Blocks
Greedy 13.47 223
+Rate-limiting 13.42 153
+Migration 5.71 0
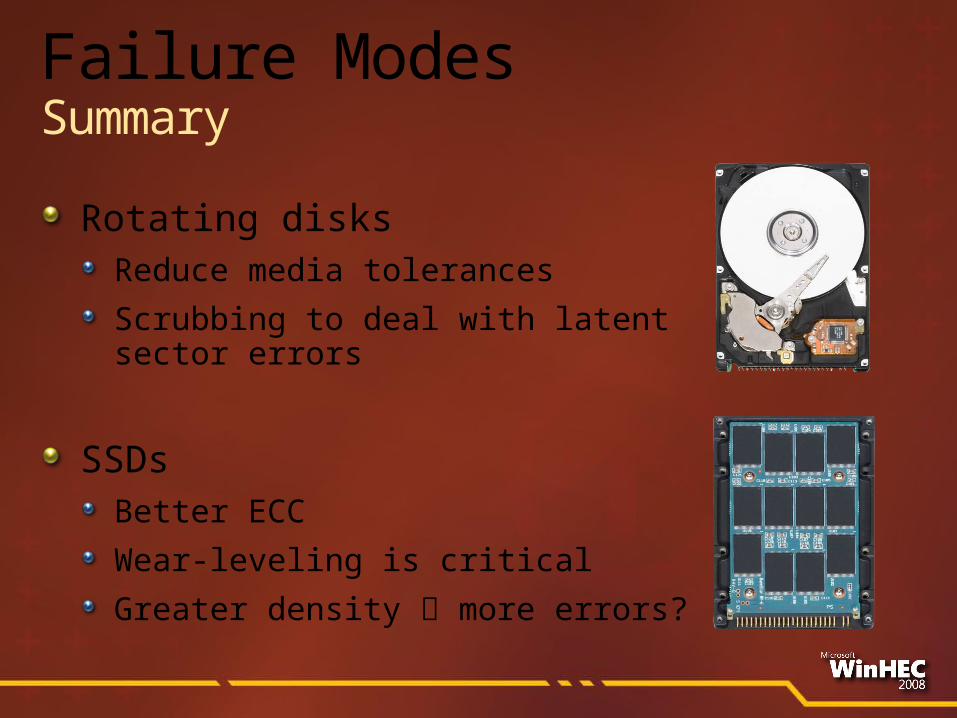
Failure ModesSummary
Rotating disksReduce media tolerances
Scrubbing to deal with latentsector errors
SSDsBetter ECC
Wear-leveling is critical
Greater density more errors?
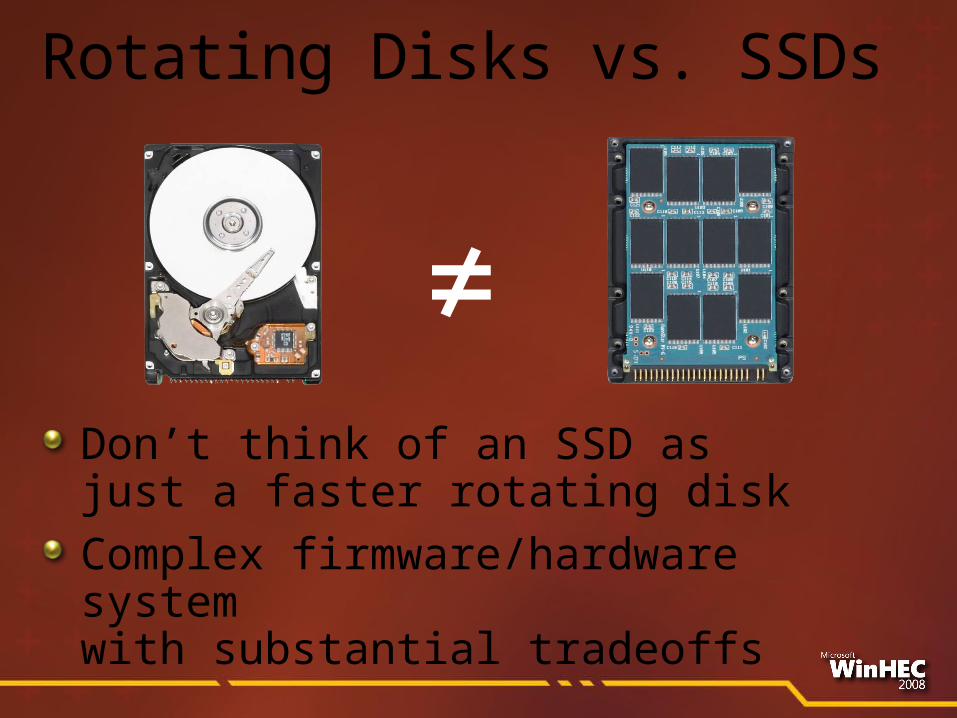
Rotating Disks vs. SSDs
Don’t think of an SSD as just a faster rotating diskComplex firmware/hardware system with substantial tradeoffs
≠
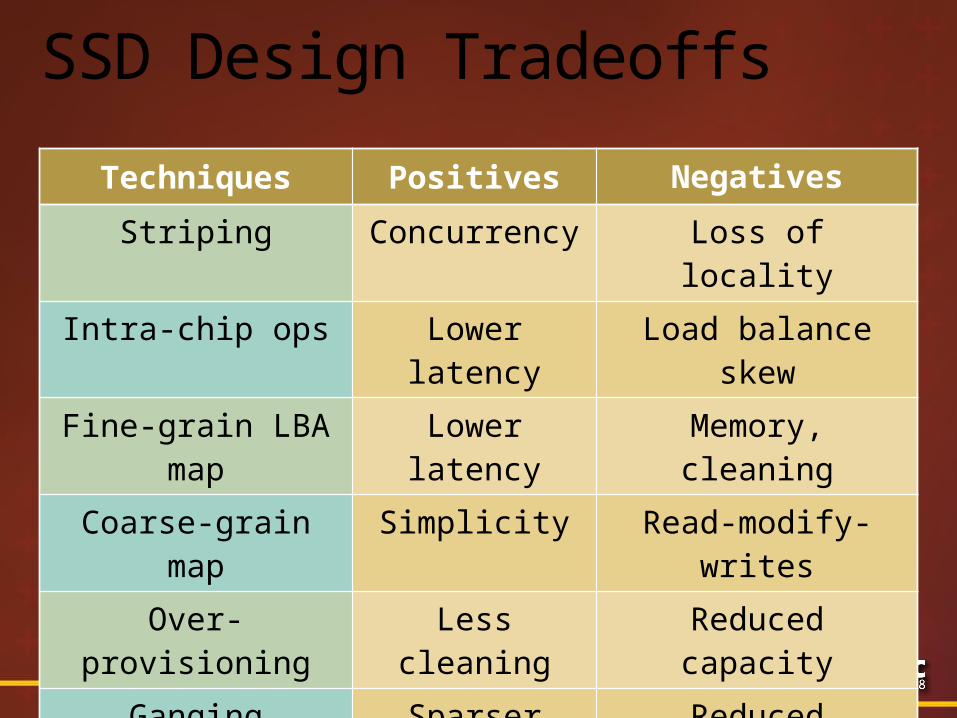
SSD Design Tradeoffs
Write amplification more wear
Techniques Positives Negatives
Striping Concurrency Loss of locality
Intra-chip ops Lower latency Load balance skew
Fine-grain LBA map
Lower latency Memory, cleaning
Coarse-grain map Simplicity Read-modify-writes
Over-provisioning Less cleaning Reduced capacity
Ganging Sparser wiring
Reduced bandwidth
Call To Action
Users need help in rationalizing workload-sensitive SSD performance
Operation latencyBandwidthPersistence
One size doesn’t fit all… manufacturers should help users determine the right fitOpen the “black box” a bit
Need software-visible metrics

Thanks for your attention!
Additional Resources
USENIX paper:http://research.microsoft.com/users/vijayanp/papers/ssd-usenix08.pdfSSD Simulator download:http://research.microsoft.com/downloadsRelated Sessions
ENT-C628: Solid State Storage in Server and Data Center Environments (2pm, 11/5)

© 2008 Microsoft Corporation. All rights reserved. Microsoft, Windows, Windows Vista and other product names are or may be registered trademarks and/or trademarks in the U.S. and/or other countries.
The information herein is for informational purposes only and represents the current view of Microsoft Corporation as of the date of this presentation. Because Microsoft must respond to changing market conditions, it should not be interpreted to be a commitment on the part of Microsoft, and Microsoft cannot guarantee the accuracy of any information provided after
the date of this presentation. MICROSOFT MAKES NO WARRANTIES, EXPRESS, IMPLIED OR STATUTORY, AS TO THE INFORMATION IN THIS PRESENTATION.
Recommended