1
BPCL Mumbai RefineryBPCL Mumbai Refinery
Pre-Conference on “Benchmarking in Downstream Industries”.
BPCL experience in Benchmarking and Performance improvement.

2
BPCL Mumbai Refinery.BPCL Mumbai Refinery.
Capacity : 12 MMTPA. Crude Units : 3 FCC’s : 2 , MTBE : 1
Hydrocracker : 1 Diesel Hydrotreater : 1 Integrated LOBS with hydrocracker
unit – First of its kind capable of producing Gr-II Base Oils.

3
Performance Evaluation(Traditional)Performance Evaluation(Traditional)
MOU parameters
1. Crude Thru' put.
2. Distillate yield.
3. Fuel & Loss.
4. Specific Energy Consumption.
5. Safety.
4
Performance EvaluationPerformance Evaluation
Participated in the Asia-Pacific Fuels Refinery performance Analysis conducted by M/s Solomon Associates Inc. in
1996 & 1998.
5
Performance EvaluationPerformance Evaluation
M/s Solomon parameters
1. Process Parameters
a) Refinery Utilization
b) Hydrocarbon Inventory
c) Volumetric expansion Index.
2. Energy Parameter
a) Energy Intensity Index(EII)
6
Performance EvaluationPerformance Evaluation
M/s Solomon parameters
3. Personnel Parameters
a) Equivalent personnel per 100000 EDC.
b) Personnel cost Index in US $/EDC.
4. Maintenance Parameters
a) Maintenance Index
7
Performance EvaluationPerformance Evaluation
M/s Solomon parameters
5. Financial Parameters
a) Cash operating Expenses.
b) Return on Investment
8
Performance EvaluationPerformance Evaluation
M/s BPCL ranking
1st quartile performance in Refinery Utilization Volumetric Expansion index Operational availability of units Return on Investment
2nd quartile performance in Inventory Maintenance Index Mechanical availability of units.
9
Performance EvaluationPerformance Evaluation
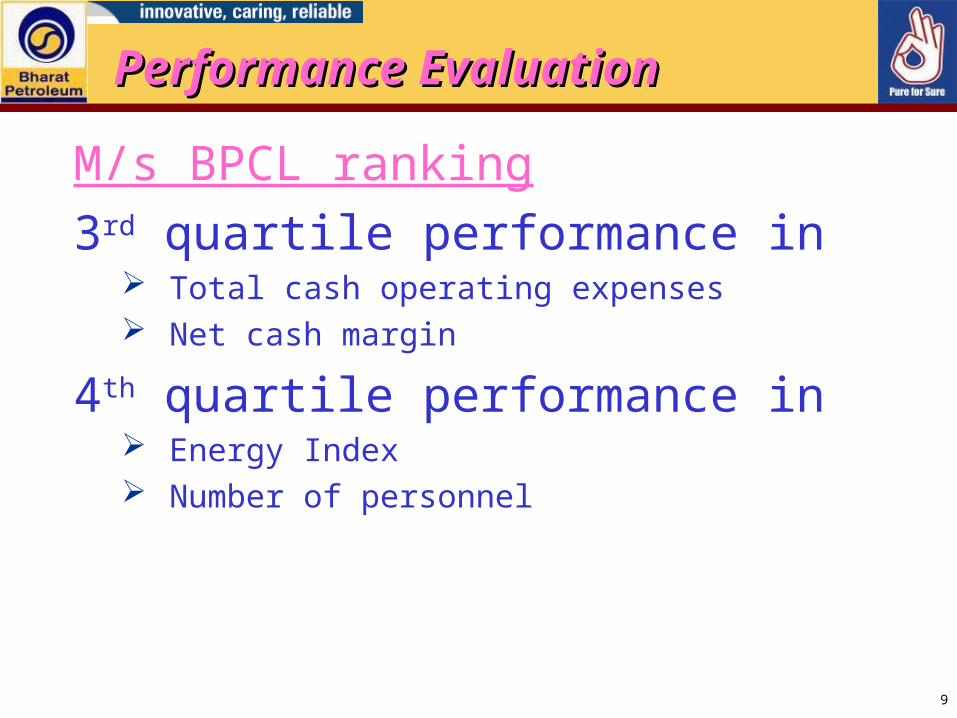
M/s BPCL ranking
3rd quartile performance in Total cash operating expenses Net cash margin
4th quartile performance in Energy Index Number of personnel
10
Performance EvaluationPerformance Evaluation
Participated in the Operational Benchmarking of Indian PSU refineries conducted by M/s Shell Global Solutions Inc. in
2003/04 & 2004/05. (Through Centre for High Technology)

11
Performance EvaluationPerformance Evaluation
M/s SGS parameters1. Energy & Hydrocarbon Loss Management
a) Site CEL Index
b) Energy Index
c) Generation Index
d) Fuel & loss Index
e) Refinery Hydrocarbon Loss(% wt on Intake)
2. Human Resources Managementa) Overall Shell Personnel index
b) Operations Personnel index
c) Maintenance Personnel index
d) Own staff Overtime % of Standard Activities
e) Contractors % of Standard Activities
f) Labour Costs (US $ millions/NSP)
12
Performance EvaluationPerformance Evaluation
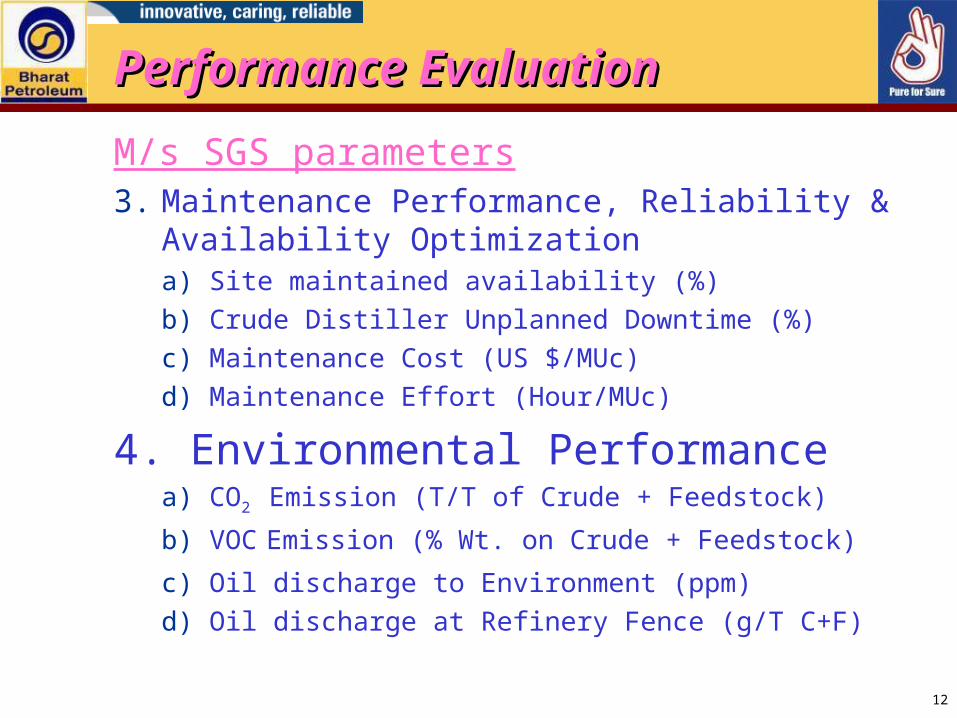
M/s SGS parameters3. Maintenance Performance, Reliability & Availability
Optimizationa) Site maintained availability (%)
b) Crude Distiller Unplanned Downtime (%)
c) Maintenance Cost (US $/MUc)
d) Maintenance Effort (Hour/MUc)
4. Environmental Performancea) CO2 Emission (T/T of Crude + Feedstock)
b) VOC Emission (% Wt. on Crude + Feedstock)
c) Oil discharge to Environment (ppm)
d) Oil discharge at Refinery Fence (g/T C+F)
13
Performance EvaluationPerformance Evaluation
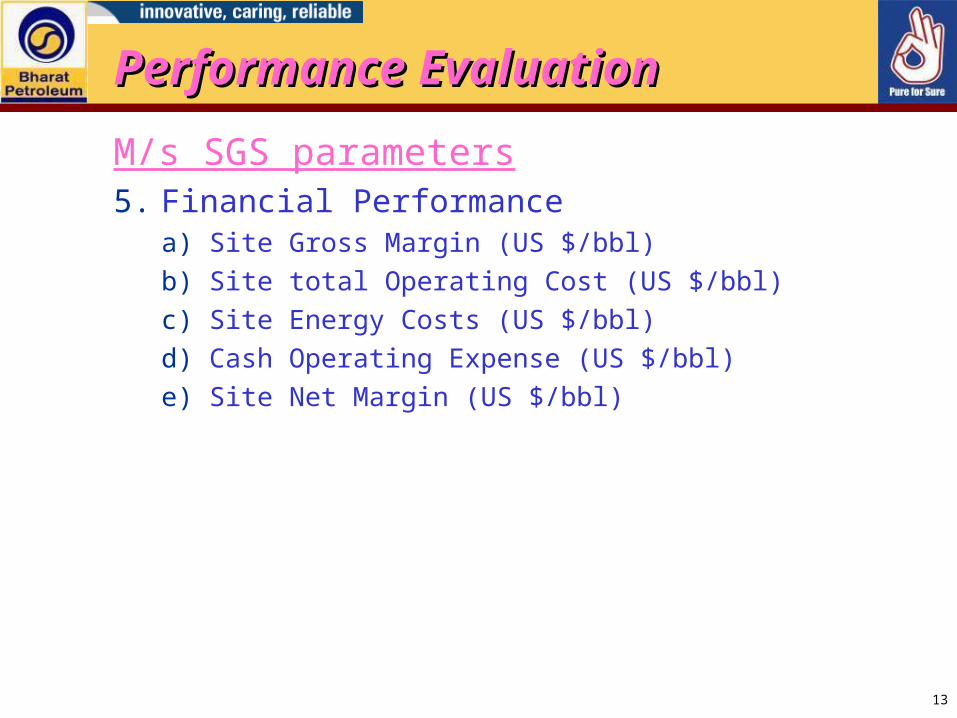
M/s SGS parameters5. Financial Performance
a) Site Gross Margin (US $/bbl)
b) Site total Operating Cost (US $/bbl)
c) Site Energy Costs (US $/bbl)
d) Cash Operating Expense (US $/bbl)
e) Site Net Margin (US $/bbl)

14
14
Shell Global Solutions
Site Efficiency PerformancePeer Group
Total Operating Cost ($/bbl)
Maintenance Costs (US$/MUc)
Unplanned CDU Downtime (%)
Maintained Availability (%)
Labour Cost per NSP ($US million)
Shell Personnel Index
Refinery Loss (% Wt on Intake)
CEL Index
2003 2004FIRST TERCILE indicates best performance
THIRD TERCILE indicates most opportunity to improve
SITE RANKING for current 2004/5 Study period
Performance ComparisonPerformance Comparison
15
16
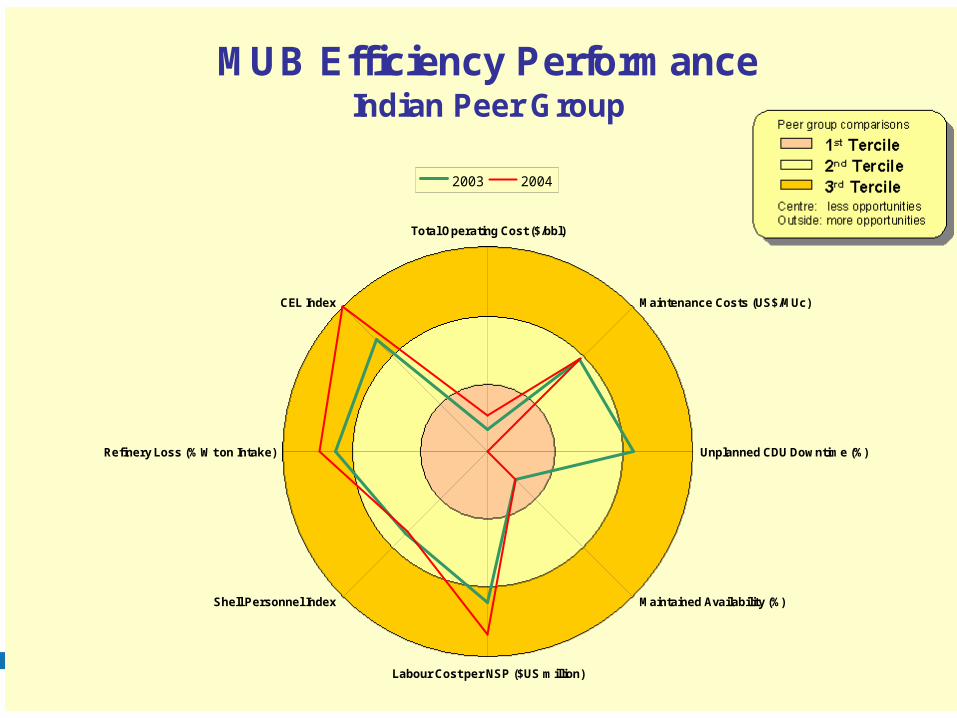
Shell Global Solutions
MUB Efficiency PerformanceIndian Peer Group
Total Operating Cost ($/bbl)
Maintenance Costs (US$/MUc)
Unplanned CDU Downtime (%)
Maintained Availability (%)
Labour Cost per NSP ($US million)
Shell Personnel Index
Refinery Loss (% Wt on Intake)
CEL Index
2003 2004

16
20
Shell Global Solutions
MUB Efficiency PerformanceRegional Peer Group
Total Operating Cost ($/bbl)
Maintenance Costs (US$/MUc)
Unplanned CDU Downtime (%)
Maintained Availability (%)
Labour Cost per NSP ($US million)
Shell Personnel Index
Refinery Loss (% Wt on Intake)
CEL Index
2003 2004

17
24
Shell Global Solutions
MUB Efficiency PerformanceGlobal Peer Group
Total Operating Cost ($/bbl)
Maintenance Costs (US$/MUc)
Unplanned CDU Downtime (%)
Maintained Availability (%)
Labour Cost per NSP ($US million)
Shell Personnel Index
Refinery Loss (% Wt on Intake)
CEL Index
2003 2004
18
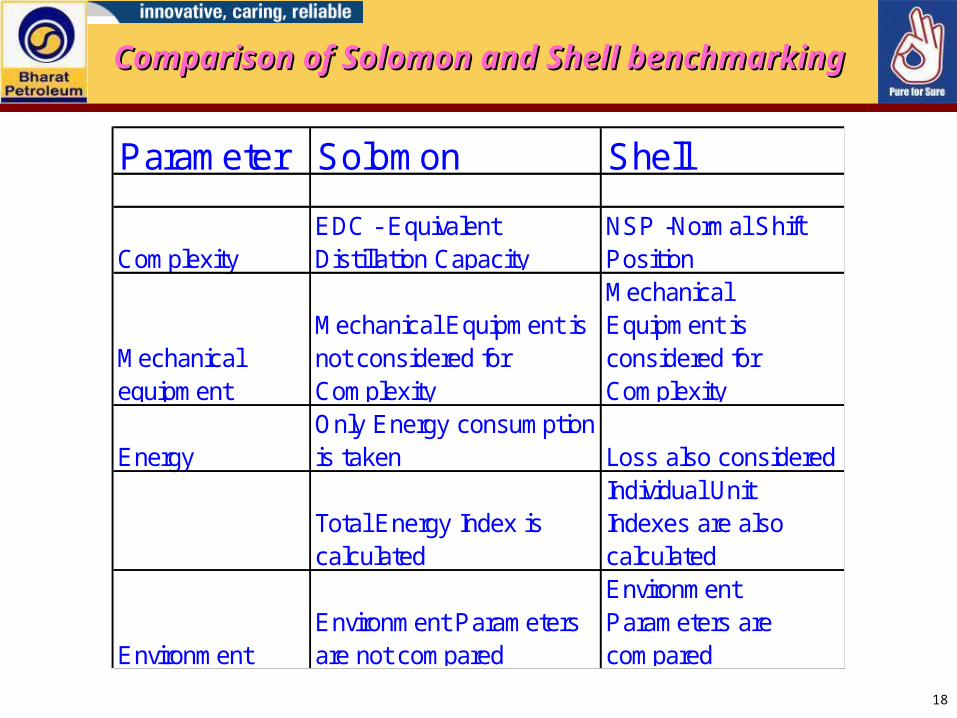
Parameter Solomon Shell
ComplexityEDC - Equivalent Distillation Capacity
NSP -Normal Shift Position
Mechanical equipment
Mechanical Equipment is not considered for Complexity
Mechanical Equipment is considered for Complexity
EnergyOnly Energy consumption is taken Loss also considered
Total Energy Index is calculated
Individual Unit Indexes are also calculated
EnvironmentEnvironment Parameters are not compared
Environment Parameters are compared
Comparison of Solomon and Shell benchmarkingComparison of Solomon and Shell benchmarking
19
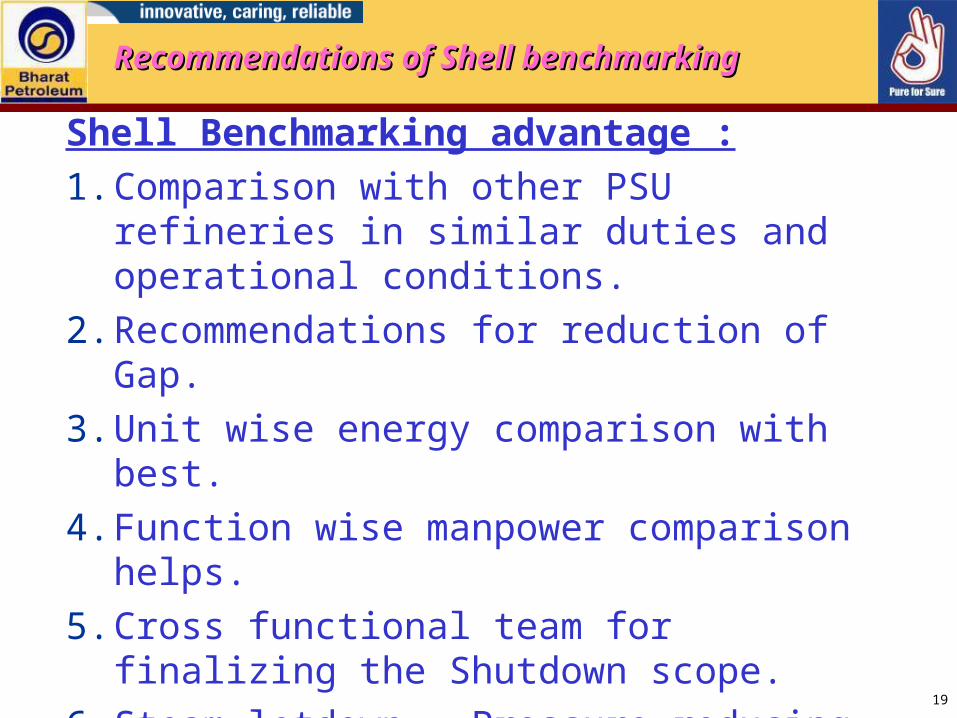
Shell Benchmarking advantage :
1. Comparison with other PSU refineries in similar duties and operational conditions.
2. Recommendations for reduction of Gap.
3. Unit wise energy comparison with best.
4. Function wise manpower comparison helps.
5. Cross functional team for finalizing the Shutdown scope.
6. Steam letdown – Pressure reducing turbine being put up.
7. Strengthening of Advisory / Inspection Dept.
Recommendations of Shell benchmarkingRecommendations of Shell benchmarking
20
Benefits of Benchmarking :
1. Streamlining of the Data collection.
2. Compare with the Regional and Global Peers.
3. GAP identification.
4. GAP reduction by performance improvement.
Performance EvaluationPerformance Evaluation
21
Thank YouThank You
BPCL Mumbai RefineryBPCL Mumbai Refinery
Recommended