1
Effects Of Migration On Sending Countries: What Do We Know And What Can We Do?
10 January 2006
Louka T. Katseli, Robert E.B Lucasand Theodora Xenogiani

2
1. Towards a coherent EU migration-development agenda
Policy Concerns:
Better management of migration flows
Improving migrants’ integration (first and second generation)
Addressing risks and illegality
Policy Coherence: migration, development, security agendas interrelated
3
Relevance of Evaluative Report on Sending Countries:
Better EU migration policies More effective management of EU human
resources Coherence across EU policies Better EU Development cooperation policies Design of differentiated migration-related
policy regimes Partnerships (EU, source and transit
countries)

4
2. Where do EU migrants come from?
Latin America, 4.4%of which
Ecuador: 0.7%Colombia: 0.7%Suriname: 0.6%Brazil: 0.6%Argentina: 0.5% Jamaica: 0.4%Venezuela: 0.4%Peru: 0.3%Chile: 0.2%
Europe
Africa, 13.6% of whichMorocco: 4.5% Nigeria: 0.4% Algeria: 3.9% Senegal: 0.4% Tunisia: 1.3% Somalia: 0.3%Angola: 0.6% Ghana: 0.3%South Africa: 0.6% Dem. Republic ofKenya: 0.4% Congo: 0.3%Egypt: 0.4% Mozambique: 0.2%
Wider Europe 16.4%, of which
Turkey: 5.8% Croatia: 1.0%Serbia-Montenegro: 2.2% Russia: 0.7%Albania: 1.7% Bulgaria: 0.3%Romania: 1.6% Lithuania: 0.3%Ukraine: 1.4% Belarus: 0.3%Bi-H: 1.1%
Asia, 7.0%, of which
India: 1.8%Pakistan: 1.2%Vietnam: 0.8%China: 0.7%Indonesia: 0.6%Bangladesh: 0.5%Philippines: 0.5%Sri Lanka: 0.4%Hong Kong: 0.3%Japan: 0.2%
Middle East, 1.5%of whichIran: 0.7%Iraq: 0.5%Lebanon: 0.3%
Data Source: OECD Database on Expatriates and Immigrants, 2004 (Census Data 1999-2003)

5
Adult migrants in OECD Europe and N. Americaby education level and origin (2000)
Data Source: OECD Database on Expatriates and Immigrants, 2004
Low
MiddleHigh
Low MiddleHigh
Europe America0
5
10
15
Mill
ion
s
Non-OECD
OECD origin
6
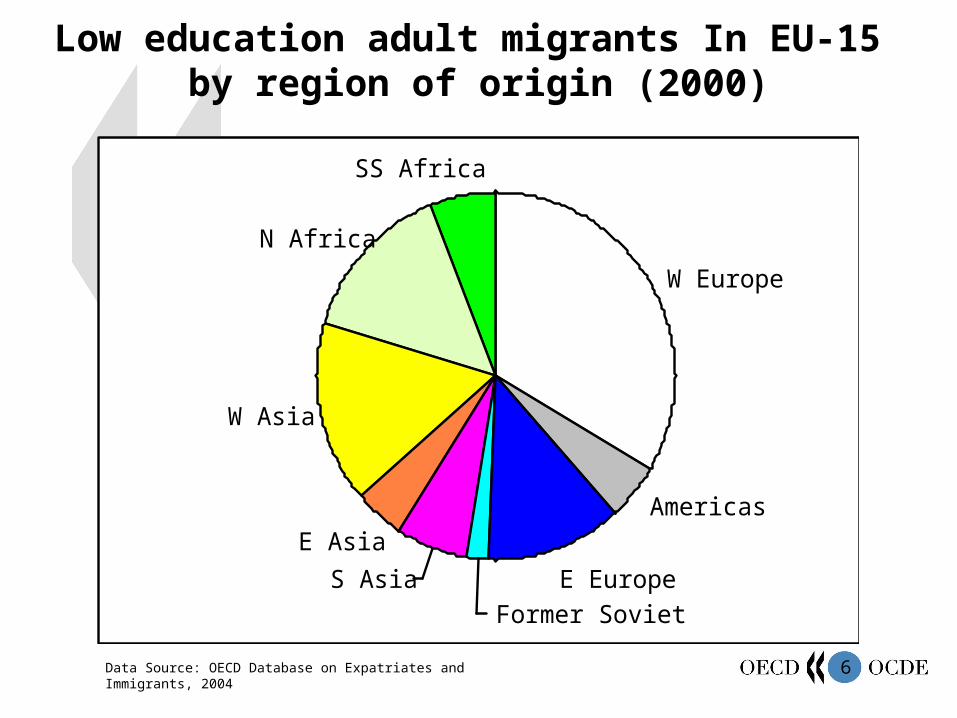
Low education adult migrants In EU-15 by region of origin (2000)
W Europe
Americas
E EuropeFormer Soviet
S Asia
E Asia
W Asia
N Africa
SS Africa
Data Source: OECD Database on Expatriates and Immigrants, 2004

7
Low-skilled migration rate to EU-15 against income level of country (2000)
Data Source: OECD Database on Expatriates and Immigrants, 2004
6 7 8 9 10 11
Log GDP per capita 2000
-6
-5
-4
-3
-2
-1
0
1
2
3
4
5
Lo
g lo
w s
kill
em
igra
tio
n r
ate
to
EU
8
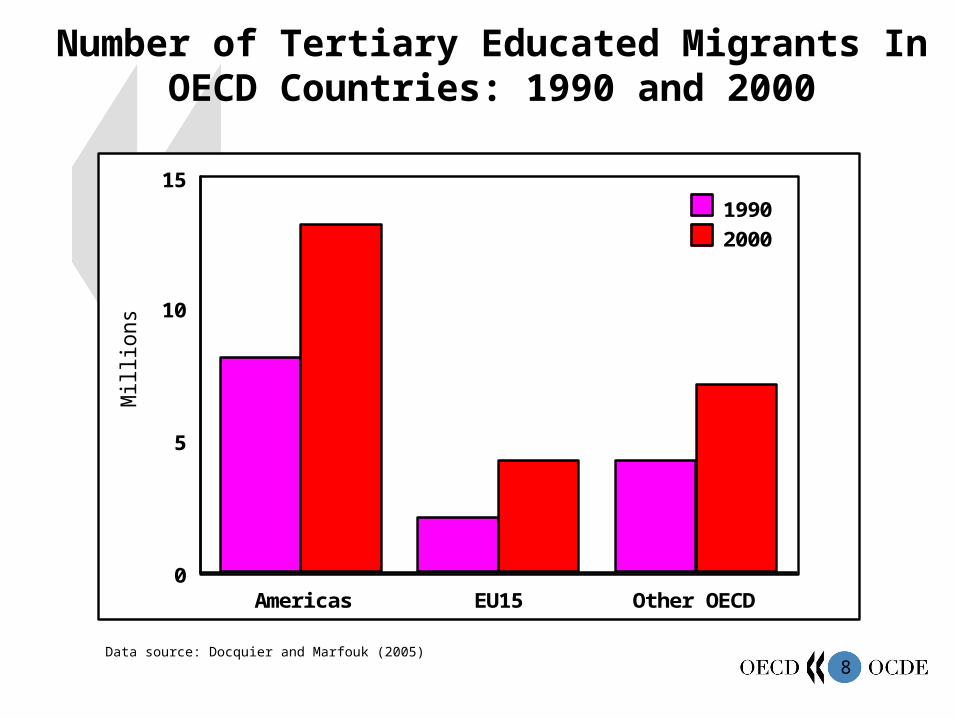
Number of Tertiary Educated Migrants In OECD Countries: 1990 and 2000
Data source: Docquier and Marfouk (2005)
Americas EU15 Other OECD0
5
10
15
Mill
ions
1990
2000
9
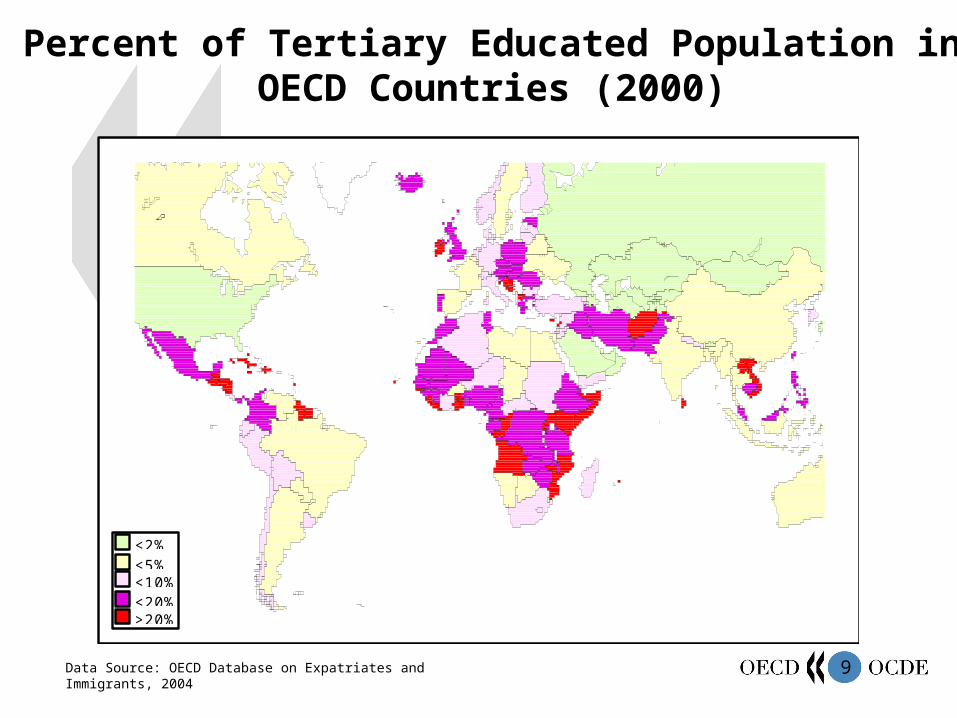
Percent of Tertiary Educated Population in OECD Countries (2000)
<2%<5%<10%<20%>20%
Data Source: OECD Database on Expatriates and Immigrants, 2004

10
Distribution of tertiary educated population from Easter Europe in OECD: 2000
RussiaLatvia
MoldovaUkraine
HungaryPoland
RomaniaBelarusCroatia
Czech RepublicLithuania
AlbaniaSlovenia
EstoniaBosnia and Herzegovi
BulgariaSlovakia
Serbia and MontenegrMacedonia
0 20 40 60 80 100
Percent
Other EuropeEU15 N America

11
Geographic proximity, cultural and colonial ties matter
Dependent Variable: log (Number of people born in country i, living in country j/total population of country i)
Highly skilled UnskilledDummy=l if common offical language in the 2 countries 3.002 2.700
(0.304)** (0.362)**
Dummy =l if colonial relationship after 1945 2.129 3.400 (0.821)** (0.977)**
Dummy=l if the two countries are contiguous 1.410 2.829 (0.395)** (0.457)**
Distance in km between the two countries -0.936 -1.029(0.064)** (0.078)**
Voice and Accountability 0.374 0.457(0.082)** (0.101)**
Unemployment Rate (sending country) 0.350 0.363 (0.089)** (0.111)**Unemployment Rate (receiving country) -0.662 -0.805
(0.152)** (0.187)**
No. of Observations 663 616R2 0.6271 0.6153

12
3. Migration-Development Interlinkages
Channels:
Shocks: changes in labour supply, productivity, remittances
Endogenous behavioural processes
Policy responses
Effects on growth and poverty reduction – through labour resource availability, human-capital accumulation and productivity – contingent on both time and place

13
Diagrammatic Exposition of Transmission Channels
Migration- related shocks
Lab. SS Δ <0
Remit.Flows >0
Lab. SS Δ >0
StructuralCharacteristics
Migrants Characteristics
Skill Comp/n
Labour Market conditions
Credit market conditions
Behavioral and Policy Responses
Length of Stay
Labour market Response
Human Capital Response
Techn. Progress
Investment
Econ.Restructuring
Prod/vity
Outcome Effects
Growth
Poverty
Distribution of income and wealth
Social Effects

14
The migration cycle: a stage-based experience
Time-varying framework explains: heterogeneity of growth outcomes differences between short run and long run impacts
15
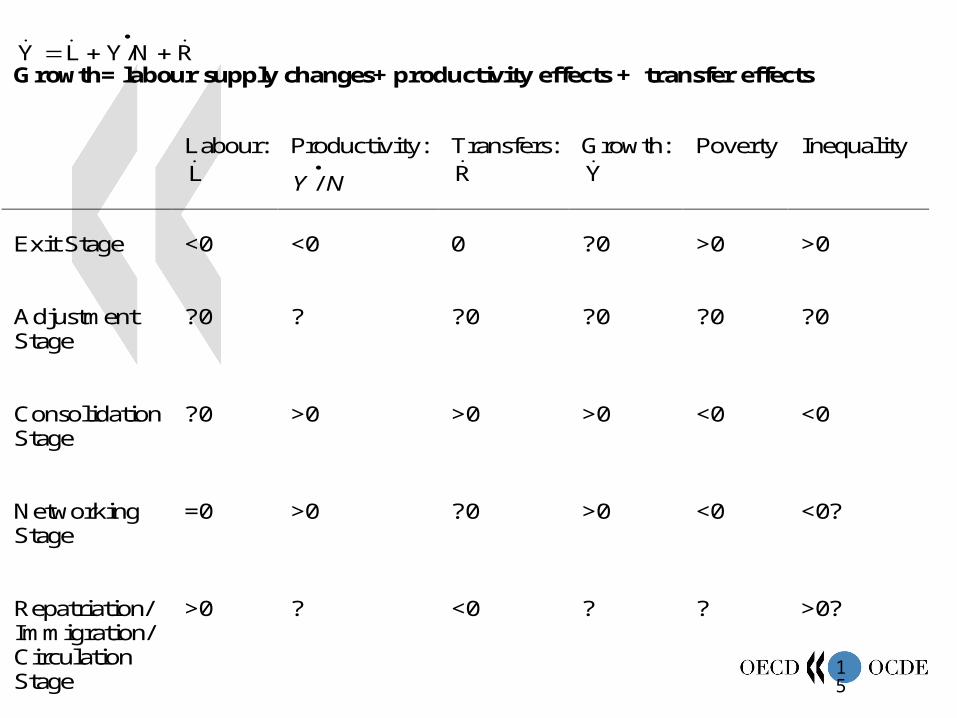
R Y/N LY
Growth= labour supply changes+ productivity effects + transfer effects
Labour: L
Productivity:
NY /
Transfers: R
Growth: Y
Poverty
Inequality
Exit Stage <0 <0 0 ?0
>0 >0
Adjustment Stage
?0 ? ?0 ?0
?0 ?0
Consolidation Stage
?0
>0 >0 >0
<0 <0
Networking Stage
=0 >0 ?0 >0
<0 <0?
Repatriation/ Immigration/ Circulation Stage
>0 ? <0 ? ? >0?

16
Effects on sending countries from unskilled labour departure
Without surplus labour: Employment and income gains to low skilled natives Output declines Long run restructuring
With surplus labour: Employment and income gains to low skilled natives Small/no effect on output
In both cases: Strong regional effects Ripple effects depend on domestic labour market
integration/internal migration Positive impact on poverty

17
Brain drain: is this a loss? Spillover benefits
potential tax revenue
Invested fiscal revenues for education/training
Delivery of key social services
Depends on:
Nature of constraint in social service delivery system
Utilisation of skilled personnel
Replacement options

18
Brain gain: is this feasible?
Induced education: mixed evidence (Philippines, Mexico)
Trade with home country Technology transfer Return of highly skilled migrants (Vietnam, Albania,
Bangladesh, Philippines). But:– Return rates often low (mixed evidence)– Skill mismatches– Deployment of new skills low
Business establishment (Egypt, Albania)
19
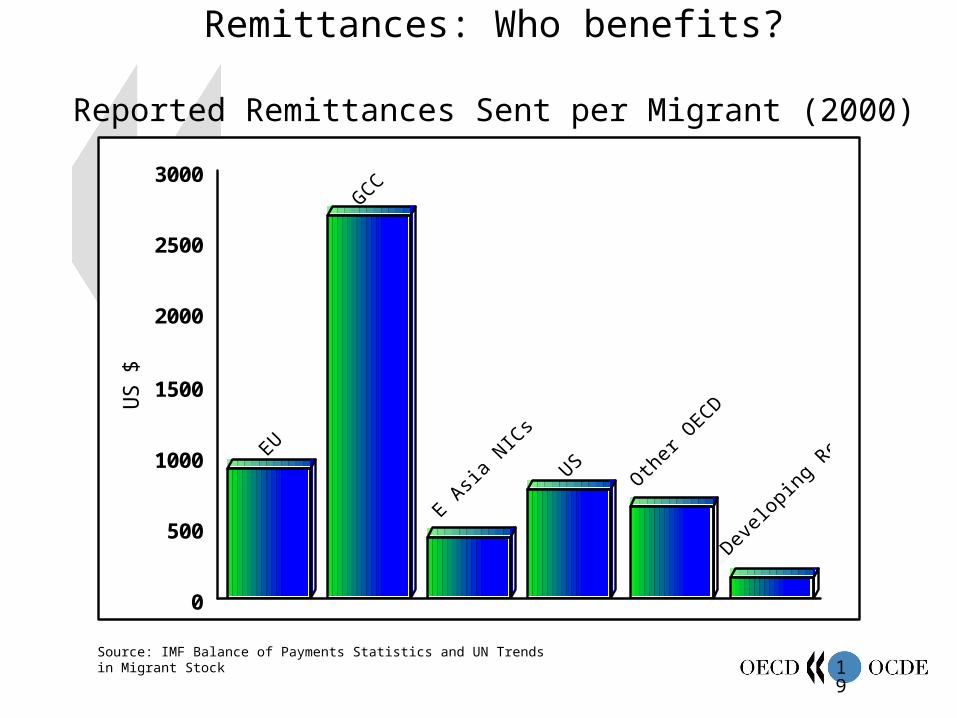
Remittances: Who benefits?
Reported Remittances Sent per Migrant (2000)
Source: IMF Balance of Payments Statistics and UN Trends in Migrant Stock
0
500
1000
1500
2000
2500
3000
US
$

20
The impact of remittances
Income distribution effects mixed Poverty reduction (e.g. Malawi, Botswana, Lesotho,
Mozambique, Mexico, Greece) Insurance against risk (e.g. Senegal, Mali) Additional education (El Salvador) Multiplier effects quite large (Mexico and other LDCs) Small deterioration of price competitiveness (real
exchange appreciation) Balance of payments effects: “transfer economies”

21
Social effects of migration
Children’s education: opposite effects linked to higher household income but absent parents (Mexico, Philippines)
Children’s health: positive impact (Mexico and Philippines)
Family roles
Women’s role

22
4. Trade- migration- investment interlinkages
Migration and trade are complements in the short and medium run
Migration increases trade through:• Preferences• Access to information• Trade intermediation• Participation in business networks
23
5. Challenges for EU policy making
Strategic management of EU’s human resources needed: Interlinkages between domestic, demographic and
labour market management and migration flows Improve Europe’s attractiveness as destination for
highly skilled migrantsStrengthen incentives for circular and repetitive
migrationConsider multiple policy regimes

24
Need for greater EU policy coherence:Promote more coherent migration and
development cooperation policies: ODA is an integral component of migration management
Link migration and human-security agendasPromote structured dialogueEnhance partnerships

25
Increase net gains from migration: Improve capacity-building in sending countries Mitigate depletion of critical skilled human resources,
esp. in Africa Lower the costs of remitting Deepen market integration via investment and
circular migration flows Consider more equitable cost-sharing schemes

26
Thank you !
Recommended