1
Energy Systems Integration
Otto DoeringProfessor
Purdue University

2
THEMES
• Asking The Right Questions
• The Tyranny of Existing Systems
• The Opportunity Cost of What We Do Today
• The Myopic Focus on Supply

3
Why We Are Where We Are Today
4
Current System Characteristics
• Cost
• Convenience
• Reliability
• Time
• Form
• Place

5
Some Critical Questions...
• To what extent can biomass sources and systems meet the form, time and place determinants of energy utility that consumers obtain from current sources and systems?

6
Some Critical Questions (cont.)
• Are the form, time and place determinants the right benchmark?

7
Some Critical Questions (cont.)
• What are the compelling reasons for current energy sources and systems to predominate, that tie them to consumers and discourage their replacement by other systems and sources?

8
Some Critical Questions (cont.)
• How might biomass energy successfully integrate into current systems?

9
Some Critical Questions (cont.)
• What are some of the critical challenges in integrating biomass systems?

10
Some Critical Questions (cont.)
• What policy issues will have to be dealt with for biomass sources to integrate or successfully create replacements for existing energy systems?

11
The Utility of Current Systems
• Meeting the form, time, and place requirements

12
Breaking the Tyranny of the Time, Form, and Place
Requirements• Roger Sant and energy as a
provider of services

13
Our Energy History
• Transportation and liquid fuels• Coal and natural gas – home
heating and electric generation• Cost and reliability

14
Limits to Growth
• Resource scarcity under technology and price fixity
• Is this the real world?

15
Is Our Current Fixity on Form, Time, and Place the
Real World?

16
Why Liquids from Biomass?
• Will ethanol relieve our dependence on imported oil?
(the whole corn crop to ethanol = 14% of total oil imports)(5 billion gallons of ethanol – 3.5% of current gasoline use)

17
Caloric Efficiency and Ethanol – Are We Counting the Right
Thing?
• The solid, liquid, gas trade-off

18
Opportunity Cost and a Different View of Energy
Services• CBO study on raising the CAFÉ standards
(Increase of 3.8 miles per gallon reducing gasoline consumption by 10% at a cost of 3 – 3.6 billion dollars)
19
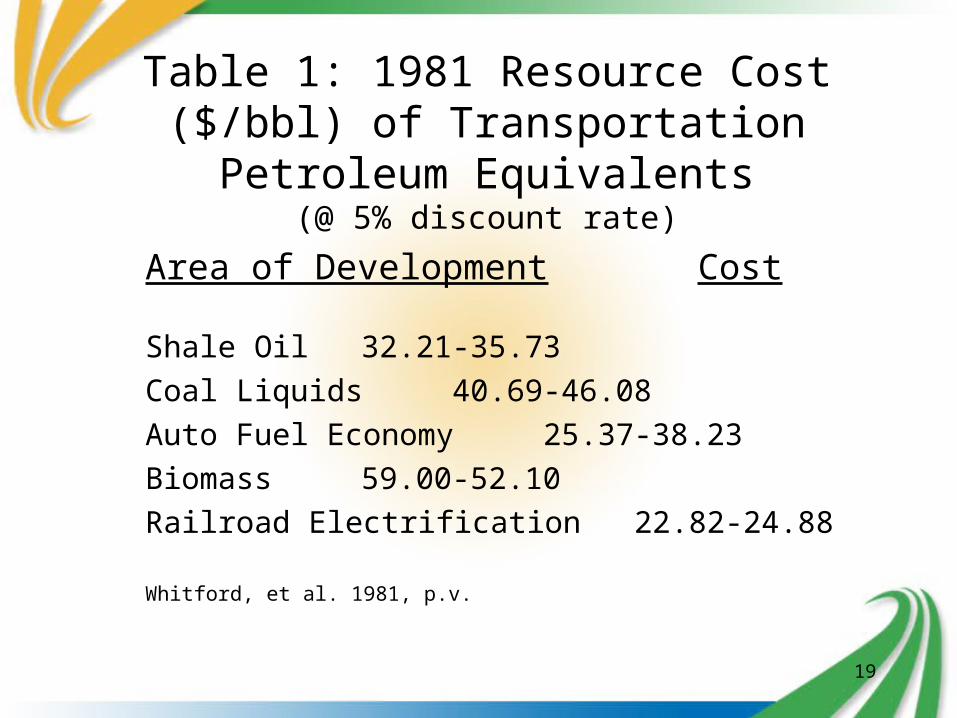
Table 1: 1981 Resource Cost ($/bbl) of Transportation Petroleum
Equivalents(@ 5% discount rate)
Area of Development Cost
Shale Oil 32.21-35.73Coal Liquids 40.69-46.08Auto Fuel Economy 25.37-38.23Biomass 59.00-52.10Railroad Electrification 22.82-24.88
Whitford, et al. 1981, p.v.

20
Electricity from Biomass
• Key issue is not supply but firing capacity and transmission

21
Confounding Characteristics of Generation Today
• The key drivers: Deregulation and Natural Gas

22
Table 2: Approximate Capital Costs for Different Power
SystemsType of System $ Cost per KW Capacity
Peaking Gas Turbine 400-500
Combined Cycle Gas Turbine 650-800
Conventional Coal 1,000-1,300
Coal Integrated Gasification- 1,200-1,500Combined Cycle
Nuclear 2,000 ????
Conversations with utility industry staff at the Power Systems Engineering Research
Center, 2004.

23
Where Were We Going as of 2002?

24
Figure 1. Projections of Electricity Generation by Fuel, 2000-2020
0
500
1000
1500
2000
2500
3000
3500
2000 2005 2010 2015 2020
Years
Bill
ion
Kilo
wa
tth
ou
rs
Nuclear
Coal
Petroleum
Natural Gas
Renewable Energy
EIA 2004 Annual Outlook Report

25
Where Are We Going as of 2004?
26
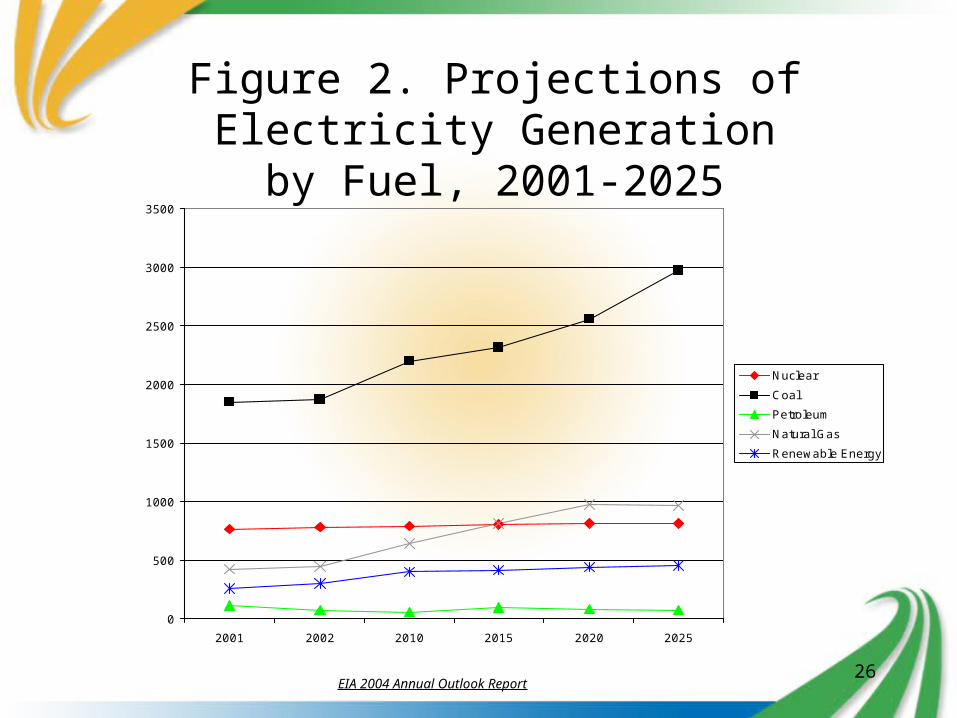
Figure 2. Projections of Electricity Generation
by Fuel, 2001-2025
0
500
1000
1500
2000
2500
3000
3500
2001 2002 2010 2015 2020 2025
Nuclear
Coal
Petroleum
Natural Gas
Renewable Energy
EIA 2004 Annual Outlook Report

27
The State of Systems Logistics for Electricity from Biomass
• The contrast with Ethanol
28
Reduced Flexibility – Loss of the Natural Gas Option
• Unrecognized as a premium fuel and feedstock
29
Impact of the New World of Natural Gas
• Impact on product cost and manufacturing competitiveness
• An increased opportunity for biomass gasification?
• Impact on natural gas now being less reliable as an import

30
Revisiting Some of Our Original Questions:
• To what extent can biomass sources and systems meet the form, time, and place determinants of energy utility that consumers obtain from current sources and systems?

31
Revisiting Some of Our Original Questions (cont.)
• What are the compelling reasons for current energy sources and systems to predominate, that tie them to consumers and may discourage their placement by other systems and sources?
32
Revisiting Some of Our Original Questions (cont.)
• How might biomass energy successfully integrate into current systems, and what are some of the critical challenges in doing this?

33
Revisiting Some of Our Original Questions (cont.)
• What policy issues will have to be dealt with for biomass sources to integrate or successfully create replacements for existing energy systems?

34
Integrating Biomass Systems Into Existing Systems is Job One

35
Additional Policy Concerns
• Break the myopic time horizon• End the fixation with existing form,
time, and place constraints that lead to a predominately supply based policy
• Seriously consider opportunity costs and trade-offs
• Seriously consider our strategic vulnerability
Recommended