1
Impact of an educational program on earthquake awareness and preparedness in Nepal 1
2
Shiba Subedi1, György Hetényi1 and Ross Shackleton2 3 1Institute of Earth Sciences, Faculty of Geosciences and Environment, University of Lausanne, 4
Switzerland 5 2Institute of Geography and Sustainability, Faculty of Geosciences and Environment, University 6
of Lausanne, Switzerland 7
8
Keywords: School education, Hazard, Attitudes, Nepal, Science and education 9
10
ABSTRACT 11
Scientific education of local communities is key to help in reducing the risk associated with natural 12
disasters, such as earthquakes. Western Nepal has a history of major seismic events and is highly 13
prone to further earthquakes; however, the majority of the population is not aware about or 14
prepared for them. To increase earthquake awareness and improve preparedness, a seismology 15
education program was established at 22 schools in Nepal. In each school, educational activities 16
were performed by teaching earthquake related topics in classrooms, offering training to teachers 17
and through installing a low-cost seismometer network which supported both teaching and 18
awareness objectives. To test the effects of this program we conducted two surveys with school 19
children, one before and one after the initiation of the program, with several hundred participants 20
in each. The survey findings highlighted that educational activities implemented at schools are 21
effective in raising awareness levels of children, promoting broader social learning in the 22
community, thus improving the adaptive capacities and preparedness for future earthquakes. 23
However, perceptions of risk did not change very much. The high and positive impact of the 24
program on the students and the community is encouraging in the continuation and expansion of 25
the program. 26
27

2
INTRODUCTION 28
It is becoming increasingly important to educate people in the era of global change about 29
environmental hazards to ensure they are well prepared to face the rising number of challenges. 30
Education may play a central role for the risk management of natural hazards and help to reduce 31
vulnerability and improve adaptability though allowing people to anticipate and prepare for 32
hazards (Godschalk, 2003; IRGC, 2005). 33
Exact earthquake prediction is currently not possible, but responses to such events can be prepared 34
for in advance to mitigate the effects they can have on society and human well-being (Turner, 35
1976). The impacts of earthquake disasters can be minimized by learning what to do before, during 36
and after earthquakes, and by taking a variety of personal safety measures (Lehman & Taylor, 37
1987). Whether people prepare for future earthquakes or not can be significantly influenced by 38
their education and their engagement in the topic (Tanaka, 2005). All-inclusive public awareness 39
and education is fundamental to reducing causalities, personal injuries, and property damage from 40
natural disasters (NRC, 1991; Torani et al., 2019). Researchers can contribute and play a key role 41
in the education of society; not just to engage more people in research, but also to provide scientific 42
explanations for natural hazards and related consequences to local communities as well as helping 43
to develop polices for mitigation of the effects. 44
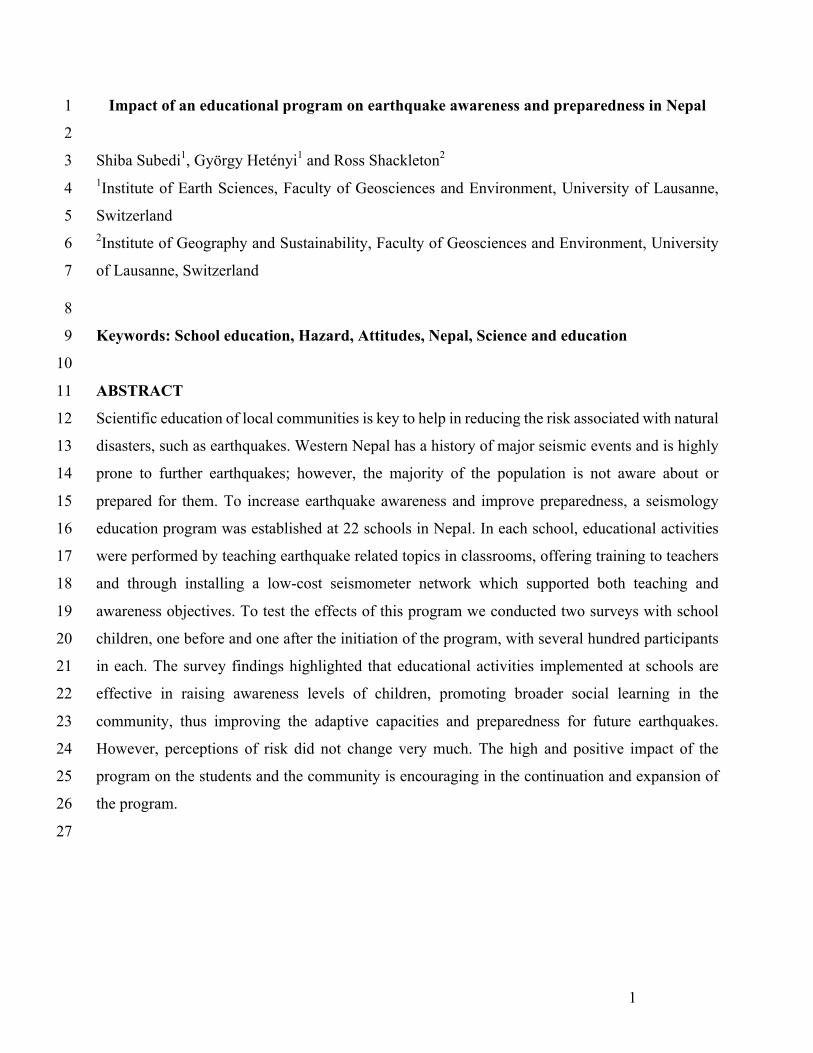
Earthquakes are the most common and deadliest natural hazard in Nepal with a long history of 45
impacts in the country (Bollinger et al., 2016). Historical records indicate that many houses and 46
temples in Nepal collapsed during the 1255 earthquake, and one third of the population including 47
the King, Abhaya Malla, was killed. There are also records of an earthquake with a moment 48
magnitude > 8 in 1505 (Ambraseys and Jackson, 2003) and indications that even larger 49
earthquakes are plausible in the Himalayas (Stevens and Avouac, 2016). In 1934, during an 50
earthquake (Fig. 1) with a moment magnitude (Mw) of 8.2 over 8’500 people lost their lives, 51
200’000 houses were severely damaged and more than 80’000 buildings completely collapsed 52
(Dixit et al., 2013). The most recent major earthquake (Mw 7.8), in 2015, hit central Nepal 53
resulting in about 9’000 causalities, and nearly 800’000 buildings were damaged or destroyed, 54
leaving millions of people homeless. The resulting losses were equivalent to 50 % of total national 55
GDP (Chaulagain et al., 2018). In addition, 19’000 classrooms were destroyed and 11’000 56
damaged (NPC, 2015b). It is suggested that if people had better awareness, preparations could 57

3
have been more adequate and the negative impacts might have been reduced (Hall & Theriot, 58
2016). 59
In Nepal, the National Seismological Center under the Department of Mines and Geology has been 60
conducting seismic monitoring since 1978. The Department of Education is responsible for 61
developing different educational activities across the nation, and the Department of Urban 62
Development and Building Construction has been working for building codes design and 63
implementation. After the 2015 earthquake, the National Reconstruction Authority was established 64
and works towards the reconstruction of buildings damaged during the Gorkha earthquake. Despite 65
these efforts, the topic of earthquakes is not included at any level of the official school curriculum 66
in the Nepali education system. However, recently the National Society for Earthquake and 67
Technology (NSET) initiated the Public-School Earthquake Safety Program in Nepal, but only in 68
a few districts of the country (Dixit et al., 2014). This program focuses mainly on the retrofitting 69
of school buildings to restore and minimize future damage following the 2015 earthquake; 70
however, educational efforts are still very limited. 71
72
Following the devastating 2015 Gorkha event, and considering the history of major earthquakes 73
and the likelihood of many more, as well as poor educational efforts on the topic, we initiated and 74
implemented a seismology education program in schools in Western Nepal (Fig. 1; Subedi et al., 75
2020) including the area affected by the 2015 earthquake and expanding towards the West (Fig. 76
2). The aim of the program is to increase the earthquake awareness levels in Nepal, starting from 77
the schools, with the hope that this knowledge will be spread into the community through social 78
learning, and partly through the establishment of a low-cost seismic network (Figs. 1, 3). In this 79
study, the effects of the education program for earthquake awareness and preparedness are 80
evaluated. The evaluation was performed by collecting data from students through two surveys, 81
one before and one after the initiation of the education program. 82
83
84
METHODS 85
The data for this study were collected using two questionnaire surveys on paper, conducted in 86
Nepali language: in 2018, before the initiation of the education program, and in 2020, nearly a year 87
after the full implementation of the program. 88

4
Before the initiation of the education program, we undertook fieldwork to help inform our strategy 89
and the educational materials, and to ensure the education program was well adapted to the Nepali 90
education system. In 2018, during the first visit to schools, we talked with the school leaders about 91
the program and its benefits, and gave sample lectures (ca. 1-2 hours including questions) to 92
students between the ages of 14-16, providing key information on earthquakes. Before the sample 93
lecture and in each school, students were requested to complete in a paper questionnaire survey on 94
earthquake related questions. In special lectures we also taught students how to prepare before an 95
earthquake, how to save lives during an earthquake, and what to do after an earthquake. We also 96
provided a flyer containing detailed information and pictures (Fig. 4), of which we distributed 500 97
copies. Similarly, we designed a sticker to remind people about earthquake hazards (Fig. 3), and 98
distributed this to students and teachers (3’000 so far). 99
In April-May 2019, during the second school visit, the program was fully implemented with the 100
installation of an educational, low-cost seismometer in every school. The seismometer’s record is 101
displayed on a computer, which is easily accessible to students in their physics class, or through 102
an online application. During the visit, we also identified the open place near the school where 103
students should meet in case of earthquake and installed an Emergency Meeting Point sign in 104
Nepali. To increase the efficiency of the learning and to ensure long-term uptake, we organized a 105
2-day workshop for nearly 100 school teachers, which was very well received. The full details of 106
the program are documented in an earlier paper (Subedi et al., 2020) and all the material is 107
accessible on the program website (www.seismoschoolnp.org). 108
109
In this article, we focus on evaluating the efficiency of our program in terms of the knowledge and 110
behavior change of students related to earthquakes. Out of 22 schools participating in the program, 111
15 schools were chosen for the survey, covering a range of socio-economical contexts. Students 112
for the surveys were selected randomly from grades 9 and 10, representing the 14-16-year-old age 113
group. The total number of responses collected was 318 in 2018 and 480 in 2020, respectively. 114
For logistical reasons, some responses in the pre- and post-survey (27 %) came from different 115
schools, but this is not expected to affect the results as they were independent samples. While the 116
first set of students surveyed had received no earthquake education whatsoever, those who filled 117
out the second survey were exposed to information and lectures frequently about earthquakes from 118
the teachers who were trained in our program. 119

5
When the exact same question was asked before and after our program's implementation, we 120
quantify the change using c2 test analysis. In doing so, our null hypothesis (HO) is that our program 121
had no effect on the students. If this null hypothesis is unconfirmed (i.e., the c2 value is above the 122
threshold for the corresponding number of possible answers, and the respective p-value is below 123
5%), then we interpret that the program had an effect on the students as their answers show a clear, 124
statistically significant change. The complete set of questionnaires are available in the 125
Supplementary materials file. 126
127
128
129
RESULTS 130
The first measurement of this study, performed in the 2018 survey, was about the experience of 131
the 2015 Gorkha earthquake. The majority of respondents, 94 %, felt the shaking. As the 132
earthquake was on Saturday, schools were closed and students were at home; 71 % of students 133
answered that they ran out of a building, and only 15 % hid under a table, 8 % did not know what 134
to do, 3% stood next to the wall or the doorframe, 3% had other reactions. 135
136
Knowledge about the causes and possibility of earthquakes in Nepal 137
Before the implementation of the program, 7 % students believed that earthquakes were caused by 138
a moving fish carrying the Earth (a Hindu belief and myth). However, 64 % still chose the correct 139
scientific answer: plate tectonics. The majority of students, 84 %, chose the “plate tectonics” 140
answer in 2020, and the percentage of responses relating to the cultural/religious reasons dropped 141
to 2 % (Fig. 5). 142
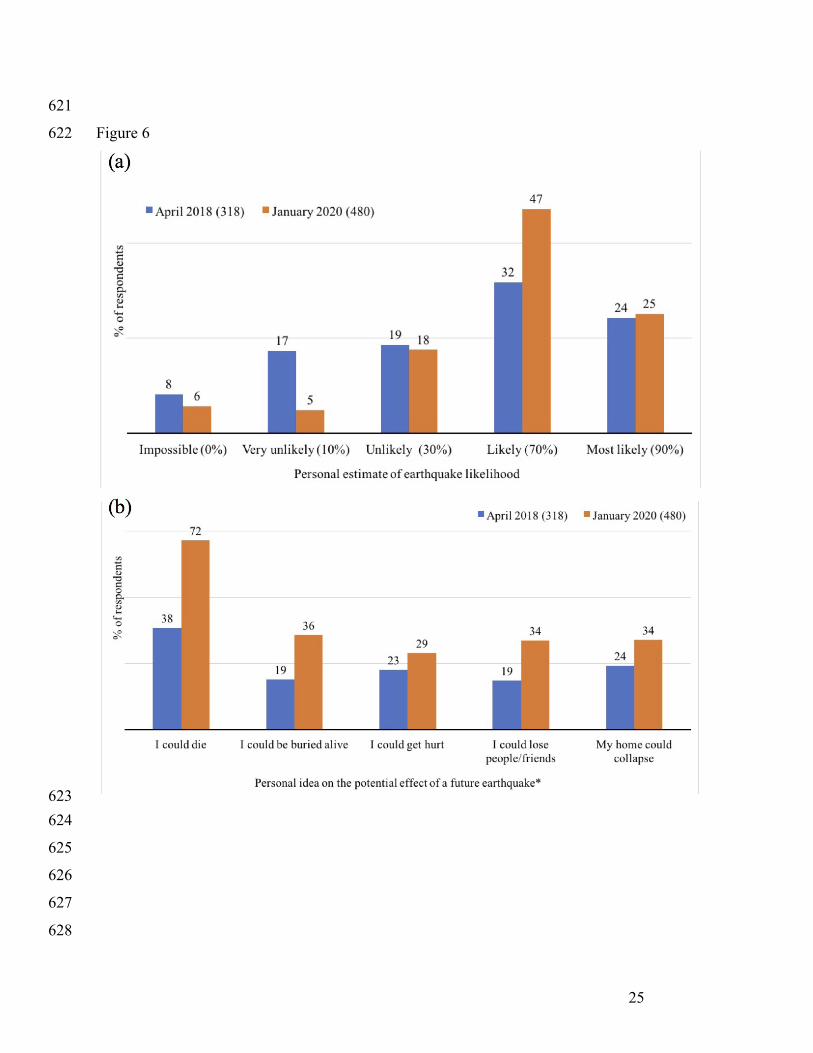
Regarding the probability of a future earthquake greater than in 2015, more students knew that 143
such an earthquake in their region was quite likely after the education program (Fig. 6a). At the 144
same time, there was a clear drop in the number of responses for very unlikely (17 % in 2018 to 5 145
% in 2020) and a slight drop in the percentage answering that a future great earthquake is 146
impossible. 147
Relating to the effects of a Mw > 8 earthquake, after the program, the answer I could die has 148
increased by a factor of 1.8, and all other answers (I could be buried alive, I could get hurt, I could 149

6
lose friend and My home could collapse) are increased by a factor of at least 1.3 compared to 2018 150
(Fig. 6b; multiple answers were possible). 151
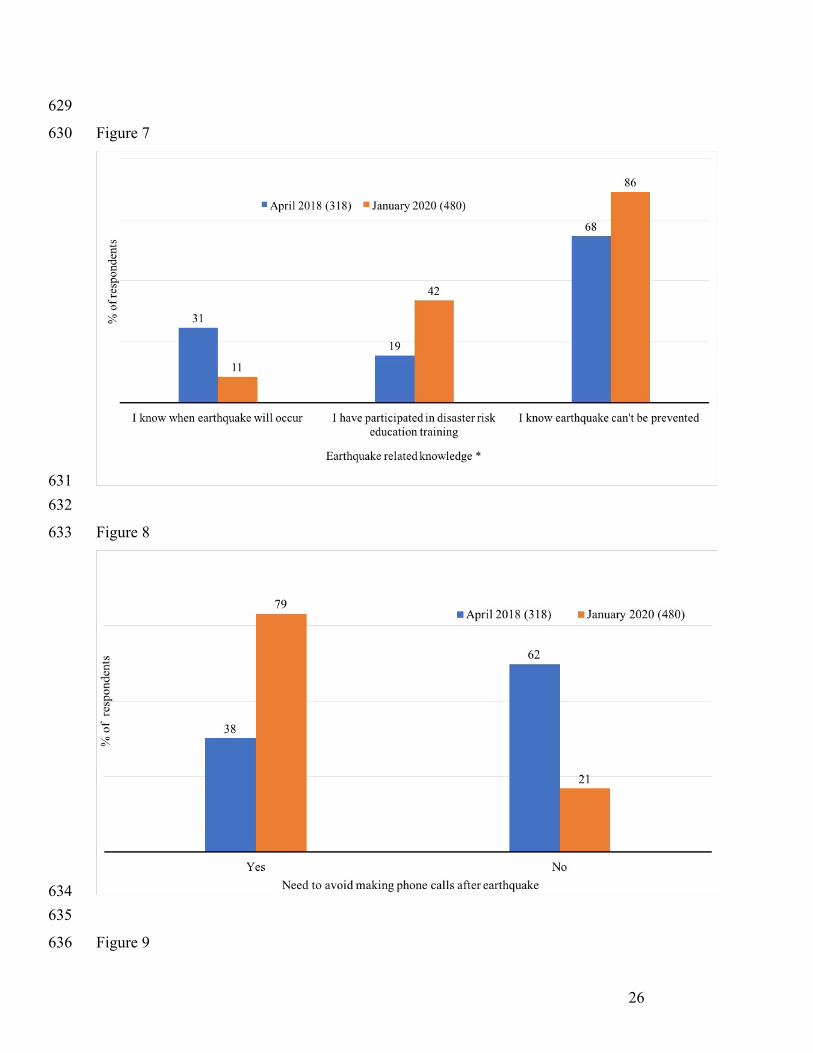
In 2018, 31 % students answered they know when an earthquake will occur, which is reduced to 152
11 % in 2020. The answer itself is not true, and this mis-information could drive people to 153
incorrectly prepare for or act during an earthquake. While our efforts clearly decreased this mis-154
conception among the students, we could not yet reach each and every student to teach them about 155
the unpredictability of earthquakes. The students’ answer agreeing on the impossibility of 156
preventing an earthquake was 86 % in 2020, showing an absolute increase of 18 % from 2018. 157
This question also shows that by 2020, more than double of the respondents have participated in 158
disaster risk education training compared to 2018 (Fig. 7). 159
160
Knowledge and perceptions about how to behave during and after an earthquake 161
Three quarters (75 %) of students in 2020 responded that their family knew what to do and where 162
to go during an earthquake, an increase of 55 % from 2018. Only 37 % of students in 2020 believed 163
that their home could resist a large earthquake. For comparison, 65 % students were scared and 22 164
% panicked during the Gorkha earthquake in 2015 (10 % had calm reactions, 3 % did not care) 165
according to answers in 2018. 166
In 2018, 62 % respondents didn’t know that they should not call others after an earthquake to leave 167
the phone lines available for rescue operation, but in 2020 nearly 80 % students knew this useful 168
practical point (Fig. 8). 169
After the implementation of our program, 65 % of the students believed that they could survive if 170
a large earthquake occurred at night, whereas 43 % felt they could survive in 2018. This 171
information reflects more confidence of students as they become familiar with earthquake topics 172
and have heard more information about them. 173
In 2020, 93 % of children knew that during an earthquake, the majority of injuries and deaths are 174
caused by people being hit by objects, through the collapse of constructions; the proportion of 175
people not knowing this dropped by 2/3 after the educational program was implemented. More 176
than 2/3 of the students in 2020 were aware about the additional hazards, such as fires, landslides 177
and floods that can be triggered by an earthquake. There is a 7% decrease for this answer since the 178
2018 survey, but as students who claimed partial knowledge increased by 7 % as well, a net change 179
in knowledge is not really perceptible on this point. 180

7
The proportion of students who regularly discuss earthquake related topics within their families 181
has increased by 18 % (absolute increase; see Table 1). This shows that the education program at 182
schools has led to widespread social learning within communities. This is reinforced by the finding 183
that nearly all students (98 %) are interested in learning more about earthquakes in detail, which 184
will aid communities towards better earthquake preparedness in the long run. 185
186
Earthquake preparedness and adaptation 187
In 2018, 36 % of students perceived that to remain alive during an earthquake depends on luck, 188
while this number has decreased by a relative 60 % after our program started and is a concern for 189
only 21 % of students (Fig. 9). All possible answers regarding adaptation options to earthquakes 190
record an increase from 2018 to 2020 (Fig. 11). The majority (72 %) of respondents answered that 191
they are aware of the shelter areas and open spaces where they can go in case of an earthquake. 192
The same proportion of people are aware of evacuation areas in 2020, but the increase here is much 193
more important (from 38 to 69 %), potentially thanks to the Nepali Emergency Meeting Point signs 194
we installed in schools. The information about which governmental authority to contact after an 195
earthquake is relatively low, but has increased by 10 % (absolute). Information about earthquake 196
prone areas and the reception of knowledge on earthquake disaster adaptation have increased by 197
the factor of 2.5, from 12 % in 2018 to 31 % in 2020 after the education program. 198
The relatively small number of respondents who claimed that the government will provide help 199
after an earthquake increased by a factor of almost 3: from 8 % in 2018 to 23 % in 2020. This 200
percentage is not yet sufficient in general, but the improvement following our program’s 201
implementation is noteworthy. Moreover, the level of confidence in the government’s 202
reconstruction activities has also grown, from 13 to 30 %, which is a good sign and shows 203
increasing level of trust. In 2020, 68 % of the respondents knew about the importance of talking 204
about earthquakes with neighbours, friends and colleagues, a nearly two-fold increase in two years. 205
Furthermore, we found that all students discussed their new knowledge and learning about 206
earthquakes with the people around them in the community. Ninety-one percent of the students 207
had talked to at least with some people in the community, only 9 % had discussed this with their 208
parents only, and there is no student who had not had a discussion in her/his surroundings (Fig. 209
10). 210
211
8
Perception of risk 212
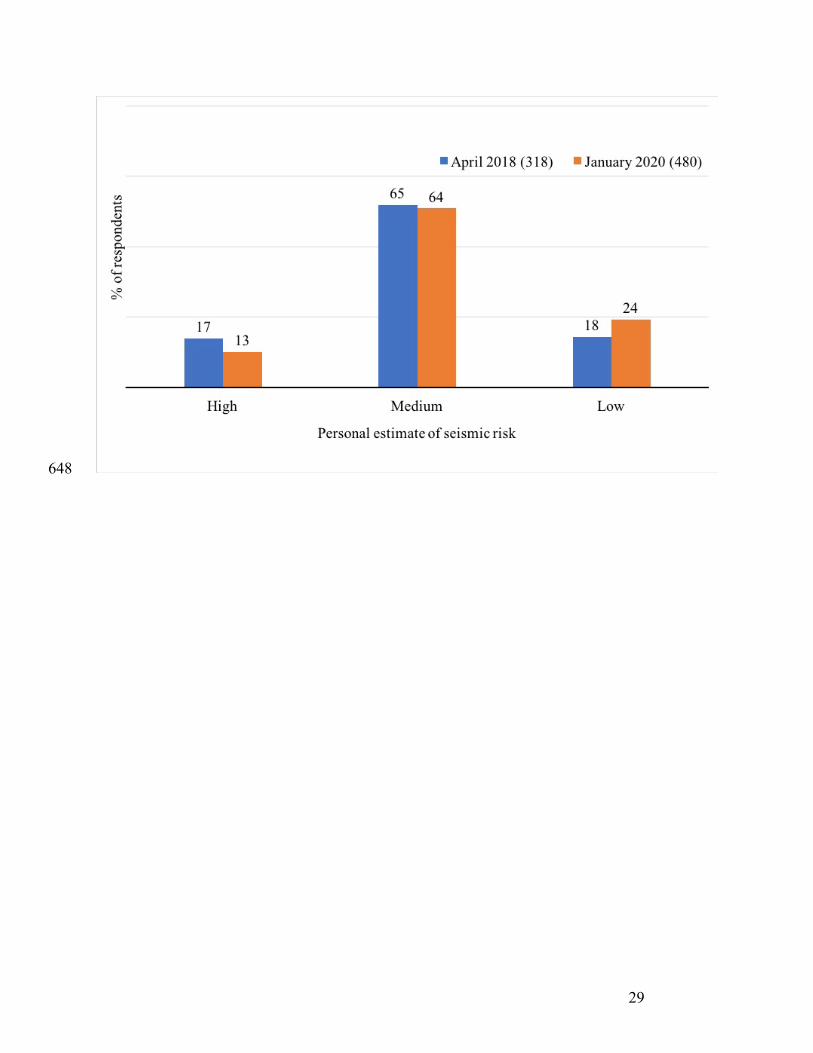
More than 60 % of the answers showed that students considered the level of seismic risk in their 213
city as medium, which means their risk perception is underestimated with respect to the actual 214
seismic risk level in the region (Stevens et al., 2018). Only every 6th person claims to perceive high 215
risk, which is clearly less frequent than people declaring low risk. As opposed to our expectation, 216
there is very little change in the level of risk perception in the group of students from 2018 to 2020: 217
the medium risk level group is the same, and there is minor change in low and high-risk level 218
groups (Fig. 12). This result is a surprise, especially when compared to the 72 % of responses in 219
2020 who believe that there is more than 70 % chance of experiencing an earthquake larger than 220
the 2015 Gorkha earthquake in their life (Fig. 6a). 221
222
Project acceptance and future education 223
To measure the program’s acceptance level, some questions regarding the program itself were also 224
included in the 2020 questionnaire. It is found that 91 % of the students know that a seismometer 225
is installed in their school for earthquake education purposes. A total of 61 % of the students have 226
observed waveforms recorded by the seismometer, either at the school computer (39 %), on the 227
teacher’s mobile phone (18 %) or/and on their parents’ or own mobile phone (8-8 %). Furthermore, 228
85 % of the students answered that teachers teach about earthquakes in the classroom regularly 229
(weekly, monthly, on demand, and/or following an earthquake). In 2020, 99 % of the students 230
expressed that they like the earthquake information we have provided them. Regarding future 231
plans, almost all students are very much (69 %) or simply (29 %) interested to learn about 232
earthquakes by inserting the theme in the official curriculum, which can be instituted by the Local, 233
Provincial and Federal Government of Nepal as they have all have some field of possible action. 234
Hence, our program and the methods we use for teaching about earthquakes are well accepted. 235
236
Statistics 237
All questions except the last (Question 12 in Table 1, level of interest to learn is 98% in both 238
surveys) record a clear change in the pattern of answers given following our program's 239
implementation (see Supplementary Table 1). The biggest statistical change was seen for Question 240
6 (avoid post-earthquake use of mobile communications) suggesting a big increase in knowledge 241
9
and very new information. Each question (excluding those with multiple choice answers) and their 242
corresponding c2 and p-values are reported in the Supplementary Table 1. 243
244
245
DISCUSSION 246
Have earthquake awareness levels increased? 247
As a result of the novel school-based education program, themes related to earthquakes are more 248
familiar to the students now than in the past, and their awareness levels have increased since the 249
program was initiated. Students know more about the earthquake phenomena and have changed 250
their behavior to better prepare and adapt to forthcoming earthquakes. Earthquake related 251
knowledge learnt by students at schools has also reached across the broader community, though 252
social learning processes (Reed et al. 2009). 253
254
Why have the awareness levels increased? 255
Beyond the prescribed school education, our program has provided an opportunity for informal 256
and free-choice education forms, in which people can learn about topics outside of formal 257
educational settings, which has been well supported by enthusiastic teachers (Falk & Dierking, 258
2002). This form of social learning enables an increase in knowledge, and through further 259
communication with others, it spreads knowledge in communities, which may lead to changes in 260
attitudes, behavior, and building of trust in society (Reed et al., 2010). This method is widely 261
applied for the study of natural hazards and its management (e.g., Brody, 2003; O’Keefe et al., 262
2010). During our program’s implementation, despite being in contact only with the school 263
children, the knowledge has spread much more widely in local communities through social 264
learning, thus reaching and impacting the original and intended target group. 265
People’s behavior can also be developed through education. The idea is that if people are made 266
more knowledgeable about earthquakes, they are more likely to adopt and perform behaviors that 267
will increase their earthquake awareness and preparedness (Hungerford and Volk, 1990). This has 268
similarly been shown for other environmental issues like invasive species, where campaigns 269
building knowledge and awareness changed behaviors therefore reducing risk (e.g. Cole et al. 270
2019). 271

10
As a result of our educational program, earthquake related knowledge has increased and the 272
behavior necessary to cope with earthquakes has also changed. Despite this, the earthquake risk 273
perception of students has not yet greatly changed. Our results show that a realistic and appropriate 274
distribution of earthquake related knowledge and increased awareness level are not (or not yet) 275
sufficient to influence the perception of risk. Perception is a complex phenomenon and can take a 276
long time to change (De Dominicis et al., 2015; Estévez et al., 2015; Cole et al., 2019; Shackleton 277
et al., 2019). Education and awareness raising is a key factor for changing long-term risk 278
perceptions – although programs need to be well tailored to appropriate audiences (Lee et al., 279
2015). Although, some studies discuss the fact that increased knowledge does not always relate to 280
increased risk perceptions, and increasing perceived risk does not necessarily result in the 281
reduction of risk behavior (e.g. Noroozinejad, 2013; Petros, 2014). In addition, knowing more of 282
a given topic makes people more certain, self-confident, which may lead to underestimate the 283
related risk (e.g. Stringer, 2004). Moreover, increased knowledge and behavior to adapt and to feel 284
more secure during an earthquake should reduce the fear of associated risk and therefore reduce 285
the risk perception. The limited change in risk perception in this study may be due to better 286
knowledge of the hazard and how to mitigate it (Ndugwa Kabwama and Berg-Beckhoff, 2015). 287
Hence, how people perceive risk is not necessarily related to the actual risk. We cannot draw a 288
definitive conclusion as the related knowledge can contribute to the amplification or the 289
attenuation of the related risk; as such, it could be one of the potential reasons for the low risk 290
perception of people having more knowledge (Reintjes, 2016). Risk perception is thus important 291
for preventative actions, but risk perceptions are often biased (Weinstein, 1988). It could be that 292
more time is needed to change students’ risk perceptions, and it is also likely that there are other 293
factors such as economic status, gender, age group, location of home in city, etc. that may influence 294
the level of risk perception of people. A repeated survey in the same age category in a few years’ 295
time may give more insight into this question. We suggest that further monitoring and adaptation 296
of the education system might be needed to better link awareness raising, behavior change and risk 297
perception change. 298
299
300
Further action needed 301

11
Since other sources of information, such as newspapers and television, are not easily available to 302
people in the Nepali countryside, we believe that the school is the best platform to transfer 303
knowledge to the community. The proper education at school reaches deep within the families and 304
into the community, and the discussions in those circles are essential to prepare the whole society 305
for future earthquakes. The proportion of students who regularly discuss earthquake related topics 306
within their families has increased by 18 % (absolute increase; see Table 1). This shows that the 307
education program at schools has led to widespread social learning within communities, and 308
possibly beyond our program’s current area. We therefore, advocate for a continuity of this 309
program and to get education about environmental hazards more deeply embedded in the Nepali 310
education system. 311
312
Although this program has increased the earthquake awareness level among students and the 313
broader community in the program area, it is alone not sufficient for seismic risk reduction. Further 314
monitoring and adaptation of the program to promote changes in risk perception and improved 315
learning is advised. Education will help communities to prepare for future earthquakes, but the 316
local, national and regional governments are responsible for the rescue, support and reconstruction 317
operations in the case of a severe earthquake and well as developing and implanting policy to 318
mitigate against threats. People’s situation after an earthquake depends on how well they were 319
prepared for the event, so developing policy, for example, on construction quality depending on 320
expected shaking intensities is advised. Since the shaking level of an earthquake cannot be 321
controlled, the impact of an earthquake on the community is strongly dependent on the actions 322
taken by the government for its preparedness, such as education (so far our program’s effort) as 323
well as, for example, a suitable, locally calibrated and enforced building code. For both aspects, 324
the provincial governments could undertake some of the efforts drawing on our bottom-up 325
approach, and adapt them to maintain earthquake education in schools, which is an efficient way 326
to make earthquake-safer communities. In parallel, local initiatives are encouraged to strengthen 327
these efforts. 328
329
CONCLUSIONS 330
The Seismology at School in Nepal program has been successfully implemented and achieved the 331
aim of raising earthquake awareness and preparedness by educating students in their schools. The 332
12
program itself and the methods we used for teaching about earthquakes and demonstrations using 333
low-cost seismometers are well accepted by students and teachers. The new knowledge learned by 334
the students at school reaches their parents and is transferred into the local community. The results 335
we observed through two surveys, before and after initiation of the education program, are 336
measurable, statistically significant and with positive changes for earthquake related knowledge 337
and preparedness level, but not (yet) for the perception of the related risk. A high and positive 338
impact of the program on the students and their communities is encouraging for the continuation 339
and expansion of the program in the region. Governmental institutions are encouraged to build on 340
this experience as well as develop further policy to mitigate the risk of future earthquakes in Nepal. 341
342
ACKNOWLEDGEMENTS 343
We greatly acknowledge students, school teachers and principals from the school participating in 344
the program. We are very thankful to people who helped carrying out the surveys. We highly 345
appreciate the American Geophysical Union for their AGU-Celebrate-100 grant support which 346
allowed us to invite Nepali teachers to the workshop. We greatly acknowledge the Institute of 347
Earth Sciences and the Faculty of Geosciences and Environment at the University of Lausanne for 348
hosting Shiba Subedi as a doctoral student, and for their support for instrumentation. The funding 349
from Federal Commission for Scholarships for Foreign Students, Switzerland, for Shiba Subedi’s 350
PhD thesis is well acknowledged. We warmly thank Anne Sauron, Peter Loader and Paul Denton 351
for valuable suggestions and useful discussions. We are also thankful to Mrs. Apsara Pokhrel for 352
translation and typesetting of the survey questionnaire in Nepali language. 353
354
Figure 1: Map of Nepal, with the locations of schools participating in the Seismology at School in 355
Nepal program. Background represents population density data (CIESIN and CIAT, 2005). The 356
Main Frontal Thrust (MFT), the surface trace of the fault underlying most of Nepal and hosting all 357
great earthquakes in the region, is indicated in red solid line. Three colored segments represent the 358
rupture extent of the corresponding major and great earthquakes with moment magnitude (Mw) as 359
indicated (after Bollinger et al., 2016). For the 2015 Gorkha earthquake the rupture area is also 360
plotted (blue contour). Letters P and K refer to cities Pokhara and Kathmandu, respectively, 361
marked with black circles. 362
363
13
Figure 2: Students gathered at the morning assembly in the Shree Himalaya Secondary School, 364
Barpak, Gorkha district. The school building was damaged during the 2015 earthquake and 365
students were in temporary shelters. The construction of the new building is visible at the top of 366
the picture. (Photo: S. Subedi, in May 2018, with permission of the school). 367
368
Figure 3: Left: The Raspberry Shake 1D low-cost seismometer, installed in 22 schools across 369
Central Nepal (Fig. 1). Right: Earthquake awareness sticker, as a reminder, in English and Nepali 370
language (artwork of M. Dessimoz). The sticker image is available for download from our 371
program’s webpage: www.seismoschoolnp.org. 372
373
Figure 4: Educational flyer in Nepali language on what to do before, during and after an 374
earthquake. The flyer has been translated and adapted from an English version, compiled by and 375
available from the CPPS earthquake education centre in Sion, Switzerland (www.cpps-vs.ch). The 376
Nepali flyer is available for download from our program’s webpage: www.seismoschoolnp.org. 377
378
Figure 5: Student opinions on what causes earthquakes (Q1), before and after the initiation of our 379
education program. (χ2 = 78.15, p-value = < .00001, the change is significant). 380
381
Figure 6: (a) Student views on how likely the occurrence of a next earthquake bigger than the 2015 382
Gorkha earthquake is (Q3), before and after the initiation of our education program. (χ2 = 43.59, 383
p-value = < .00001, the change is significant). (b) Student answer on the outcome of a potential 384
Mw>8 earthquake in Nepal (Q2), before and after the initiation of our education program. 385
*Multiple answers were possible. 386
387
Figure 7: Students’ personal knowledge about earthquakes (Q13), before and after the initiation of 388
our education program. *Multiple answers were possible. 389
390
Figure 8: Student’s knowledge on the recommendation to avoid making phone calls after an 391
earthquake to leave lines available for rescue operations (Q6), before and after the initiation of our 392
education program. (χ2 = 138.72, p-value = < .00001, the change is significant). 393
394

14
Figure 9: Student’s own opinion on earthquake preparedness (Q14), before and after the initiation 395
of our education program. *Multiple answers were possible. 396
397
Figure 10: Student activities to transfer the knowledge to the community (question e), after 398
initiation of our education program. 399
400
Figure 11: Student ideas about earthquake adaptation (Q15), before and after the initiation of our 401
education program. *Multiple answers were possible. 402
403
Figure 12: Students’ perception of the level of seismic risk in their respective location (Q10), 404
before and after the initiation of our education program. (χ2 = 6.33, p-value = 0.042, the change is 405
slightly above significant level). 406
407
408
409
410
411
412
No Question Answer in 2020 survey Answer in 2018 survey
Yes Partially No Yes Partially No
Q7
If a large earthquake occurred
at night, could you save
yourself?
65% - 35% 43% - 57%
Q8
Do you know that the majority
of injuries that occur in
earthquakes are caused by
people being hit by or
stumbling over fallen objects?
93% - 7% 76% - 24%
Q9 Do you know that earthquakes
can make additional damage 68% 21% 11% 75% 14% 11%
15
such as fire, landslides and
floods?
Q11
The preparedness for a major
earthquake is the most
important thing. Are you
regularly discussing this topic
with your family?
71% - 29% 53% - 47%
Q12
Are you interested to know
more about earthquakes and its
preparedness in details?
98% - 2% 98% - 2%
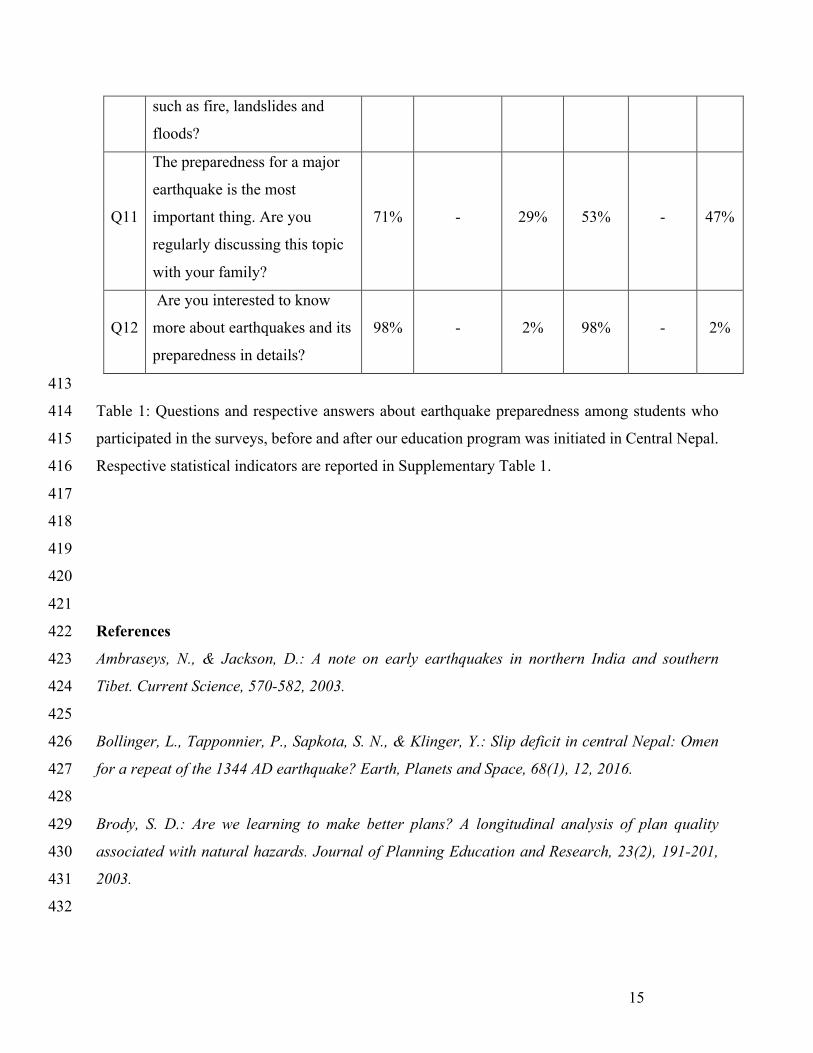
413
Table 1: Questions and respective answers about earthquake preparedness among students who 414
participated in the surveys, before and after our education program was initiated in Central Nepal. 415
Respective statistical indicators are reported in Supplementary Table 1. 416
417
418
419
420
421
References 422
Ambraseys, N., & Jackson, D.: A note on early earthquakes in northern India and southern 423
Tibet. Current Science, 570-582, 2003. 424
425
Bollinger, L., Tapponnier, P., Sapkota, S. N., & Klinger, Y.: Slip deficit in central Nepal: Omen 426
for a repeat of the 1344 AD earthquake? Earth, Planets and Space, 68(1), 12, 2016. 427
428
Brody, S. D.: Are we learning to make better plans? A longitudinal analysis of plan quality 429
associated with natural hazards. Journal of Planning Education and Research, 23(2), 191-201, 430
2003. 431
432
16
Center for International Earth Science Information Network (CIESIN), Columbia 433
University; and Centro Internacional de Agricultura Tropical (CIAT), 2005. 434
435
Chaulagain, H., Gautam, D., & Rodrigues, H.: Revisiting major historical earthquakes in Nepal: 436
Overview of 1833, 1934, 1980, 1988, 2011, and 2015 seismic events. In Impacts and insights of 437
the Gorkha earthquake, Elsevier, ,1-17, 2018. 438
439
Cole, E., Keller, R. P., & Garbach, K.: Risk of invasive species spread by recreational boaters 440
remains high despite widespread adoption of conservation behaviors. Journal of environmental 441
management, 229, 112-119, 2019. 442
443
De Dominicis, S., Fornara, F., Cancellieri, U.G., Twigger-Ross, C. and Bonaiuto, M.: We are at 444
risk, and so what? Place attachment, environmental risk perceptions and preventive coping 445
behaviours. Journal of Environmental Psychology, 43, 66-78, 2015. 446
447
Dixit, A. M., Yatabe, R., Dahal, R. K., & Bhandary, N. P.: Initiatives for earthquake disaster risk 448
management in the Kathmandu Valley. Natural hazards, 69(1), 631-654, 2013. 449
450
Dixit, A. M., Yatabe, R., Dahal, R. K., & Bhandary, N. P.: Public school earthquake safety program 451
in Nepal. Geomatics, Natural Hazards and Risk, 5(4), 293-319, 2014. 452
453
Estévez, R.A., Anderson, C.B., Pizarro, J.C. and Burgman, M.A.: Clarifying values, risk 454
perceptions, and attitudes to resolve or avoid social conflicts in invasive species management. 455
Conservation Biology, 29(1), 19-30, 2015. 456
457
Falk, J. H., & Dierking, L. D.: Lessons without limit: How free-choice learning is transforming 458
education. Rowman Altamira, 2002. 459
460
Godschalk, D.R.: Urban hazard mitigation: creating resilient cities, Natural Hazards Review, 461
4(3), 136-143, 2003. 462
463
17
Hall, J. C., & Theriot, M. T.: Developing multicultural awareness, knowledge, and skills: 464
Diversity training makes a difference?. Multicultural Perspectives, 18(1), 35-41, 2016. 465
466
Hungerford, H. R., & Volk, T. L.: Changing learner behavior through environmental 467
education. The journal of environmental education, 21(3), 8-21. doi: 468
10.1080/00958964.1990.10753743, 1990. 469
470
IRGC: Risk Governance: Towards an Integrative Approach, Geneva, white Paper No. 1, 2005. 471
472
Lee, T.M., Markowitz, E.M., Howe, P.D., Ko, C.Y. and Leiserowitz, A.A.: Predictors of public 473
climate change awareness and risk perception around the world. Nature climate change, 5(11), 474
1014-1020, 2015. 475
476
Lehman, D. R., & Taylor, S. E.: Date with an earthquake: Coping with a probable, unpredictable 477
disaster. Personality and Social Psychology Bulletin, 13, 546–555, 1987. 478
479
National Research Council: A safer future: Reducing the impacts of natural disasters. National 480
Academies Press, 1991. 481
482
Ndugwa Kabwama, S., & Berg-Beckhoff, G.: The association between HIV/AIDS-related 483
knowledge and perception of risk for infection: a systematic review. Perspectives in public 484
health, 135(6), 299-308, 2015. 485
486
Noroozinejad, G., Yarmohamadi, M., Bazrafkan, F., Sehat, M., Rezazadeh, M., & Ahmadi, K.: 487
Perceived risk modifies the effect of HIV knowledge on sexual risk behaviors. Frontiers in public 488
health, 1, 33, 2013. 489
490
NPC (2015b) Earthquake, N. N.: Post Disaster Needs Assessment. Sector Reports. Kathmandu: 491
National Planning Commission, Government of Nepal, 2015. 492
493
18
O'Keefe, G. O. B. P., & Swords, Z. G. J.: Approaching disaster management through social 494
learning. Disaster Prevention and Management, 19(4), 498-508, 2010. 495
Petros, P.: Risk perception, HIV/AIDS related knowledge, attitude and practice of the university 496
community: The case of Ethiopian Civil Service College. HIV & AIDS Review, 13(1), 26-32, 2014. 497
498
Reed, M. S., Evely, A. C., Cundill, G., Fazey, I., Glass, J., Laing, A., Newig, J., Parrish, B., Prell, 499
C., Raymond, C., et al.: What is social learning? Ecology and society, 15(4), 2010. 500
501
Reintjes, R., Das, E., Klemm, C., Richardus, J. H., Keßler, V., & Ahmad, A.: “Pandemic Public 502
Health Paradox”: time series analysis of the 2009/10 Influenza A/H1N1 epidemiology, media 503
attention, risk perception and public reactions in 5 European countries. PloS one, 11(3), 2016. 504
505
Shackleton, R.T., Richardson, D.M., Shackleton, C.M., Bennett, B., Crowley, S.L., Dehnen-506
Schmutz, K., Estévez, R.A., Fischer, A., Kueffer, C., Kull, C.A. and Marchante, E.: Explaining 507
people's perceptions of invasive alien species: a conceptual framework. Journal of Environmental 508
Management, 229,10-26, 2019. 509
510
Stevens, V. L., Shrestha, S. N., & Maharjan, D. K.: Probabilistic Seismic Hazard Assessment of 511
Nepal. Bulletin of the Seismological Society of America, 108(6), 3488-3510, 2018. 512
513
Stevens, V. L., and Avouac, J.-P.: Millenary M w > 9.0 earthquakes required by geodetic strain 514
in the Himalaya, Geophys. Res. Lett., 43, 1118–1123, doi:10.1002/2015GL067336, 2016. 515
516
Stringer, E. M., Sinkala, M., Kumwenda, R., Chapman, V., Mwale, A., Vermund, S. H., ... & 517
Stringer, J. S.: Personal risk perception, HIV knowledge and risk avoidance behavior, and their 518
relationships to actual HIV serostatus in an urban African obstetric population. Journal of 519
acquired immune deficiency syndromes (1999), 35(1), 60, 2004. 520
521
Subedi, S., Hetényi, G., Denton, P. & Sauron, A.: Seismology at School in Nepal: a program for 522
educational and citizen seismology through a low-cost seismic network. Frontiers in Earth Science, 523
2020. 524
19
525
Tanaka, K.: The impact of disaster education on public preparation and mitigation for 526
earthquakes: a cross-country comparison between Fukui, Japan and the San Francisco Bay Area, 527
California, USA. Applied Geography, 25(3), 201-225, 2005. 528
529
Torani, S., Majd, P. M., Maroufi, S. S., Dowlati, M., & Sheikhi, R. A.: The importance of education 530
on disasters and emergencies: A review article. Journal of education and health promotion, 8, 531
2019. 532
533
Turner, R. H.: Earthquake prediction and public policy: Disillusions from a National 534
Academy of Sciences report (1). Mass Emergencies, 1, 179–202, 1976. 535
536
Weinstein, N. D.: The precaution adoption process. Health psychology, 7(4), 355, 1988. 537
538
539
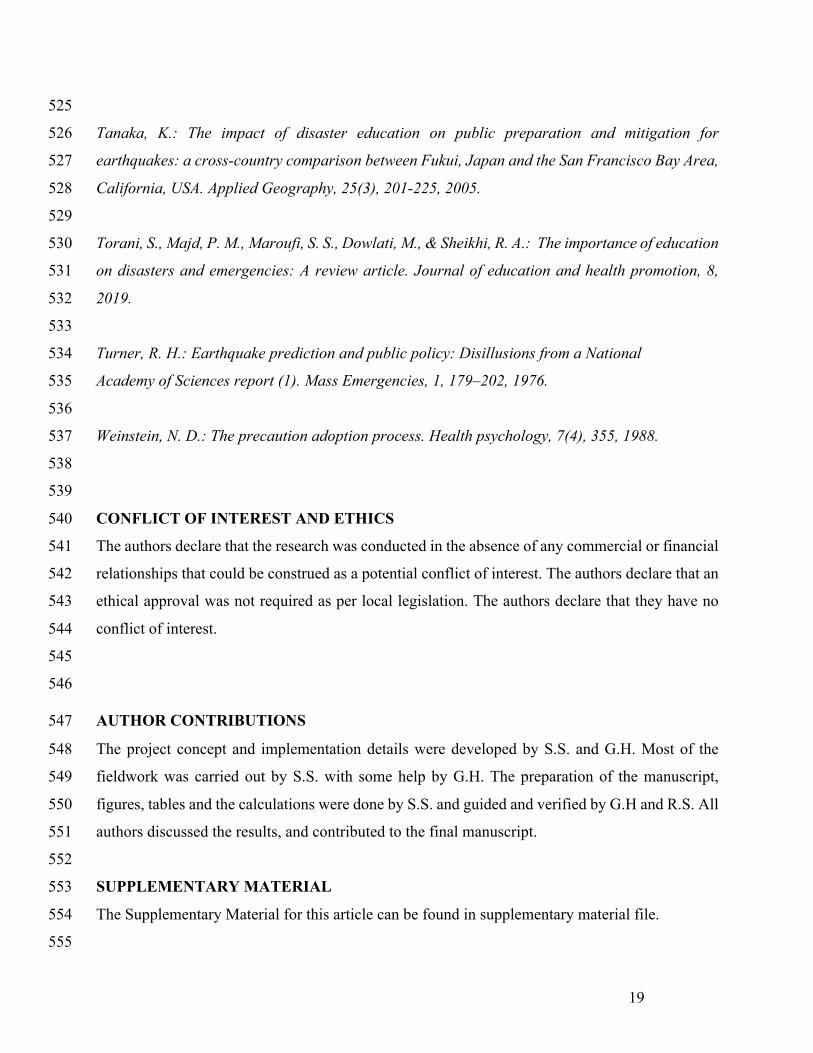
CONFLICT OF INTEREST AND ETHICS 540
The authors declare that the research was conducted in the absence of any commercial or financial 541
relationships that could be construed as a potential conflict of interest. The authors declare that an 542
ethical approval was not required as per local legislation. The authors declare that they have no 543
conflict of interest. 544
545
546
AUTHOR CONTRIBUTIONS 547
The project concept and implementation details were developed by S.S. and G.H. Most of the 548
fieldwork was carried out by S.S. with some help by G.H. The preparation of the manuscript, 549
figures, tables and the calculations were done by S.S. and guided and verified by G.H and R.S. All 550
authors discussed the results, and contributed to the final manuscript. 551
552
SUPPLEMENTARY MATERIAL 553
The Supplementary Material for this article can be found in supplementary material file. 554
555

20
556
DATA AVAILABILITY STATEMENT 557
The datasets used for this study can be available on request to corresponding author. 558
559
Figure 1 560
561 Figure 2 562

21
563 564
565
566
567
Figure 3 568
569 570
571
572
573
574
575

22
576
577
578
579
580
581
582
583
584
585
586
587
588
589
590
591
Figure 4 592

23
593 594
595
596
597
598
599
600
601

24
602
Figure 5 603
604 605
606
607
608
609
610
611
612
613
614
615
616
617
618
619
620
25
621
Figure 6 622
623 624
625
626
627
628
26
629
Figure 7 630
631 632
Figure 8 633
634 635
Figure 9 636

27
637 638
639
Figure10 640
641 642

28
Figure 11 643
644 645
646
Figure 12 647
29
648
Recommended