8/7/2019 110326 - Weekly
http://slidepdf.com/reader/full/110326-weekly 1/17
.
Saturday, March 26, 2011
Wealth Research, Unicon Financial Intermediaries. Pvt. Ltd . 1.
Headlines(Global Economy ) US Economy grew 3.1% in the 4th Quarter of 2010.
(Indian Economy ) Govt. introduces Constitutional Amendment to pass the GST in Parliament.
(Economic Calendar )
(Global and Domestic Stock Markets )
(Derivative Analysis) Nifty Mar Futures closed at 5680.70
(Technical Analysis) Nifty Support levels are at at 5550-5500
(Weekly Recommendations) GVKPIL and TATA MOTORS
(Sector & Company Highlights)
(MF Industry update)
8/7/2019 110326 - Weekly
http://slidepdf.com/reader/full/110326-weekly 2/17
Wealth Research, Unicon Financial Intermediaries. Pvt. Ltd . 2.
Saturday, March 26, 2011
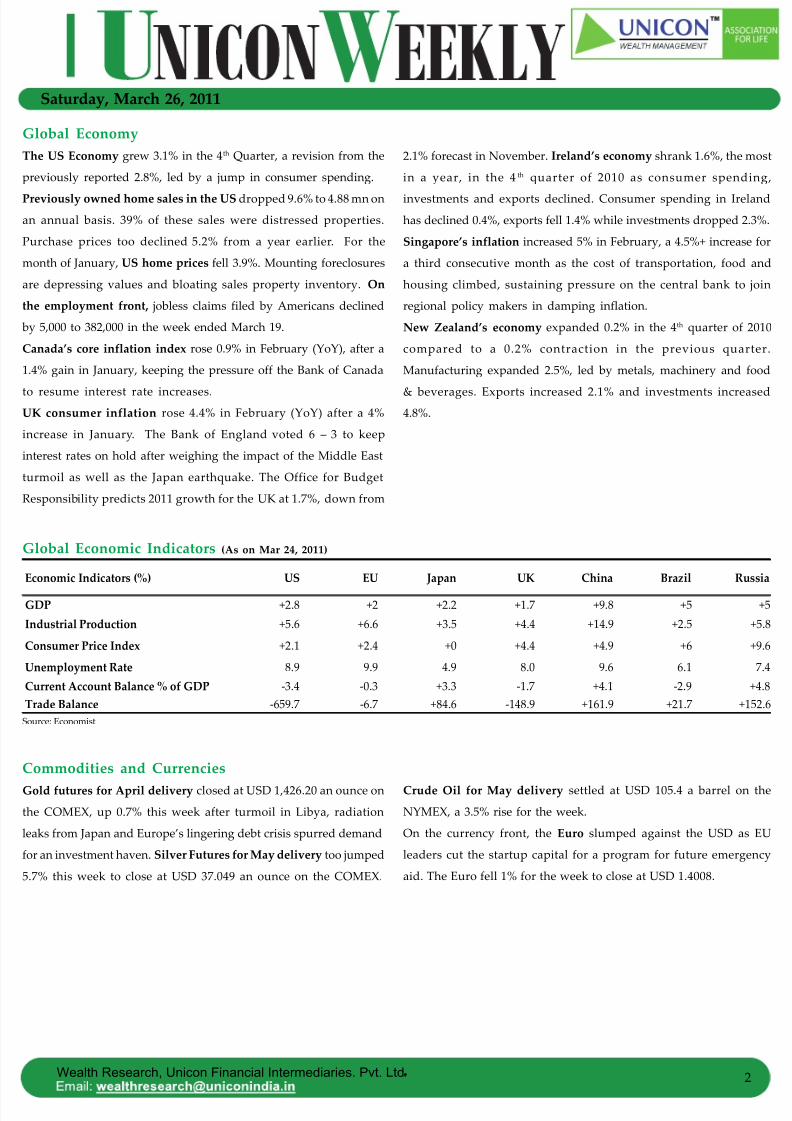
Global EconomyThe US Economy grew 3.1% in the 4 th Quarter, a revision from the
previously reported 2.8%, led by a jump in consumer spending.
Previously owned home sales in the US dropped 9.6% to 4.88 mn onan annual basis. 39% of these sales were distressed properties.
Purchase prices too declined 5.2% from a year earlier. For the
month of January, US home prices fell 3.9%. Mounting foreclosures
are depressing values and bloating sales property inventory. On
he employment front, jobless claims filed by Americans declined
by 5,000 to 382,000 in the week ended March 19.
Canada’s core inflation index rose 0.9% in February (YoY), after a
1.4% gain in January, keeping the pressure off the Bank of Canada
o resume interest rate increases.UK consumer inflation rose 4.4% in February (YoY) after a 4%
ncrease in January. The Bank of England voted 6 – 3 to keep
nterest rates on hold after weighing the impact of the Middle East
urmoil as well as the Japan earthquake. The Office for Budget
Responsibility predicts 2011 growth for the UK at 1.7%, down from
Global Economic Indicators (As on Mar 24, 2011)
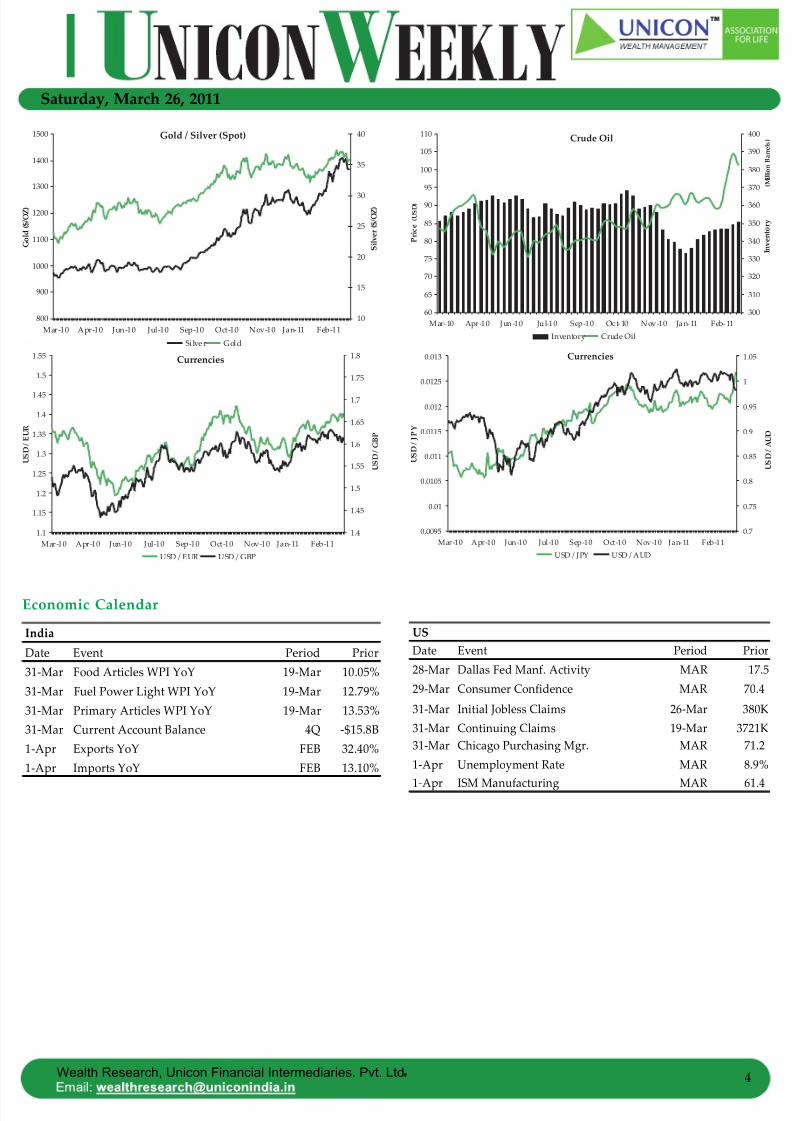
Commodities and CurrenciesGold futures for April delivery closed at USD 1,426.20 an ounce on
he COMEX, up 0.7% this week after turmoil in Libya, radiation
eaks from Japan and Europe’s lingering debt crisis spurred demand
for an investment haven. Silver Futures for May delivery too jumped
5.7% this week to close at USD 37.049 an ounce on the COMEX.
Source: Economist
2.1% forecast in November. Ireland’s economy shrank 1.6%, the most
in a year, in the 4 th quarter of 2010 as consumer spending,
investments and exports declined. Consumer spending in Irelandhas declined 0.4%, exports fell 1.4% while investments dropped 2.3%.
Singapore’s inflation increased 5% in February, a 4.5%+ increase for
a third consecutive month as the cost of transportation, food and
housing climbed, sustaining pressure on the central bank to join
regional policy makers in damping inflation.
New Zealand’s economy expanded 0.2% in the 4 th quarter of 2010
compared to a 0.2% contraction in the previous quarter.
Manufacturing expanded 2.5%, led by metals, machinery and food
& beverages. Exports increased 2.1% and investments increased4.8%.
Crude Oil for May delivery settled at USD 105.4 a barrel on the
NYMEX, a 3.5% rise for the week.
On the currency front, the Euro slumped against the USD as EU
leaders cut the startup capital for a program for future emergency
aid. The Euro fell 1% for the week to close at USD 1.4008.
Economic Indicators (%) US EU Japan UK China Brazil Russia
GDP +2.8 +2 +2.2 +1.7 +9.8 +5 +5Industrial Production +5.6 +6.6 +3.5 +4.4 +14.9 +2.5 +5.8
Consumer Price Index +2.1 +2.4 +0 +4.4 +4.9 +6 +9.6
Unemployment Rate 8.9 9.9 4.9 8.0 9.6 6.1 7.4Current Account Balance % of GDP -3.4 -0.3 +3.3 -1.7 +4.1 -2.9 +4.8Trade Balance -659.7 -6.7 +84.6 -148.9 +161.9 +21.7 +152.6
8/7/2019 110326 - Weekly
http://slidepdf.com/reader/full/110326-weekly 3/17
.
Saturday, March 26, 2011
Wealth Research, Unicon Financial Intermediaries. Pvt. Ltd . 3.
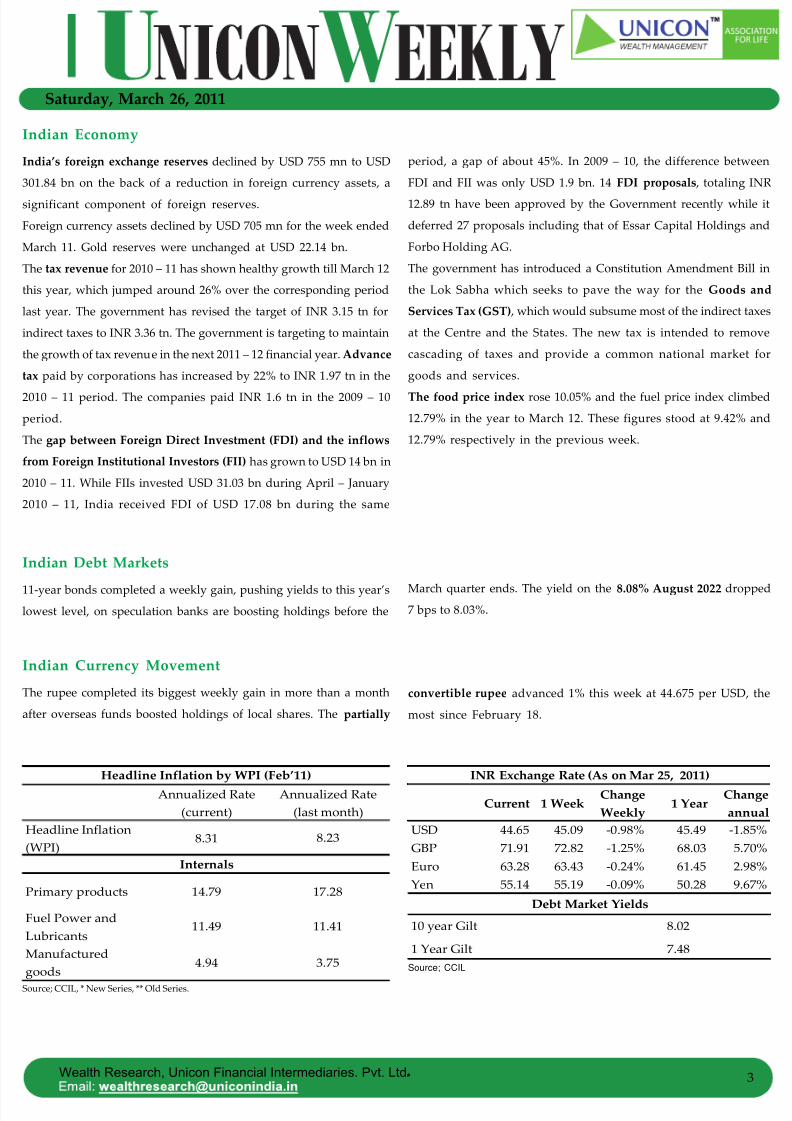
Indian Economy
ndia’s foreign exchange reserves declined by USD 755 mn to USD
301.84 bn on the back of a reduction in foreign currency assets, a
significant component of foreign reserves.
Foreign currency assets declined by USD 705 mn for the week ended
March 11. Gold reserves were unchanged at USD 22.14 bn.
The tax revenue for 2010 – 11 has shown healthy growth till March 12
his year, which jumped around 26% over the corresponding period
ast year. The government has revised the target of INR 3.15 tn for
ndirect taxes to INR 3.36 tn. The government is targeting to maintain
he growth of tax revenue in the next 2011 – 12 financial year. Advance
ax paid by corporations has increased by 22% to INR 1.97 tn in the
2010 – 11 period. The companies paid INR 1.6 tn in the 2009 – 10
period.
The gap between Foreign Direct Investment (FDI) and the inflows
from Foreign Institutional Investors (FII) has grown to USD 14 bn in
2010 – 11. While FIIs invested USD 31.03 bn during April – January
2010 – 11, India received FDI of USD 17.08 bn during the same
Indian Debt Markets
11-year bonds completed a weekly gain, pushing yields to this year’sowest level, on speculation banks are boosting holdings before the
Source; CCIL, * New Series, ** Old Series.
Source; CCIL
Indian Currency Movement
The rupee completed its biggest weekly gain in more than a month
after overseas funds boosted holdings of local shares. The partially
period, a gap of about 45%. In 2009 – 10, the difference between
FDI and FII was only USD 1.9 bn. 14 FDI proposals , totaling INR
12.89 tn have been approved by the Government recently while it
deferred 27 proposals including that of Essar Capital Holdings and
Forbo Holding AG.
The government has introduced a Constitution Amendment Bill in
the Lok Sabha which seeks to pave the way for the Goods and
Services Tax (GST) , which would subsume most of the indirect taxes
at the Centre and the States. The new tax is intended to remove
cascading of taxes and provide a common national market for
goods and services.
The food price index rose 10.05% and the fuel price index climbed
12.79% in the year to March 12. These figures stood at 9.42% and
12.79% respectively in the previous week.
March quarter ends. The yield on the 8.08% August 2022 dropped7 bps to 8.03%.
convertible rupee advanced 1% this week at 44.675 per USD, the
most since February 18.
Annualized Rate(current)
Annualized Rate(last month)
Headline Inflation(WPI)
8.31
Primary products 14.79 17.28
Fuel Power andLubricants
11.49 11.41
Manufacturedgoods
4.94 3.75
Headline Inflation by WPI (Feb’11)
8.23
Internals
Current 1 WeekChangeWeekly
1 YearChangeannual
USD 44.65 45.09 -0.98% 45.49 -1.85%GBP 71.91 72.82 -1.25% 68.03 5.70%Euro 63.28 63.43 -0.24% 61.45 2.98%Yen 55.14 55.19 -0.09% 50.28 9.67%
1 Year Gilt 7.48
Debt Market Yields
INR Exchange Rate (As on Mar 25, 2011)
10 year Gilt 8.02
8/7/2019 110326 - Weekly
http://slidepdf.com/reader/full/110326-weekly 4/17
8/7/2019 110326 - Weekly
http://slidepdf.com/reader/full/110326-weekly 5/17
.
Saturday, March 26, 2011
Wealth Research, Unicon Financial Intermediaries. Pvt. Ltd . 5.
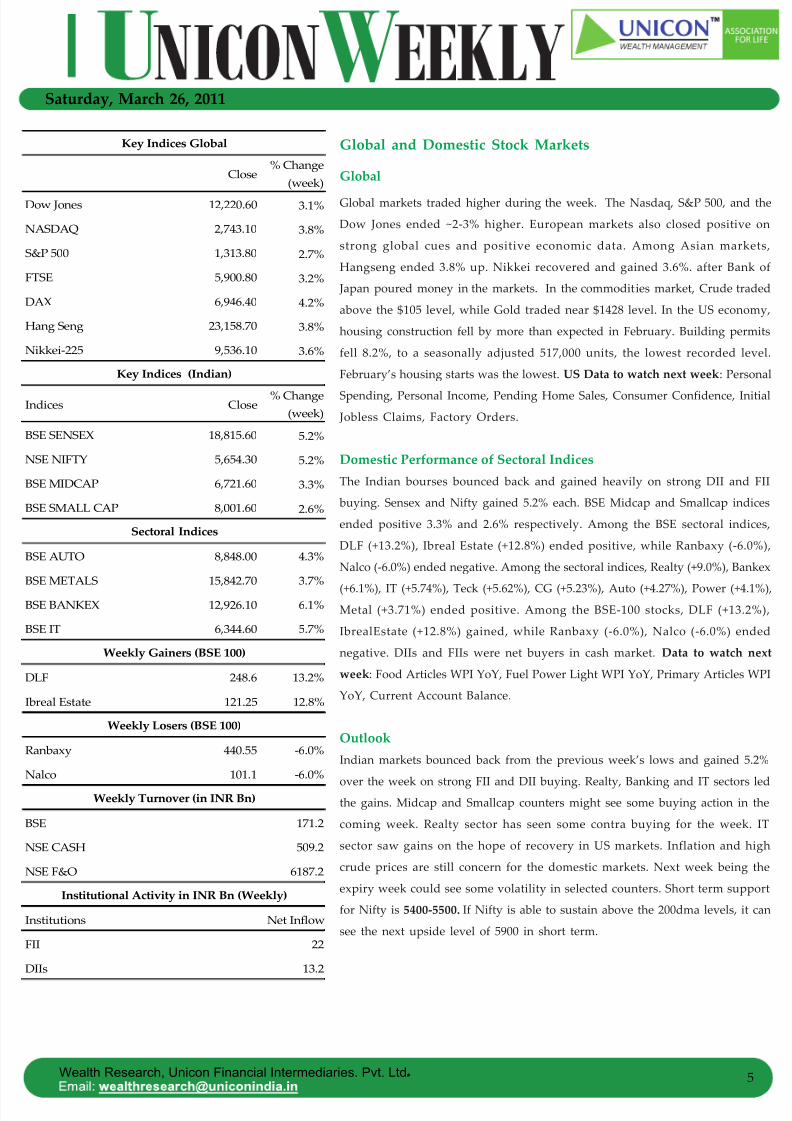
Global and Domestic Stock Markets
Global
Global markets traded higher during the week. The Nasdaq, S&P 500, and the
Dow Jones ended ~2-3% higher. European markets also closed positive on
strong global cues and positive economic data. Among Asian markets,
Hangseng ended 3.8% up. Nikkei recovered and gained 3.6%. after Bank of
Japan poured money in the markets. In the commodities market, Crude traded
above the $105 level, while Gold traded near $1428 level. In the US economy,
housing construction fell by more than expected in February. Building permits
fell 8.2%, to a seasonally adjusted 517,000 units, the lowest recorded level.
February’s housing starts was the lowest. US Data to watch next week : Personal
Spending, Personal Income, Pending Home Sales, Consumer Confidence, Initial
Jobless Claims, Factory Orders.
Domestic Performance of Sectoral IndicesThe Indian bourses bounced back and gained heavily on strong DII and FII
buying. Sensex and Nifty gained 5.2% each. BSE Midcap and Smallcap indices
ended positive 3.3% and 2.6% respectively. Among the BSE sectoral indices,
DLF (+13.2%), Ibreal Estate (+12.8%) ended positive, while Ranbaxy (-6.0%),
Nalco (-6.0%) ended negative. Among the sectoral indices, Realty (+9.0%), Bankex
(+6.1%), IT (+5.74%), Teck (+5.62%), CG (+5.23%), Auto (+4.27%), Power (+4.1%),Metal (+3.71%) ended positive. Among the BSE-100 stocks, DLF (+13.2%),
IbrealEstate (+12.8%) gained, while Ranbaxy (-6.0%), Nalco (-6.0%) ended
negative. DIIs and FIIs were net buyers in cash market. Data to watch next
week : Food Articles WPI YoY, Fuel Power Light WPI YoY, Primary Articles WPI
YoY, Current Account Balance.
OutlookIndian markets bounced back from the previous week’s lows and gained 5.2%
over the week on strong FII and DII buying. Realty, Banking and IT sectors ledthe gains. Midcap and Smallcap counters might see some buying action in the
coming week. Realty sector has seen some contra buying for the week. IT
sector saw gains on the hope of recovery in US markets. Inflation and high
crude prices are still concern for the domestic markets. Next week being the
expiry week could see some volatility in selected counters. Short term support
for Nifty is 5400-5500. If Nifty is able to sustain above the 200dma levels, it can
see the next upside level of 5900 in short term.
Close% Change
(week)
Dow Jones 12,220.60 3.1%
NASDAQ 2,743.10 3.8%
S&P 500 1,313.80 2.7%
FTSE 5,900.80 3.2%
DAX 6,946.40 4.2%
Hang Seng 23,158.70 3.8%
Nikkei-225 9,536.10 3.6%
Indices Close% Change
(week)
BSE SENSEX 18,815.60 5.2%
NSE NIFTY 5,654.30 5.2%
BSE MIDCAP 6,721.60 3.3%
BSE SMALL CAP 8,001.60 2.6%
BSE AUTO 8,848.00 4.3%
BSE METALS 15,842.70 3.7%
BSE BANKEX 12,926.10 6.1%
BSE IT 6,344.60 5.7%
DLF 248.6 13.2%
Ibreal Estate 121.25 12.8%
Ranbaxy 440.55 -6.0%
Nalco 101.1 -6.0%
BSE 171.2
NSE CASH 509.2
NSE F&O 6187.2
Institutions Net Inflow
FII 22
DIIs 13.2
Institutional Activity in INR Bn (Weekly)
Key Indices Global
Sectoral Indices
Key Indices (Indian)
Weekly Gainers (BSE 100)
Weekly Losers (BSE 100)
Weekly Turnover (in INR Bn)
8/7/2019 110326 - Weekly
http://slidepdf.com/reader/full/110326-weekly 6/17
Wealth Research, Unicon Financial Intermediaries. Pvt. Ltd . 6.
Saturday, March 26, 2011
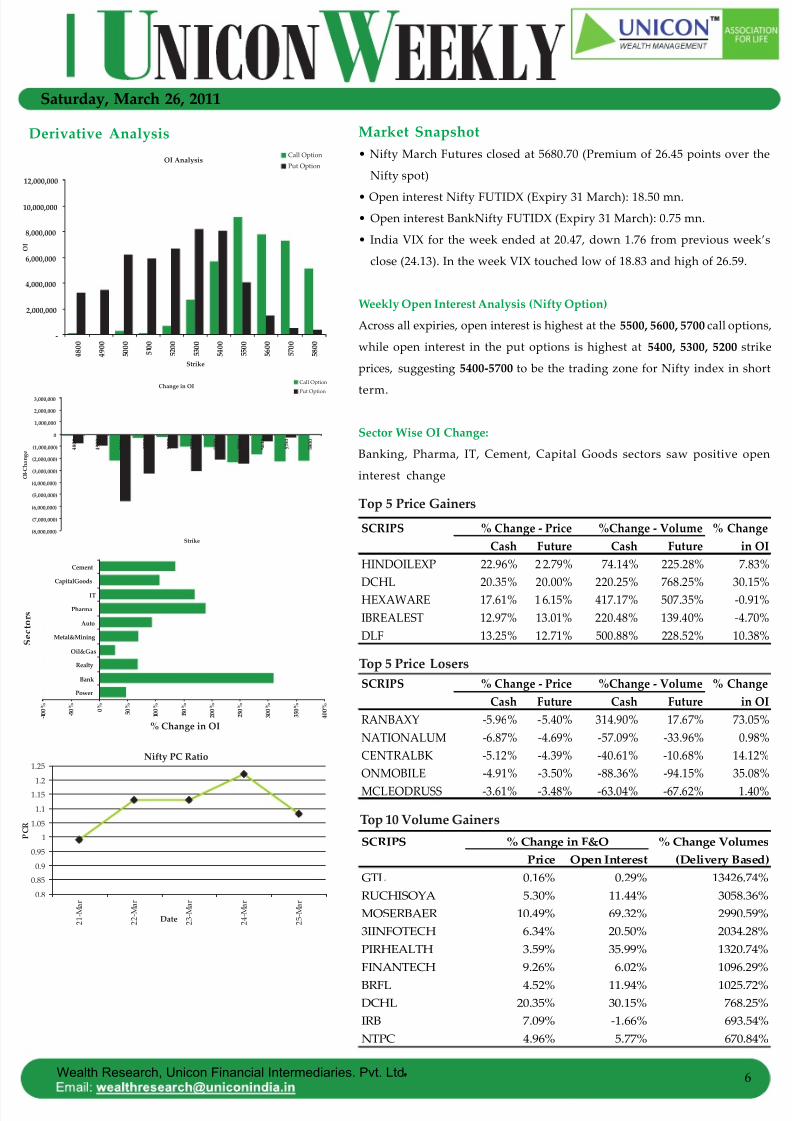
Derivative Analysis
Top 5 Price Losers
Top 10 Volume Gainers
Top 5 Price Gainers
Market Snapshot• Nifty March Futures closed at 5680.70 (Premium of 26.45 points over the
Nifty spot)
• Open interest Nifty FUTIDX (Expiry 31 March): 18.50 mn.• Open interest BankNifty FUTIDX (Expiry 31 March): 0.75 mn.
• India VIX for the week ended at 20.47, down 1.76 from previous week’s
close (24.13). In the week VIX touched low of 18.83 and high of 26.59.
Weekly Open Interest Analysis (Nifty Option)
Across all expiries, open interest is highest at the 5500, 5600, 5700 call options,
while open interest in the put options is highest at 5400, 5300, 5200 strike
prices, suggesting 5400-5700 to be the trading zone for Nifty index in short
term.
Sector Wise OI Change:
Banking, Pharma, IT, Cement, Capital Goods sectors saw positive open
interest change
Cash Future Cash FutureHINDOILEXP 22.96% 2 2.79% 74.14% 225.28% 7.83%
DCHL 20.35% 20.00% 220.25% 768.25% 30.15%HEXAWARE 17.61% 1 6.15% 417.17% 507.35% -0.91%IBREALEST 12.97% 13.01% 220.48% 139.40% -4.70%DLF 13.25% 12.71% 500.88% 228.52% 10.38%
SCRIPS % Change - Price %Change - Volume % Changein OI
Cash Future Cash FutureRANBAXY -5.96% -5.40% 314.90% 17.67% 73.05%NATIONALUM -6.87% -4.69% -57.09% -33.96% 0.98%CENTRALBK -5.12% -4.39% -40.61% -10.68% 14.12%ONMOBILE -4.91% -3.50% -88.36% -94.15% 35.08%MCLEODRUSS -3.61% -3.48% -63.04% -67.62% 1.40%
SCRIPS % Change - Price %Change - Volume % Changein OI
% Change VolumesPrice Open Interest (Delivery Based)
GTL 0.16% 0.29% 13426.74%RUCHISOYA 5.30% 11.44% 3058.36%MOSERBAER 10.49% 69.32% 2990.59%3IINFOTECH 6.34% 20.50% 2034.28%PIRHEALTH 3.59% 35.99% 1320.74%FINANTECH 9.26% 6.02% 1096.29%
BRFL 4.52% 11.94% 1025.72%DCHL 20.35% 30.15% 768.25%IRB 7.09% -1.66% 693.54%NTPC 4.96% 5.77% 670.84%
SCRIPS % Change in F&O
OI Analysis
-
2,000,000
4,000,000
6,000,000
8,000,000
10,000,000
12,000,000
4800
4900
5000
5100
5200
5300
5400
5500
5600
5700
5800
Strike
OI
Call Option
Put Option
Change in OI
(8,000,000)
(7,000,000)
(6,000,000)
(5,000,000)
(4,000,000)
(3,000,000)
(2,000,000)
(1,000,000)
0
1,000,000
2,000,000
3,000,000
4800
4900
5000
5100
5200
5300
5400
5500
5600
5700
5800
Strike
OI-Change
Call Option
Put Option
-100%
-50% 0% 50
%100%
150%
200%
250%
300%
350%
400%
Power
Bank
Realty
Oil&Gas
Metal&Mining
Auto
Pharma
IT
CapitalGoods
Cement
Sectors
% Change in OI
Nifty PC Ratio
0.8
0.85
0.9
0.95
1
1.05
1.1
1.15
1.2
1.25
21-Mar
22-Mar
23-Mar
24-Mar
25-Mar
Date
PCR
8/7/2019 110326 - Weekly
http://slidepdf.com/reader/full/110326-weekly 7/17
.
Saturday, March 26, 2011
Wealth Research, Unicon Financial Intermediaries. Pvt. Ltd . 7.
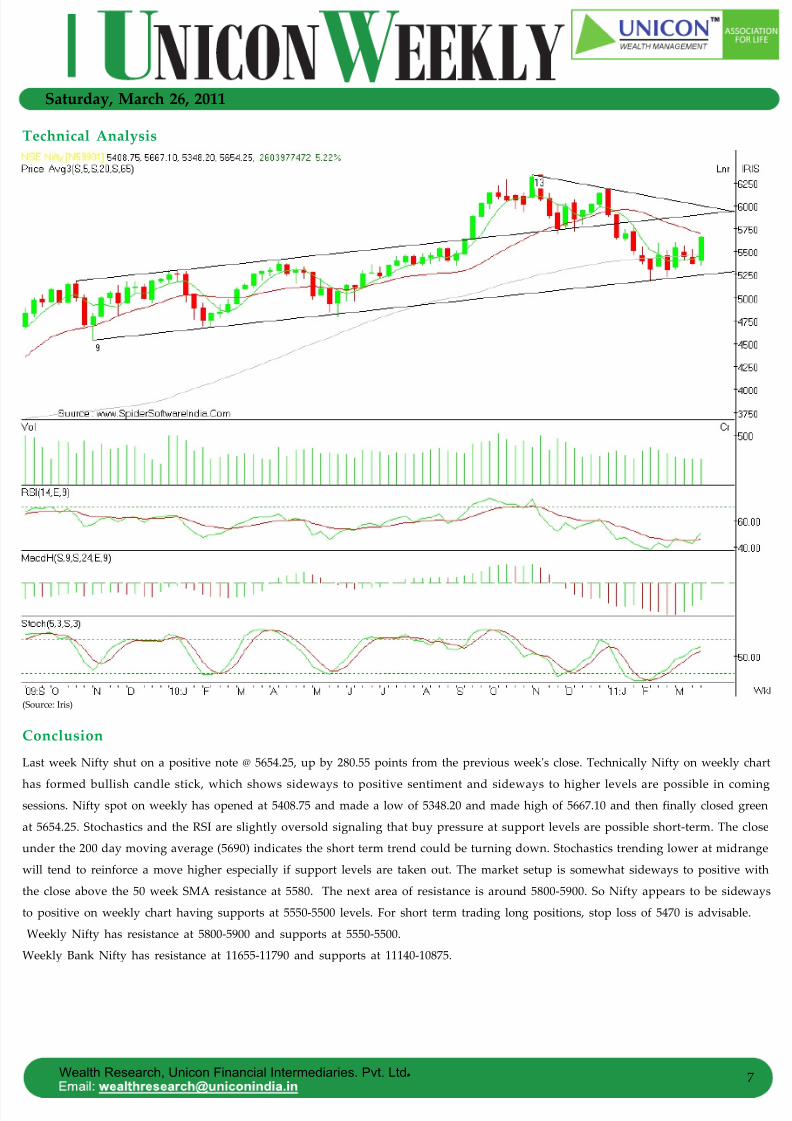
Technical Analysis
Source: Iris)
Conclusion
Last week Nifty shut on a positive note @ 5654.25, up by 280.55 points from the previous week's close. Technically Nifty on weekly chart
has formed bullish candle stick, which shows sideways to positive sentiment and sideways to higher levels are possible in comingsessions. Nifty spot on weekly has opened at 5408.75 and made a low of 5348.20 and made high of 5667.10 and then finally closed green
at 5654.25. Stochastics and the RSI are slightly oversold signaling that buy pressure at support levels are possible short-term. The close
under the 200 day moving average (5690) indicates the short term trend could be turning down. Stochastics trending lower at midrange
will tend to reinforce a move higher especially if support levels are taken out. The market setup is somewhat sideways to positive with
he close above the 50 week SMA resistance at 5580. The next area of resistance is around 5800-5900. So Nifty appears to be sideways
o positive on weekly chart having supports at 5550-5500 levels. For short term trading long positions, stop loss of 5470 is advisable.
Weekly Nifty has resistance at 5800-5900 and supports at 5550-5500.
Weekly Bank Nifty has resistance at 11655-11790 and supports at 11140-10875.
8/7/2019 110326 - Weekly
http://slidepdf.com/reader/full/110326-weekly 8/17
Wealth Research, Unicon Financial Intermediaries. Pvt. Ltd . 8.
Saturday, March 26, 2011
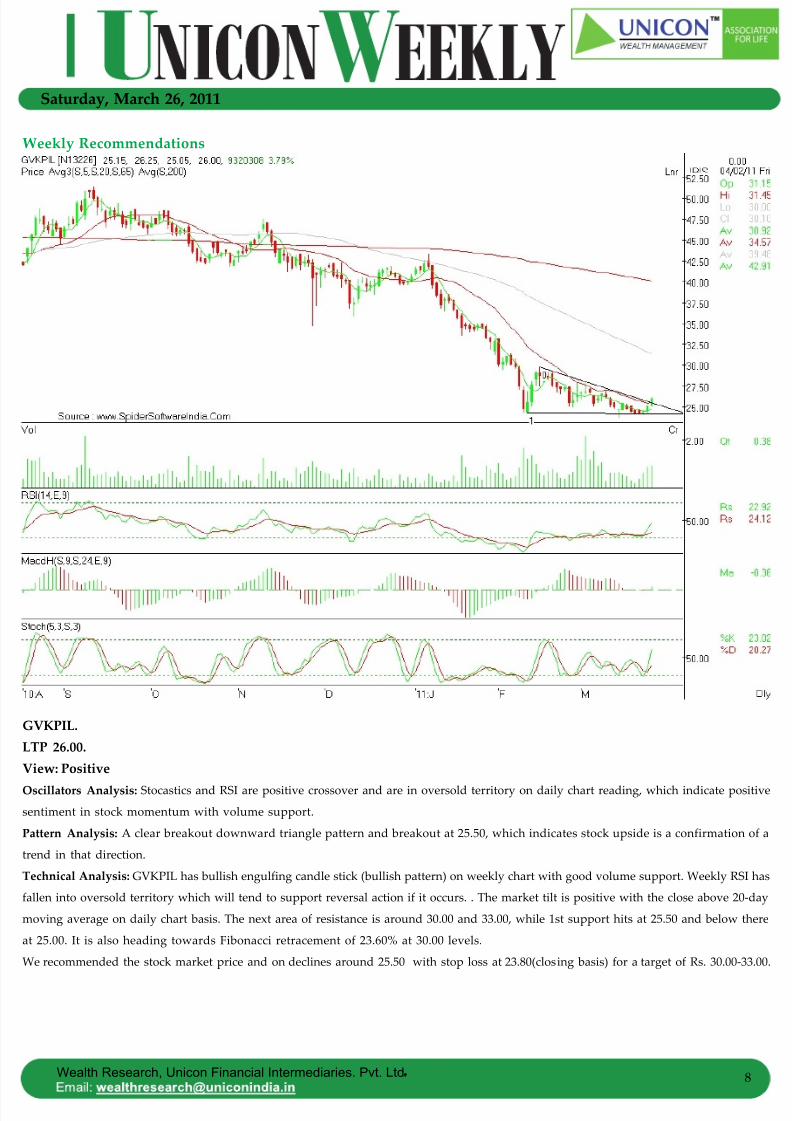
GVKPIL.LTP 26.00.View: PositiveOscillators Analysis: Stocastics and RSI are positive crossover and are in oversold territory on daily chart reading, which indicate positive
sentiment in stock momentum with volume support.
Pattern Analysis: A clear breakout downward triangle pattern and breakout at 25.50, which indicates stock upside is a confirmation of a
rend in that direction.
Technical Analysis: GVKPIL has bullish engulfing candle stick (bullish pattern) on weekly chart with good volume support. Weekly RSI has
fallen into oversold territory which will tend to support reversal action if it occurs. . The market tilt is positive with the close above 20-day
moving average on daily chart basis. The next area of resistance is around 30.00 and 33.00, while 1st support hits at 25.50 and below there
at 25.00. It is also heading towards Fibonacci retracement of 23.60% at 30.00 levels.
We recommended the stock market price and on declines around 25.50 with stop loss at 23.80(closing basis) for a target of Rs. 30.00-33.00.
Weekly Recommendations
8/7/2019 110326 - Weekly
http://slidepdf.com/reader/full/110326-weekly 9/17
.
Saturday, March 26, 2011
Wealth Research, Unicon Financial Intermediaries. Pvt. Ltd . 9.
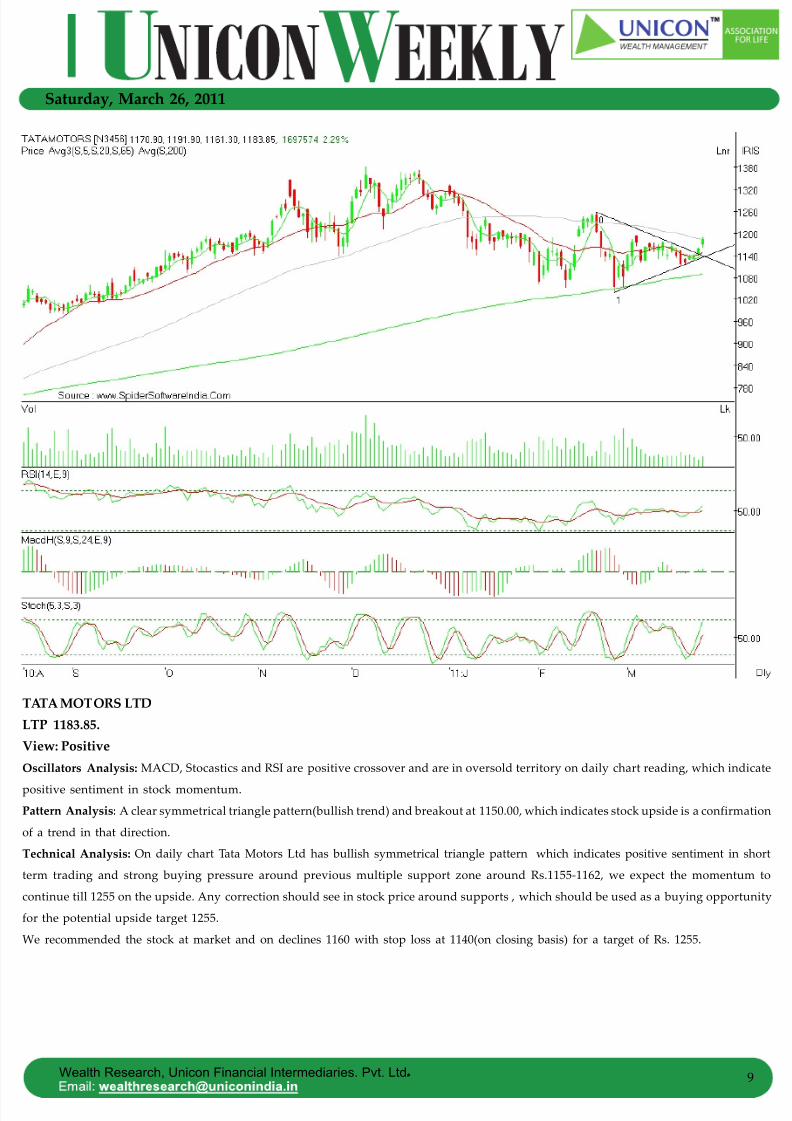
TATA MOTORS LTDLTP 1183.85.View: PositiveOscillators Analysis: MACD, Stocastics and RSI are positive crossover and are in oversold territory on daily chart reading, which indicate
positive sentiment in stock momentum.
Pattern Analysis: A clear symmetrical triangle pattern(bullish trend) and breakout at 1150.00, which indicates stock upside is a confirmation
of a trend in that direction.
Technical Analysis: On daily chart Tata Motors Ltd has bullish symmetrical triangle pattern which indicates positive sentiment in short
erm trading and strong buying pressure around previous multiple support zone around Rs.1155-1162, we expect the momentum to
continue till 1255 on the upside. Any correction should see in stock price around supports , which should be used as a buying opportunity
for the potential upside target 1255.
We recommended the stock at market and on declines 1160 with stop loss at 1140(on closing basis) for a target of Rs. 1255.
8/7/2019 110326 - Weekly
http://slidepdf.com/reader/full/110326-weekly 10/17
Wealth Research, Unicon Financial Intermediaries. Pvt. Ltd . 10.
Saturday, March 26, 2011-7- Sector & Company HighlightsCapital Goods and Infrastructure
Madhucon Projects has received road project from NHAI on Annuity basis (163.50 km in Jharkhand) valued at INR 15 bn. Positive, as it
improves the revenue visibility of the company.Patel Engineering has secured a contract worth INR 1.6 bn (73.8 km Tinthini Kalmala Road upgradation project in the state of Karnataka
from Public Works, Ports, & Inland Water Transport Department. The project is to be completed over 2.5 years. Positive, as it improves
the revenue visibility of the company.
BHEL has won an order in a consortium with ABB from Indian state-run Power Grid for a power transmission link. The project value for
BHEL is INR 15.9 bn. Positive, as it improves the revenue visibility of the company.
Information TechnologyTata Consultancy Services Ltd. (TCS) has announced plans to ramp up its customer base for its “iON” product meant for small and
medium businesses to more than 1,000 by the end of current year. The company has also bagged a contract from Shanghai RuralCommercial Bank for its banking software technology solution.
Mahindra Satyam Ltd. has been issued an INR 6.17 bn tax notice by the Central Board of Direct Taxes (CBDT). This development could
put pressure on the company’s bottom-line if it goes through as the company has only recently reported a profit since late 2008.
Acropetal Technologies Ltd. has entered into a definitive agreement to acquire two US-based companies LineBeyondInc and Optech
Consulting Inc. at a cost of USD 4.9 mn each. The acquisitions are part of the IPO objectives of the company although it remains to be
seen how this development adds to the company’s profits.
LogisticsGreat Eastern Shipping (GE Shipping) has deployed part of the cash generated from their traditional shipping business to expand their
offshore business with Singapore as the hub for global operations. GE Shipping has invested INR 4.5 bn in February to acquire two jack-
up rigs and expand its subsea operations.
Mundra Port and Special Economic Zone (MPSEZ), has secured a bid to develop a coal import terminal at Visakhapatnam. The terminal
will be built at cost of over INR 3 bn. This marks the entry of MPSEZ on the eastern coast of the India.
Media Buoyed by increasing media intake and strong recovery in advertising spending, the Indian Media & Entertainment industry is expected
to grow at a CAGR of 14% to touch USD 28 bn by 2015.
Reliance Broadcast Network Ltd. (RBNL) will spend over INR 100 mn on promotion and marketing to support the launch of its new
English lifestyle channel – Big CBS Love.
Eros International Media Ltd . is eyeing 35% growth in its bottom-line for FY12 as it will focus more on profitability than top line.
Power & Power Equipment Australia-based solar power company Sunengy has entered into a partnership with Tata Power that will allow it to build a pilot plant for
its low-cost, floating on water, solar technology in India by the end of this year.
Reliance Power and Tata Power-SN Power joint venture have been allotted hydropower projects in Himachal Pradesh. Reliance Power
has got five out of the 18 projects for which global bids were invited by the state.
Telecom TDSAT has stayed the INR 500 mn penalty imposed by the DoT on Idea Cellular for violating license conditions by merging the firm with
Spice Telecom.
Bharti Airtel Ltd . has no immediate plans for an IPO of its telecom towers unit.
8/7/2019 110326 - Weekly
http://slidepdf.com/reader/full/110326-weekly 11/17
.
Saturday, March 26, 2011
Wealth Research, Unicon Financial Intermediaries. Pvt. Ltd . 11.
Mutual Fund Insights
Scheme Update
LIC Mutual Fund Infrastructure Fund which was launched as a 36 month, close
ended equity scheme is being converted into an open ended equity scheme with
effect from 24 March 2011. Pursuant to the conversion into open ended equity
scheme, the following changes will come into effect. The exit load charge will be
1% if exited within 1 year from the date of allotment of units and nil if exited after
1 year from the date of allotment of units. The minimum investment amount will
be Rs 2000 and thereafter in multiples of Rs 1 except in case of SIP where the
minimum amount would be Rs 100.
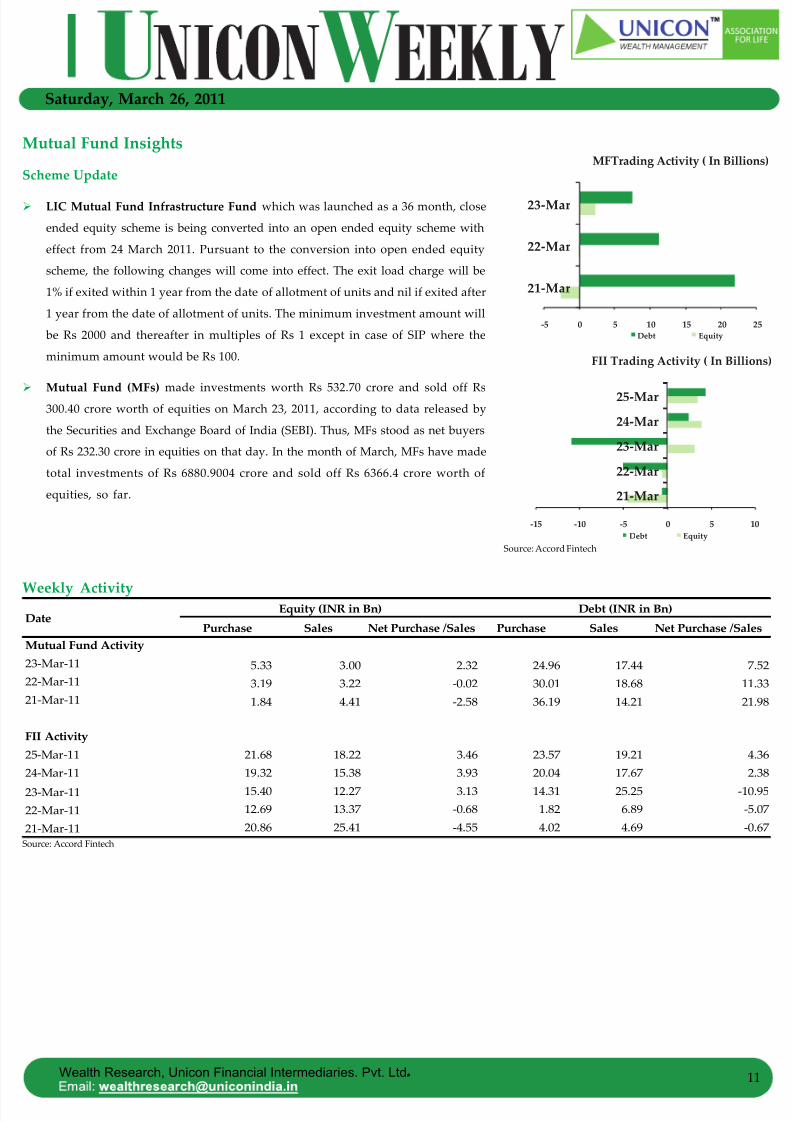
Mutual Fund (MFs) made investments worth Rs 532.70 crore and sold off Rs300.40 crore worth of equities on March 23, 2011, according to data released by
the Securities and Exchange Board of India (SEBI). Thus, MFs stood as net buyers
of Rs 232.30 crore in equities on that day. In the month of March, MFs have made
total investments of Rs 6880.9004 crore and sold off Rs 6366.4 crore worth of
equities, so far.
Source: Accord Fintech
Source: Accord Fintech
Weekly Activity
-5 0 5 10 15 20 25
21-Mar
22-Mar
23-Mar
MFTrading Activity ( In Billions)
Debt Equity
-15 -10 -5 0 5 10
21-Mar
22-Mar
23-Mar
24-Mar
25-Mar
FII Trading Activity ( In Billions)
Debt Equity
Purchase Sales Net Purchase /Sales Purchase Sales Net Purchase /SalesMutual Fund Activity23-Mar-11 5.33 3.00 2.32 24.96 17.44 7.5222-Mar-11 3.19 3.22 -0.02 30.01 18.68 11.3321-Mar-11 1.84 4.41 -2.58 36.19 14.21 21.98
FII Activity
25-Mar-11 21.68 18.22 3.46 23.57 19.21 4.3624-Mar-11 19.32 15.38 3.93 20.04 17.67 2.38
23-Mar-11 15.40 12.27 3.13 14.31 25.25 -10.95
22-Mar-11 12.69 13.37 -0.68 1.82 6.89 -5.07
21-Mar-11 20.86 25.41 -4.55 4.02 4.69 -0.67
DateEquity (INR in Bn) Debt (INR in Bn)
8/7/2019 110326 - Weekly
http://slidepdf.com/reader/full/110326-weekly 12/17
Wealth Research, Unicon Financial Intermediaries. Pvt. Ltd . 12.
Saturday, March 26, 2011
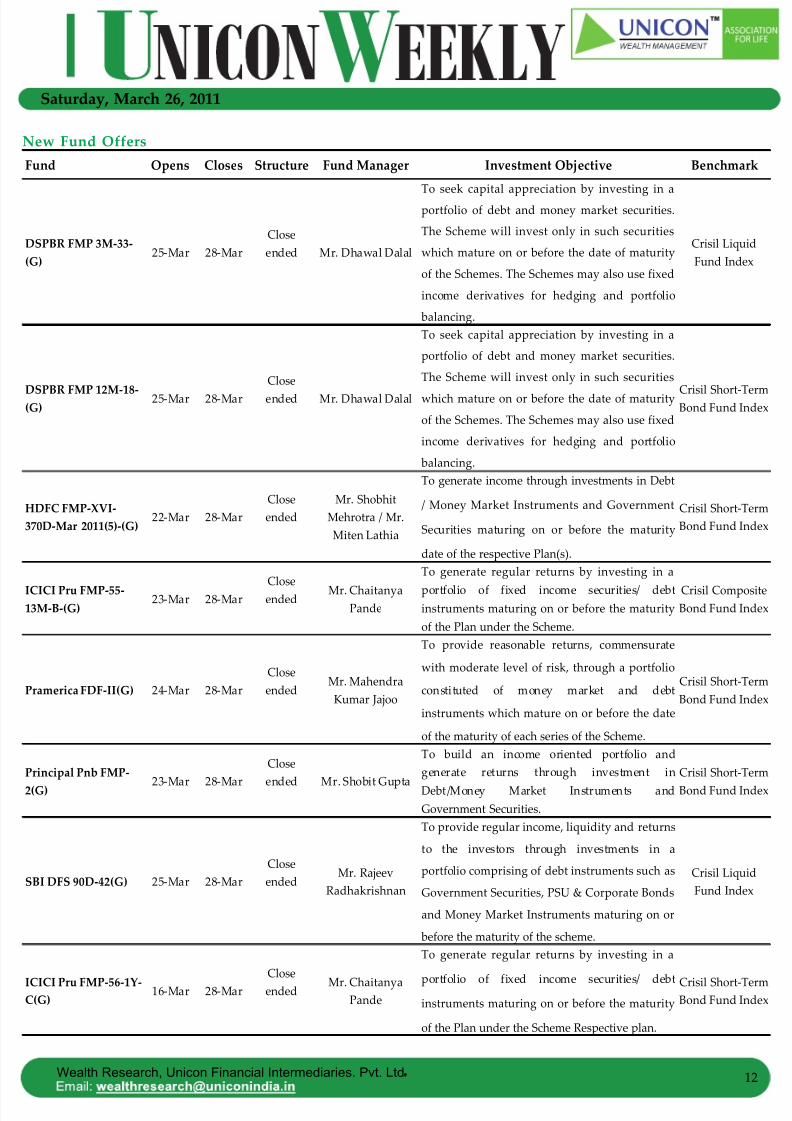
New Fund OffersFund Opens Closes Structure Fund Manager Investment Objective Benchmark
DSPBR FMP 3M-33-(G)
25-Mar 28-MarCloseended Mr. Dhawal Dalal
To seek capital appreciation by investing in a
portfolio of debt and money market securities.
The Scheme will invest only in such securities
which mature on or before the date of maturity
of the Schemes. The Schemes may also use fixed
income derivatives for hedging and portfolio
balancing.
Crisil LiquidFund Index
DSPBR FMP 12M-18-(G)
25-Mar 28-MarCloseended Mr. Dhawal Dalal
To seek capital appreciation by investing in a
portfolio of debt and money market securities.
The Scheme will invest only in such securities
which mature on or before the date of maturity
of the Schemes. The Schemes may also use fixed
income derivatives for hedging and portfolio
balancing.
Crisil Short-TermBond Fund Index
HDFC FMP-XVI-370D-Mar 2011(5)-(G)
22-Mar 28-MarCloseended
Mr. ShobhitMehrotra / Mr.Miten Lathia
To generate income through investments in Debt
/ Money Market Instruments and Government
Securities maturing on or before the maturity
date of the respective Plan(s).
Crisil Short-TermBond Fund Index
ICICI Pru FMP-55-13M-B-(G)
23-Mar 28-MarCloseended Mr. Chaitanya
Pande
To generate regular returns by investing in a
portfolio of fixed income securities/ debtinstruments maturing on or before the maturityof the Plan under the Scheme.
Crisil CompositeBond Fund Index
Pramerica FDF-II(G) 24-Mar 28-MarCloseended
Mr. MahendraKumar Jajoo
To provide reasonable returns, commensurate
with moderate level of risk, through a portfolio
constituted of money market and debt
instruments which mature on or before the date
of the maturity of each series of the Scheme.
Crisil Short-TermBond Fund Index
Principal Pnb FMP-2(G) 23-Mar 28-Mar
Close
ended Mr. Shobit Gupta
To build an income oriented portfolio andgenerate returns through investment inDebt/Money Market Instruments andGovernment Securities.
Crisil Short-TermBond Fund Index
SBI DFS 90D-42(G) 25-Mar 28-MarCloseended
Mr. RajeevRadhakrishnan
To provide regular income, liquidity and returns
to the investors through investments in a
portfolio comprising of debt instruments such as
Government Securities, PSU & Corporate Bonds
and Money Market Instruments maturing on or
before the maturity of the scheme.
Crisil LiquidFund Index
ICICI Pru FMP-56-1Y-C(G)
16-Mar 28-MarCloseended Mr. Chaitanya
Pande
To generate regular returns by investing in a
portfolio of fixed income securities/ debtinstruments maturing on or before the maturity
of the Plan under the Scheme Respective plan.
Crisil Short-TermBond Fund Index
8/7/2019 110326 - Weekly
http://slidepdf.com/reader/full/110326-weekly 13/17
.
Saturday, March 26, 2011
Wealth Research, Unicon Financial Intermediaries. Pvt. Ltd . 13.
Source: Accord Fintech
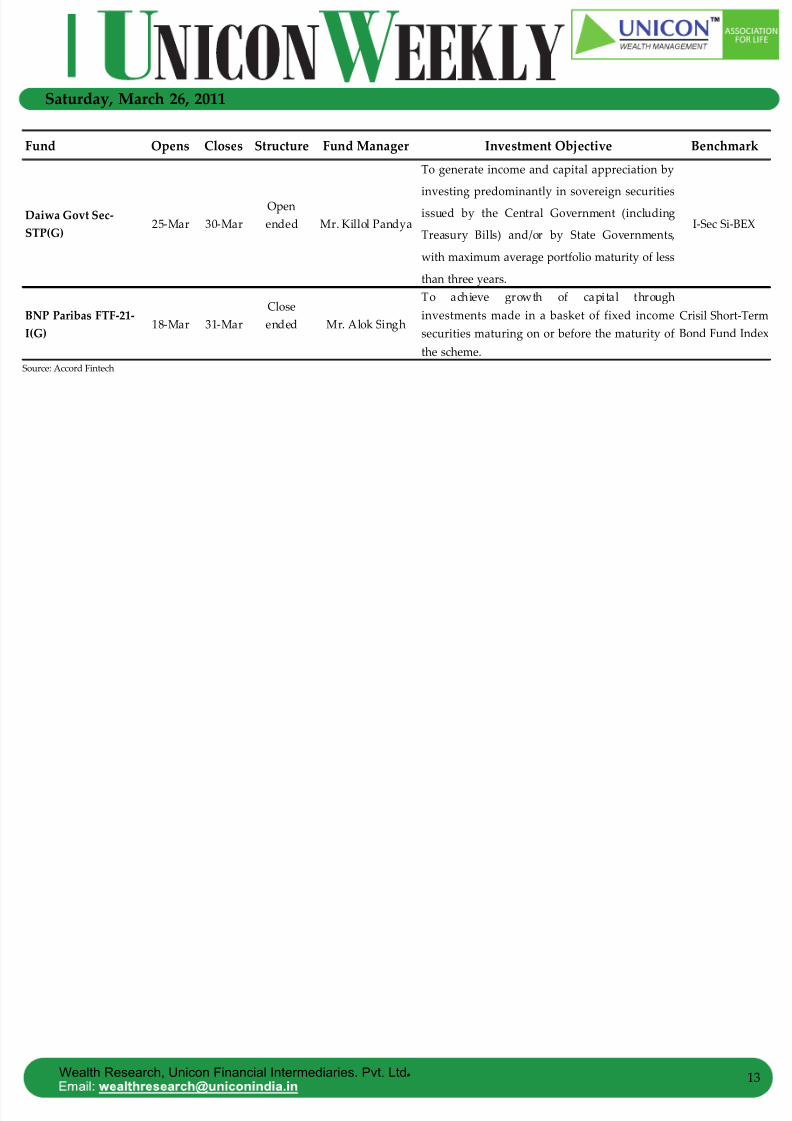
Fund Opens Closes Structure Fund Manager Investment Objective Benchmark
Daiwa Govt Sec-STP(G)
25-Mar 30-MarOpenended Mr. Killol Pandya
To generate income and capital appreciation by
investing predominantly in sovereign securitiesissued by the Central Government (including
Treasury Bills) and/or by State Governments,
with maximum average portfolio maturity of less
than three years.
I-Sec Si-BEX
BNP Paribas FTF-21-I(G)
18-Mar 31-MarCloseended Mr. Alok Singh
To achieve growth of capital throughinvestments made in a basket of fixed incomesecurities maturing on or before the maturity ofthe scheme.
Crisil Short-TermBond Fund Index
8/7/2019 110326 - Weekly
http://slidepdf.com/reader/full/110326-weekly 14/17
Wealth Research, Unicon Financial Intermediaries. Pvt. Ltd . 14.
Saturday, March 26, 2011
Source: Accord Fintech
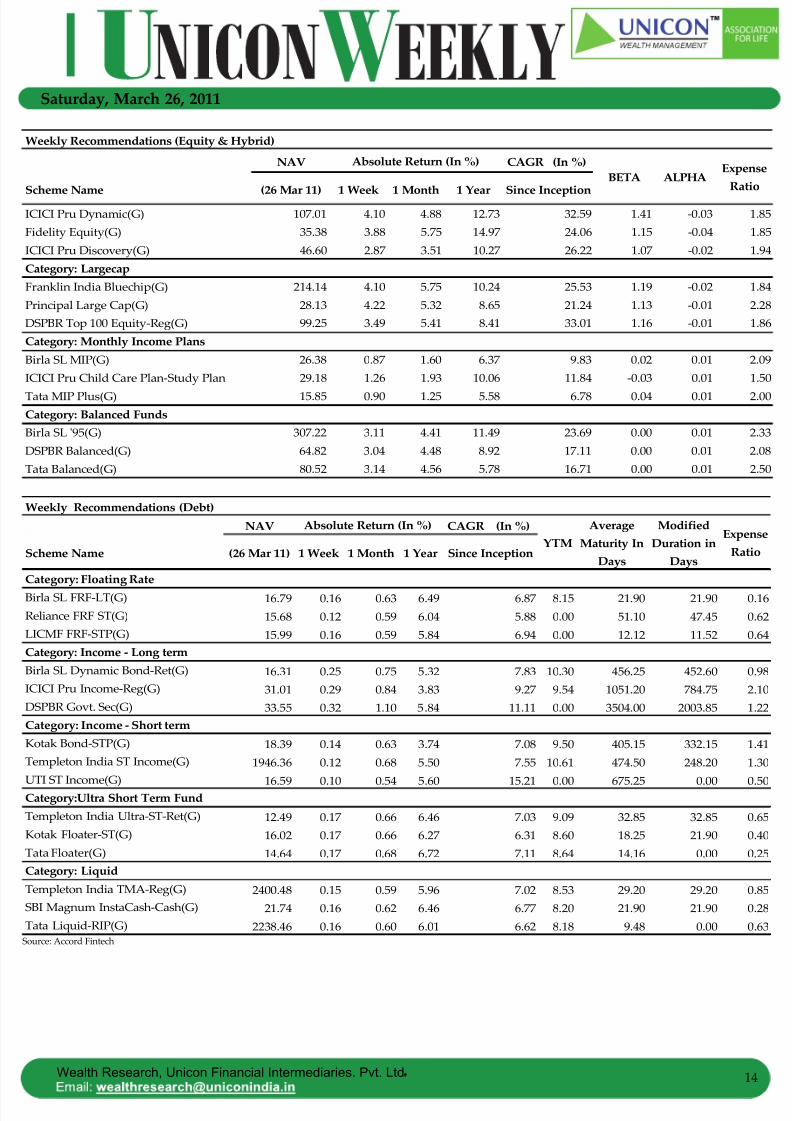
NAV CAGR (In %)
Scheme Name (26 Mar 11) 1 Week 1 Month 1 Year Since InceptionICICI Pru Dynamic(G) 107.01 4.10 4.88 12.73 32.59 1.41 -0.03 1.85Fidelity Equity(G) 35.38 3.88 5.75 14.97 24.06 1.15 -0.04 1.85ICICI Pru Discovery(G) 46.60 2.87 3.51 10.27 26.22 1.07 -0.02 1.94
Franklin India Bluechip(G) 214.14 4.10 5.75 10.24 25.53 1.19 -0.02 1.84Principal Large Cap(G) 28.13 4.22 5.32 8.65 21.24 1.13 -0.01 2.28DSPBR Top 100 Equity-Reg(G) 99.25 3.49 5.41 8.41 33.01 1.16 -0.01 1.86
Birla SL MIP(G) 26.38 0.87 1.60 6.37 9.83 0.02 0.01 2.09ICICI Pru Child Care Plan-Study Plan 29.18 1.26 1.93 10.06 11.84 -0.03 0.01 1.50
Tata MIP Plus(G) 15.85 0.90 1.25 5.58 6.78 0.04 0.01 2.00
Birla SL '95(G) 307.22 3.11 4.41 11.49 23.69 0.00 0.01 2.33DSPBR Balanced(G) 64.82 3.04 4.48 8.92 17.11 0.00 0.01 2.08Tata Balanced(G) 80.52 3.14 4.56 5.78 16.71 0.00 0.01 2.50
Category: Largecap
Category: Monthly Income Plans
Weekly Recommendations (Equity & Hybrid)
Absolute Return (In %)BETA ALPHA
ExpenseRatio
Category: Balanced Funds
Weekly Recommendations (Debt)
NAV CAGR (In %)
Scheme Name (26 Mar 11) 1 Week 1 Month 1 Year Since Inception
Category: Floating RateBirla SL FRF-LT(G) 16.79 0.16 0.63 6.49 6.87 8.15 21.90 21.90 0.16Reliance FRF ST(G) 15.68 0.12 0.59 6.04 5.88 0.00 51.10 47.45 0.62LICMF FRF-STP(G) 15.99 0.16 0.59 5.84 6.94 0.00 12.12 11.52 0.64Category: Income - Long termBirla SL Dynamic Bond-Ret(G) 16.31 0.25 0.75 5.32 7.83 10.30 456.25 452.60 0.98ICICI Pru Income-Reg(G) 31.01 0.29 0.84 3.83 9.27 9.54 1051.20 784.75 2.10DSPBR Govt. Sec(G) 33.55 0.32 1.10 5.84 11.11 0.00 3504.00 2003.85 1.22Category: Income - Short termKotak Bond-STP(G) 18.39 0.14 0.63 3.74 7.08 9.50 405.15 332.15 1.41Templeton India ST Income(G) 1946.36 0.12 0.68 5.50 7.55 10.61 474.50 248.20 1.30
UTI ST Income(G) 16.59 0.10 0.54 5.60 15.21 0.00 675.25 0.00 0.50Category:Ultra Short Term FundTempleton India Ultra-ST-Ret(G) 12.49 0.17 0.66 6.46 7.03 9.09 32.85 32.85 0.65Kotak Floater-ST(G) 16.02 0.17 0.66 6.27 6.31 8.60 18.25 21.90 0.40Tata Floater(G) 14.64 0.17 0.68 6.72 7.11 8.64 14.16 0.00 0.25Category: Liquid
Templeton India TMA-Reg(G) 2400.48 0.15 0.59 5.96 7.02 8.53 29.20 29.20 0.85SBI Magnum InstaCash-Cash(G) 21.74 0.16 0.62 6.46 6.77 8.20 21.90 21.90 0.28Tata Liquid-RIP(G) 2238.46 0.16 0.60 6.01 6.62 8.18 9.48 0.00 0.63
YTMAverage
Maturity InDays
ModifiedDuration in
Days
Absolute Return (In %)Expense
Ratio
8/7/2019 110326 - Weekly
http://slidepdf.com/reader/full/110326-weekly 15/17
.
Saturday, March 26, 2011
Wealth Research, Unicon Financial Intermediaries. Pvt. Ltd . 15.
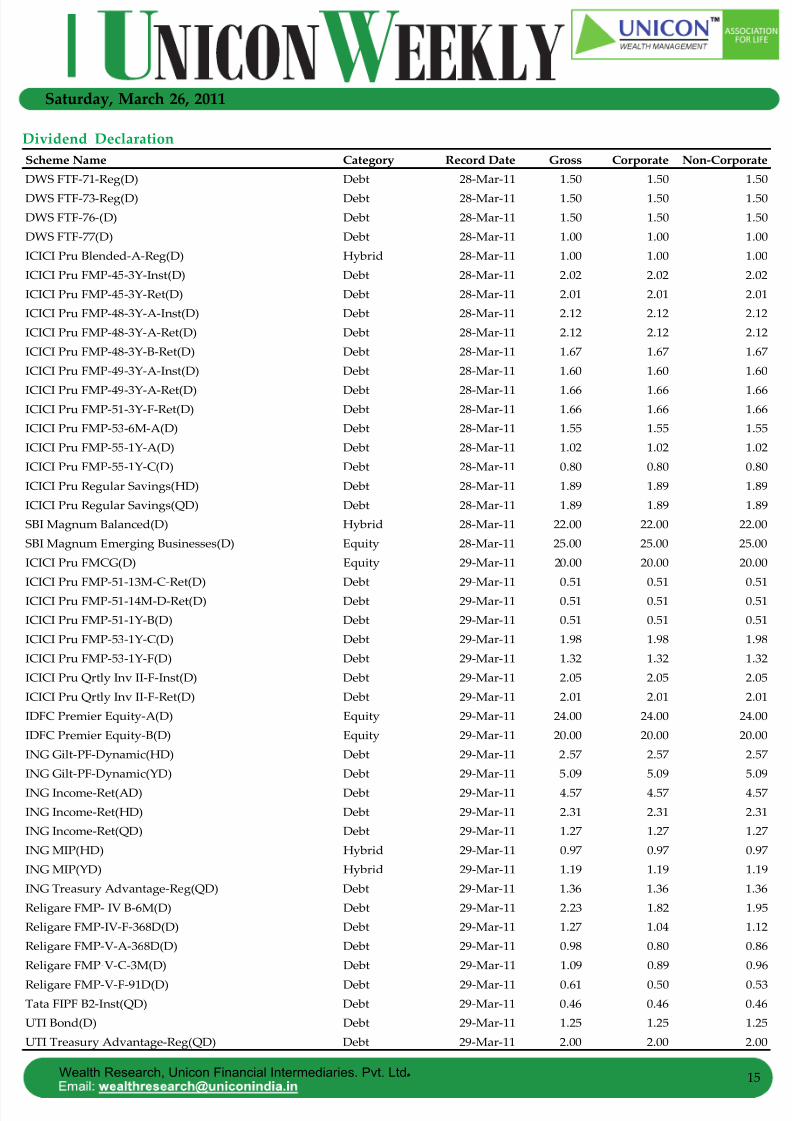
Dividend DeclarationScheme Name Category Record Date Gross Corporate Non-Corporate
DWS FTF-71-Reg(D) Debt 28-Mar-11 1.50 1.50 1.50
DWS FTF-73-Reg(D) Debt 28-Mar-11 1.50 1.50 1.50DWS FTF-76-(D) Debt 28-Mar-11 1.50 1.50 1.50
DWS FTF-77(D) Debt 28-Mar-11 1.00 1.00 1.00
ICICI Pru Blended-A-Reg(D) Hybrid 28-Mar-11 1.00 1.00 1.00
ICICI Pru FMP-45-3Y-Inst(D) Debt 28-Mar-11 2.02 2.02 2.02
ICICI Pru FMP-45-3Y-Ret(D) Debt 28-Mar-11 2.01 2.01 2.01
ICICI Pru FMP-48-3Y-A-Inst(D) Debt 28-Mar-11 2.12 2.12 2.12
ICICI Pru FMP-48-3Y-A-Ret(D) Debt 28-Mar-11 2.12 2.12 2.12
ICICI Pru FMP-48-3Y-B-Ret(D) Debt 28-Mar-11 1.67 1.67 1.67
ICICI Pru FMP-49-3Y-A-Inst(D) Debt 28-Mar-11 1.60 1.60 1.60
ICICI Pru FMP-49-3Y-A-Ret(D) Debt 28-Mar-11 1.66 1.66 1.66ICICI Pru FMP-51-3Y-F-Ret(D) Debt 28-Mar-11 1.66 1.66 1.66
ICICI Pru FMP-53-6M-A(D) Debt 28-Mar-11 1.55 1.55 1.55
ICICI Pru FMP-55-1Y-A(D) Debt 28-Mar-11 1.02 1.02 1.02
ICICI Pru FMP-55-1Y-C(D) Debt 28-Mar-11 0.80 0.80 0.80
ICICI Pru Regular Savings(HD) Debt 28-Mar-11 1.89 1.89 1.89
ICICI Pru Regular Savings(QD) Debt 28-Mar-11 1.89 1.89 1.89
SBI Magnum Balanced(D) Hybrid 28-Mar-11 22.00 22.00 22.00
SBI Magnum Emerging Businesses(D) Equity 28-Mar-11 25.00 25.00 25.00
ICICI Pru FMCG(D) Equity 29-Mar-11 20.00 20.00 20.00
ICICI Pru FMP-51-13M-C-Ret(D) Debt 29-Mar-11 0.51 0.51 0.51
ICICI Pru FMP-51-14M-D-Ret(D) Debt 29-Mar-11 0.51 0.51 0.51
ICICI Pru FMP-51-1Y-B(D) Debt 29-Mar-11 0.51 0.51 0.51
ICICI Pru FMP-53-1Y-C(D) Debt 29-Mar-11 1.98 1.98 1.98
ICICI Pru FMP-53-1Y-F(D) Debt 29-Mar-11 1.32 1.32 1.32
ICICI Pru Qrtly Inv II-F-Inst(D) Debt 29-Mar-11 2.05 2.05 2.05
ICICI Pru Qrtly Inv II-F-Ret(D) Debt 29-Mar-11 2.01 2.01 2.01
IDFC Premier Equity-A(D) Equity 29-Mar-11 24.00 24.00 24.00
IDFC Premier Equity-B(D) Equity 29-Mar-11 20.00 20.00 20.00
ING Gilt-PF-Dynamic(HD) Debt 29-Mar-11 2.57 2.57 2.57
ING Gilt-PF-Dynamic(YD) Debt 29-Mar-11 5.09 5.09 5.09
ING Income-Ret(AD) Debt 29-Mar-11 4.57 4.57 4.57
ING Income-Ret(HD) Debt 29-Mar-11 2.31 2.31 2.31
ING Income-Ret(QD) Debt 29-Mar-11 1.27 1.27 1.27
ING MIP(HD) Hybrid 29-Mar-11 0.97 0.97 0.97
ING MIP(YD) Hybrid 29-Mar-11 1.19 1.19 1.19
ING Treasury Advantage-Reg(QD) Debt 29-Mar-11 1.36 1.36 1.36
Religare FMP- IV B-6M(D) Debt 29-Mar-11 2.23 1.82 1.95
Religare FMP-IV-F-368D(D) Debt 29-Mar-11 1.27 1.04 1.12
Religare FMP-V-A-368D(D) Debt 29-Mar-11 0.98 0.80 0.86
Religare FMP-V-C-3M(D) Debt 29-Mar-11 1.09 0.89 0.96
Religare FMP-V-F-91D(D) Debt 29-Mar-11 0.61 0.50 0.53Tata FIPF B2-Inst(QD) Debt 29-Mar-11 0.46 0.46 0.46
UTI Bond(D) Debt 29-Mar-11 1.25 1.25 1.25
UTI Treasury Advantage-Reg(QD) Debt 29-Mar-11 2.00 2.00 2.00
8/7/2019 110326 - Weekly
http://slidepdf.com/reader/full/110326-weekly 16/17
Wealth Research, Unicon Financial Intermediaries. Pvt. Ltd . 16.
Saturday, March 26, 2011
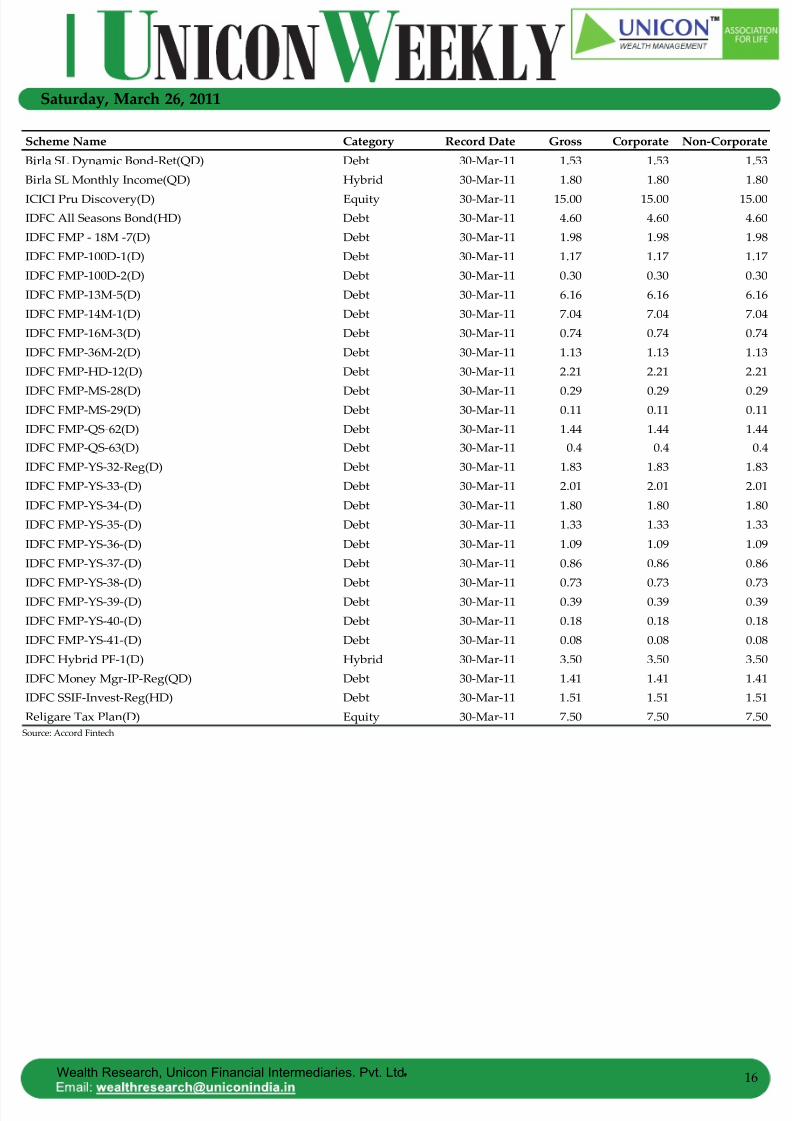
Source: Accord Fintech
Scheme Name Category Record Date Gross Corporate Non-Corporate
Birla SL Dynamic Bond-Ret(QD) Debt 30-Mar-11 1.53 1.53 1.53
Birla SL Monthly Income(QD) Hybrid 30-Mar-11 1.80 1.80 1.80
ICICI Pru Discovery(D) Equity 30-Mar-11 15.00 15.00 15.00IDFC All Seasons Bond(HD) Debt 30-Mar-11 4.60 4.60 4.60
IDFC FMP - 18M -7(D) Debt 30-Mar-11 1.98 1.98 1.98
IDFC FMP-100D-1(D) Debt 30-Mar-11 1.17 1.17 1.17
IDFC FMP-100D-2(D) Debt 30-Mar-11 0.30 0.30 0.30
IDFC FMP-13M-5(D) Debt 30-Mar-11 6.16 6.16 6.16
IDFC FMP-14M-1(D) Debt 30-Mar-11 7.04 7.04 7.04
IDFC FMP-16M-3(D) Debt 30-Mar-11 0.74 0.74 0.74
IDFC FMP-36M-2(D) Debt 30-Mar-11 1.13 1.13 1.13
IDFC FMP-HD-12(D) Debt 30-Mar-11 2.21 2.21 2.21
IDFC FMP-MS-28(D) Debt 30-Mar-11 0.29 0.29 0.29IDFC FMP-MS-29(D) Debt 30-Mar-11 0.11 0.11 0.11
IDFC FMP-QS-62(D) Debt 30-Mar-11 1.44 1.44 1.44IDFC FMP-QS-63(D) Debt 30-Mar-11 0.4 0.4 0.4
IDFC FMP-YS-32-Reg(D) Debt 30-Mar-11 1.83 1.83 1.83
IDFC FMP-YS-33-(D) Debt 30-Mar-11 2.01 2.01 2.01
IDFC FMP-YS-34-(D) Debt 30-Mar-11 1.80 1.80 1.80
IDFC FMP-YS-35-(D) Debt 30-Mar-11 1.33 1.33 1.33
IDFC FMP-YS-36-(D) Debt 30-Mar-11 1.09 1.09 1.09
IDFC FMP-YS-37-(D) Debt 30-Mar-11 0.86 0.86 0.86
IDFC FMP-YS-38-(D) Debt 30-Mar-11 0.73 0.73 0.73IDFC FMP-YS-39-(D) Debt 30-Mar-11 0.39 0.39 0.39
IDFC FMP-YS-40-(D) Debt 30-Mar-11 0.18 0.18 0.18
IDFC FMP-YS-41-(D) Debt 30-Mar-11 0.08 0.08 0.08
IDFC Hybrid PF-1(D) Hybrid 30-Mar-11 3.50 3.50 3.50
IDFC Money Mgr-IP-Reg(QD) Debt 30-Mar-11 1.41 1.41 1.41
IDFC SSIF-Invest-Reg(HD) Debt 30-Mar-11 1.51 1.51 1.51
Religare Tax Plan(D) Equity 30-Mar-11 7.50 7.50 7.50

8/7/2019 110326 - Weekly
http://slidepdf.com/reader/full/110326-weekly 17/17
Saturday, March 26, 2011
Disclaimer
This document has been issued by Unicon Financial Intermediaries Pvt Ltd. (“UNICON”) for the information of its customers only. UNICON is governedby the Securities and Exchange Board of India. This document is not for public distribution and has been furnished to you solely for your information andmust not be reproduced or redistributed to any other person. Persons into whose possession this document may come are required to observe theseestrictions. The information and opinions contained herein have been compiled or arrived at based upon information obtained in good faith from publicources believed to be reliable. Such information has not been independently verified and no guarantee, representation or warranty, express or implied is
made as to its accuracy, completeness or correctness. All such information and opinions are subject to change without notice. This document has beenproduced independently of any company or companies mentioned herein, and forward looking statements; opinions and expectations contained hereinare subject to change without notice. This document is for information purposes only and is provided on an “as is” basis. Descriptions of any companyor companies or their securities mentioned herein are not intended to be complete and this document is not, and should not be construed as an offer, orolicitation of an offer, to buy or sell or subscribe to any securities or other financial instruments. We are not soliciting any action based on this document.
UNICON, its associate and group companies its directors or employees do not take any responsibility, financial or otherwise, of the losses or the damagesustained due to the investments made or any action taken on basis of this document, including but not restricted to, fluctuation in the prices of the shares
and bonds, reduction in the dividend or income, etc. This document is not directed to or intended for display, downloading, printing, reproducing or fordistribution to or use by any person or entity who is a citizen or resident or located in any locality, state, country or other jurisdiction where suchdistribution, publication, reproduction, availability or use would be contrary to law or regulation or would subject UNICON or its associates or groupcompanies to any registration or licensing requirement within such jurisdiction. If this document is inadvertently sent or has reached any individual in suchcountry, the same may be ignored and brought to the attention of the sender. This document may not be reproduced, distributed or published for anypurpose without prior written approval of UNICON. This document is for the general information and does not take into account the particular investmentobjectives, financial situation or needs of any individual customer, and it does not constitute a personalized recommendation of any particular security ornvestment strategy. Before acting on any advice or recommendation in this document, a customer should consider whether it is suitable given the
customer’s particular circumstances and, if necessary, seek professional advice. Certain transactions, including those involving futures, options, and highyield securities, give rise to substantial risk and are not suitable for all investors. UNICON, its associates or group companies do not represent or endorsehe accuracy or reliability of any of the information or content of the document and reliance upon it is at your own risk.
UNICON, its associates or group companies, expressly disclaims any and all warranties, express or implied, including without limitation warranties ofmerchantability and fitness for a particular purpose with respect to the document and any information in it. UNICON, its associates or group companies,hall not be liable for any direct, indirect, incidental, punitive or consequential damages of any kind with respect to the document. No part of this
publication may be reproduced, stored in a retrieval system, or transmitted, on any form or by any means, electronic, mechanical, photocopying,ecording, or otherwise, without the prior written permission of Unicon Financial Intermediaries Pvt Ltd.
Address:Wealth ManagementUnicon Financial Intermediaries Pvt. Ltd.Ground Floor, Jhawar House,285, Princess Street, Mumbai-400002Ph: 022-43591200 / 100Email: [email protected] us at www.uniconindia.in
Recommended