1111
Clovis Palmer1,2, Anthony Jaworowski1, Joseph McCune3, Suzanne Crowe1
1Centre for Virology, Burnet Institute, Melbourne, Australia
2 University of New South wales, Sydney, Australia
3 Dpt. Medicine, University of California, San Francisco, USA
Glut1: establishing a new paradigm for HIV-1 infection by regulating glucose metabolism
and activation in CD4+ T cells in HIV-1-positive subjects
No stimulation
CD3
CD3 + 5ug/ml CD28
CD3 + 1ug/ml CD28
CD3 + 1ug/ml CD28
CD3 + 5ug/ml CD28
GLUT1
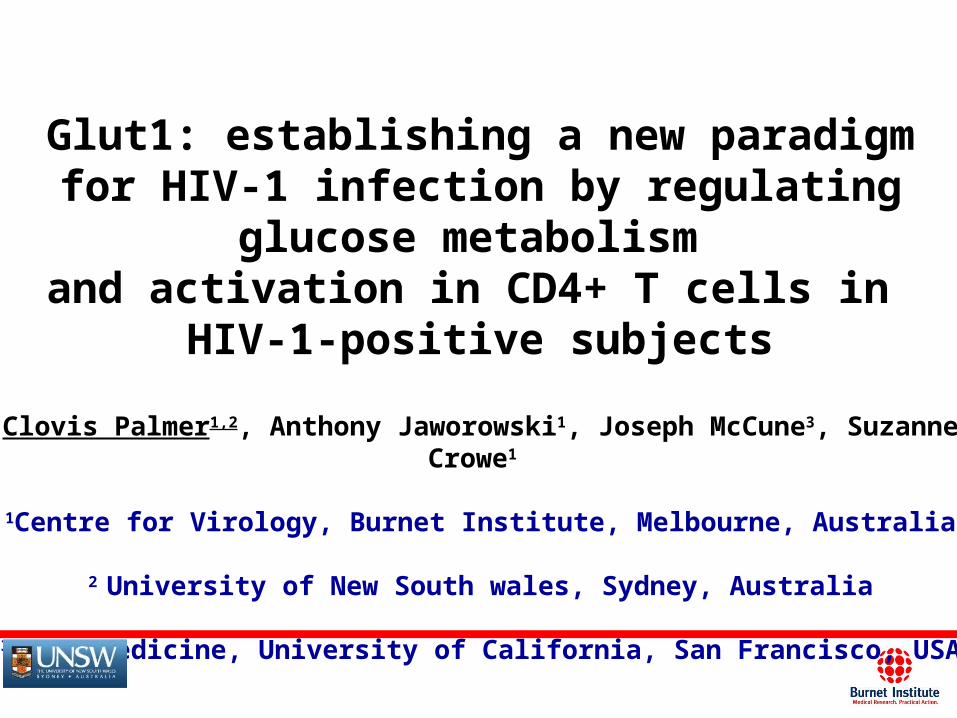
Glucose Transporter-1 (Glut1) belongs to a family of glucose transporters
Fu et al, 2004; Barata et al, 2004; Maratou et al, 2007
Glut1 and is the main glucose transporter on T cells and is regulated by
immunological signals
Glucose
Hx
G-6-P
Intracellular retention of glucose is facilitated by hexokinase (Hx) activity
Glycolysis (Lactate + 2 ATP)
Glucose is metabolized via glycolysis or oxidative phosphorylation depending on
the T cell activation status Powel and Delgoffe, 2010; Finlay and Cantrell, 2011
Oxidative Phos. (36 ATP)
Glucose metabolism in T cells
T cell
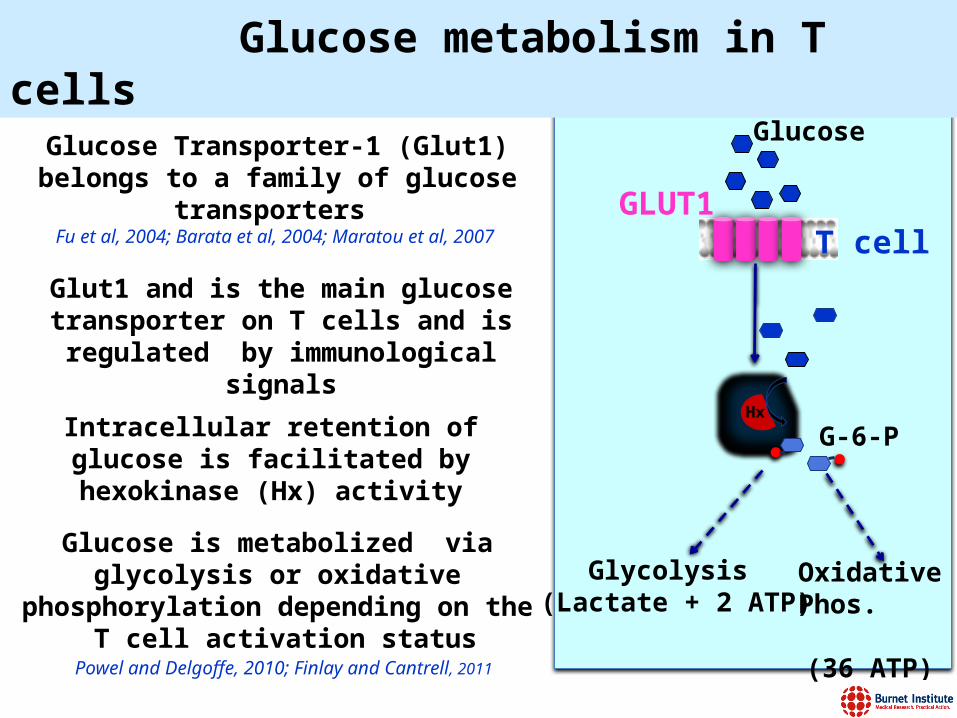
Oxidative phosphorylation
36 ATPs
Protein
DNA
Cell membrane
Cell growth
Proliferation
Antiviral response
Migration Viral replication
Resting T cell
Aerobic Glycolysis
2 ATPs
Amino Acids
Nucleotides
Lipids
Activated T cell
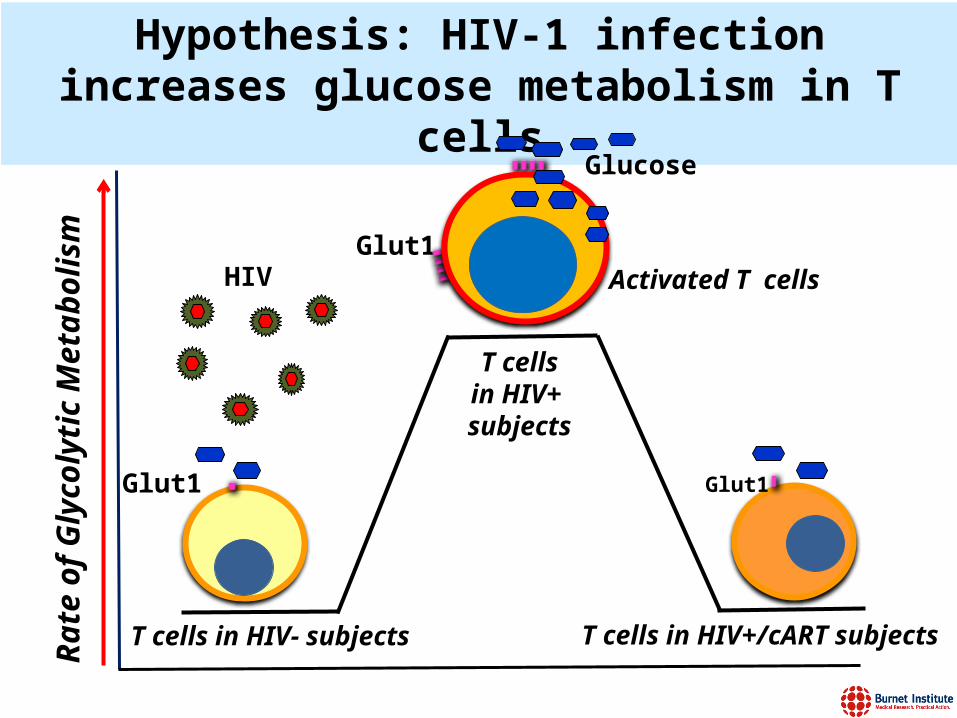
Hypothesis: HIV-1 infection increases glucose metabolism in T cells
Glut1
T cells in HIV- subjects
Rat
e o
f G
lyco
lyti
c M
etab
oli
sm
HIV
T cells in HIV+/cART subjects
Glut1
Glut1
T cellsin HIV+ subjects
Activated T cells
Glucose
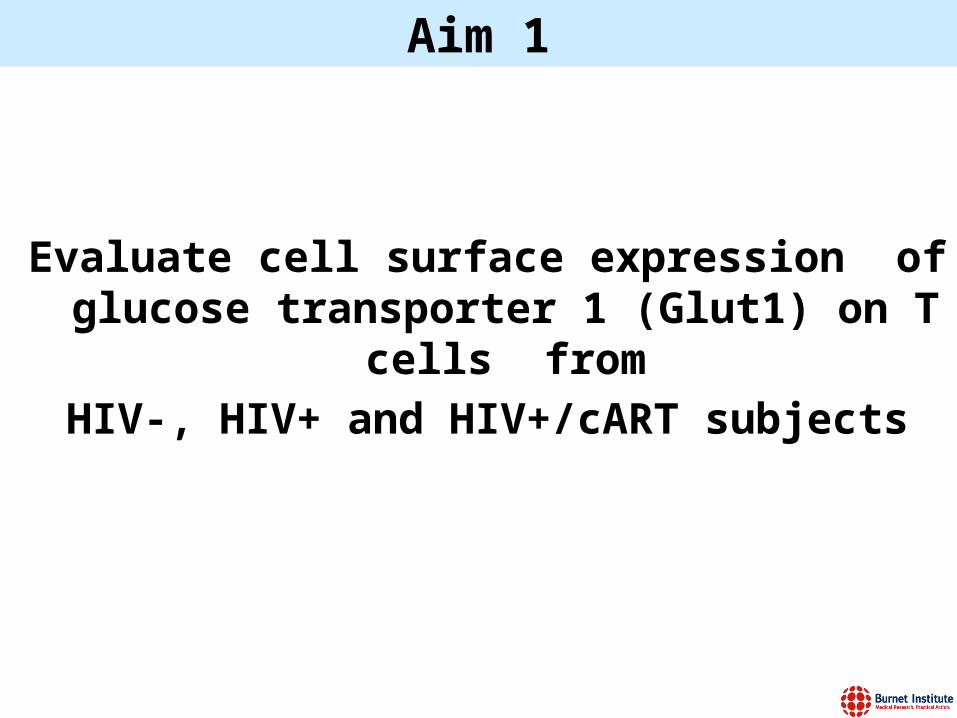
Evaluate cell surface expression of glucose transporter 1 (Glut1) on T cells from
HIV-, HIV+ and HIV+/cART subjects
Aim 1
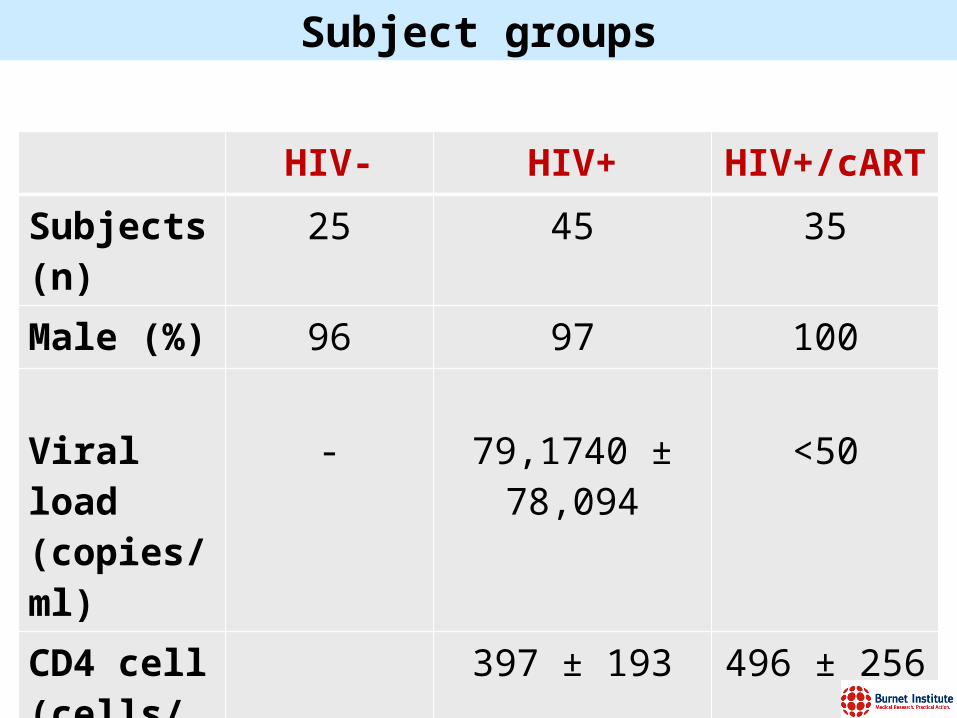
HIV- HIV+ HIV+/cART
Subjects (n) 25 45 35
Male (%) 96 97 100
Viral load(copies/ml)
- 79,1740 ± 78,094
<50
CD4 cell(cells/ul)
397 ± 193 496 ± 256
Subject groups
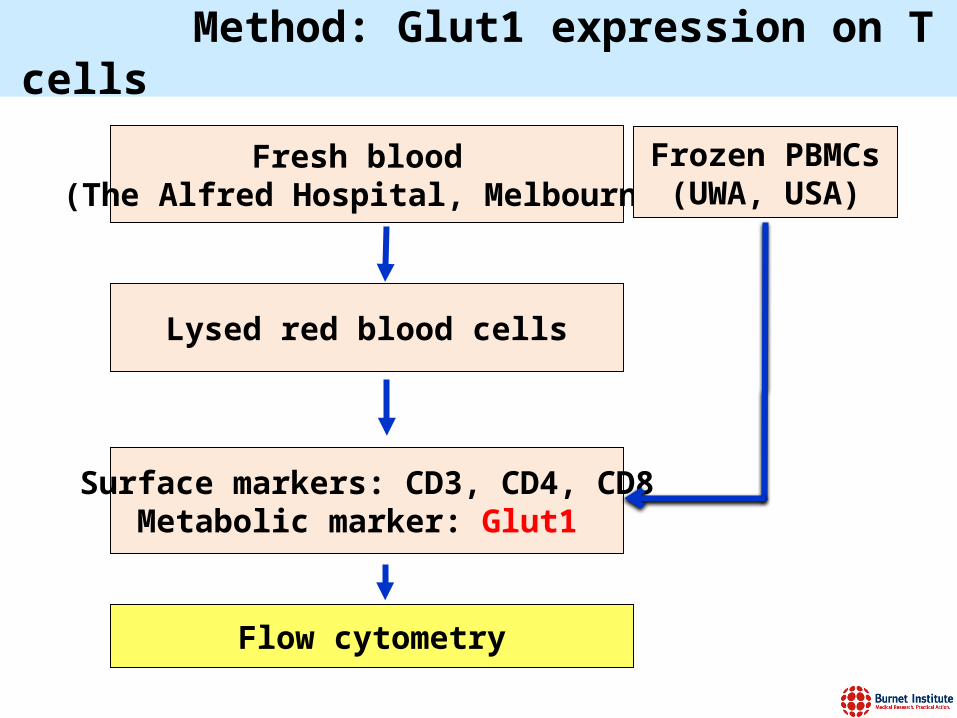
Fresh blood (The Alfred Hospital, Melbourne)
Lysed red blood cells
Method: Glut1 expression on T cells
Frozen PBMCs(UWA, USA)
Surface markers: CD3, CD4, CD8Metabolic marker: Glut1
Flow cytometry
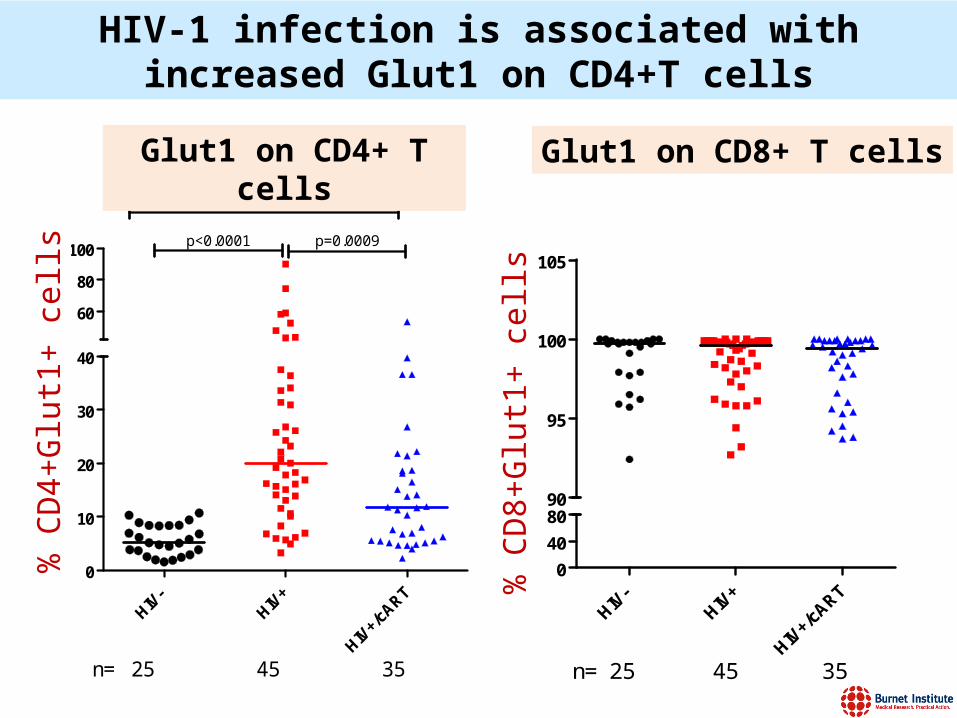
HIV-1 infection is associated with increased Glut1 on CD4+T cells
% C
D4+
Glu
t1+
T c
ells
0
10
20
30
40
60
80
100 p<0.0001 p=0.0009
p=0.0001
n= 25 45 35
Glut1 on CD4+ T cells
% C
D4+
Glu
t1+
cel
ls
%C
D8+
Glu
t1+
T c
ells
0
40
8090
95
100
105
n= 25 45 35
Glut1 on CD8+ T cells
% C
D8+
Glu
t1+
cel
ls
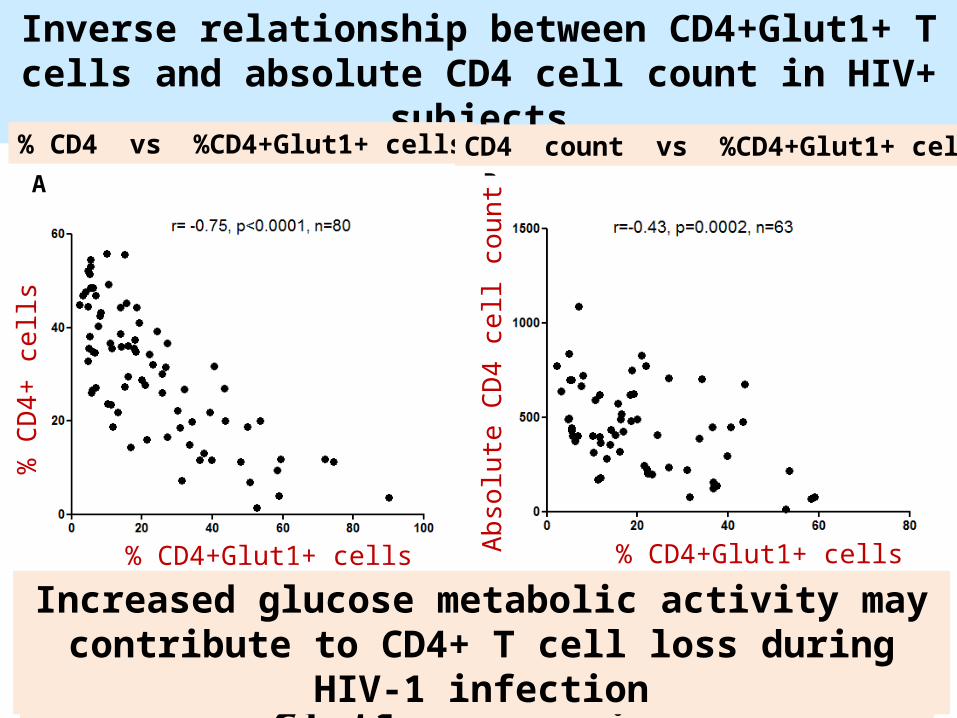
Inverse relationship between CD4+Glut1+ T cells and absolute CD4 cell count in HIV+ subjects
BA
% CD4 vs %CD4+Glut1+ cells CD4 count vs %CD4+Glut1+ cells
% CD4+Glut1+ cells
Ab
solu
te C
D4
ce
ll co
unt
% CD4+Glut1+ cells
% C
D4+
cel
ls
Annexin V+ (apoptosis) and 7AAD+ (cell death) cells have high Glut1 expression
Increased glucose metabolic activity may contribute to CD4+ T cell loss during HIV-1
infection
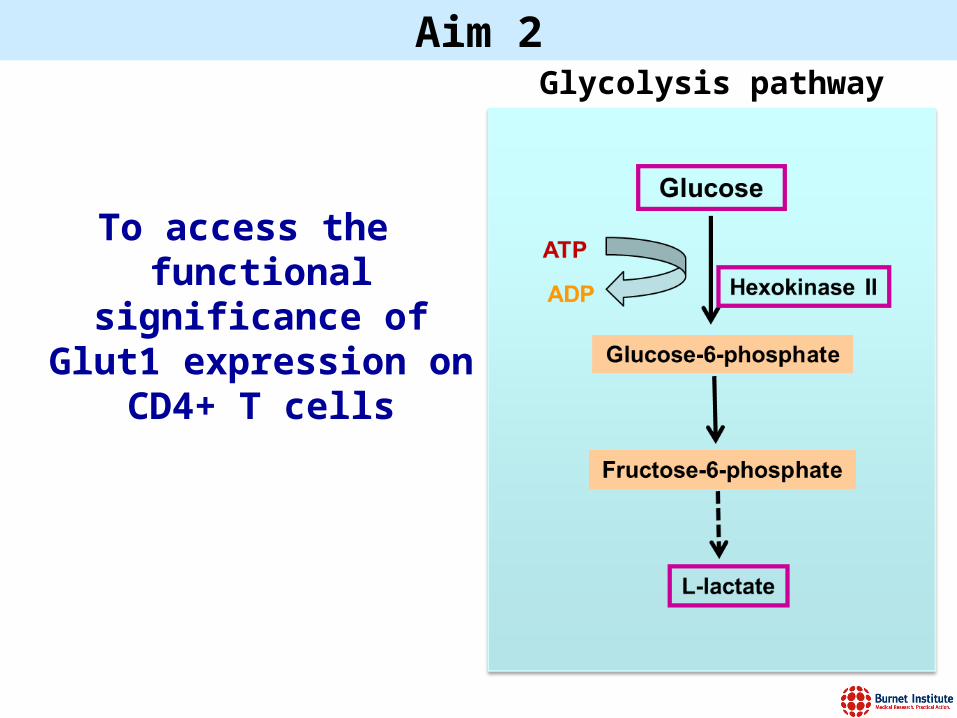
Aim 2
To access the functional significance of Glut1
expression on CD4+ T cells
Glycolysis pathway
Time (min)
MF
I of
2-N
BD
G o
n C
D4+
T c
ells
0 30 60 90 1200
20
40
60
80
100
n=4
The intracellular concentrations of glucose-6-phosphate and L-lactate are elevated in CD4+ T cells from HIV+ subjects
Palmer et al., AIDS 2012, TUAA0104
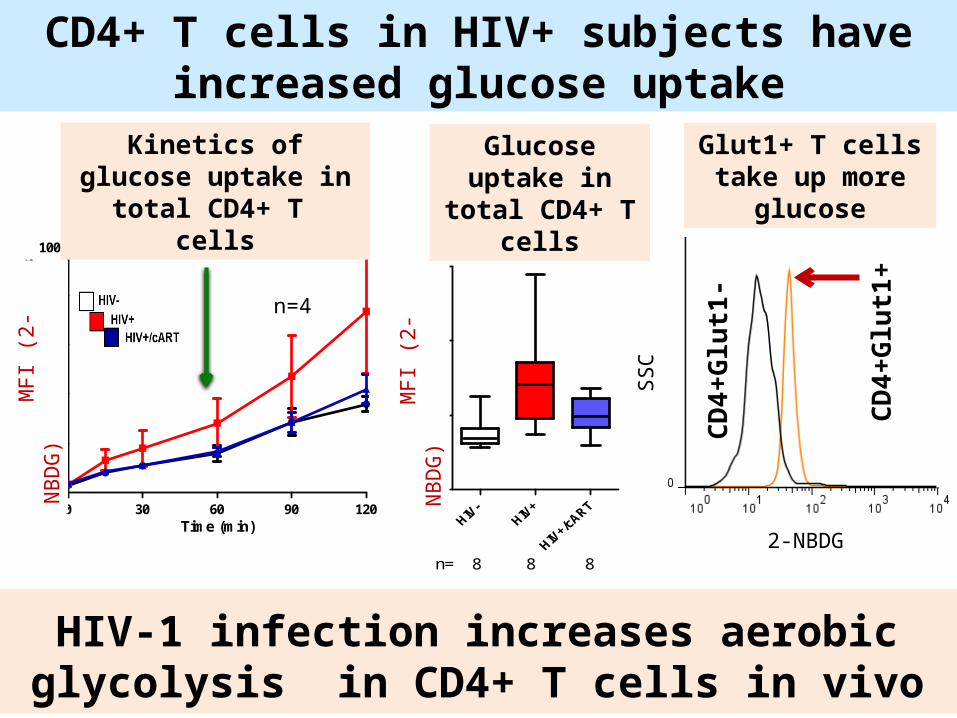
HIV-1 infection increases aerobic glycolysis in CD4+ T cells in vivo
CD4+ T cells in HIV+ subjects have increased glucose uptake
Kinetics of glucose uptake in total CD4+ T
cells
MF
I (2-
NB
DG
)
2-NBDG
SS
C
CD
4+
Glu
t1-
CD
4+
Glu
t1+
Glut1+ T cells take up more
glucose
MF
I 2-N
BD
G in
CD
4+
T c
ells
0
20
40
60
p=0.001 p= 0.04
p=0.03
n= 8 8 8
Glucose uptake in total CD4+ T
cells
MF
I (2-
NB
DG
)
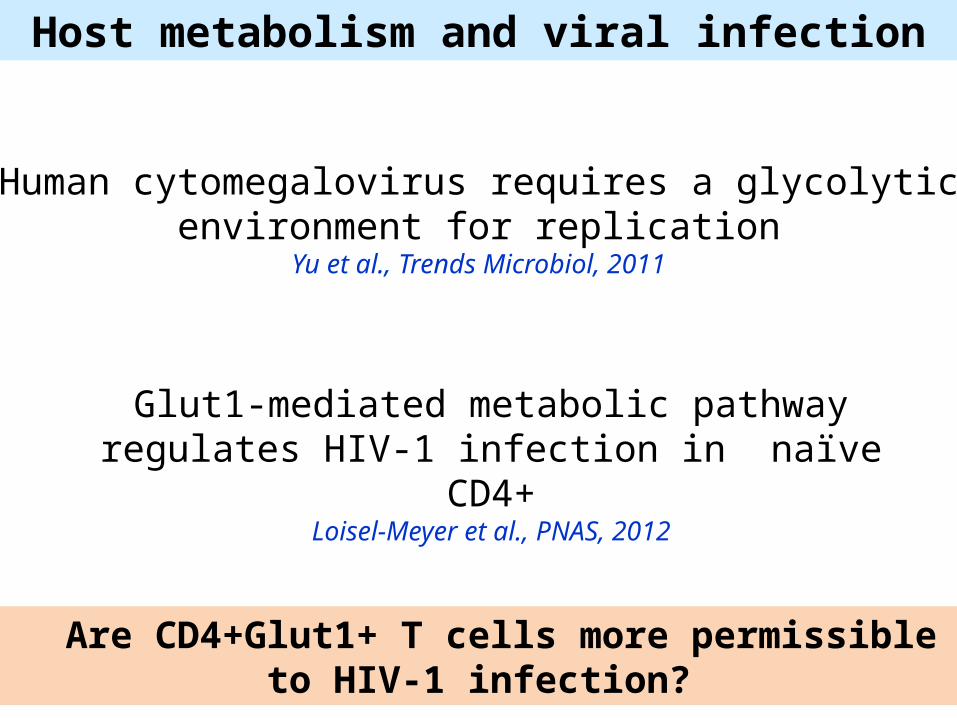
Human cytomegalovirus requires a glycolytic environment for replication
Yu et al., Trends Microbiol, 2011
Glut1-mediated metabolic pathway regulates HIV-1 infection in naïve CD4+Loisel-Meyer et al., PNAS, 2012
Host metabolism and viral infection
Are CD4+Glut1+ T cells more permissible to HIV-1 infection?
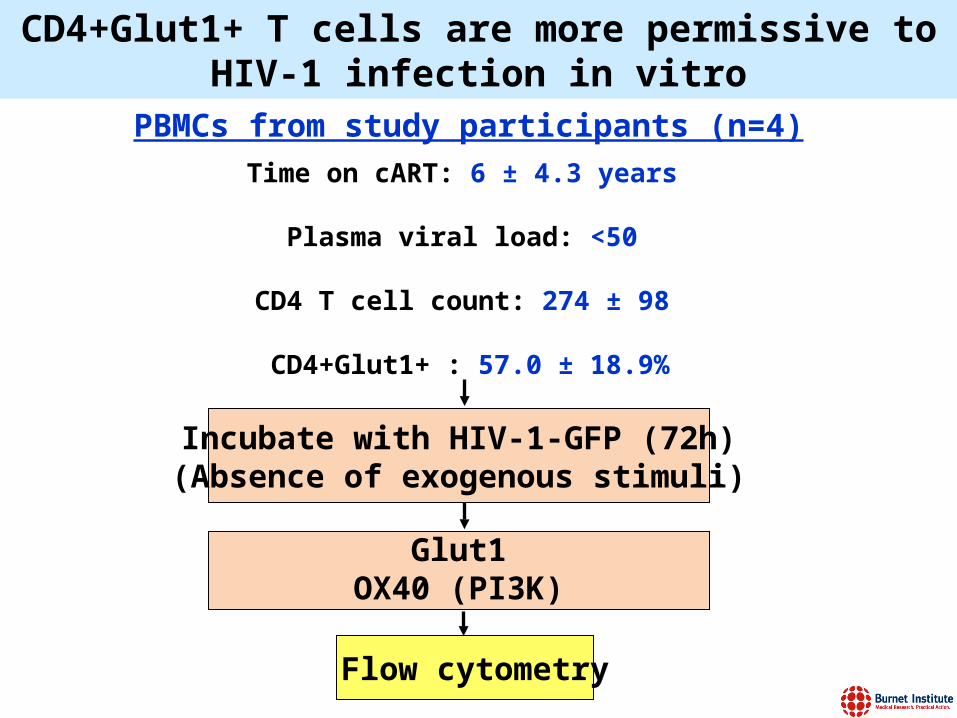
Flow cytometry
Glut1OX40 (PI3K)
PBMCs from study participants (n=4)
Time on cART: 6 ± 4.3 years
Plasma viral load: <50
CD4 T cell count: 274 ± 98
CD4+Glut1+ : 57.0 ± 18.9%
Incubate with HIV-1-GFP (72h)(Absence of exogenous stimuli)
CD4+Glut1+ T cells are more permissive to HIV-1 infection in vitro
Glut1
PI3K
Glut1
PI3K
Glut1
PI3K
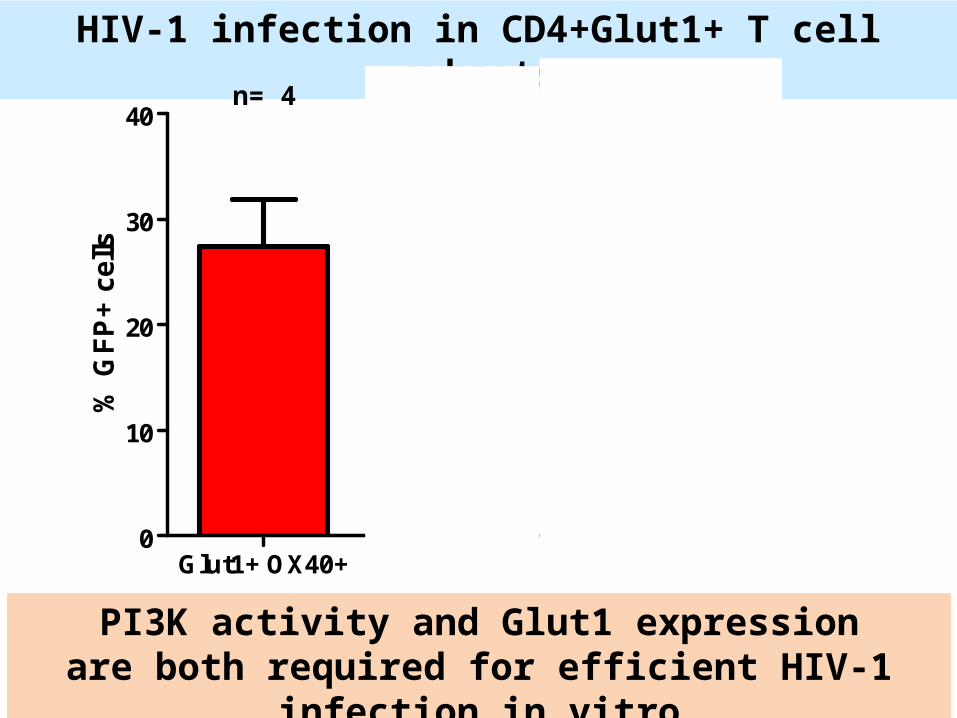
HIV-1 infection in CD4+Glut1+ T cell subsets
% G
FP
+ c
ells
Glut1+ OX40+ Glut1+ OX40- Glut1-OX40-0
10
20
30
40
PI3K activity and Glut1 expressionare both required for efficient HIV-1 infection in vitro
n= 4
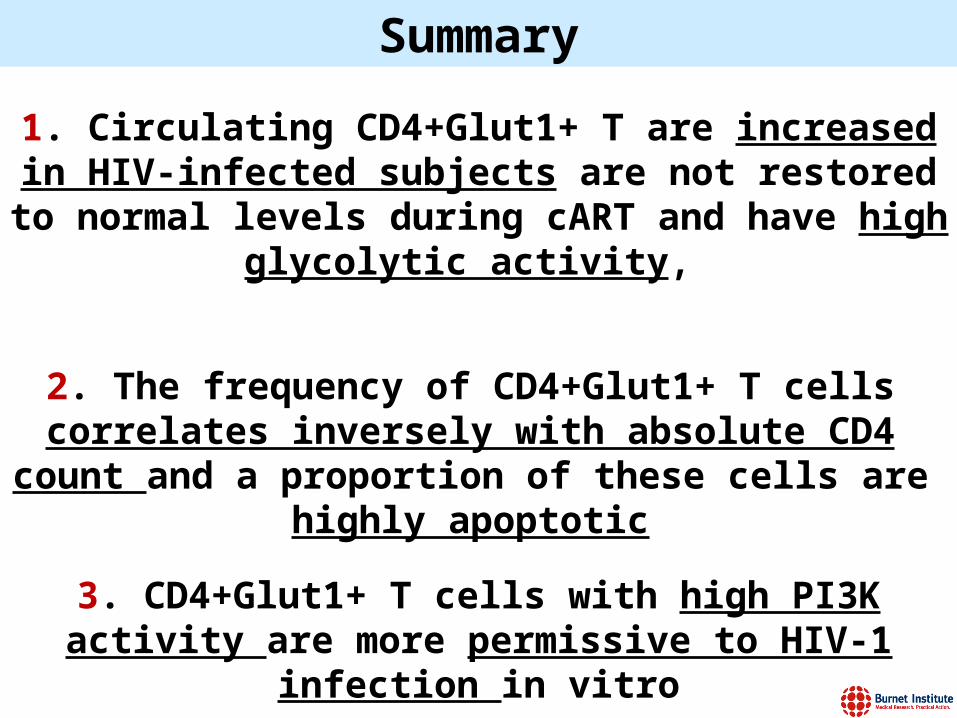
1. Circulating CD4+Glut1+ T are increased in HIV-infected subjects are not restored to normal levels
during cART and have high glycolytic activity,
2. The frequency of CD4+Glut1+ T cells correlates inversely with absolute CD4 count and a proportion
of these cells are highly apoptotic
3. CD4+Glut1+ T cells with high PI3K activity are more permissive to HIV-1 infection in vitro
Summary
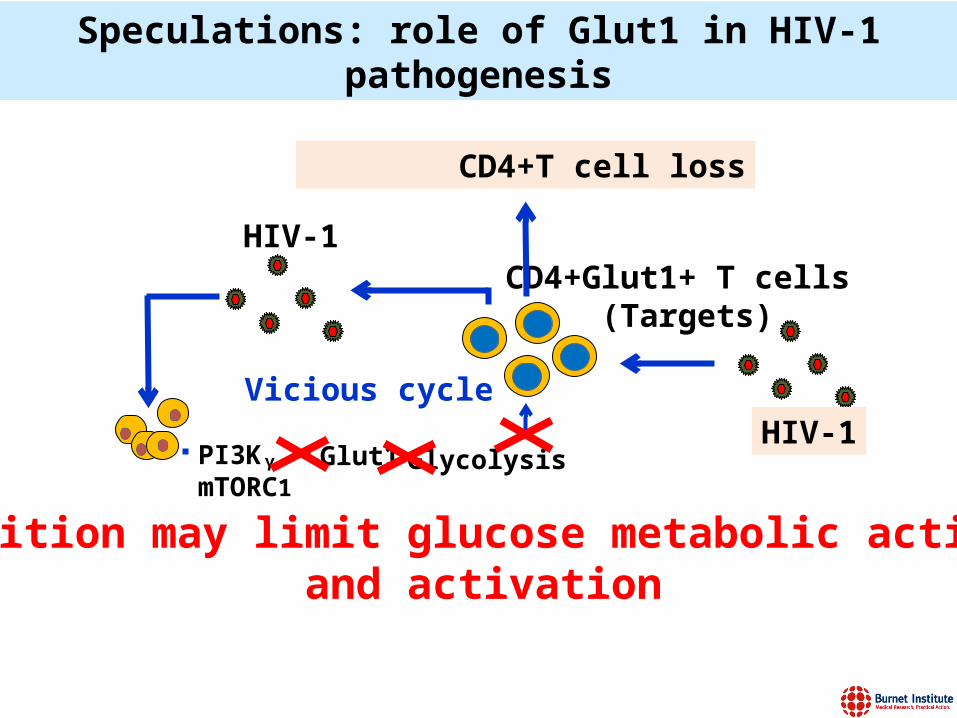
CD4+Glut1+ T cells (Targets)
HIV-1
Vicious cycle
PI3KᵧmTORC1
Glut1 Glycolysis
CD4+T cell loss
Speculations: role of Glut1 in HIV-1 pathogenesis
HIV-1
Inhibition may limit glucose metabolic activity and activation

Baker IDI, Melbourne, AustraliaDarren Henstridge
Creative and Novel Ideas in HIV Research (CNIHR) Administrative Team
Centre for Virology (Pathogenesis lab), Burnet Institute,
Melbourne, Australia Mentor: Suzanne Crowe
Anthony JaworowskiJingling Zhou
Linda LamMaelenn Gouillou
Anna HearpsAnna Maisa
Wan-Jung ChengTom Angelovich
Division of Experimental Medicine at the University of California, San Francisco (UCSF)
Mentor: Joseph Mike McCune
AcknowledgementContact: [email protected]
Centre for Virology(Virology/latency lab) Burnet Institute,
Melbourne, Australia Sharon Lewin
Suha SalehGabriela Khoury
Candida da Fonseca Pereira
Volunteers !!!!!
Center for AIDS ResearchClinical Research Core
University of Washington, USARobin Mohr
Centre for Infection and Inflammation Research, School of Medical Sciences, UNSW
Andrew Lloyd- Amany Zekry LabDavid Simar
Benny Baharuddin
Department of Chemistry, University of the West Indies, Kingston, Jamaica
Willem Mulder
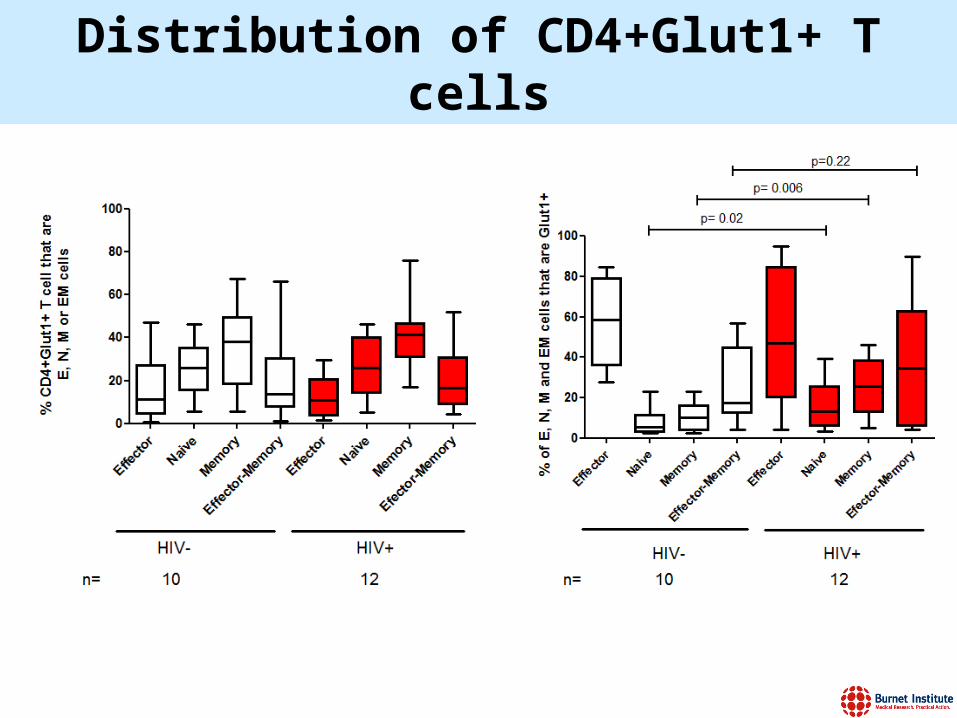
Distribution of CD4+Glut1+ T cells
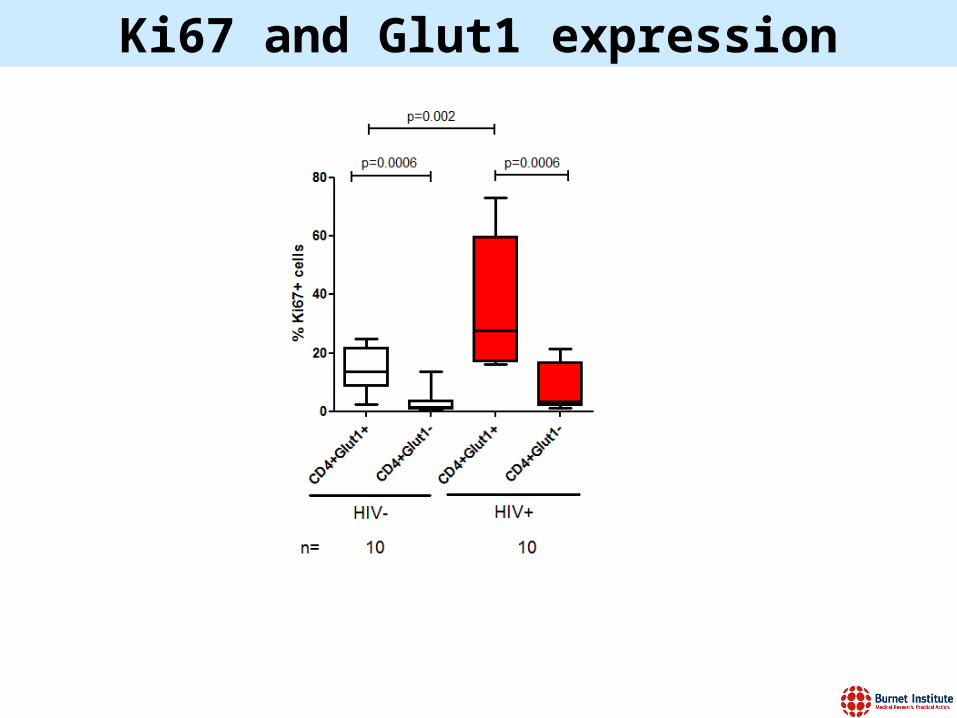
Ki67 and Glut1 expression
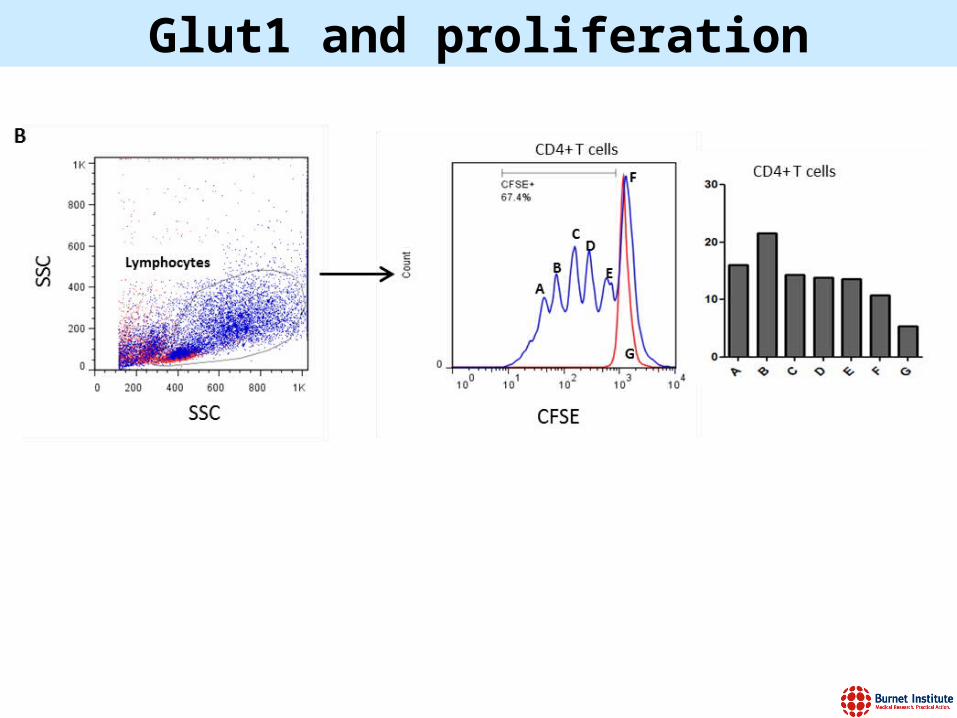
Glut1 and proliferation
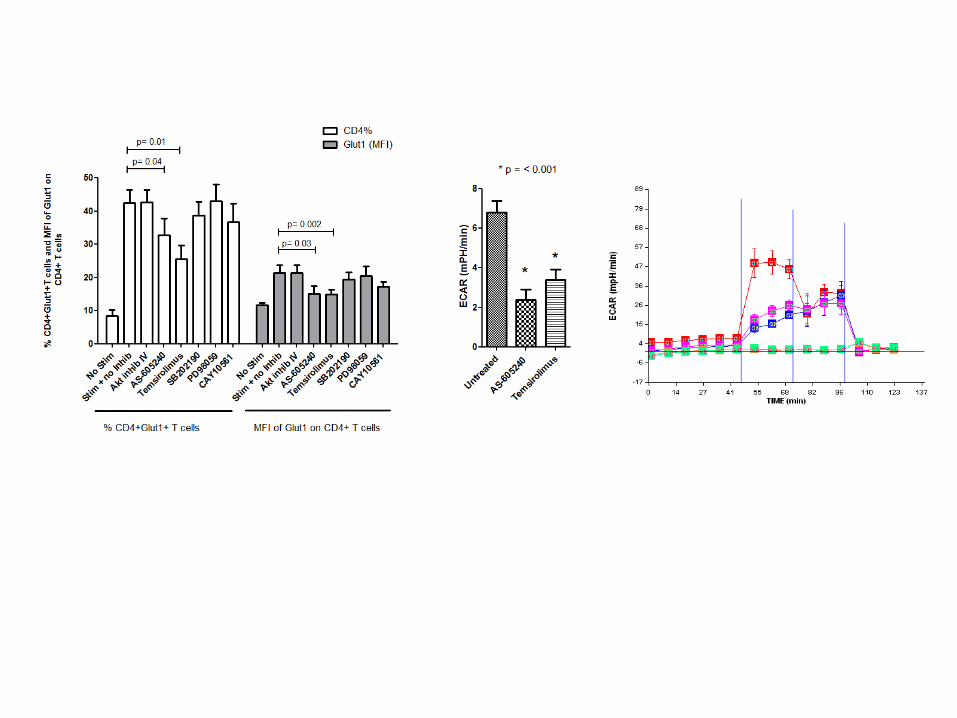
Figure S4
A B
Glucose Oligomycin
2-Deoxyglucose
C
22222222
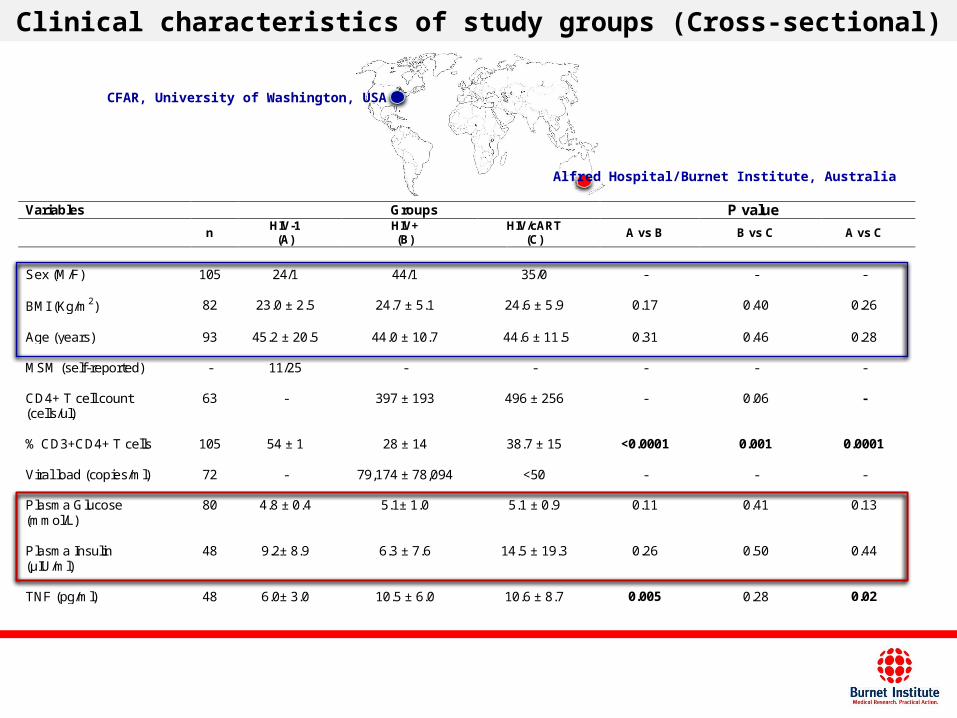
Clinical characteristics of study groups (Cross-sectional)
Variables Groups P value
n HIV-1
(A) HIV+ (B)
HIV/cART (C)
A vs B B vs C A vs C
Sex (M/F)
105 24/1 44/1 35/0 - - -
BMI (Kg/m2) 82 23.0 ± 2.5 24.7 ± 5.1 24.6 ± 5.9 0.17 0.40 0.26 Age (years)
93
45.2 ± 20.5
44.0 ± 10.7
44.6 ± 11.5
0.31
0.46
0.28
MSM (self-reported)
-
11/25
-
-
-
-
-
CD4+ T cell count (cells/ul)
63
-
397 ± 193
496 ± 256
-
0.06
-
% CD3+CD4+ T cells
105
54 ± 1
28 ± 14
38.7 ± 15
<0.0001
0.001
0.0001
Viral load (copies/ml)
72
-
79,174 ± 78,094
<50
-
-
-
Plasma Glucose (mmol/L)
80
4.8 ± 0.4
5.1± 1.0
5.1 ± 0.9
0.11
0.41
0.13
Plasma Insulin (μIU/ml)
48
9.2± 8.9
6.3 ± 7.6
14.5 ± 19.3
0.26
0.50
0.44
TNF (pg/ml)
48
6.0± 3.0
10.5 ± 6.0
10.6 ± 8.7
0.005
0.28
0.02
Alfred Hospital/Burnet Institute, Australia
CFAR, University of Washington, USA
Recommended